Forex analysis review
Forex analysis review |
- Forecast for AUD/USD on October 1, 2021
- Forecast for USD/JPY on October 1, 2021
- Forecast and trading signals for GBP/USD for October 1. Detailed analysis of the movement of the pair and trade deals. Pound
- Forecast and trading signals for EUR/USD on October 1. Detailed analysis of the pair's movement and trade deals. Euro returned
- How to trade the EUR/USD currency pair on October 1? Simple tips for beginners
- Bitcoin is under the yoke of Chinese repression and US regulations: the price of $100,000 by the end of 2020 is already a
- EUR/USD. Downward track in full swing: next stop at 1.1540
- BITCOIN: techincal analysis of the current situation
- Gold: how long could rally last?
- NZD/USD rebound seems over
- Bitcoin imminent upside breakout!
- EUR/USD accelerates its crash!
- Long-term EURUSD view.
- Strong bounce in Gold prices.
- Bitcoin bulls continues to defend support at $40,000.
- USDCHF continues its upward movement.
- Long-term view for the Dollar index.
- Wave analysis of EUR/USD for September 30. EU unemployment continues to decline
- Trading Signal for LITECOIN, LTC, for September 30 - October 01, 2021: Buy above $146,96 (SMA 21)
- BIS: Banks see risk in CBDC
- Trading Signal for GOLD, XAU/USD, for September 30 - October 01, 2021: Buy above $ 1,725 (3/8)
- September 30, 2021 : EUR/USD daily technical review and trading opportunities.
- September 30, 2021 : EUR/USD Intraday technical analysis and trading plan.
- September 30, 2021 : GBP/USD Intraday technical analysis and significant key-levels.
- Trading Signal for GBP/USD for September 30 - October 01, 2021: Buy above 1.3450 (2/8)
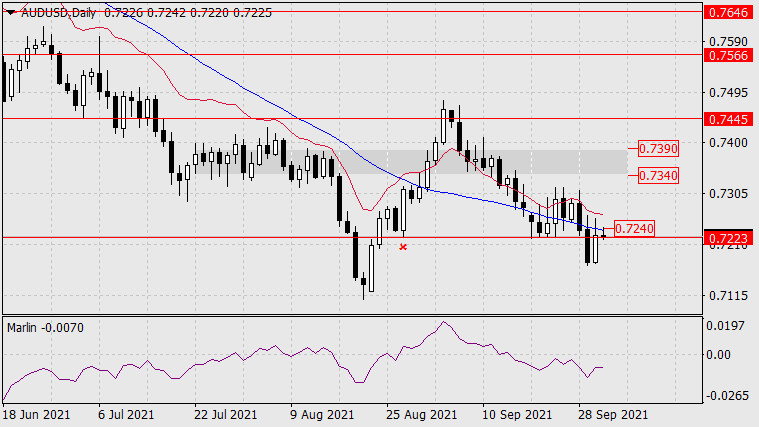
| Forecast for AUD/USD on October 1, 2021 Posted: 30 Sep 2021 08:18 PM PDT AUD/USD Yesterday, the Australian dollar confidently went ahead of the events of the foreign exchange market. The US dollar index weakened 0.1% and the Australian dollar gained 0.71% on Thursday, with commodities almost standing still. The bond market pressure eased, the yield on 5-year US government bonds fell from 0.995% to 0.971%, the trend continues in today's Asian session.
The price is trying to overcome the resistance of the MACD indicator line on the daily chart. An indicator of such a struggle is the Marlin Oscillator, which is rising in the negative zone. The price growth and potential (by the Oscillator) are still weak. To strengthen this potential, the price should consolidate above the MACD line (0.7240). Further growth to the range of 0.7340 / 90 is likely.
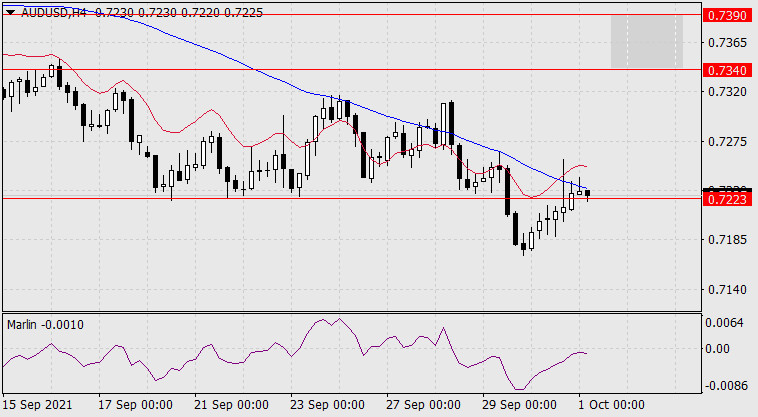
On the four-hour chart, the price is fighting the resistance of the MACD line in the same way. The coincidence of the indicator line of different time frames at the same price significantly enhances the level. Accordingly, overcoming the 0.7240 mark will be an unambiguous indicator of price strength. The Marlin Oscillator has already approached the border with the area of the rising trend. The synchronicity of the price transition above a strong technical level with the transition of the Oscillator to the zone of positive values is an indicator of a strong price potential. We are waiting for the development of events. The material has been provided by InstaForex Company - www.instaforex.com |
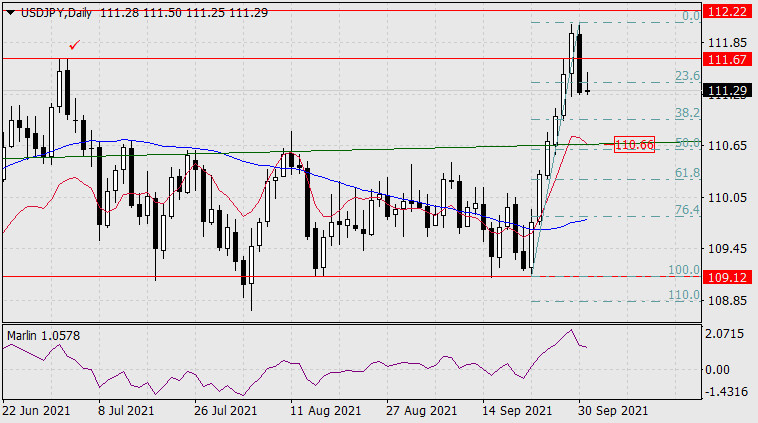
| Forecast for USD/JPY on October 1, 2021 Posted: 30 Sep 2021 08:18 PM PDT USD/JPY Our doubts and fears about the dollar's growth against the yen were not in vain. Yesterday, the USD / JPY pair lost 68 points with an accompanying collapse in the stock markets by more than one percent (S&P 500 -1.19%). Japan's Nikkei 225 is down 2.08% this morning. Apparently, the correction gravitates to half of the previous growth - coinciding with the trend line of the price channel on the daily scale chart (119.66). Consolidation below this line will deepen the fall to the 76.4% Fibonacci level, to the MACD indicator line.
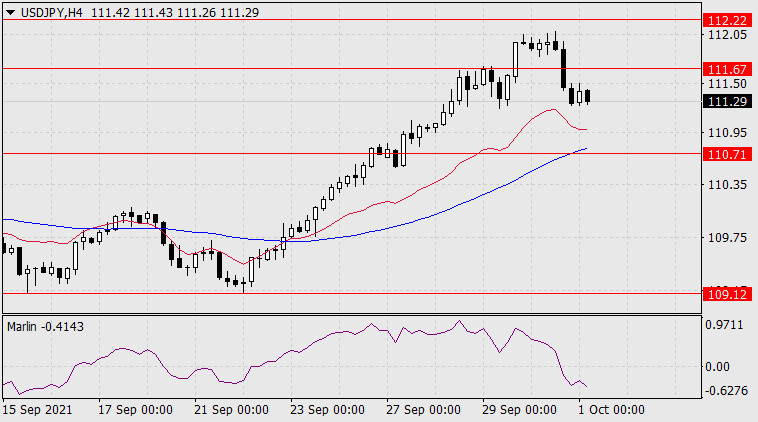
The price gravitates to the MACD line on the four-hour chart, to the area of the July 14 peak at 110.71. This level almost coincides with the price channel line on the daily chart. Accordingly, the support is strong, breaking it will be the first and sure signal for the formation of a medium-term downward trend, below the level of 109.12.
|
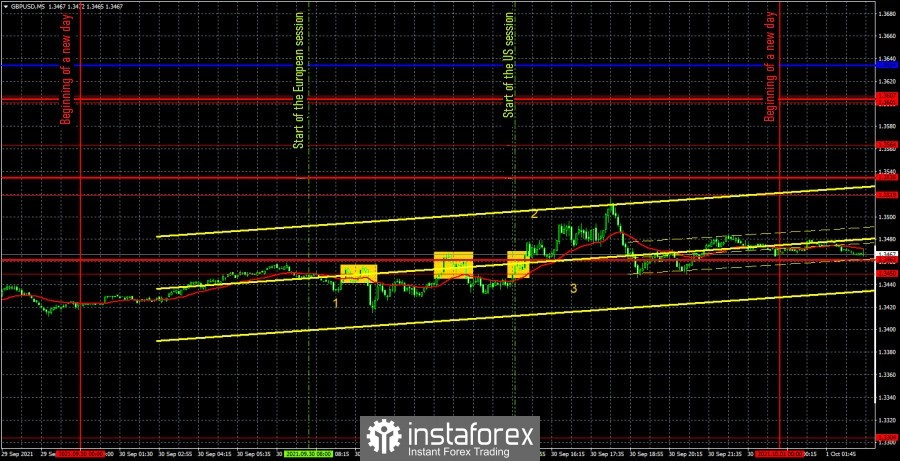
| Posted: 30 Sep 2021 07:29 PM PDT GBP/USD 5M
The GBP/USD pair was also traded in a more familiar style on September 30. The trend movement seems to have been, but not so good as in the last couple of days. The main thing is that after a two-day collapse of the British currency, the time has finally come for a correction, which we expected the day before yesterday. However, the markets were too impressed by the fact that in a developed country like the UK, there was a shortage of fuel and they could not find truck drivers. Therefore, the pound fell quite calmly by 300 points and only then began an upward correction. A report on changes in GDP for the second quarter was published early in the morning in the UK, which turned out to be significantly better than forecasted. The time when this report was published is marked with "1". Attention, the market reaction to one of the most important reports on the state of the economy was a movement of 20 points. All US reports and events were also ignored, which is clearly seen in the chart above. Thus, the fundamental background did not have any influence on the pair's movement yesterday. Trading signals throughout the day were also not the best. The first sell signal turned out to be false - the price bounced off the level of 1.3450. The second sell signal is also false, when the price bounced off the levels 1.3450 - 1.3462. Since these levels were very close to each other, it was necessary to consider them in pairs. In the first case, we managed to avoid a loss on a short position, since the pair went down 20 points, which was enough to set Stop Loss to breakeven. A loss of 25 points was recorded on the second deal, which is one of the highest losses for one deal in recent months. The third buy signal should not have been worked out any more, since two false signals had already been formed near the levels 1.3450 and 1.3462. Ironically, it was this signal that turned out to be profitable in the end. GBP/USD 1H
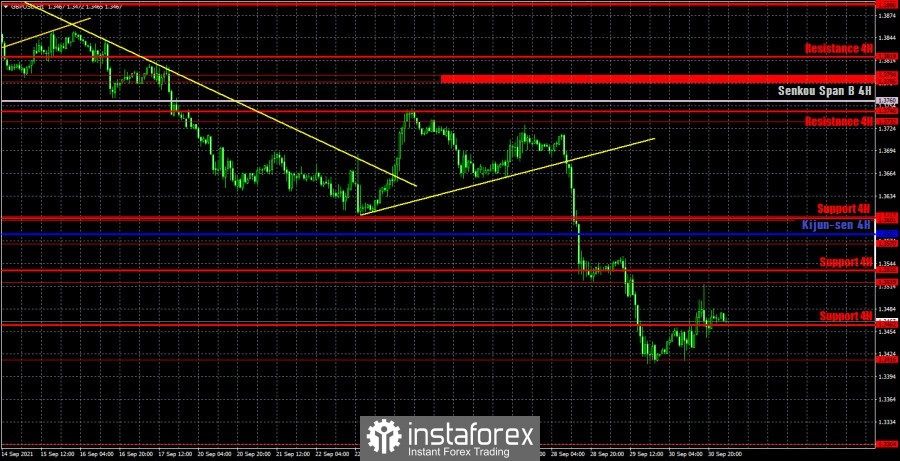
The GBP/USD pair began an upward correction on the hourly timeframe. However, at this time there is neither a trendline nor a channel to understand the approximate purpose of this correction and the ability of the downward trend to persist. Recall that much of this trend is a two-day collapse in the pound. Thus, purely hypothetically, the pair can now return to the level of 1.3732. We distinguish the following important levels on October 1: 1.3304, 1.3416, 1.3519, 1.3570, 1.3601 - 1.3607. Senkou Span B (1.3760) and Kijun-sen (1.3583) lines can also be sources of signals. It is recommended to set the Stop Loss level at breakeven when the price passes 20 points in the right direction. The Ichimoku indicator lines can move during the day, which should be taken into account when looking for trading signals. The UK Manufacturing PMI is due on Friday, but the way markets reacted to yesterday's GDP report suggests there will be no reaction to the report. Moreover, this is the final assessment for September, which rarely differs from the first assessment. There will be no more interesting events in Britain today. In America, the most important event today will be the ISM manufacturing index, but all other reports are of low significance. There may still be some kind of reaction to the consumer sentiment index from the University of Michigan, if it does not strongly correspond to the predicted value. We also recommend that you familiarize yourself with the forecast and trading signals for the EUR/USD pair. COT report
Major players weakened their bullish sentiment during the last reporting week (September 14-20). Although it is now as neutral as possible. The fact is that the value of the net position for the group of "non-commercial" traders is now equal to 0 (approximately). Consequently, neither bulls nor bears have the initiative. Moreover, in the last couple of months, the mood of professional traders has been constantly changing, as the net position is either increasing or decreasing. Thus, from our point of view, the conclusion is obvious: the Commitment of Traders (COT) report does not indicate either bullish or bearish sentiment. The problem lies in the plane of the same level of 1.3600, which can be seen in the second chart even better than in the first one. The pair cannot go below this level, but it is not yet able to start an upward trend. Therefore, we need to wait for a new development of the level of 1.3600. Although this week it has already done so and another rebound followed. Therefore, an upward movement to the previous local high may begin next week. We also draw attention to the fact that the pound was unable to continue its downward movement even at a time when non-commercial traders were actively increasing their short positions. This "dip" in the net position below zero is clearly visible on the charts of both indicators in the chart. That is, the pound did not fall below 1.3600 even when it was actively sold by large players. Explanations for the chart: Support and Resistance Levels are the levels that serve as targets when buying or selling the pair. You can place Take Profit near these levels. Kijun-sen and Senkou Span B lines are lines of the Ichimoku indicator transferred to the hourly timeframe from the 4-hour one. Support and resistance areas are areas from which the price has repeatedly rebounded off. Yellow lines are trend lines, trend channels and any other technical patterns. Indicator 1 on the COT charts is the size of the net position of each category of traders. Indicator 2 on the COT charts is the size of the net position for the non-commercial group. The material has been provided by InstaForex Company - www.instaforex.com |
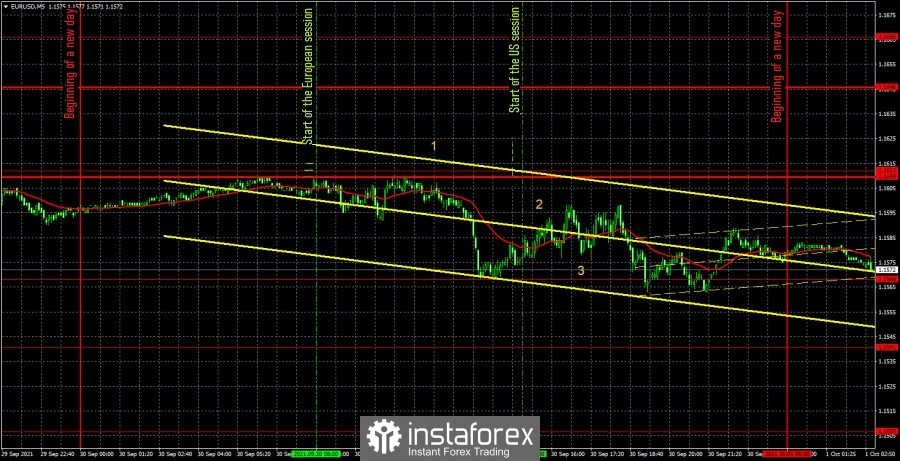
| Posted: 30 Sep 2021 07:29 PM PDT EUR/USD 5M
The EUR/USD pair was trading in its best traditions of the last few months on Thursday: low volatility, almost complete absence of trend movement. Thus, trading was not very convenient on Thursday. But this did not have to be done, since not a single trading signal was generated during the whole day. The pair was close to the extremum level of 1.1612 for a long time, but it could not work it out. Thus, the slight decline that happened at the European trading session did not work out. The volatility of the pair reached around 40 points again, which also did not contribute to active trading. But with the macroeconomic background, the situation has become a little better than in the previous days. Recall that during the first three trading days of the week, the markets witnessed almost a dozen speeches by Powell, Lagarde and Yellen, but did not receive any new information from them. Powell and Yellen also had regular speeches yesterday, with the same success. In addition, the European Union published a report on unemployment (figure "1" in the chart), which did not interest the markets at all. In America, a report on GDP for the second quarter was published not in the first estimate and with a marginal deviation from the forecast (figure "2" in the chart). The number "3" marks the time when Powell and Yellen started speaking. Thus, if we consider the pair's movement by 15 points as a "reaction", then any event is reflected in the foreign exchange market. But even in this case, the movements that were, simply do not coincide with the time when the reports were published. EUR/USD 1H
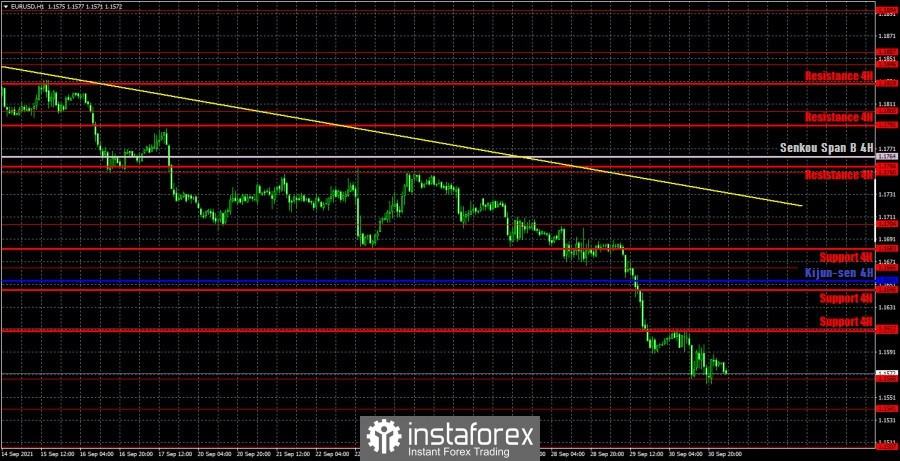
You see that the euro/dollar pair continues to move down on the hourly timeframe. However, if yesterday we talked about a slight strengthening of this movement, today it is already about its weakening. Quotes move away from the trend line, which is still relevant, but it should be understood that this line does not have a large slope, so the current trend cannot be called strong. However, there is no reason to suppose the end of the downward trend now. Thus, the dollar continues to rise in price, which makes it very difficult to find an explanation from the point of view of the fundamental background. We highlight the following levels for trading on Friday - 1.1507, 1.1541, 1.1568, 1.1612, 1.1666, as well as the Senkou Span B (1.1764) and Kijun-sen (1.1654) lines. The Ichimoku indicator lines can change their position during the day, which should be taken into account when looking for trading signals. Signals can be rebounds or breakthroughs of these levels and lines. Do not forget about placing a Stop Loss order at breakeven if the price moves 15 points in the right direction. This will protect you against possible losses if the signal turns out to be false. There will be few important macroeconomic publications on October 1. Nevertheless, there will still be something. For example, the European Union will know the consumer price index for September, which, according to experts, may grow to 3.3% y/y, confirming the words of ECB President Christine Lagarde. In America, the level of income and expenditure of the US population and the index of personal consumption expenditure will be published. Also from overseas, there will be information on business activity indices and consumer sentiment from the University of Michigan. Each separately taken report can provoke a movement, however, if the actual values differ little from the forecasted ones, then the markets will not react. We also recommend that you familiarize yourself with the forecast and trading signals for the GBP/USD pair. COT report
The mood of non-commercial traders became less bullish again during the last reporting week (September 14-20). This is eloquently signaled by the green line of the first indicator, which is responsible for displaying the net position of the "non-commercial" group of traders. Thus, the most important category of traders at this time continues to look towards short positions on the euro in the medium term. Nevertheless, they have not been able to go beyond the "zero line" for several weeks already. Thus, their sentiment does not change to bearish, and the pair cannot overcome the 1.1700 level. Consequently, everything rests not only on the level of 1.1700, but also on the mood of big traders who have been very reluctant to sell the euro in recent weeks. It is also clearly seen that their net position has been declining for a long time (second indicator), but at the same time it cannot become negative. As a result, the pair has been trading in the range of 1.1700 - 1.2300 for about nine months. While facing the horizontal channel, the movement for this period of time can not be called flat. Explanations for the chart: Support and Resistance Levels are the levels that serve as targets when buying or selling the pair. You can place Take Profit near these levels. Kijun-sen and Senkou Span B lines are lines of the Ichimoku indicator transferred to the hourly timeframe from the 4-hour one. Support and resistance areas are areas from which the price has repeatedly rebounded off. Yellow lines are trend lines, trend channels and any other technical patterns. Indicator 1 on the COT charts is the size of the net position of each category of traders. Indicator 2 on the COT charts is the size of the net position for the non-commercial group. The material has been provided by InstaForex Company - www.instaforex.com |
| How to trade the EUR/USD currency pair on October 1? Simple tips for beginners Posted: 30 Sep 2021 02:08 PM PDT Analysis of previous deals: 30M chart of the EUR/USD pair
The EUR/USD pair as a whole continued its downward movement on Thursday. However, it was already doing this with less activity than the day before. But no one said that now the pair will go through 80 points every day. Let us remind you that in the last few months it has been going just 40 points a day in most cases. However, the downward trend persists as the downtrend line remains relevant. We already mentioned that it is quite formal, since it does not have clear and precise points of support. Nevertheless, it works, so today it was possible to consider sell signals from the MACD indicator. Unfortunately, not a single signal was generated during the day, so there was nothing to work out on this timeframe. It should also be noted that there were several more or less important macroeconomic publications on Thursday. For example, the unemployment rate in the European Union was published at lunchtime, and a report on GDP for the second quarter was released at the beginning of the US trading session. These two events are marked with check marks in the chart. As novice traders can see, there was practically no market reaction to these events. But in the late afternoon the euro resumed to fall, which could have been provoked by the speeches of Jerome Powell and Janet Yellen. True, a new rise in the dollar began about an hour later, after the time when both were supposed to start speaking. But, if we assume that their speeches have shifted slightly in time, then the downward movement may be a consequence of these events. 5M chart of the EUR/USD pair
The technical picture on the 5-minute timeframe on Thursday was not ideal, but nevertheless it allowed novice traders to make some money. By and large, only one signal was generated during the day - to sell. And it was formed practically throughout the entire European session - it was so fuzzy. Therefore, everything was at the discretion of novice traders. Recall that, ideally, a good signal is a point and fast rebound of the price from the level or the same fast breakthrough of the level. When the price circles around the level for several hours, this is an inaccurate signal, however, we do not prohibit such rejection, but in the case of such signals, one should look at the general picture of the state of affairs. Today it was possible to work out a sell signal, as the pair was likely to continue falling. However, there was not a single level below the level of 1.1603 that could serve as a guideline for movement. Therefore, it was possible to count only on Take Profit. As a result, it worked, since the price managed to go down the required 30 points with low volatility. How to trade on Friday: The EUR/USD pair pair has formed a new downward trend and continues to adhere to it on the 30-minute timeframe. Unlike the pound, the fall in the European currency is very difficult to explain from a fundamental perspective. However, there is movement, so it should be practiced. At this time, we advise you to consider sell signals from the MACD indicator, but we remind you that they should be formed as close to the zero level as possible. The key levels on the 5-minute timeframe for October 1 are 1.1496, 1.1571, 1.1603, 1.1666. Take Profit, as before, is set at a distance of 30-40 points. Stop Loss - to breakeven when the price passes in the right direction by 15 points. At the 5M TF, the target can be the nearest level if it is not too close or too far away. If it is, then you should act according to the situation or work according to Take Profit. On Friday, we advise you to pay attention to the ISM manufacturing index in the US and to the report on inflation in the European Union. From our point of view, these are the two reports that have a chance to be worked out by the markets. What's on the charts: Support and Resistance Price Levels - Levels that are targets when buying or selling. You can place Take Profit levels near them. Red lines - channels or trend lines that display the current trend and show which direction it is preferable to trade now. MACD indicator (14,22,3) - a histogram and a signal line, the crossing of which is a signal to enter the market. It is recommended to use in combination with trend plots (channels, trend lines). Important speeches and reports (always contained in the news calendar) can greatly influence the movement of a currency pair. Therefore, during their exit, it is recommended to trade as carefully as possible or exit the market in order to avoid a sharp price reversal against the previous movement. Beginners in the Forex market should remember that every trade cannot be profitable. The development of a clear strategy and money management are the key to success in trading over a long period of time. The material has been provided by InstaForex Company - www.instaforex.com |
| Posted: 30 Sep 2021 02:08 PM PDT
Bitcoin is under the yoke of repression and a Chinese ban. The price of $100,000 before the end of the year already seems unimaginable, and not a real and fruitful fact. Repression from China and a complete ban on the cryptocurrency market may contribute to the fact that other countries, and of course the United States, will seek benefits from this event. The total hash power of the world is now relocated to the US. Banks will introduce trading in financial instruments. China's ban on cryptocurrencies is also linked to the migration of mining capacity to the United States. Back in April, we can recall a total power outage in Xinjiang, which served as a catalyst for the fall of the hashrate. China does not want to take risks when it knows that the hashrate is under US control. It is more profitable for them to completely ban cryptocurrencies and continue developing their digital yuan, which, by the way, has already been tested for transactions between the UAE and China. Many countries of the world believe that bitcoin should become the most important protective asset against inflation and a worthy replacement for gold. However, only China does not want to take this idea seriously. China has completely banned the cryptocurrency market, and the US continues to look for alternatives and create regulatory groups to control the cryptocurrency market. Many American firms are competing to launch bitcoin ETFs in the US and are waiting for a decision from the SEC. The Bitcoin ETF is already successfully traded in Canada. Gary Gensler is confident that the launch of Bitcoin-ETF can take place as early as this year, but this product must be regulated and strictly comply with the unwritten rules of mutual funds, which must be listed on stock exchanges according to the law of 1930. Bitcoin can be completely tied to global economic data, as well as the US dollar index. Digital gold can be less volatile and sensitive to various events and calls from different countries. With regard to the further growth of bitcoin, so far everything is not so clear. However, the fear and greed coefficient still demonstrates the presence of greed on the crypto arena, which can lead to a deep correction. Now digital gold is below the most important support level, in order to gain bullish movement again and rise to a price of $50,000, bitcoin must overcome the milestone of $43,900. The material has been provided by InstaForex Company - www.instaforex.com |
| EUR/USD. Downward track in full swing: next stop at 1.1540 Posted: 30 Sep 2021 02:08 PM PDT The EUR/USD pair has set a new price low for the year, dropping to 1.1568. The price has not fallen below this target since July 2020. Judging by the strength of the downward trend, the bears will soon update this price low, as the nearest support level is located at 1.1540 (the lower line of the Bollinger Bands indicator coinciding with the lower boundary of the Kumo cloud on the weekly chart). Before this price barrier, as they say, "just around the corner", so there is now an absentee discussion among experts about what mark the greenback will stop at. According to some analysts, the dollar paired with the euro will circle around the target of 1.1540. According to other currency strategists, it is now possible to talk about the prospects of a decline in the area of the 14th figure. In my opinion, an additional 100-point price reduction looks quite feasible, especially if the September Nonfarm, which will be published next Friday, will not disappoint traders. However, the next Nonfarm is still a week away, and the dollar is strengthening its position right now. This is facilitated by many fundamental factors that are more or less interconnected. Thus, a barrel of Brent crude oil continues to precipitate the $80 mark, demonstrating the strength of the uptrend. In this regard, investors' fears about another jump in inflation in the United States have intensified. These concerns were expressed in the sale of government bonds, which is why their yields went up again. In particular, the yield of 10-year securities this week reached a three-month high of 1.546%.
In addition, the hawkish expectations of traders regarding the Federal Reserve's further actions have been increasing recently. The central bank has already announced that it will start curtailing QE earlier than expected (in November). But, as you know, "appetite comes with eating" - now the market is discussing the prospects of raising the rate next year. The head of the St. Louis Federal Reserve, James Bullard, also added fuel to the fire, who recently announced that he expects a double rate hike in 2022. This statement could be treated with a certain degree of skepticism (Bullard is a consistent hawk), if not for the median forecast of the Fed, which was updated at the last meeting. The dot plot of forecasts showed that 9 out of 18 members of the Committee expect an increase in the base rate in 2022. Moreover, three of them assume that the rate will be increased twice next year. A rate increase in 2023 is expected by 17 of the 18 members of the Fed, in 2024 – all 18. In other words, the results of the September meeting laid the foundation for strengthening the US currency. All subsequent events that took place after the September meeting were considered and are being considered by the market through the prism of prospects for tightening monetary policy. In September, Fed Chairman Jerome Powell repeated the mantra several times that the increase in inflation is temporary. In his opinion, the surge in prices occurred due to limited supply amid very high demand. However, during his recent speeches, he has already begun to express concern that inflation indicators remain at a high level. In particular, speaking to congressmen, he said that "the current increase in inflation is of greater concern than in the first half of the year." At the same time, he suggested that problems with supply chains will continue next year. According to a number of analysts, the Fed will have to raise the rate next year in response to the recovery of the labor market and increased price pressure. The current macroeconomic statistics also speak in favor of a further decline in EUR/USD. In particular, the third (final) assessment of the growth of the US economy in the second quarter was published today. According to published data, the country's GDP growth was 6.7% (the initial estimate was at 6.6%). The GDP price index increased by 6.2% (6.1% earlier), the base RCE - by 6.1%. The European currency, in turn, today found itself under pressure from macroeconomic reporting. German inflation surprised with rather weak figures, which became a harbinger of weakening of pan-European inflation. So, in monthly terms, the overall consumer price index sharply fell in September, collapsing to zero (with a forecast of growth up to 0.2%). On an annualized basis, the indicator also came out in the red zone, ending up at 4.1% with a forecast of growth up to 4.5%. The regional reports of the German CPI reflected the widespread deterioration of inflation indicators in monthly terms. The harmonised German consumer price index also showed a rather weak result, both in monthly and annual terms.
Thus, the potential for a decrease in EUR/USD is still not exhausted. The technical side of the issue also speaks of the priority of short positions: the price is located between the middle and lower lines of the Bollinger Bands indicator, as well as under all the lines of the Ichimoku indicator, which demonstrates the bearish "Parade of Lines" signal. The first target of the downward movement is 1.1540 (the lower line of the Bollinger Bands indicator, which coincides with the lower border of the Kumo cloud on the weekly chart). When this target is overcome, the main price barrier will be 1.1500. The material has been provided by InstaForex Company - www.instaforex.com |
| BITCOIN: techincal analysis of the current situation Posted: 30 Sep 2021 12:47 PM PDT BITCOIN
The daily time frame still shows uncertainty and consolidation. Bears cannot break support levels that play quite a significant role now. As a result, bitcoin has come under pressure of the congestion of such levels as 42,757.60 (the weekly Fibo Kijun) – 42,284.36 (the daily Tenkan) – 41,513.12 (the monthly Fibo Kijun + weekly Senkou Span A). If the price breaks this congestion and goes beyond the daily cloud (40,088.88), it will reinforce bears' positions and open the way to a deeper decline. If an uncertain candlestick (i.e. a candlestick with equally long shades and a short body) is formed at September's closure and if the price keeps rebounding from support levels, the bearish trend will probably reverse. Therefore, the bullish scenario is likely to unfold. In such a case, the key resistance levels will lie at 45,032.73 (the weekly Tenkan + daily Fibo Kijun) and 46,182.11 - 46,224.80 - 46,960.38 (the monthly Tenkan + weekly and daily Kijun).
Consolidation on the daily time frame prevents us from determining the trend direction on smaller time frames. So the situation is uncertain at the moment. The key levels on the smaller time frames can be found at 42,530.59 (the weekly long-term trend) and 41,395.98 (the central pivot level). They are reinforced by the levels of bigger time frames. Any activity above the mentioned levels will mean the dominance of bulls. The intraday upside targets can be found at the resistance of the common pivot levels. Currently, we can witness consolidation near R2 (43,238.23), and the next target is R3 (43,977.73). If the price breaks below these key levels, bears will take the lead. The downside targets are the support of the common pivot levels at 40,293.23 – 39,553.73 – 38,450.98. *** When conducting the technical analysis, the following tools are applied: bigger time frame – Ichimoku Kinko Hyo (9.26.52) + Fibo Kijun levels H1 – Pivot Points (classic) + Moving Average 120 (the weekly long-term tendency) The material has been provided by InstaForex Company - www.instaforex.com |
| Gold: how long could rally last? Posted: 30 Sep 2021 10:40 AM PDT Gold has rallied today as the Dollar Index has dropped. DXY's sell-off was somehow expected after its amazing growth. Also, some poor US data have forced the greenback to depreciate versus its rivals. The price of Gold has taken advantage and it has risen as much as 1,764 today. Now, the yellow metal has reached a resistance area, so you'll have to be careful, anything could happen. Being rejected from this zone could push the price down again. On the other hand, Gold could extend its upwards movement if it makes a valid breakout through the immediate resistance levels. XAU/USD registered a 2.44% growth from 1,722.29 today low to 1,764.24 today's high. XAU/USD Amazing Upside Momentum!
As you can see on the H4 chart, the price of Gold failed to stabilize under the weekly S1 (1,729.88) signaling bullish pressure. Now it challenges the 1,758 weekly pivot point after failing to stay above the ascending pitchfork's median line (ml). It has failed to reach the downtrend line. You should know that only a valid breakout through the downtrend line may confirm further growth. A false breakout or failing to reach this line may signal a new leg down. Gold Forecast!Jumping, closing, and stabilizing above the downtrend line and above the median line (ml) could be seen as a long opportunity. This scenario could signal an upside reversal. Staying under the downtrend line and coming back below 1750 may signal a downside continuation. The material has been provided by InstaForex Company - www.instaforex.com |
| Posted: 30 Sep 2021 10:39 AM PDT NZD/USD increased as much as 0.6921 today where it has found strong supply and now is traded lower at 0.6895. The price has registered a false breakout through an upside obstacle, so the rebound could be complete. The pair rallied as the Dollar Index has turned to the downside today. DXY's decline was natural after its amazing leg higher. Fundamentally, the New Zealand Building Consents rose by 3.8% versus 2.2% in the previous reporting period, while the ANZ Business Confidence was reported -7.2 points below -6.8 in the previous reporting period. The NZD/USD is fighting hard to rebound as the US Unemployment Claims increased from 351K to 362K. The economists have expected to see a drop to 333K. The Chicago PMI was reported at 64.7 below 64.9 expected. The Dollar Index is into a temporary corrective phase. The greenback could lose more ground versus its rivals even if the US Final GDP increased by 6.7% versus only a 6.6% expected. NZD/USD False Breakout!
The NZD/USD pair dropped as much as 0.6859 in yesterday's session but it has failed to reach the descending pitchfork's median line (ml) which is seen as a potential target. Technically, the pair was expected to drop after registering only false breakouts through the descending pitchfork's upper median line (uml). In the short term, a temporary rebound was natural after the most recent sell-off. The rebound could help us to catch new downside movements. Maybe, the NZD/USD pair could still approach and reach the median line despite the current rebound. NZD/USD Forecast!NZD/USD could drop again after the current rebound. We cannot talk about a larger rebound as long as the price action didn't develop a major bullish pattern. Techncially, the pressure is high as long as the pair stays under the upside 50% Fibonacci line. A broader downside movement could be confirmed by a valid breakdown below the median line (ml). The material has been provided by InstaForex Company - www.instaforex.com |
| Bitcoin imminent upside breakout! Posted: 30 Sep 2021 09:41 AM PDT Bitcoin continues to move sideways but it should exit this range soon. The price is traded at 43,184 at the time of writing below 43,835 today's high. Technically, the price action invalidated a deeper drop, so we could search for new buying opportunities. BTC/USD has shown some oversold signs, but it's premature to consider going long before getting confirmation. It's up by 2.68% in the last 24 hours, but it is still in the negative territory in the last 7 days. BTC/USD has printed a minor triangle pattern in the short term. Escaping from this formation could bring fresh opportunities in Bitcoin. BTC/USD Downside Invalidated!
As you can see on the H4 chart, the price of Bitcoin failed to stabilize under the ascending pitchfork's lower median line (lml) signaling strong upside pressure. Now it has found temporary resistance right above the weekly pivot point (43,381.51). Technically, a valid breakout through the immediate downtrend line may signal a potential growth at least towards the median line. Failing to reach the downtrend line or registering a false breakout may bring a new sell-off. Bitcoin Forecast!A new higher high, jumping and closing above 44,377, and a valid breakout through the immediate downtrend line may signal further growth in the short term. On the other hand, dropping and closing under 40,192 could announce a deeper drop. The material has been provided by InstaForex Company - www.instaforex.com |
| EUR/USD accelerates its crash! Posted: 30 Sep 2021 09:39 AM PDT
EUR/USD On The Way Down!The EUR/USD pair resumed its downside movement as expected. As you already know from my analyses, the pair was expected to drop deeper as long as it stays under the downtrend lines. Also, dropping below 1.1687, 1.1667, 1.1626, and 1.1615 former lows signaled strong sellers and a potential further drop. EUR/USD Trading Conclusion!EUR/USD is strongly bearish, it could drop further, after ignoring the former lows. The downside bias remains intact as long as it stays under the downtrend line. 1.1550 and 1.1500 are seen as the next downside obstacles, potential targets, if the pair resumes its sell-off. The material has been provided by InstaForex Company - www.instaforex.com |
| Posted: 30 Sep 2021 09:30 AM PDT EURUSD is making new 2021 lows. Price has broken below the 1.16 price level and the major Fibonacci retracement support. Next target is at 1.1490 where we find the 50% Fibonacci retracement of the entire upward move from 1.0640 to 1.2340.
|
| Posted: 30 Sep 2021 09:23 AM PDT Gold price made a low at $1,721 but is now trading at $1,756. Has trend in Gold reversed to bullish or is this just another opportunity to sell Gold? We use the Ichimoku cloud indicator and simple technical analysis to reach a conclusion.
Black lines- bearish channel Gold price is trading still inside the bearish channel. Price made a strong upward reversal today but price has not exited the channel yet. The high that produced the $1,721 low is at $1,786. As long as price is below that level, short-term trend will remain bearish.
Concluding we see that price is testing key resistance area. This is not the place to be optimistic. A rejection here could bring sellers back and resume the downtrend to new lows below $1,700. Traders need to be cautious. A pull back should not break below $1,742 as this would confirm that bears remain in control of the trend. The material has been provided by InstaForex Company - www.instaforex.com |
| Bitcoin bulls continues to defend support at $40,000. Posted: 30 Sep 2021 09:17 AM PDT Bitcoin is trading above $40,500 and below $44,800. Price is moving mostly sideways for the last few sessions. The $40,000 price level is a confirmed support and breaking below it will provide a new sell signal.
Green rectangle- support On the other hand there is technical resistance by the trend line at $44,800. Breaking above the trend line will be a sign of strength. So far price has formed also three lower highs implying that bulls become weaker as each bounce makes lower highs. I favor the scenario where price breaks to the downside and moves towards $35,000 at first. However bears will need to break below the green rectangle first. The material has been provided by InstaForex Company - www.instaforex.com |
| USDCHF continues its upward movement. Posted: 30 Sep 2021 09:13 AM PDT USDCHF is now trading around 0.9340. When price broke out of the triangle pattern we mentioned that our target was around 0.95. Price has back tested the triangle boundaries and bounced off of them to provide new higher highs. Trend is clearly bullish at least for the short-term.
Red line - support trend line USDCHF is making higher highs and higher lows. The 0.92 level is key support. As long as price is above this level we remain bullish expecting a move towards 0.95. As long as this pattern of higher highs remains intact, bulls will remain in control of the trend. The material has been provided by InstaForex Company - www.instaforex.com |
| Long-term view for the Dollar index. Posted: 30 Sep 2021 09:10 AM PDT The Dollar is strengthening making new weekly highs. Price has made another major low around the 90 level and has respected the long-term support at 89-90. Price has started another upward movement as we expected, following the similar conditions from the past.
Black line - major horizontal support Blue lines - bullish divergence Green lines -expected path The Dollar index is moving higher as it did back in 2017. The bullish RSI weekly divergence is similar and price again then tested the 89-90 support area. As we mentioned this pattern in previous posts, it is important to remind past is a guide and markets usually repeat patterns. Respecting the black horizontal support was a key characteristic for this bullish move.
|
| Wave analysis of EUR/USD for September 30. EU unemployment continues to decline Posted: 30 Sep 2021 08:50 AM PDT
The wave counting of the 4-hour chart for the EUR/USD has undergone certain changes. After the quotes fell below the low of the previous wave, the construction of the downward trend section is resumed. Consequently, it was necessary to make such adjustments that would involve a section of the a-b-c-d-e trend, which was formed from the very beginning of the year. I believe that this section can be considered wave A, and the subsequent increase can be considered wave B. If this is indeed the case, then the construction of the proposed wave C has now begun, which can take a very extended form, given the size of wave A. At the same time, the entire section of the trend may again take the corrective three-wave form A-B-C. Thus, the probability of a further decline in the instrument has increased dramatically, but a week ago this option of wave counting was absolutely unpopular. A successful attempt to break through the 1.1541 mark, which corresponds to 61.8% Fibonacci level, indicates the readiness of the markets for new sales. The euro continued its smooth decline within the framework of the expected first wave as part of the future A. According to the report, European Union's unemployment rate fell from 7.6% to 7.5% in August. This report, however, did not have any impact on the markets. Meanwhile, America's GDP for the second quarter showed an increase from the previous 6.6% to 6.7% QoQ. The number of claims for unemployment benefits slightly exceeded the expectations of the markets. However, the main decline in the quotes of the instrument happened upon the release of the first report. Jerome Powell and Christine Lagarde are expected to give a speech at an event organized by the ECB later today. However, note that several speeches by Powell and Lagarde have already taken place this week, and each time it was very difficult to draw a parallel between them and the movement of the instrument. Thus, most likely, we will observe the same picture today - "the dog barks, but the caravan moves on". Nevertheless, the current decline in the euro currency now makes it possible to expect a much stronger downward movement, since the expected wave C can turn out to be very long both in time and in size. Tomorrow, the EU's inflation report and business activity indices in the service and manufacturing sectors will be released. The same indexes will be released in the USA. Friday may be the first day this week when markets will be able to pay attention to economic reports. Based on the analysis, I conclude that the construction of the downward wave C will continue for some time. Therefore, now I advise selling the instrument for each downward signal from the MACD, with targets located near the calculated marks of 1.1608 and 1.1540, which corresponds to 50.0% and 61.8% Fibonacci levels. The proposed wave C may turn out to be approximately the same size as wave A. At the same time, only one wave is visible inside this wave so far, and it should turn out to be much more complex.
The wave counting of the higher scale looks quite convincing. The decline in quotes continues and now the downward section of the trend, which originates on May 25, takes the form of a three-wave corrective structure A-B-C. Thus, the decline may continue for several more months until wave C is fully completed. The material has been provided by InstaForex Company - www.instaforex.com |
| Trading Signal for LITECOIN, LTC, for September 30 - October 01, 2021: Buy above $146,96 (SMA 21) Posted: 30 Sep 2021 08:19 AM PDT
Litecoin has been trading below a downtrend channel since September 15. At the same time the price has been plotting a descending wedge pattern. In the last hours of trading, the crypto has broken this pattern. Consolidating above from the SMA 21, the Litecoin is likely to gain bullish momentum above this level. Despite the bullish target, LTC is facing a lot of obstacles ahead such as the first resistance line at EMA 200 (167.50) 7/8 of murray (175.00) and the psychological level of 200.00 located at 8/8 murray. On the other hand, the high level of indecision overshadows the bullish outlook. The key resistance is at the 200 EMA around 167.50. This will be a strong top for LTC. If the price fails to break it, there could be a new bearish move targeting 5/8 murray level. The key pivot point for now is 146.96 where there is the SMA of 21 in the 4-hour chart. If LTC returns to trade below this level, the scenario will turn negative and the price could fall to 125.00 level of 5 / 8 by murray. The technical reading of the eagle indicator is showing an overbought signal. An upward movement is likely to happen to 167.50 in the next coming days. If this happens, the eagle indicator to be extremely overbought and it will be a sell signal. On the contrary, if LTC breaks below 146.00, it will be clear that it is time to buy. Support and Resistance Levels for September 30 - October 01, 2021 Resistance (3) 158,89 Resistance (2) 156,55 Resistance (1) 154,18 ---------------------------- Support (1) 148,39 Support (2) 143,68 Support (3) 137,89 *********************************************************** Trading tip for LTC for September 30 - October 01, 2021 Buy above 146,96, (6/8) with take profit at 167,50, stop loss below 143,50. Sell below 145,00 (SMA 21) with take profit at 125,00 (5/8), stop loss above 148,50. The material has been provided by InstaForex Company - www.instaforex.com |
| Posted: 30 Sep 2021 07:34 AM PDT Problems on the US stock market are increasingly fueling rumors about the safe harbor that central banks may offer during financial crises. This refers to national digital currencies, about which representatives of various financial institutions have been talking a lot lately. We are talking about those countries that are more or less doing well with their economies. The Federal Reserve, the Bank of England, the European Central Bank, and the Swiss National Bank may soon release their proposals for introducing digital currencies in their countries.
The Bank for International Settlements reported that during a crisis, a central bank digital currency (CBDC) "could be perceived as a safe haven". The fact that in times of crisis many households prefer to keep their funds in a jar and withdraw deposits from bank accounts has long worried central banks. With the introduction of CBDC, you can try to reduce transaction costs, which very seriously affect the stability of the banking and financial systems in crisis. It is not for nothing that central banks begin to pump liquidity, which helps commercial banks to cope with the consequences of the crisis. Another argument for central banks to introduce their digital tokens is the relatively high volatility of the cryptocurrency market, which has long been called an alternative to inflation-stricken fiat currencies. The ability to conduct instant international transactions with minimal losses on commissions and with little or no regulation is also quite an attractive argument. China is already in the final stages of testing its digital yuan, which is prompting other countries to follow suit. In addition, the report also shows how CBDCs may affect the corporate banking sector and its giants. There are several negative factors for banks. With the introduction of CBDCs, they could seriously lose some commercial and private deposits, jeopardizing the industry. "Government-backed digital currencies could lead to higher volatility in deposits and/or a significant, long-term reduction in customer deposits," according to the report. "This could, under certain circumstances, affect bank profitability, lending, and the overall provision of financial services." Both of the risks could be managed by forcing tight controls on the CBDCs. Tight limits on transactions or holdings of the digital currencies could mitigate such dangers, as could a lengthy transition period before launching the new assets. Commercial banks will not stand aside and wait for their business to crash. They will most likely develop their class of digital tokens, which will be able to partially recoup their losses but that is only a distant prospect. Wall Street and the crypto sector are eagerly awaiting a Fed research paper in the coming days. The draft is expected to be sent out for general discussion before the central bank takes action and announces the adoption of a digital dollar. The Fed recently contributed to the BIS study, suggesting that the issues they outlined could add to the expected report.
As for the technical picture of bitcoin, while trading continues in a narrow range, the bulls have a strong interest in cryptocurrency. The bulls have already managed to take the middle of the $42,700 channel and now the price is consolidating above this range, which will allow counting on the renewal of the upper border of the side channel located at $44,990. A breakout of that level will certainly lead to a larger upward correction to the area of highs at $47,900 and $50,800. If the bears regain the volumes of the market and set short positions below $42,730, most likely we will see an immediate test of $40,600 support, below which the bulls may start to have real problems. The risk of the breakout of this level is slightly weakened, but till the BTC will not break above the MA200, it will be wrong to speak about the bullish sentiment in the market. The material has been provided by InstaForex Company - www.instaforex.com |
| Trading Signal for GOLD, XAU/USD, for September 30 - October 01, 2021: Buy above $ 1,725 (3/8) Posted: 30 Sep 2021 07:25 AM PDT
XAU / USD is trading within a downtrend channel. Yesterday, it reached the bottom of the channel. From that level, it is making a technical rebound. Below at 1,718, 3/8 of a murray is located which is the next support for gold. We believe that above this level gold could make an upward movement, which will be a good opportunity to buy. The weakness of the gold ounce is mainly due to the strength of the US dollar alongside the rise in the yields of Treasury bonds. Investors are taking refuge in the dollar, hence traditional safe-haven assets such as gold and the Japanese yen are losing ground. The zone of 1,718 has become the next key support for Gold. Since on August 10 after the flash crash, it managed to find support above this 3/8 murray level. Now it is likely that it will try to challenge this critical level. If it remains above and consolidates, we will have a good opportunity to buy with targets at 1,750 On the contrary, below this key level appears 2/8 Murray at 1,687. We do not have such a strong bearish signal for now to believe that this level of 1,718 will be broken. Since the dollar index has reached a critical level of 94.53, and from that level it is making a technical correction, which could favor the recovery of Gold in the next few days. Our strategy in the next few hours and until next week will be to buy gold as long as it trades above 1,718 and above the support of the bearish channel around 1,725. Take profit can be set at 4/8 of a murray around 1,750, the key resistance level. What we can observe on the daily chart is that strong resistance is located at 1,750, since the upper line of the bearish channel converges at this level. Therefore, a pullback towards this area will be a good opportunity to sell with targets at 1,735 and 1,718. Support and Resistance Levels for September 30 - October 01, 2021 Resistance (3) 1,750 Resistance (2) 1,740 Resistance (1) 1,729 ---------------------------- Support (1) 1,718 Support (2) 1,706 Support (3) 1,692 *********************************************************** Trading tip for GOLD for September 30 - October 01, 2021 Buy above 1,725, or if gold rebounds at 1,718 (3/8) with take profit at 1,740 and 1,750 (4/8), stop loss below 1,715. Sell if it makes a pullback at 1,750 (4/8) with take profit at 1,735 and 1,718 (3/8), stop loss above 1,757. The material has been provided by InstaForex Company - www.instaforex.com |
| September 30, 2021 : EUR/USD daily technical review and trading opportunities. Posted: 30 Sep 2021 07:13 AM PDT
Recently, Persistence below the depicted price zone of 1.1990 indicated further downside movement towards 1.1840 and 1.1780 where a sideway consolidation range was established. During last week, the EURUSD pair has been trapped within a narrow consolidation range between the price levels of 1.1780 and 1.1840. A bullish breakout was executed above 1.1840 shortly after. Temporary Upside pullback was expected towards 1.1990. However, re-closure below the price level of 1.1840 has initiated another downside movement towards 1.1780 which failed to hold prices for a short period of time before significant upside movement was presented into market. Intraday traders were advised to wait for candlestick closure above 1.1780 - 1.1840 for another ascending swing to be initiated. However, immediate downside selling pressure brought the pair down towards 1.1700. Currently, the price zone around 1.1700 remains a prominent supply-zone to be watched for SELLING pressure and a possible SELL Entry. Bearish persistence below 1.1700 will enhance further bearish decline towards 1.1670 and 1.1610. The material has been provided by InstaForex Company - www.instaforex.com |
| September 30, 2021 : EUR/USD Intraday technical analysis and trading plan. Posted: 30 Sep 2021 07:12 AM PDT
Bearish persistence below the price zone of 1.2050-1.2000 allowed the recent downtrend to be established. So, the EURUSD pair has expressed significant bearish decline while the price level of 1.1650 stood as a prominent demand level that prevented further bearish decline. The bullish pressure that originated around 1.1650 failed to push higher than the price level of 1.1900. That's why, another bearish pullback towards 1.1650 was executed. Bullish signs were expected around the price levels of 1.1650-1.1700 as it corresponded to a recent previous bottom. However, extensive bearish decline is pushing the EURUSD pair towards 1.1600 and lower levels will probably be reached if sufficient bearish momentum is maintained. Upcoming bullish pullback towards 1.1650-1.1680 should be considered for bearish rejection and a valid SELL Entry. The material has been provided by InstaForex Company - www.instaforex.com |
| September 30, 2021 : GBP/USD Intraday technical analysis and significant key-levels. Posted: 30 Sep 2021 07:11 AM PDT
The GBPUSD pair has been moving sideways with some bearish tendency while bearish breakout below 1.3600 was needed to enhance further bearish decline. On the other hand, the nearest SUPPLY level was located around 1.4000 where bearish rejection and a valid SELL Entry was anticipated. The recent bullish rejection witnessed around 1.3600 as well as the temporary bullish breakout above 1.3880 indicated a high probability that this bullish movement may pursue towards 1.4025 then 1.4100. However, the pair remained trapped within a fixed price range until significant bearish momentum emerged into the market. Bearish breakout below 1.3720 enabled further bearish decline towards 1.3560 while the price level of 1.3400 was expected to be reached if sufficient bearish pressure was maintained. Currently, the GBPUSD pair is testing a significant Demand-Zone located around 1.3400 which corresponds to 123% Fibonacci Level of the most recent bearish movement. This maybe a good entry level for a corrective pullback if sufficient bullish rejection is expressed. On the other hand, Further bearish decline below 1.3400 will probably enable more bearish movement towards 1.3225 as it corresponds to the next Fibonacci Expansion Level. The material has been provided by InstaForex Company - www.instaforex.com |
| Trading Signal for GBP/USD for September 30 - October 01, 2021: Buy above 1.3450 (2/8) Posted: 30 Sep 2021 06:35 AM PDT
The British pound is trading above the key support of 2/8 of murray. Yesterday, we saw this critical level break for a few hours but then, in the European session, the pair is consolidating above this zone. For a while, 1.3427 is support that we must consider. Any pullback towards this area will be a good opportunity to buy. This technical rebound of the GBP / USD pair comes in part due to the fact that the US dollar has reached a key resistance level near the +2/8 level of murray located at 94.53 that means an extremely overbought market. From this area, it is making a technical correction and all currency pairs against the US dollar are taking a breather and correcting after strong pressure from the USD. The daily chart of the GBP / USD pair shows that the pound is trading within a downtrend channel. At this time of writing, the pair is trading at .3450. It is likely that a technical rebound will continue due to the technical correction of the US dollar and the strong support at 1.3427. The short-term outlook is still bearish as the 200 EMA and the 21 SMA are located at 1.3715 which represents strong dynamic resistance, which keeps the pair under downward pressure. Therefore, if in the next few days the British pound tries to break the level of 1.3715 and does not succeed, it will be a clear signal to sell below both moving averages. The targets will be the support levels of 1.3550 and 1.3427. Meanwhile, according to the scenario that is observed, we believe that it will be a good opportunity to buy at the current price levels, with targets at 1.3550 that is 3/8 of a murray. Between this level and the support of 1.3427, it will be the next price range until the next week when the NPP data is published. A breakout and consolidation above 1.3550 would set the stage for a bullish move aiming to challenge the 200 EMA located at 1.3715 and the 4/8 Murray located at 1.3671, which has now become strong resistance. Our strategy is to buy above 1.3427 as long as the pair consolidates above this level or makes a technical bounce above this point, with targets up to 1.3550 and 1.3670. If the price encounters resistance at both levels and fails to consolidate, this will be a good opportunity to sell. Support and Resistance Levels for September 30 - October 01, 2021 Resistance (3) 1.3550 Resistance (2) 1.3512 Resistance (1) 1.3660 ---------------------------- Support (1) 1.3427 Support (2) 1.3370 Support (3) 1.3319 *********************************************************** Trading tip for GBP/USD for September 30 - October 01, 2021 Buy above 1,3450 or if the pair rebounds at 1,3427 (2/8) with take profit at 1,3500 and 1,3550 (3/8), stop loss below 1,3415. The material has been provided by InstaForex Company - www.instaforex.com |


| You are subscribed to email updates from Forex analysis review. To stop receiving these emails, you may unsubscribe now. | Email delivery powered by Google |
| Google, 1600 Amphitheatre Parkway, Mountain View, CA 94043, United States | |


Comments