Forex analysis review
Forex analysis review |
- J. Powell acknowledged the threat of uncontrolled inflation. US dollar is receiving strong support. Overview of USD, CAD,
- Technical Analysis of EUR/USD for December 1, 2021
- Technical Analysis of GBP/USD for December 1, 2021
- Technical Analysis of BTC/USD for December 1, 2021
- US stock market dips over Powell's statement
- Technical Analysis of ETH/USD for December 1, 2021
- Trading plan for starters of EUR/USD and GBP/USD on December 1, 2021
- EUR/USD. Powell's hawkish attitude against the new variant of COVID-19 Omicron
- Analysis and trading tips for GBP/USD on December 1
- Daily Video Analysis: AUDUSD, H4 Strong Bearish Channel
- Analysis and trading tips for EUR/USD on December 1
- Inflation caused the euro to collapsed
- USD/CAD making temporary decline?
- Ripple reversal pattern violated
- Tips for trading during Ethereum's momentum rally
- USDCHF short-term bullish bounce | 1st Dec 2021
- Breaking forecast for GBP/USD, December 1st
- CHFJPY Potential For Dips | 1st Dec 2021
- USDCAD Bearish Pressure | 1st Dec 2021
- High inflation in the US is no longer 'temporary'
- EUR /USD analysis on November 30, 2021. Inflation in Europe accelerating.
- GBP/USD: plan for the European session on December 1. COT reports. Pound particularly in demand below 1.3288 among bulls
- EUR/USD: plan for the European session on December 1. COT reports. Euro collapsed after Fed chairman's speech
- New COVID-19 vaccine needed for Omicron
- Powell to stop referring to inflation as
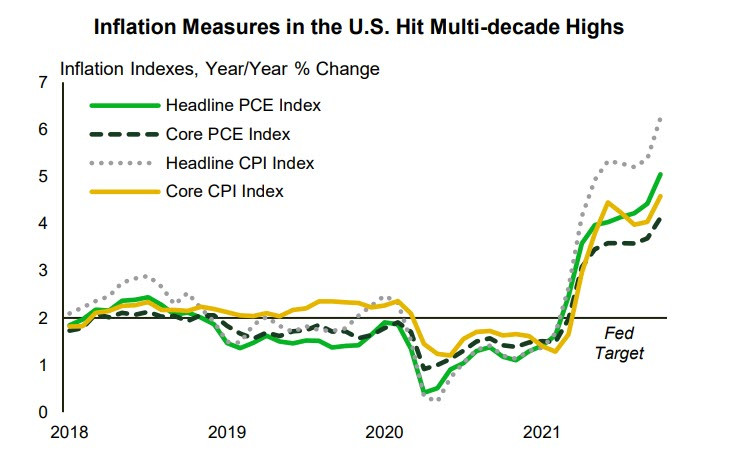
| Posted: 01 Dec 2021 01:05 AM PST The head of the Fed, J.Powell, made a loud and clearly hawkish statement in the US Senate. According to him, the time has come to abandon the word "temporary" when describing inflation, and, given that "inflationary pressure is high," he will consider stopping purchases of our assets maybe a few months earlier. Indeed, it is difficult to consider the phenomenon temporary if we look at the inflation chart. Nothing temporary is even close to being observed here.
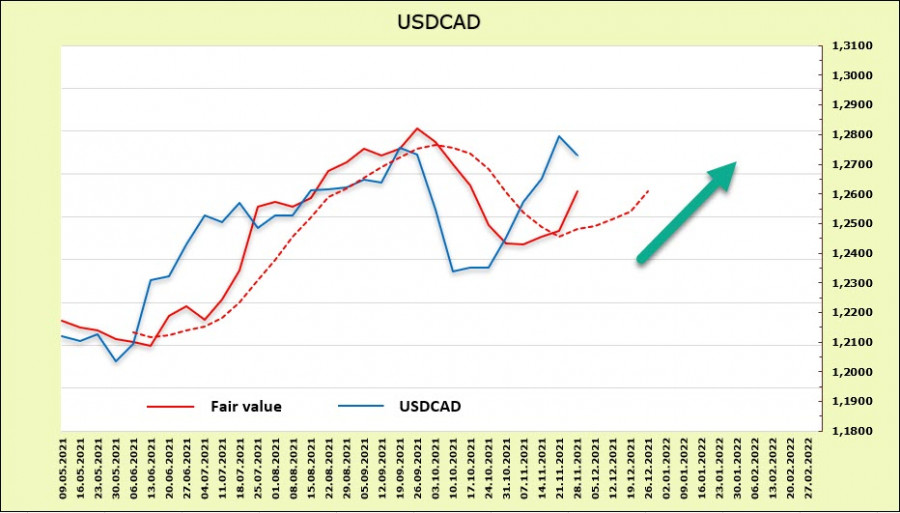
Therefore, the probability that the Fed will completely close QE, not in June, but in March, has increased. This may also mean that the Fed will have matured to the first rate hike by May/June, and it may raise the rate three times by the end of the year, and not twice, as predicted recently. Stock indexes immediately declined, because the reduction in the inflow of cheap money will not allow growth to continue, which means that the time has come for profit-taking. The news that will support the US dollar, as it gives it a chance to lead the yield race, will simultaneously contribute to the flight from risk. USD/CAD Canada's GDP growth of 5.4% in the 3rd quarter was unexpected. It was predicted about 3% or even less, since the negative impact of supply restrictions and a drop in agricultural production increased on economic activity, but, as it turned out, the lifting of restrictions and the associated rapid growth of the service sector compensated for all the disadvantages. Accordingly, arguments were added in favor of raising the rate before the Bank of Canada's meeting on December 8, and if it were not for a new COVID-19mutation, which for some reason looks very frightening at the moment, it would be possible to predict a decline in the USD/CAD pair. Now, we have to wait for the end of the panic, the rise in oil prices, and the removal of the threat of new lockdowns. Until this happens, there will be a low probability of decisive action by the BoC. It seems that investors also assume that the BoC will show moderation and will not hurry. The weekly change in futures for the Canadian dollar was -941 million, respectively, against the background of falling yields. The settlement price turned up, which reduces the likelihood of a downward reversal.
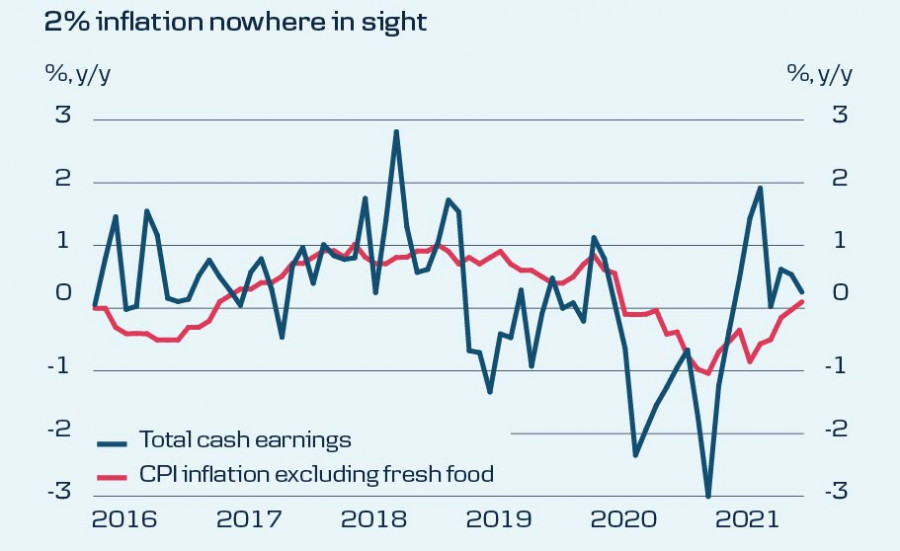
It can be assumed that until the panic subsides, the USD/CAD pair will continue to grow. The long-term target is shifting to the resistance zone of 1.2960/3010, the upward momentum is strong, and the chances of a corrective decline are weak. USD/JPY Since inflation in Japan is still close to zero, the Bank of Japan is dealing with a completely different reality than other major central banks. Although the rise in energy prices has led to a slight increase in inflation, the selling prices of enterprises are growing very slowly, and in general, it is unclear why to abandon incentives if there is no growing price pressure. Again, Japanese banks are very willing to pick up the flash mob regarding the terrible strain of Omicron and are already talking about the need to introduce new restrictions. Mizuho Bank broke into a panic article on this topic. This whole strategy is designed to delay the expiration of incentives as much as possible.
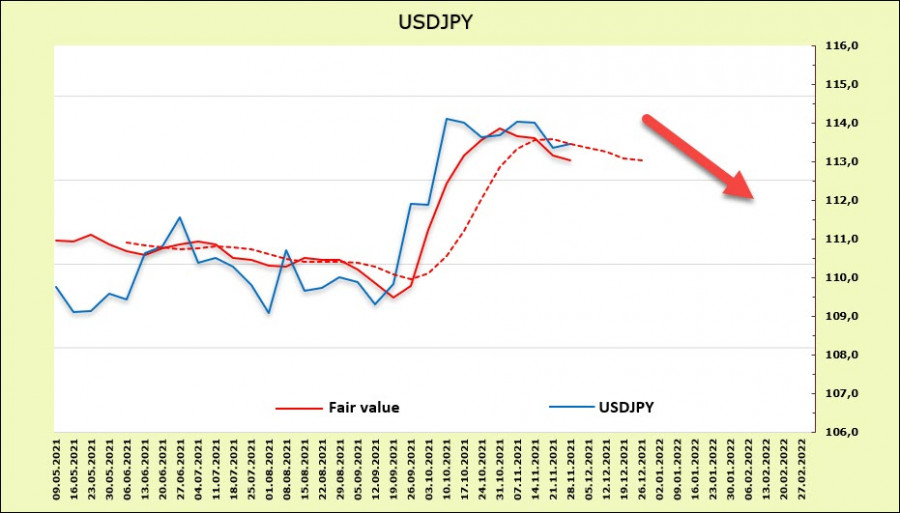
In fact, the BoJ reduced purchases of government bonds until 2021, without causing any surges in the yield curve, which has been fixed at 0% for 10-year T-bills since 2016. The weakening of the yen stimulates economic recovery. Why change what already works? According to the CFTC report, the net short position increased by 420 million to -10.56 billion. The mood of the players is frankly bearish and the estimated price is directed downwards. This may mean the probability of a downward correction amid the growth of panic, but it is unlikely that this decline will be prolonged.
An attempt to gain a foothold below the previous low of 112.75 was unsuccessful. Another attempt is possible, and if it is successful, a further decline to 11.90/112.10 is possible. However, a new base will most likely be found soon with an upward reversal. The material has been provided by InstaForex Company - www.instaforex.com |
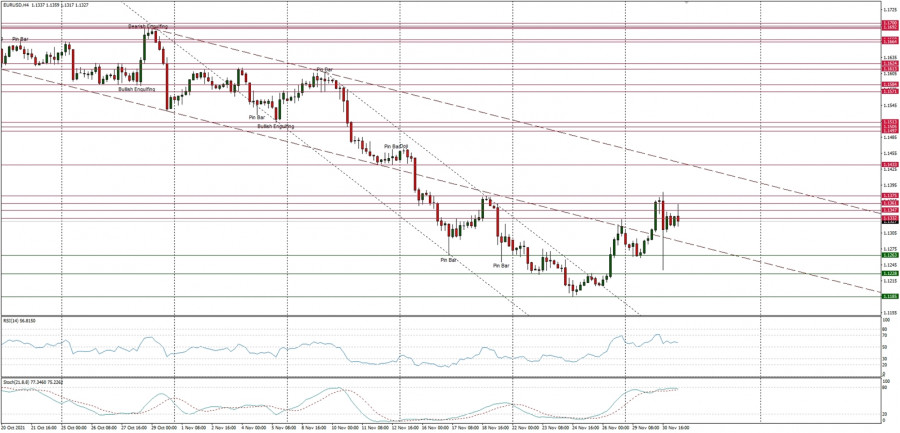
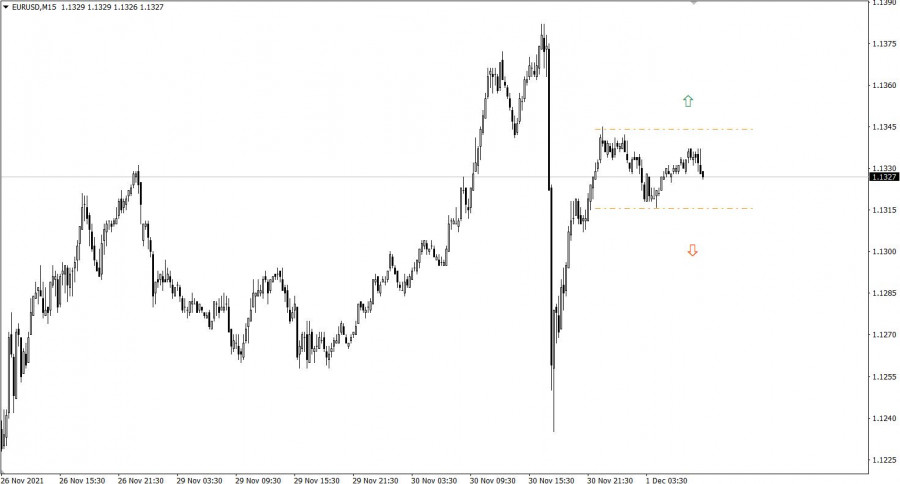
| Technical Analysis of EUR/USD for December 1, 2021 Posted: 01 Dec 2021 12:53 AM PST Technical Market Outlook The EUR/USD pair has bounced from the level of 1.1185, but was rejected from the main the key short-term technical resistance zone (supply zone) located between the levels of 1.1347 - 1.1375. Any violation of this supply zone would open the road towards the technical resistance located at 1.1433, but so far - no avail. The nearest technical support is seen at the level of 1.1263, so this level must be kept clean in order for the bounce to be continued. The strong and positive momentum supports the short-term bullish outlook for the EUR, however it does not look like a trend change or down trend termination. Weekly Pivot Points: WR3 - 1.1526 WR2 - 1.1423 WR1 - 1.1382 Weekly Pivot - 1.1279 WS1 - 1.1237 WS2 - 1.1137 WS3 - 1.1090 Trading Outlook: The market is in control by bears that pushed the price way below the level of 1.1501 and 1.1360, which was the lowest level since November 2020. The next important long-term target for bears is seen at the level of 1.1166. The up trend can be continued towards the next long-term target located at the level of 1.2350 (high from 06.01.2021) only if bullish cycle scenario is confirmed by breakout above the level of 1.1909 and 1.2000.
|
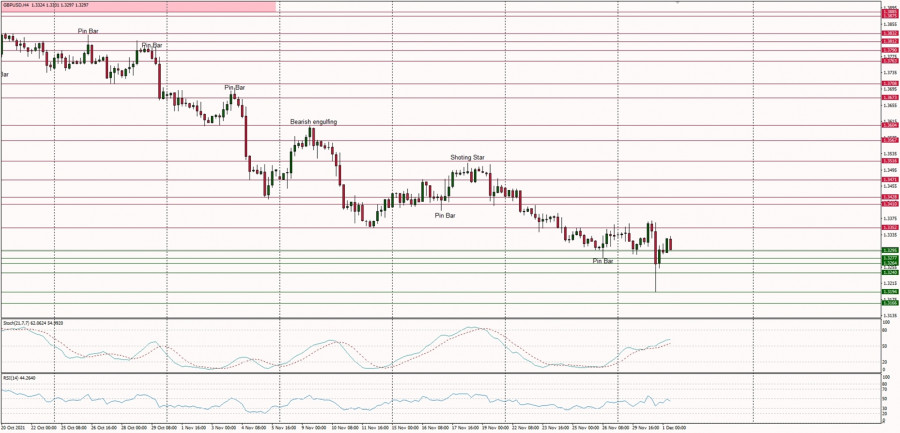
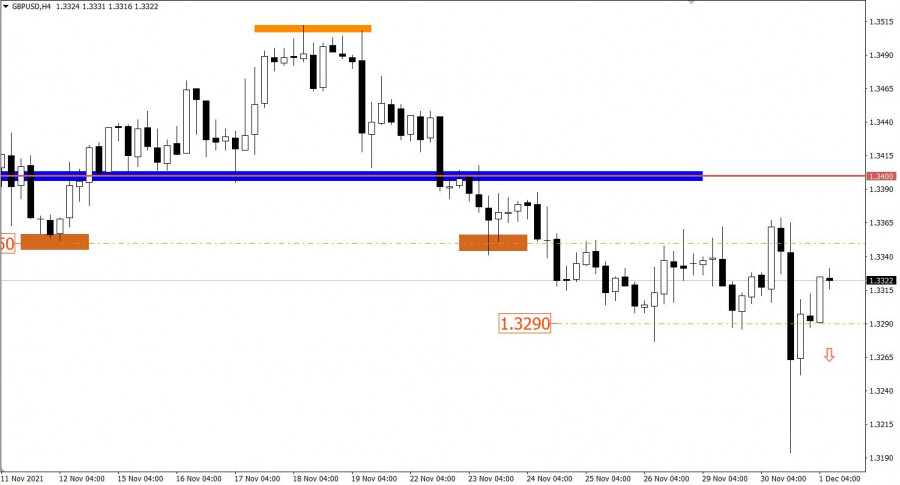
| Technical Analysis of GBP/USD for December 1, 2021 Posted: 01 Dec 2021 12:50 AM PST Technical Market Outlook The GBP/USD pair has made another lower low at the level of 1.3194 as the down trend continues. After the bounce from the lows, the nearest technical support is seen at the level of 1.3277, so this level must not be violated again in order for the bounce to be continued towards the technical resistance located at 1.3352. The positive momentum supports the short-term bullish outlook for the GBP, however it does not look like a trend change or down trend termination. Only a sustained breakout above the level of 1.3514 would change the outlook to more bullish. Weekly Pivot Points: WR3 - 1.3592 WR2 - 1.3524 WR1 - 1.3417 Weekly Pivot - 1.3347 WS1 - 1.3245 WS2 - 1.3173 WS3 - 1.3063 Trading Outlook: The down trend on a larger time frame charts is being continued, but only a sustained breakout above the level of 1.3514 would improve the outlook to more bullish with a target at 1.4200. 200 WMA is located at the level of 1.3387 and might provide some temporary support for bulls.
|
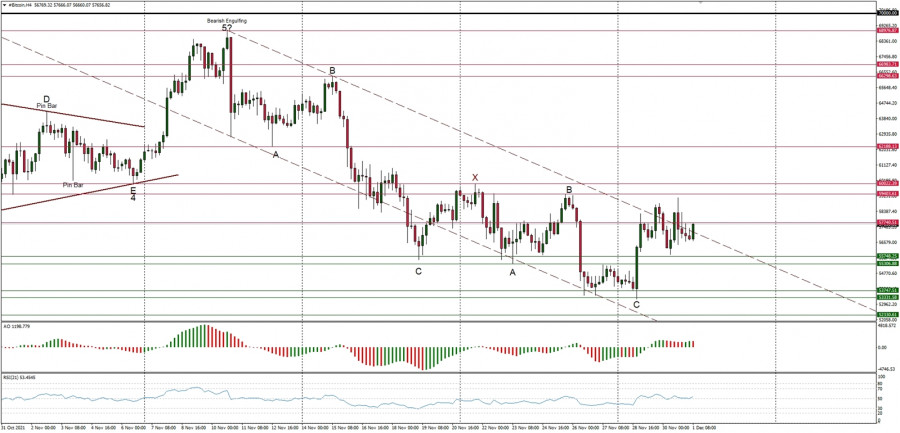
| Technical Analysis of BTC/USD for December 1, 2021 Posted: 01 Dec 2021 12:47 AM PST Crypto Industry News: Michael Saylor, CEO of MicroStrategy's corporate data analytics firm, announced via a Twitter post that the company had purchased an additional 7,002 Bitcoin worth approximately $ 414.4 million at an average price of $ 59,187 per coin. MicroStrategy sold 571,001 shares of the company between October 1 and November 29 for $ 732.16 per share, raising a total of $ 414.4 million. The company currently has 121,044 Bitcoins worth up to $ 3.57 billion. They were acquired at an average price of $ 29,534 and include the capital appreciation of the previous coins. In August 2020, MicroStrategy announced that it would adopt Bitcoin as its treasury reserve asset, citing digital currency as a "reliable means of custody" and an attractive investment with a greater long-term return potential than cash. In addition, the company stressed that stimulus packages printed by governments to combat COVID-19 are a catalyst for potential inflation and the subsequent depreciation of fiat currencies. Since then, MicroStrategy has almost consistently been buying Bitcoin every quarter. Technical Market Outlook After the ABCxABC complex corrective pattern might have been completed at the level of $53,331 the BTC/USD pair has bounced towards the wave B high seen at $59,403. The bulls are ready to resume the up trend again. The recent local high was made at the level of $59,195, but in order to confirm the up trend continuation bulls must break through the wave X high located at $60,013. The nearest technical support is seen at the level of $55,748 and $53,306. The larger time frame trend is still up. Weekly Pivot Points: WR3 - $65,476 WR2 - $62,564 WR1 - $59,328 Weekly Pivot - $56,242 WS1 - $53,008 WS2 - $49,857 WS3 - $46,541 Trading Outlook: The ABCxABC complex corrective cycle might be terminated. According to the long-term charts the bulls are still in control of the Bitcoin market, so the up trend continues and the next long term target for Bitcoin is seen at the level of $70,000. This scenario is valid as long as the level of $52,943 is clearly broken on the daily time frame chart (daily candle close below $52,000).
|
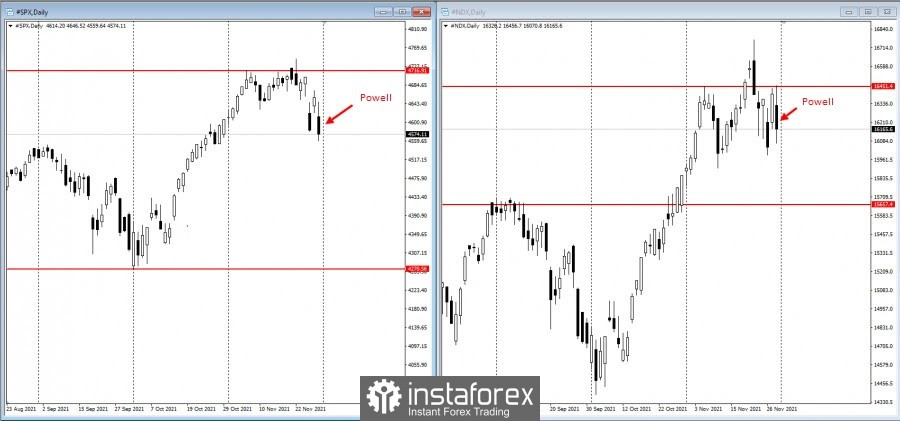
| US stock market dips over Powell's statement Posted: 01 Dec 2021 12:47 AM PST
US stocks fell on Tuesday after Fed Chairman Jerome Powell announced earlier dates for reducing bond purchases. He also told the Senate Banking Committee that it is time to stop using the word "temporary" to describe inflation, which is why traders increased their bets on early interest rate hikes. The S&P 500 dropped by almost 1.45% because of this.
But the first round of rate hike is still scheduled for July because Fed officials have consistently said they want to end the bond purchase program first before raising rates. In addition, in his opening remarks, Powell said the recent rise in Covid-19 cases and the emergence of the omicron strain pose "risks to employment and economic activity and heighten uncertainty about inflation." He also mentioned evidence of price increases since officials met on November 2-3. FBB Capital Partners research director Mike Bailey said: "Investors may have expected Powell to run for cover as the omicron variant threatens growth, However, he did an about-face and signaled faster tapering, spooking markets." Concerns over the impact of omicron also hit the markets on Tuesday, when executives at Moderna stated that numerous mutations indicate that new vaccines will be required. But the head of BioNTech SE said the current generation of vaccines can protect people who are infected with this variant from serious illnesses. The University of Oxford also stated that there was no evidence that existing shots will not provide some protection against the strain. Going back to economic statistics, consumer confidence in the US fell to a nine-month low in November, mainly due to rising Covid-19 cases and accelerating inflation. Final sales for Cyber Monday also fell short of estimates as scarce inventory kept shoppers from breaking out their credit cards at the start of the holiday shopping season. Other important events for this week are: - manufacturing PMI report in China (Wednesday); - manufacturing data in the eurozone (Wednesday); - construction costs and manufacturing activity in the US, Fed's Beige Book (Wednesday); - OPEC meeting on oil production (Thursday); - data on US jobless claims (Thursday); - report on US employment, production orders and durable goods (Friday). The material has been provided by InstaForex Company - www.instaforex.com |
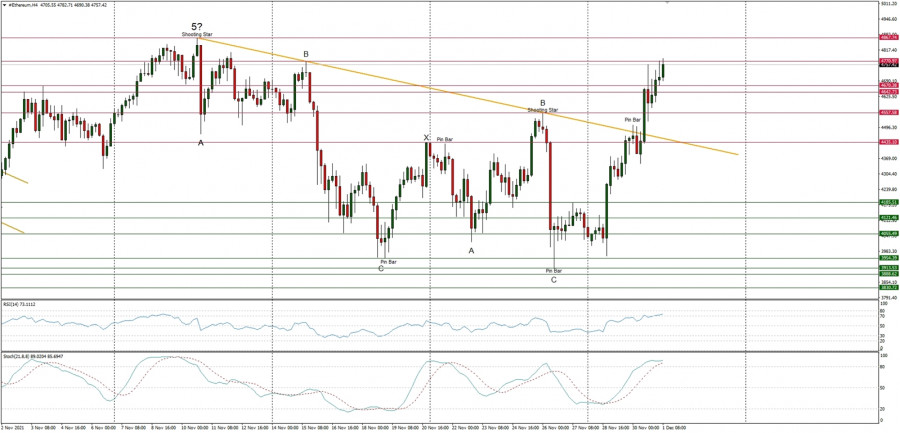
| Technical Analysis of ETH/USD for December 1, 2021 Posted: 01 Dec 2021 12:43 AM PST Crypto Industry News: According to a recent study, almost half of retail investors in Russia believe that cryptocurrencies like Bitcoin are hedging assets tied to a stable income. The survey was conducted among 1,000 Russian retail investors to find out what types of alternative investments are the most sought after. According to the study, as many as 46% of respondents perceived cryptocurrencies as a potential defensive resource allowing them to protect themselves against financial risk in times of economic crisis. Russian retail investors preferred cryptocurrencies over real estate, while only 37% of respondents investing in alternative assets considered buying real estate to be an effective investment vehicle. While real estate has historically been the most important hedging asset in Russia, cryptocurrencies have now become the biggest investment trend in 2021, after overtaking other traditional assets including currencies and foreign exchange stocks. According to a study by the Big Data Brand Analytics platform, Bitcoin was the most popular cryptocurrency in Russia in October, ahead of coins such as Tether and Litecoin in terms of social media mentions. In recent years, cryptocurrencies have become more and more popular with Russian investors. According to a study conducted last year, 77% of Russian investors prefer Bitcoin to gold. Technical Market Outlook After the ABCxABC complex corrective pattern might have been completed at the level of $3,910, the ETH/USD pair has broken above the short-term trend line resistance seen around the level of $4,481. The recent local high was made at the level of $4,782, so the up trend continuation had been confirmed. The nearest technical support is seen at the level of $4,670 and $4,642. The larger time frame trend is still up and the next target for bulls is seen at the level of $4,876 (last ATH). Weekly Pivot Points: WR3 - $5,126 WR2 - $4,890 WR1 - $4,581 Weekly Pivot - $4,237 WS1 - $3,938 WS2 - $3,595 WS3 - $3,100 Trading Outlook: The ABCxABC complex corrective cycle might be terminated, so the next long-term target for ETH is seen at the level of $5,000. Nevertheless, in order to continue the long-term up trend, the price can not close below the technical support at the level of $2,906. The level of $1,728 (61% Fibonacci retracement of the last big impulsive wave up) is still the key long-term technical support for bulls. The level of $3,677 is the key mid-term technical support for bulls.
|
| Trading plan for starters of EUR/USD and GBP/USD on December 1, 2021 Posted: 01 Dec 2021 12:40 AM PST |
| EUR/USD. Powell's hawkish attitude against the new variant of COVID-19 Omicron Posted: 01 Dec 2021 12:10 AM PST The EUR/USD pair was trading within the 150-point range yesterday, demonstrating increased volatility. The low of the day was consolidated at the level of 1.1235, while the high was at 1.1383. Such intraday flights are observed infrequently.Traders of this pair found themselves in an interesting position. On the one hand, there is a new strain of coronavirus Omicron, which scares with its increased contagiousness, and on the other hand, there is the Fed chairman Jerome Powell, who surprised with his "hawkish" attitude. It is not easy to solve such a riddle, given the fact that the same head of the Federal Reserve was concerned about the spread of a new "modification" of the COVID-19. There is no doubt – if it were not for Omicron, the EUR/USD pair would already be in the area of the 10th figure, playing off the hawkish rhetoric of the head of the American regulator. However, the market and the history do not tolerate the subjunctive mood. Therefore, the fact remains that yesterday's round was left to the buyers of EUR/USD, who were able to return the pair to the area of 1.13. The fear of Omicron overshadowed all other fundamental factors: the emotionally colored "apocalyptic scenario" of a repeat of 2020 prevailed.
But let's start with Powell. He really surprised. As part of yesterday's speech in the Senate, the Fed's head voiced the most important phrase that many experts and traders were waiting for. He said that given the recent trends, it's time to characterize US inflation in a different way, removing the word "temporary" in the definition. The Fed chairman admitted that inflationary growth in the United States is not temporary. This has been discussed for several months by many economists and currency strategists of the largest banks, as well as representatives of the "hawkish wing" of the Fed. The words voiced by Powell are an important circumstance of a fundamental nature. He unblocked the path to tightening the parameters of monetary policy. Moreover, the first step towards raising the rate will be taken already at the December meeting. We are talking about accelerating the pace of curtailing the incentive program. Recognizing the fact that inflation has ceased to be "temporary," Powell said that the curtailment of QE would be advisable to complete a few months earlier. He promised that he would raise this issue at the next Fed meeting, which will be held on December 14-15. This announcement "fits" into a hawkish scenario, which was voiced, in particular, by Goldman Sachs experts. They predicted the early completion of the stimulus program and a double rate hike in 2022 – in July and at one of the last meetings of next year. Initially, the Fed planned to complete QE by July next year, but, apparently, the program will be finally curtailed in early spring. It is likely that by June or July, the regulator will "mature" for the first round of interest rate increases. For now, we can talk about it not only in the context of hypothetical assumptions of the expert community. Yesterday's statement by Jerome Powell allows us to talk about the implementation of the hawkish scenario in a practical context. Why did the EUR/USD bears lose the initiative amid such circumstances? In my opinion, Omicron is to blame for everything. The new strain of coronavirus has not yet been fully studied, while numerous assumptions/guesses/observations frighten traders of the currency market. Scientists will only know in three to four weeks to what extent Omicron can bypass the immunity formed by vaccines or antibodies, and whether it leads to worse clinical symptoms. According to preliminary (not scientifically confirmed) data, Omicron is even more contagious than the Delta strain. Most likely, this will lead to a sharp spike in infection, which can put pressure on the medical system of many countries of the world. On the other hand, unofficial reports of doctors who treated patients with the Omicron strain in South Africa say that a new type of Covid causes mild symptoms – dry cough, fever, fatigue. There is no information about the effectiveness of vaccines in the context of Omicron yet. At the same time, the head of Pfizer has already stated that the Comirnaty vaccine will provide protection against the severe course of the disease when patients require hospitalization or intensive care. In addition, he stated that the company's specialists will modernize the drug within 2-3 months, taking into account the properties of Omicron. Therefore, the information hype around the new COVID-19 strain overshadowed the speech of Fed Chairman Jerome Powell, who actually announced the tightening of monetary policy parameters. The USD bulls lost the round but did not lose the fight. After all, it should be noted that the chairman of the Federal Reserve laid the foundation for further strengthening of the US currency – and even more so paired with the euro, which is under the background pressure of the "dovish" position of the European Central Bank. As soon as the panic about Omicron comes to naught, which might happen next week, the "classic" fundamental factors will be included in the work, which will be on the side of the US dollar and especially paired with the euro.
Therefore, it is currently best to take a wait-and-see position for the EUR/USD pair or open short positions, with downward targets of 1.1280 (the Tenkan-sen line on D1) and 1.1186 (this year's low). In my opinion, the market underestimated the importance of yesterday's event. After all, Powell joined the hawkish camp of the Fed by toughening his rhetoric. There is no doubt that having implemented the first stage (early curtailment of QE), the regulator will proceed to the second stage, which involves a gradual but consistent increase in the interest rate. The material has been provided by InstaForex Company - www.instaforex.com |
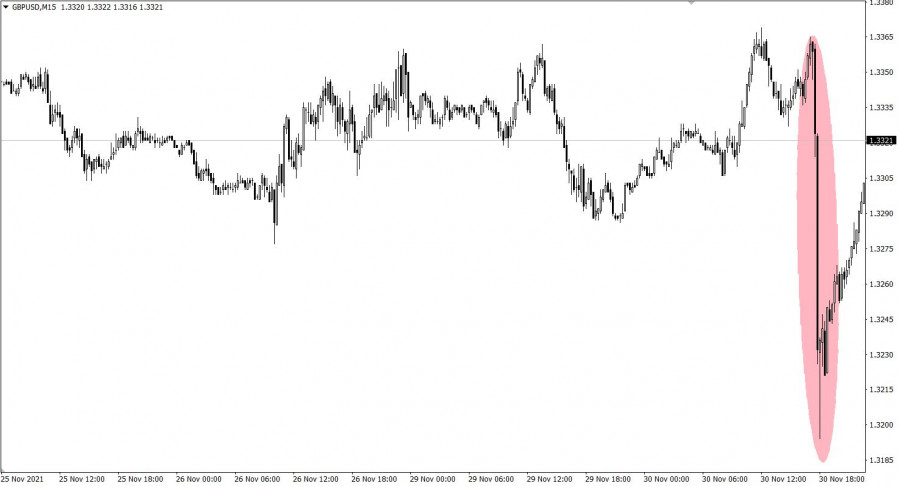
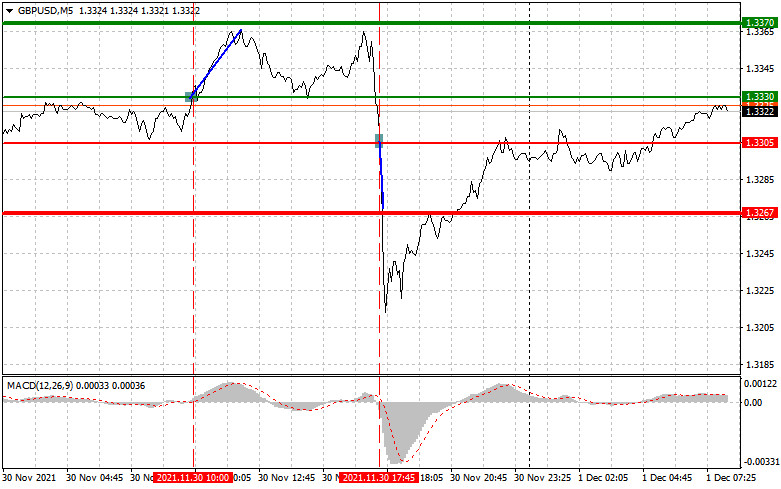
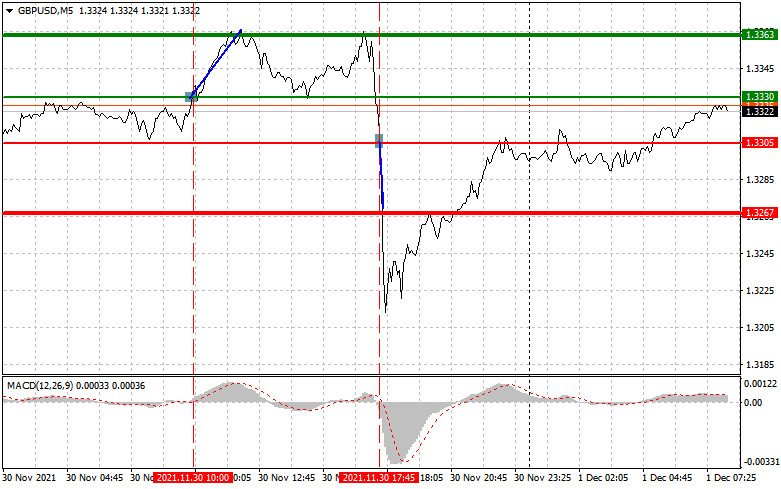
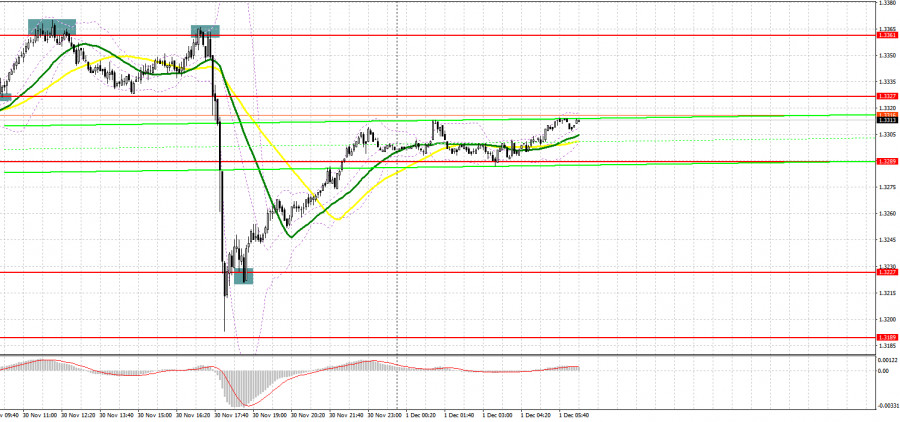
| Analysis and trading tips for GBP/USD on December 1 Posted: 30 Nov 2021 11:55 PM PST Analysis of transactions in the GBP / USD pair Pound rose by 35 pips on Tuesday due to a signal to buy that appeared when the MACD line was above zero. But after the speech of Fed Chairman Jerome Powell, the quote fell and tested 1.3305, which provoked a signal to sell. At this moment the MACD line was under zero, so the pair moved further down by 40 points.
GBP / USD fell yesterday afternoon after Fed Chairman Jerome Powell said the central bank will wind down bond purchases faster than initially projected. But today the situation may change as the UK will report data on manufacturing PMI, which may raise demand for pound and bring buyers to the market. The speech of Bank of England Governor Andrew Bailey will also be important as it could help pound get out of the flat market if it hints at a more aggressive approach on monetary policy. In the afternoon though, strong US PMI report, employment data and hawkish statements from Fed chairman Jerome Powell and Treasury Secretary Janet Yellen could bring demand back to dollar, which, in turn, will push GBP / USD down. For long positions: Buy pound when the quote reaches 1.3330 (green line on the chart) and take profit at the price of 1.3363 (thicker green line on the chart). An increase will be observed if manufacturing activity in the UK exceeds expectations. The speech of Bank of England Governor Andrew Bailey will also be important. Before buying, make sure that the MACD line is above zero, or is starting to rise from it. It is also possible to buy at 1.3305, but the MACD line should be in the oversold area, as only by that will the market reverse to 1.3330 and 1.3363. For short positions: Sell pound when the quote reaches 1.3305 (red line on the chart) and take profit at the price of 1.3267. A decline will occur if Bailey does not change his stance on monetary policy. Before selling, make sure that the MACD line is below zero, or is starting to move down from it. Pound can also be sold at 1.3330, but the MACD line should be in the overbought area, as only by that will the market reverse to 1.3305 and 1.3267.
What's on the chart: The thin green line is the key level at which you can place long positions in the GBP/USD pair. The thick green line is the target price, since the quote is unlikely to move above this level. The thin red line is the level at which you can place short positions in the GBP/USD pair. The thick red line is the target price, since the quote is unlikely to move below this level. MACD line - when entering the market, it is important to be guided by the overbought and oversold zones. Important: Novice traders need to be very careful when making decisions about entering the market. Before the release of important reports, it is best to stay out of the market to avoid being caught in sharp fluctuations in the rate. If you decide to trade during the release of news, then always place stop orders to minimize losses. Without placing stop orders, you can very quickly lose your entire deposit, especially if you do not use money management and trade large volumes. And remember that for successful trading, you need to have a clear trading plan. Spontaneous trading decisions based on the current market situation is an inherently losing strategy for an intraday trader. The material has been provided by InstaForex Company - www.instaforex.com |
| Daily Video Analysis: AUDUSD, H4 Strong Bearish Channel Posted: 30 Nov 2021 11:45 PM PST Today we take a look at AUDUSD. Combining advanced technical analysis methods such as Fibonacci confluence, correlation, market structure, oscillators and demand/supply zones, we identify high probability trading setups. The material has been provided by InstaForex Company - www.instaforex.com |
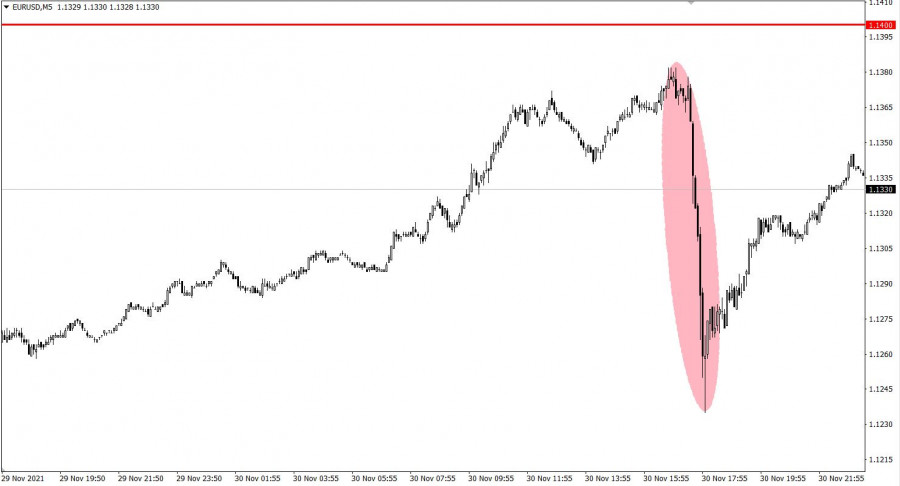
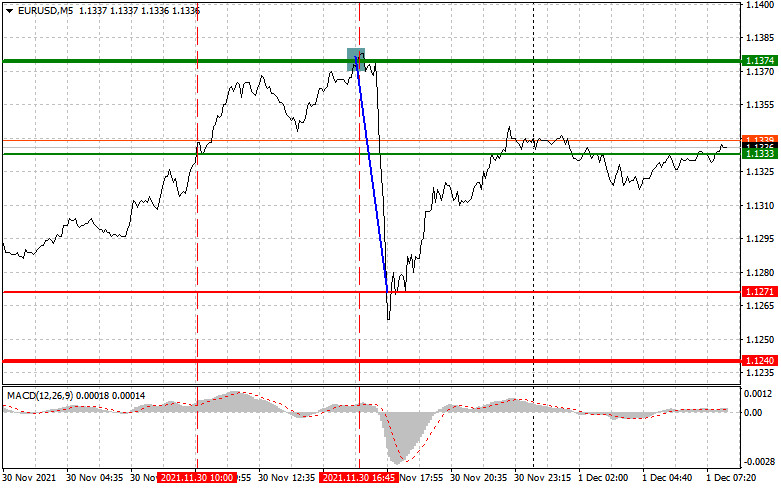
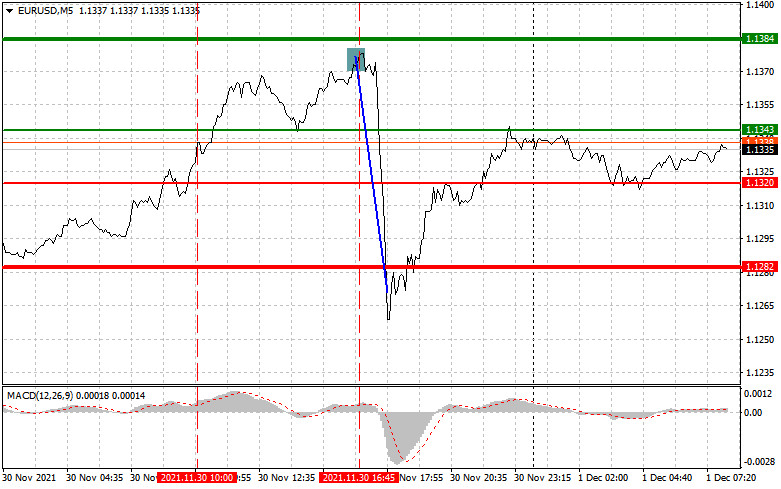
| Analysis and trading tips for EUR/USD on December 1 Posted: 30 Nov 2021 11:36 PM PST Analysis of transactions in the EUR / USD pair A signal to sell appeared in the market on Tuesday, but there was no decrease even though the MACD line was at the overbought area. EUR / USD continued to rise instead, dealing losses to bearish traders. But later on the pair collapsed by more than 100 pips amid a signal to sell at 1.1374.
Consumer spending and GDP data in France and Italy did not make an impression on traders, but inflation in the eurozone did. The reported growth provoked a rally in euro because the situation could force the European Central Bank to reconsider its attitude on stimulus measures. But in the afternoon, the speech of Fed Chairman Jerome Powell caused the currency to plummet as it expressed the plans of the US central bank to wind down bond purchases more quickly. There may be another rally today as reports on manufacturing activity in France, Germany, Italy and the whole eurozone will be released. Strong performances will lead to an increase in euro and return to daily highs. But in the afternoon, the US will release a similar report, which could bring demand back to dollar. Good employment data from the ADP and hawkish statements from Fed chairman Jerome Powell and Treasury Secretary Janet Yellen will also raise USD up. For long positions: Buy euro when the quote reaches 1.1343 (green line on the chart) and take profit at the price of 1.1384. Demand will increase if statistics in France, Germany and Italy exceed expectations. But growth will be limited by possible problems with the new coronavirus strain Before buying, make sure that the MACD line is above zero, or is starting to rise from it. It is also possible to buy at 1.1320, but the MACD line should be in the oversold area, as only by that will the market reverse to 1.1343 and 1.1384. For short positions: Sell euro when the quote reaches 1.1320 (red line on the chart) and take profit at the price of 1.1282. Weak data on the eurozone and hawkish statements from the Fed will provoke a decrease in EUR / USD. Before selling, make sure that the MACD line is below zero, or is starting to move down from it. Euro could also be sold at 1.1343, but the MACD line should be in the overbought area, as only by that will the market reverse to 1.1320 and 1.1282.
What's on the chart: The thin green line is the key level at which you can place long positions in the EUR/USD pair. The thick green line is the target price, since the quote is unlikely to move above this level. The thin red line is the level at which you can place short positions in the EUR/USD pair. The thick red line is the target price, since the quote is unlikely to move below this level. MACD line - when entering the market, it is important to be guided by the overbought and oversold zones. Important: Novice traders need to be very careful when making decisions about entering the market. Before the release of important reports, it is best to stay out of the market to avoid being caught in sharp fluctuations in the rate. If you decide to trade during the release of news, then always place stop orders to minimize losses. Without placing stop orders, you can very quickly lose your entire deposit, especially if you do not use money management and trade large volumes. And remember that for successful trading, you need to have a clear trading plan. Spontaneous trading decisions based on the current market situation is an inherently losing strategy for an intraday trader. The material has been provided by InstaForex Company - www.instaforex.com |
| Inflation caused the euro to collapsed Posted: 30 Nov 2021 11:35 PM PST
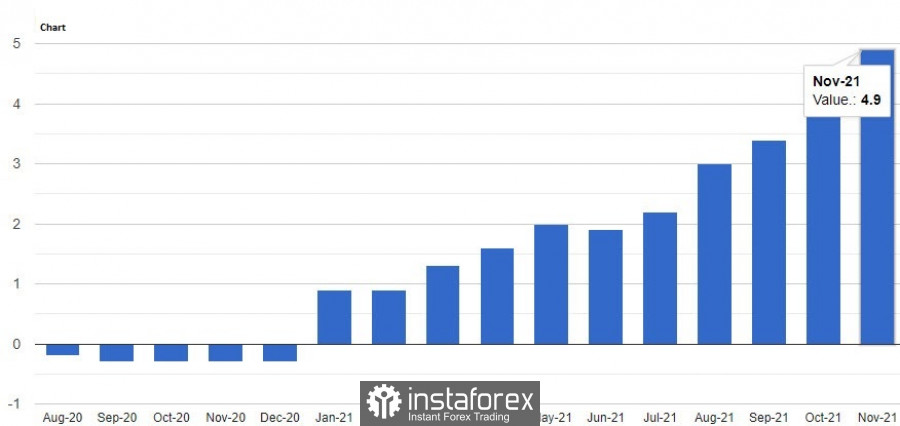
The Euro has been struggling to maintain its position for several days. The battle took place with varying success. This currency was tripped up by inflation, which reached its peak values. Earlier, the European currency was under pressure due to the ECB's "dovish" rhetoric. It can be recalled that the regulator do not plan to curtail its asset purchase program and raise rates in the near future. However, the extremely high inflation recorded in the eurozone may make adjustments to the ECB's current plans. According to the Eurostat report, the EU annual consumer inflation in November accelerated to an impressive 4.9%. Such a price turn shocked the markets, which will have to adapt to the new reality. The current figures exceeded experts' expectations who expected consumer prices to rise to 4.5%. Compared to the previous month, this indicator increased by 0.5%. According to the agency, November's consumer prices in the eurozone, excluding energy, food, and alcohol, soared by 2.6% year-on-year. At the same time, the cost of energy is off the scale, rising by an impressive 27.4% (compared to 23.7% recorded in October). Prices for food, alcohol, and tobacco products increased by 2.2%, and services rose by 2.7%. The dizzying growth in energy prices has contributed to a sharp increase in the cost of living in Europe. The widespread rise in the cost of services and products negatively affected the overall level of costs and led to problems with supply chains. According to analysts, the rise in energy prices has led to a cosmic turn of European inflation. Last month, its growth rate became the highest in the history of the euro block. At the moment, the inflation rate is much higher than the target of 2%. This increases the pressure on the ECB, whose representatives recently declared the "temporary nature" of high inflation, justifying the reluctance to take drastic measures. However, harsh reality dictates its own conditions, which cannot be ignored. The tense inflationary background puts pressure on the euro but does not deprive it of hope for growth. On Tuesday, the euro noticeably strengthened and gained 0.5%, reaching the level of 1.1367. Over the past three trading sessions, it has risen by 1.3%. Earlier, the single currency rose to an intraday high of 1.1373, demonstrating the largest three-day growth streak this year. This allowed analysts to assume that the Euro currency will consolidate in the upward trend. However, a miracle did not happen: on Wednesday morning, it noticeably collapsed, although it is far from giving up. This currency is not going to give up, although its dynamics are uneven, and its further rise is questionable. On the same morning, the EUR/USD pair was near the level of 1.3334 and then slipped to the level of 1.1324. Experts said that the pair is moving around the consolidation zone after a surge in volatility.
Experts admitted the possibility of the euro's growth amid a strong reduction in the number of short positions on it. Many traders took this step after the statement of Stephane Bansel, CEO of Moderna. Earlier, the head of the pharmaceutical concern suggested that the existing anti-covid vaccines are unlikely to be effective against the new mutation of the coronavirus "Omicron". The comments of the Moderna CEO have increased the current uncertainty and tension, calling into question the speedy recovery of the global economy. Many analysts consider the reduction of short positions on EUR to be another struggle from the new version of COVID-19. Panic is a bad adviser because it pushes traders to impulsive actions. Fearing the deterioration of the situation, market players are trying to get at least some profit, but these actions do not always lead to the desired result. Currently, traders hurried to reduce large positions opened in the expectation of an increase in interest rates from the Fed. Market participants believe that the US regulator will do this faster than its European counterpart. The calculation turned out to be correct. It remains to be hoped that in the current conditions, the ECB will reconsider its previous strategy and follow the Fed. It can be recalled that Fed chairman Jerome Powell announced the regulator's readiness to accelerate the pace of curtailing asset purchases and raise rates in the near future. The catalyst for this decision was the off-scale inflation rate, which the head of the Federal Reserve drew attention to. He is confident that extremely high inflation justifies the accelerated curtailment of bond purchases. The final decision will be made at the December meeting scheduled for December 14-15. If this measure is implemented (while reducing the volume of bond purchases by $30 billion per month), the incentive program will end in March 2022. This will provide the central bank with room for maneuver regarding a potential rise in interest rates. It is possible that the European regulator will follow his example, and this will have a positive impact on the eurozone economy and the euro's dynamics. The material has been provided by InstaForex Company - www.instaforex.com |
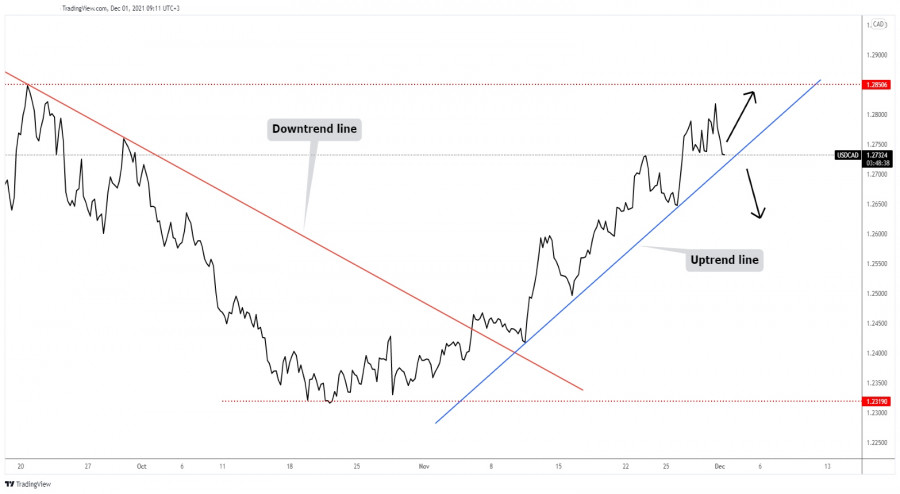
| USD/CAD making temporary decline? Posted: 30 Nov 2021 11:33 PM PST
USD/CAD Uptrend Is Still Intact!The USD/CAD pair is trading at the 1.2731 level after failing to stabilize above the 1.2800 psychological level. After jumping above the previous downtrend line, the pair developed an uptrend. It could resume its growth as long as it stays above the uptrend line. The current decline could be only a temporary one. It could test and retest the uptrend line before jumping towards new highs. 1.2850 stands as a major upside target if the rate resumes its upwards movement. Technically, only dropping and stabilizing below the uptrend line could signal that the upside movement is over and that USD/CAD could develop a new downtrend. USD/CAD Trading Conclusion!Normally, this could be only a temporary decline thhat could help the buyers could search for new buying opportunities from around the uptrend line with potetial upside target at the 1.2850. The Stop Loss order could be hidden somewhere below the uptrend line. On the other hand, dropping below the uptrend line, testing and retesting the broken line could signal a downside movement. The material has been provided by InstaForex Company - www.instaforex.com |
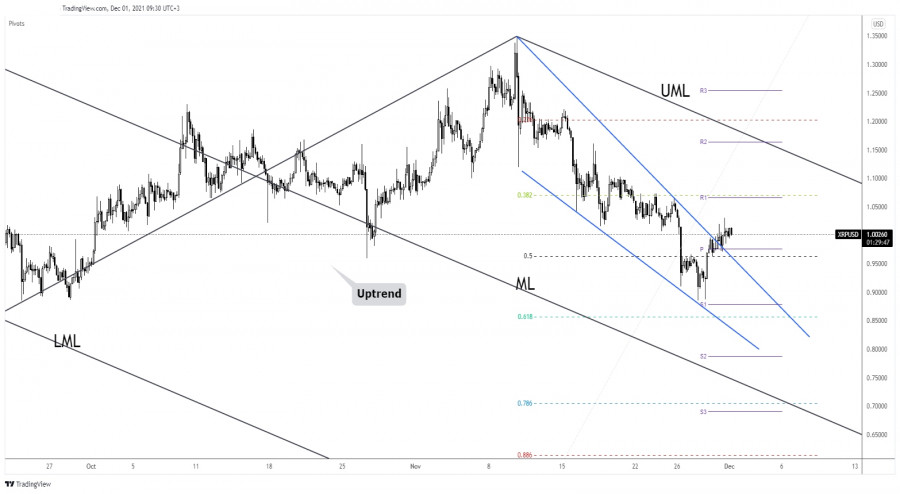
| Ripple reversal pattern violated Posted: 30 Nov 2021 11:31 PM PST Ripple resumed its rebound and now it's trading at 1.0059 level. Still, after its rally, XRP/USD could come back to test and retest the immediate support levels before resuming its upside journey. Technically, the price action signaled that the downside movement is over and that the buyers could take full control. I've told you in my previous analysis that XRP/USD developed a bullish pattern, a reversal pattern. In the last 24 hours, the crypto is up by 2.20% but is in the red by 3.19% in the last 7 days. It remains to see if the price will have enough energy to stabilize above the 1.0 psychological level. XRP/USD 1.0 Psychological Level Breakout!
XRP/USD registered only false breakouts below the 0.9000 psychological level signaling an oversold. It has developed a Falling Wedge pattern and now it has managed to escape from this chart formation. As long as it stays above the 50% (0.9637) retracement level and above the 0.9765, Ripple could extend its upwards movement. XRP/USD Forecast!A minor consolidation above 1.0 psychological level could signal an upside continuation and could bring new long opportunities. After failing to approach and reach the median line (ML), XRP/USD could be attracted by the upper median line (UML). The material has been provided by InstaForex Company - www.instaforex.com |
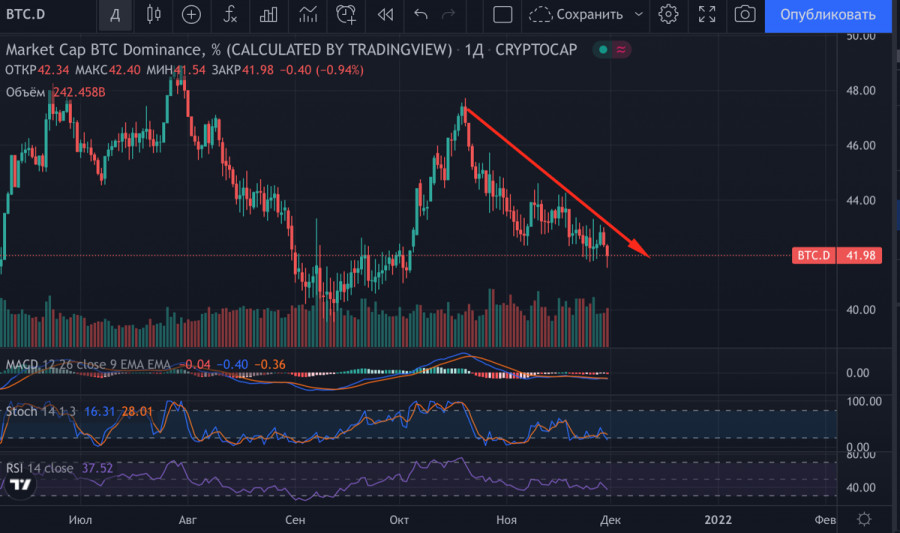
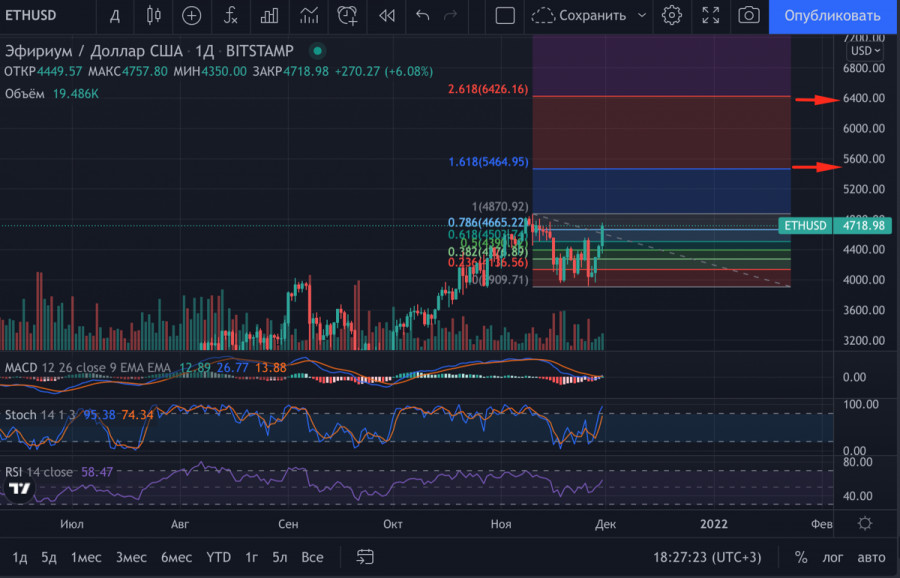
| Tips for trading during Ethereum's momentum rally Posted: 30 Nov 2021 10:54 PM PST Thanks to a combination of two important factors, Ethereum has resumed its bullish rally and is heading towards a new historical record. The first important prerequisite for ETH's rapid growth is the successful holding of the area above $4.3k, which set the market up for a bullish scenario. The second factor that allowed ether to begin its upward movement was the bitcoin's sagging dominance, which gave ether an opportunity for price movement.
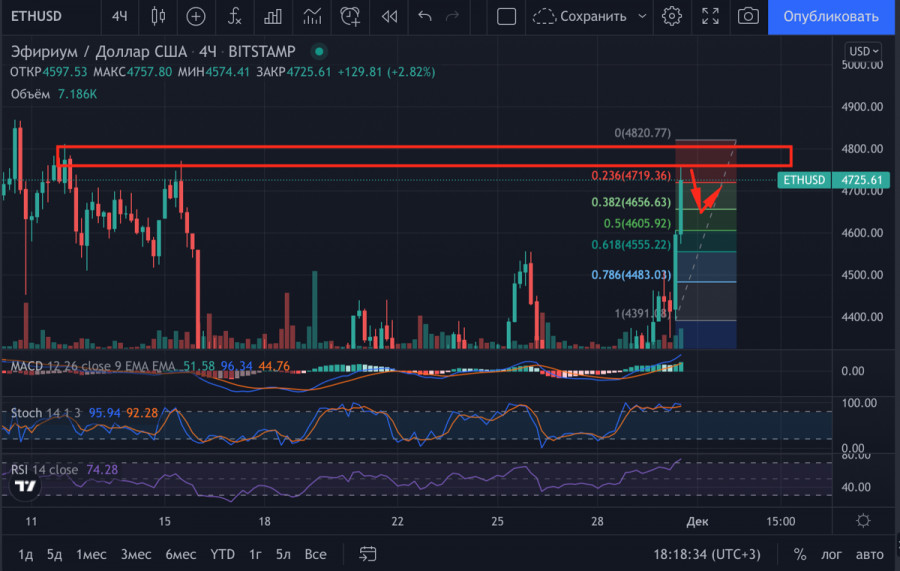
In addition, the fundamental news backdrop was also strengthened by positive news on Ethereum. First of all, it is worth mentioning that a record 4 million users of decentralized applications and platforms on the ETH blockchain were reached. Many experts have noted that the growth of Ethereum is directly linked to the development of related projects. It has also been reported that Kelly Strategic Management has applied to the SEC for a futures ETH ETF. Given the great success of the futures exchange-traded fund on bitcoin, investors reacted positively to the news, so the coin's exchange rate started to go up. Notably, Ethereum has started an impulsive growth, which can be identified by the long body of the candle. Such a spike in value is characterized by the formation of several long candles in a row. Therefore, a price pullback follows after the impulse is completed. In most cases, the potential for price movement in the opposite direction from the momentum movement is equal to the Fibonacci level. It is worth drawing on the narrow chart from the beginning of the momentum moving to its end. I drew the levels based on the fact that most of the structure of the sharp rise has been formed and the upward movement will soon start to slow down. Therefore, the levels are drawn from the start of the rally to the absolute high line, where the price is likely to start to pull back. There are two conditions that make good profits on pullbacks after an impulse rise: the correct drawing of Fibonacci levels and the important rule of candlestick analysis. Having drawn levels from the beginning to the end of an impulse growth, the rule, according to which the middle of a long candle is a good support zone, should be followed. In combination with Fibonacci levels, this information allows you to determine the potential for price movement. As for Ethereum, a pullback is likely from the Fibonacci level of 0.236 to $4650, where the Fibonacci level of 0.382 and the middle of the big green candle is located. With stop-losses slightly above the previous high, one can preserve capital in case of a price reversal or continued upward movement, while take-profit can keep profits around $4.6k to avoid waiting for a price rebound upwards.
To determine the prospect of price movement within the current bullish rally of Ethereum, the Fibonacci levels on the daily timeframe need to be drawn. The initial point will be the start of the correction, i.e. the current all-time high of November 10. The final point will be the low of $3.9k on November 26. With this action, we see that the nearest target outside the current ATH is $5.4k, where the Fibonacci level of 1.618 passes. Most likely, the final bull market point for Ethereum will be the $6.4k mark, where the 2.618 Fibonacci level line is located.
|
| USDCHF short-term bullish bounce | 1st Dec 2021 Posted: 30 Nov 2021 10:52 PM PST
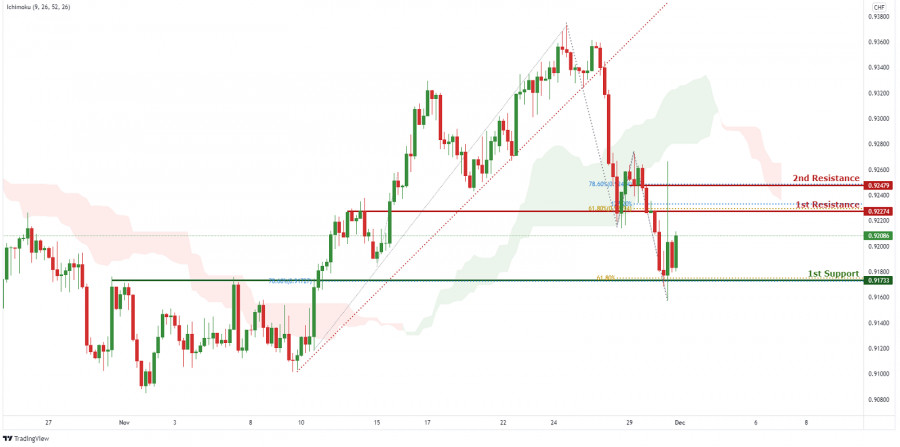
On the H4 timeframe, price broke out of the ascending trendline support, signifying an overall bearish momentum. We can expect price to drop from 1st Resistance in line with 127.2 % Fibonacci projection and 61.8% Fibonacci retracement towards 1st Support in line with 61.8% Fibonacci projection and 78.6% Fibonacci retracement. Our bearish bias is further supported by the price holding below the Ichimoku Cloud. Trading Recommendation Entry:0.92274 Reason for Entry: 127.2 % Fibonacci projection and 61.8% Fibonacci retracement Take Profit: 0.91733 Reason for Take Profit: 61.8% Fibonacci projection and 78.6% Fibonacci retracement Stop Loss: 0.92479 Reason for Stop Loss: 78.6% Fibonacci retracement The material has been provided by InstaForex Company - www.instaforex.com |
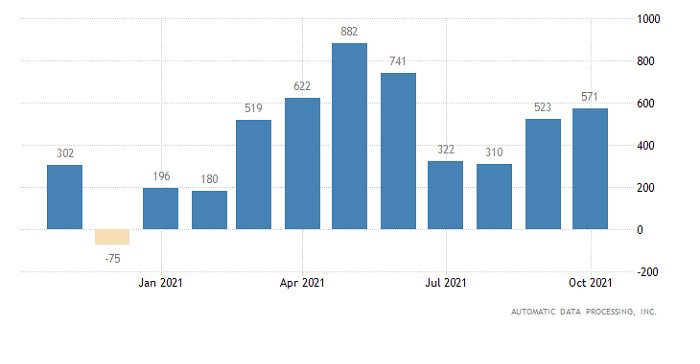
| Breaking forecast for GBP/USD, December 1st Posted: 30 Nov 2021 10:51 PM PST Jerome Powell's speech in the Senate triggered volatility in the market. Following the speech, there was a big drop in many markets, while the US dollar managed to grow higher. However, immediately after the collapse, markets began to recover. Many analysts believe that such strange behavior of markets could be due to some kind of speculation. The fact is that after Powell began to present his annual report to the senators, almost all the largest media agencies worldwide revealed news about Jerome Powell's hawkish tone. For instance, they said that the Fed would tighten monetary policy quicker than expected and more aggressively than planned. Naturally, traders were highly concerned about such a possibility. It triggered panic across markets. Curiously enough, in the transcript of Jerome Powell's speech, there was not a single word about monetary policy tightening. He did not even touch the topic of quantitative easing tapering. Perhaps the media did not mean the speech itself but Powell's answers to tricky questions from senators. However, if you carefully study the countless publications in the media on this topic, there is not a single reference to Powell's words. There were only comments and predictions of various representatives of the financial sector, namely those organizations that carry out exchange operations. They claim that Jerome Powell's speech had a hawkish tone. Investors calmed down quickly amid this discrepancy between media reports and reality. This was the reason for a rebound in the market Apparently, it was just a banal attempt to manipulate markets. By the way, it is viewed as a criminal offense in the US and other countries. However, nobody was punished. In the US, freedom of speech is valued above all else. Of course, it was an unfair game. Some people uncured losses. Unfortunately, sometimes such situations occur. This is why investors should be extremely cautious and check the information twice before making a decision. The US dollar was not affected by the current market panic. On the contrary, it managed to gain momentum. The greenback has been rising since spring. This is why many analysts are now betting on a long-term rally of the US dollar as they see no reasons for its decrease. Today, the US will unveil its jobs data. The economy is expected to add 580,000 new jobs. Last month, the figure totaled 571,000. To achieve stability in the labor market, the economy should add 150,000 jobs a month taking into account the rate of population growth and economic activity. The unemployment rate has already reached 4.6%, which is below the Fed's target level of 5.0%. So, the labor market seems to be stabilizing. It is bullish for the greenback. Thus, the US dollar is highly likely to grow further. US employment data:
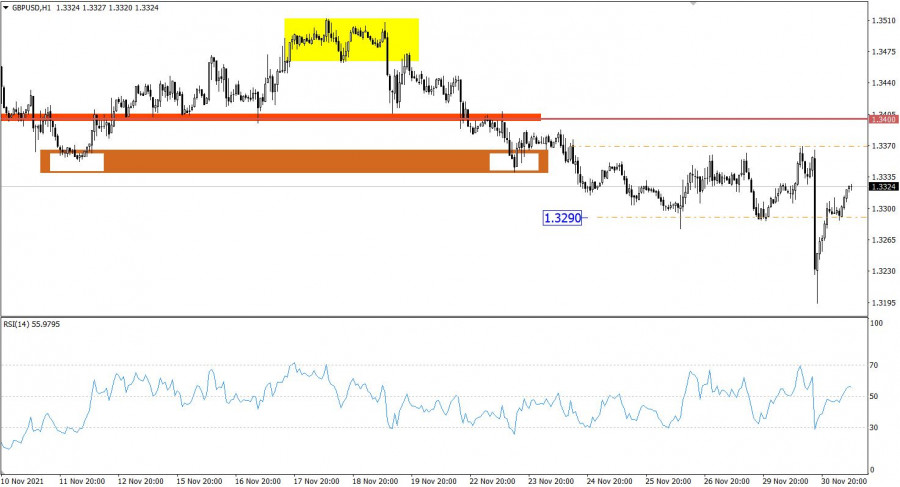
After having stuck in the range of 1.3290/1.3370 for some days, the GBP/USD pair moved down. As a result, it broke through the lower limit of the sideways channel, approaching a new low. However, bears did not enjoy their victory for long. Later, the pair recovered to its previous levels. On the 4H and D1 charts, the RSI indicator has been moving between the 30 and 50 lines for the eighth trading day in a row. This signals an increase in short positions. The D1 chart shows a gradual decline in the pound sterling, which has already led to big price changes within 6 months. Outlook: Despite the fact that the sideways range of 1.3290/1.3370 has already been broken, the price returned again to these levels. If the price holds outside of a particular border on a 4H chart, it may well indicate its next movement. The complex indicator analysis signals long positions on short-term and intraday charts amid the price recovery after a recent jump. Technical indicators show a bearish momentum, signaling short positions on the medium-term timeframes due to the ongoing downward movement.
|
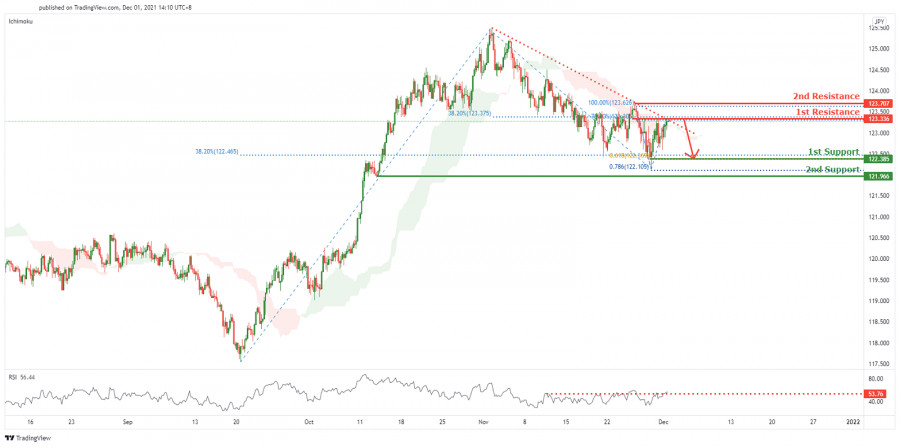
| CHFJPY Potential For Dips | 1st Dec 2021 Posted: 30 Nov 2021 10:50 PM PST
Prices are on a bearish momentum and abiding to our bearish trendline. We see potential for continuous dip from our 1st resistance at 123.336 in line with 78.6% and 38.6% Fibonacci retracement and also graphical overlap towards our 1st support at 122.385 in line with 61.8% Fibonacci extension and 38.2% Fibonacci retracement. Breaking the 1st support will find prices dipping further towards our 2nd support at 121.966 in line which is a graphical swing low. RSI is at a level where dips previously occurred. Alternatively, our stop loss will be placed at 2nd resistance at 123.707 in line with 100% Fibonacci extension. Trading Recommendation Entry: 123.336 Reason for Entry: 78.6% and 38.6% Fibonacci retracement and also graphical overlap Take Profit: 122.385 Reason for Take Profit: 61.8% Fibonacci extension and 38.2% Fibonacci retracement Stop Loss: 123.707 Reason for Stop Loss: 100% Fibonacci extension The material has been provided by InstaForex Company - www.instaforex.com |
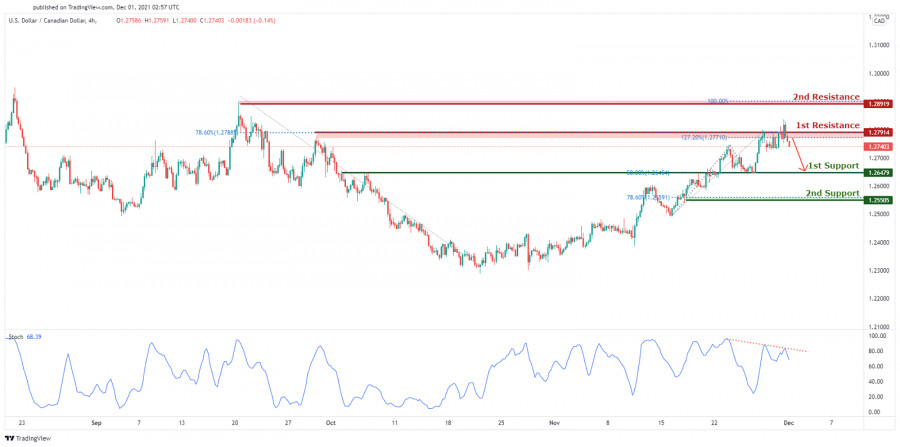
| USDCAD Bearish Pressure | 1st Dec 2021 Posted: 30 Nov 2021 10:48 PM PST
On the H4, with price rejecting the resistance on the stochastics indicator, we have a bearish bias that price will drop to 1st support at 1.26479 in line with the graphical overlap support and 50% Fibonacci retracement and possibly to 2nd support at 1.25505 in line with the graphical swing low support and 78.6% Fibonacci retracement from 1st resistance at 1.27914 in line with the horizontal swing high resistance and 127.2% Fibonacci extension level. Alternatively, we may see price break 1st resistance structure and head for 2nd resistance at 1.28919 in line with the horizontal swing high resistance and 100% Fibonacci projection. Trading Recommendation Entry: 1.27914 Reason for Entry: Horizontal swing high resistance and 127.2% Fibonacci extension level Take Profit: 1.26479 Reason for Take Profit: Graphical overlap support and 50% Fibonacci retracement Stop Loss: 1.28919 Reason for Stop Loss: Horizontal swing high resistance and 100% Fibonacci projection. The material has been provided by InstaForex Company - www.instaforex.com |
| High inflation in the US is no longer 'temporary' Posted: 30 Nov 2021 10:44 PM PST Risky assets tumbled yesterday after seeing gains during the European session. The reason was the rapidly growing inflation in the eurozone, which became the main driver of growth in dollar during the US session.
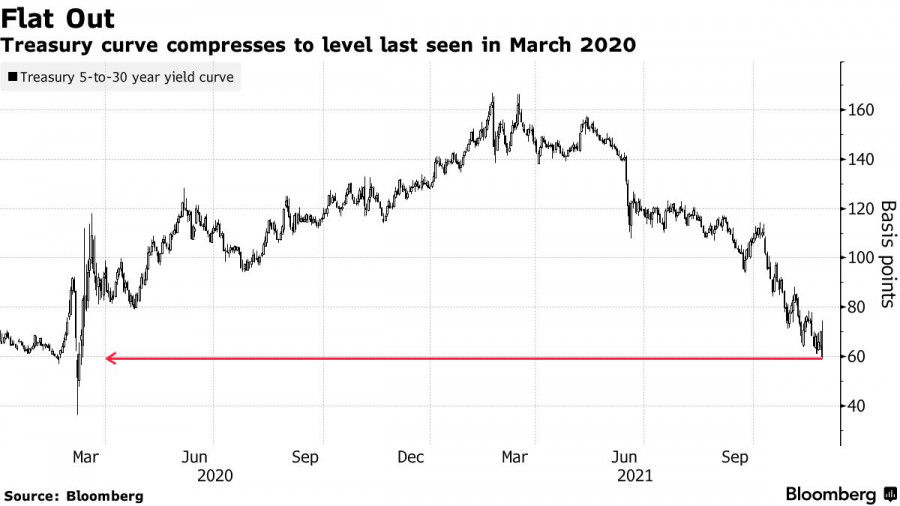
Fed Chairman Jerome Powell said a strong US economy and high inflation could force the central bank to stop buying bonds earlier than planned despite the new omicron coronavirus strain that was discovered and poses a new risk for the future. "I think it is appropriate for us to discuss the prospects for a more active rollback of support measures at the next meeting, which will take place in a couple of weeks," Powell said. "During these two weeks, we will try to get as much useful data as possible to understand how the new strain of coronavirus could affect the economy in the future," he added. The Fed is currently planning to end its bond purchase program in mid-2022, in line with the plan announced in early November. But at the next meeting on December 14-15, members may decide to speed up the completion of the program. Many traders assume that Powell would do it more smoothly because of inflation and the need to support the economy in the wake of the new coronavirus pandemic. Unsurprisingly, the US stock market also declined, while the yield on US Treasuries flattened. This suggests that investors are increasingly betting on a faster completion of the current bond purchase program and an earlier rate hike, perhaps by 2023. Lately, Fed officials have stated that they want to complete the bond purchase program before raising interest rates. While on the subject of bonds, it's worth noting that the yield on 30-year bonds fell a whopping 8 basis points to 1.77%, their lowest level since January. This move then drove the five-year treasury yield down more than 11 basis points to 59 basis points.
The yield curve between 2- and 10-year bonds also narrowed by more than 10 basis points. The two-year bond rose 8.5 basis points to 0.57%, which allows the completion of the Fed bond purchase program by the middle of next year. Faster closure opens the door to a potential early interest rate hike. Shortly before commenting on the more aggressive scrapping of the bond purchase program, Powell said it was time to stop using the word "temporary" to describe inflation. This is a hint of a more hawkish view of the Fed on policy, which will be most likely expanded at the next meeting. "We are no longer inclined to use the term 'temporary', as high inflation begins to transform into baseline inflation - this requires action," Powell said. "I think now is a good time to drop that word and try to explain more clearly what we will do next." The Fed chief also mentioned the recent rise in Covid-19 cases and the new omicron strain, which poses risks to employment, economic activity and inflation. "Since the last meeting, we have seen increased inflationary pressures, very strong labor market data without any improvement in labor supply and high household spending," he said. "Now we have to look not only at a strong economy, but also at very high inflationary pressures." In Europe, inflation also accelerated much more than expected, this time due to the rise in energy prices. It hit 4.9% y/y in November, from 4.1% y/y in October. Likewise, core inflation, which excludes energy, food, alcohol and tobacco, rose to a record 2.6% from 2% in October.
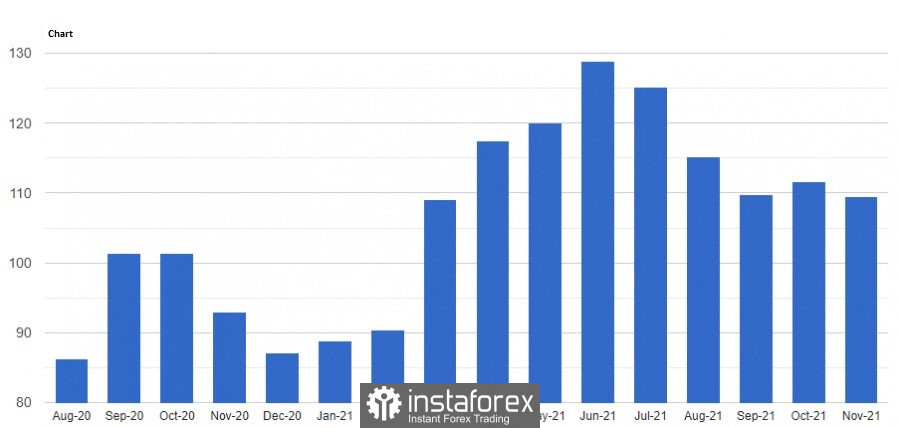
The newly discovered omicron variant has further increased the level of uncertainty, but for now, investors remain calm and expect it to have little impact on inflation going forward. However, it is already clear that headline inflation will remain above the target of the European Central Bank, at least until the end of next year. Going back to the US, a number of reports were released showing the state of the economy, which went slightly against the statements made by Powell. Consumer confidence is said to have deteriorated in November, falling to 109.5 points in November. Its figure was 111.6 points last October.
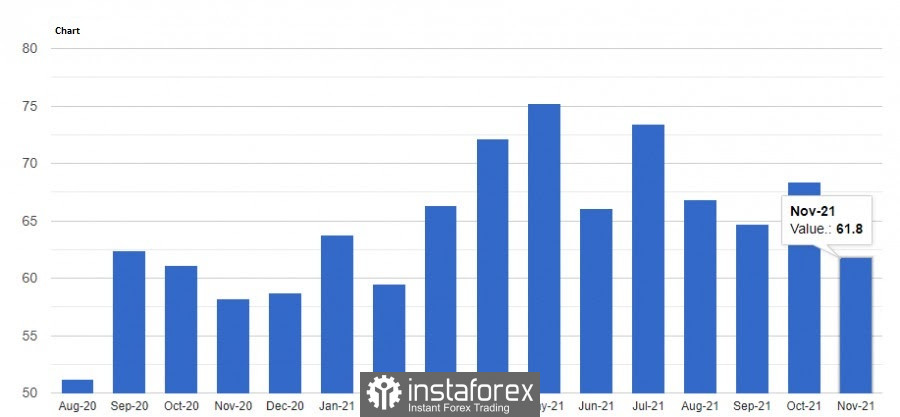
But the main concern for Americans are the ongoing price increases and the persistent coronavirus. Because of those, consumers assessed the current business environment less favorably, bringing down the index to 142.5 points. On the bright side, the assessment of the labor market was moderately favorable, despite the figure decreasing to 87.6 points. A report was also released yesterday, which said that the Chicago business barometer fell to 61.8 points. The reason was the slowdown in the growth of new orders, which fell back to 58.2 points. The employment index also fell to 51.6 points.
With regards to EUR/USD, although there was a massive drop during Powell's speech, traders recovered quite quickly, closing the day near the opening level. As such, a lot depends on 1.1325 because going above it will provoke another rise to 1.1380 and 1.1420. But if the quote returns and goes below 1.1275, the pair will plunge to 1.1230 and 1.1185. The material has been provided by InstaForex Company - www.instaforex.com |
| EUR /USD analysis on November 30, 2021. Inflation in Europe accelerating. Posted: 30 Nov 2021 10:21 PM PST
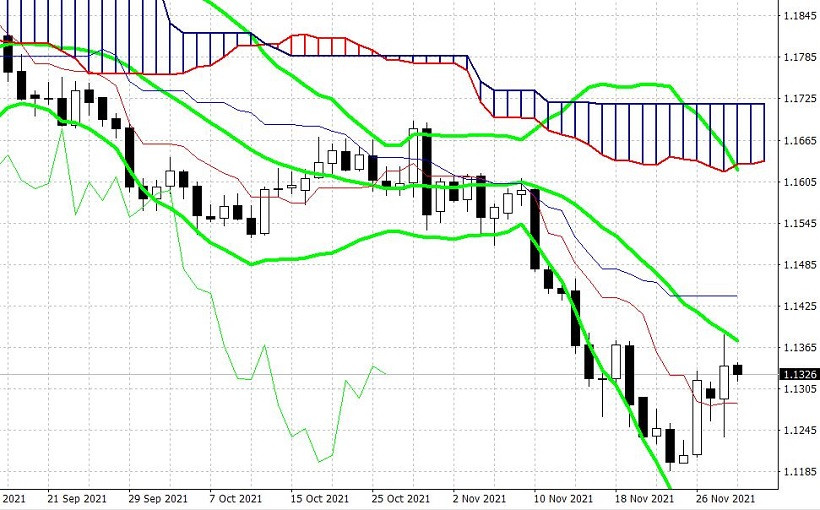
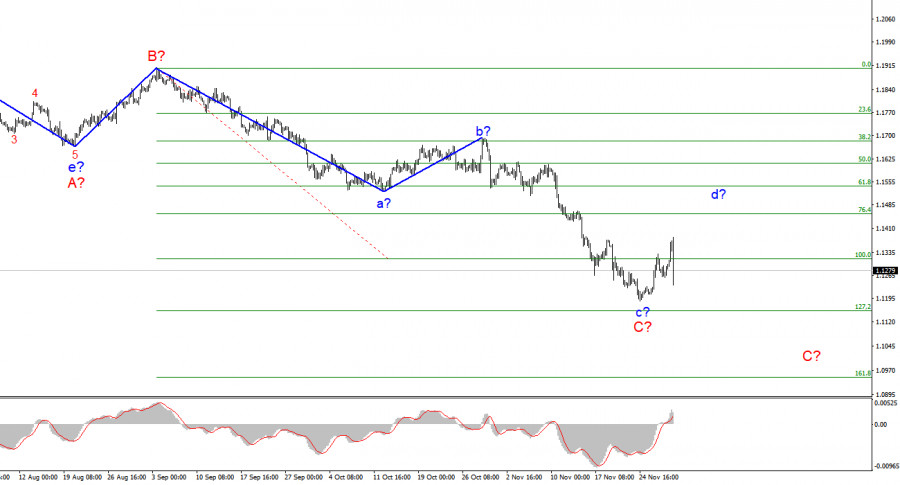
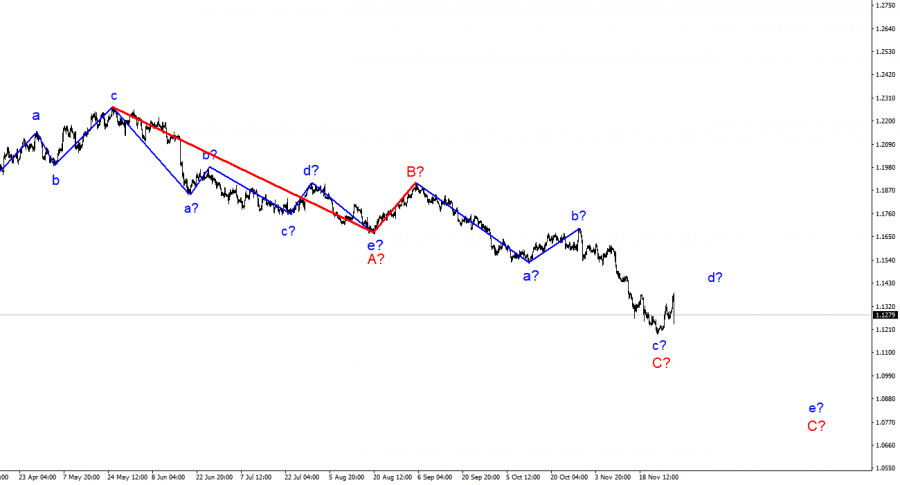
Wave pattern The wave layout for EUR/USD on the 4-hour chart remains complete and does not require any changes. The a-b-c-d-e section of the trend, which was formed at the very beginning of the year, should be interpreted as a wave A, and the subsequent rise in the instrument is seen as a wave B. Thus, the formation of the assumed wave C continues and can take a very extended form. Then we have an interesting situation. The rebound of the quotes from the recent lows suggests that the formation of the expected wave c in C is completed. If this is true, then a new ascending wave is being formed at the moment, presumably the wave d in C. The C wave may take a five-wave corrective structure. A successful attempt to break through the 100.0% Fibonacci level will indicate that the market is ready to go bullish on the instrument. Another scenario is possible when the C wave will take a three-wave form and turns out to be completed. In any case, quotes are expected to rise in the coming week. Omicron high on the agenda but inflation is also in focus The news background for EUR/USD was rather weak on Tuesday as only one important report was published during the day. We are talking about the eurozone inflation report for November. Just like in the US, the CPI continues to accelerate: it jumped to 4.9% in November from 4.1% in October. Thus, Christine Lagarde's fears about further inflation growth were not in vain. Still, Christine Lagarde and Jerome Powell continue to insist that inflation will decrease next year as soon as supply chains recover and energy prices stabilize. However, none of them mention the highest rate that inflation could reach before it starts to slow down. After all, this is a very important question since the US consumer price index has already hit its highest level in 31 years. The same could happen in Europe if the ECB does not reduce the PEPP stimulus program. Amid the emergence of a new virus strain last week, the central banks of the EU and the United States said that this could pose an additional threat to the global economy: it may shrink if Omicron is really as dangerous as reported. So, instead of monetary policy tightening, an opposite process may begin. It is hard to say for sure how things will develop as Omicron has just been discovered. Yet, many countries worldwide have already reported cases of the new virus infection. Conclusion Based on the analysis above, I can conclude that the descending C wave has been completed. However, a drop in euro quotes yesterday suggests that the assumed wave d is unlikely to continue its formation. Such sharp movements usually change the wave structure. So it is better to wait a few days to observe the behavior of markets and the instrument.
Higher time frame The wave layout on the higher time frame looks quite convincing. The quotes continue to move lower. The descending section of the trend that was initiated on May 25 takes the form of a three-wave correctional pattern A-B-C. This means that the downtrend may continue for another month or two until the C wave is fully completed. It can have either a three- or a five-wave structure. The material has been provided by InstaForex Company - www.instaforex.com |
| Posted: 30 Nov 2021 10:12 PM PST To open long positions on GBP/USD, you need: The British pound did not manage to get above the upper border of the horizontal channel in the first half of the day, and then completely collapsed after the speech of the Federal Reserve chairman, who announced a more active curtailment of the bond purchasing program this and next year. Volatility was quite high and against this background there were many signals to enter the market. Let's take a look at the 5 minute chart and figure out the points. In my morning forecast, I paid attention to the 1.3330 level and advised how best to deal with it. A breakthrough and consolidation above 1.3330 with a reverse test from top to bottom - all this led to the formation of an excellent entry point into long positions with the goal of rising to the 1.3361 area, where I advised to take profits. The growth was about 30 points. Bears began to be more active at 1.3361, which, after a false breakout, led to the formation of a good entry point for short positions. As a result, the pair returned back to 1.3327, allowing another 30 points to be pulled out of the market. In the afternoon, one could again observe the bulls' desperate attempt to return to the market and the next formation of a false breakout at 1.3327, which led to a signal to sell the pound and its collapse by more than 160 points.
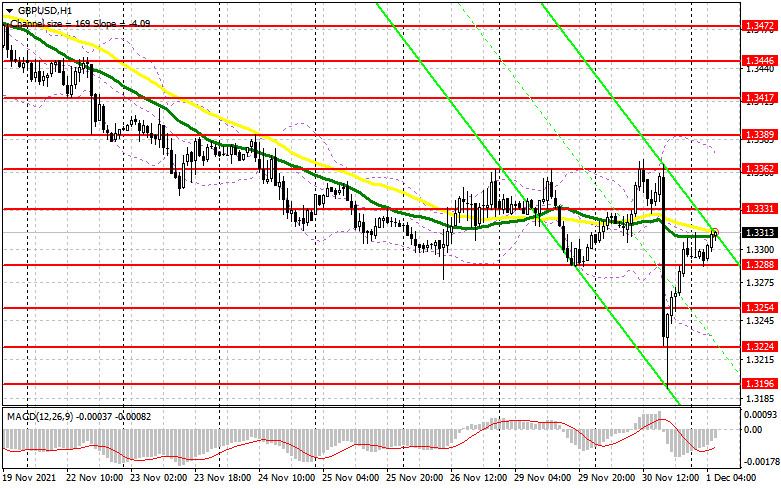
This morning we are waiting for the PMI for the UK manufacturing sector for November this year, but the speech of Bank of England Governor Andrew Bailey will be much more interesting, who continues to adhere to a soft monetary policy, which does not allow the pound to "spread its wings." A breakthrough of 1.3331 is required in order for the pound to continue rising. A downward test of this level will lead to the formation of a buy signal with the prospect of stopping yesterday's bearish impulse and GBP/USD recovery to the 1.3362 area, which is still the upper border of the horizontal channel. If the bulls do not stop and quickly deal with this level, the next target will be the 1.3389 high, where I recommend taking profits. The next target is the resistance at 1.3417. In case the pound falls during the European session, after a weak report on the manufacturing sector, I advise you to open new long positions only after protecting the lower boundary of the horizontal channel at 1.3288, below which the pound is in great demand. Formation of a false breakout there will be an excellent entry point into the market. I advise you to open long positions immediately on a rebound only from the 1.3254 low, or even lower - around 1.3224, counting on a correction of 20-25 points within the day. To open short positions on GBP/USD, you need: Yesterday's bearish momentum ended very quickly and today we need to try very hard to prevent the pair from returning to the upper border of the horizontal channel. For now, bears should not panic, and all that is required of them is to protect the resistance at 1.3331. Formation of a false breakout at this level, to which bulls are now trying to return the pound, will lead to the formation of a new entry point to short positions, followed by a decline to the area of the lower border of the horizontal channel at 1.3288, which is very important from a technical point of view. The next breakthrough of this level will create real problems for bulls. A reverse test of 1.3288 from the bottom up will provide an excellent entry point, which will push the pair to new lows: 1.3254 and 1.3224, where I recommend taking profits. The next target will be the support at 1.3196. In case the pair grows during the European session and the bears are not active at 1.3331, it is best to postpone selling until the larger resistance of 1.3362, which also acts as the upper border of the horizontal channel. I also recommend opening short positions there only in case of a false breakout. Selling GBP/USD immediately on a rebound is possible only from a large resistance at 1.3389, or even higher - from a new high in the 1.3417 area, counting on the pair's rebound down by 20-25 points within the day.
I recommend for review: The Commitment of Traders (COT) reports for November 23 revealed that short positions increased and long positions decreased, which led to an even greater increase in the negative delta. The dovish statements of the Bank of England governor from last week kept the pressure on the British pound, even amid risks associated with higher inflationary pressures than previously expected. The aggravation of the situation with the coronavirus and the new Omicron strain in the European part of the continent did not add optimism. It is also not clear what is with the issue of the Ireland protocol, which the UK authorities are planning to suspend. At the same time, we are witnessing a rise in inflation in the United States of America and increased talk about the need for an earlier increase in interest rates next year, which is providing significant support to the US dollar. However, I recommend sticking to the strategy of buying the pair in case of very large falls, which will occur against the background of uncertainty in the central bank's policy. The COT report indicated that long non-commercial positions declined from 50,443 to 50,122, while short non-commercials rose from 82,042 to 84,701. This led to an increase in the negative non-commercial net position: delta was -34,579 against -31,599 a week earlier. The weekly closing price did not drop that much - from 1.3410 to 1.3397. Indicator signals: Trading is carried out in the area of 30 and 50 moving averages, which indicates some market uncertainty with direction. Moving averages Note: The period and prices of moving averages are considered by the author on the H1 hourly chart and differs from the general definition of the classic daily moving averages on the daily D1 chart. Bollinger Bands In case of growth, the upper border of the indicator in the area of 1.3362 will act as a resistance. In case of a decline, support will be provided by the lower border of the indicator in the area of 1.3235. Description of indicators
|
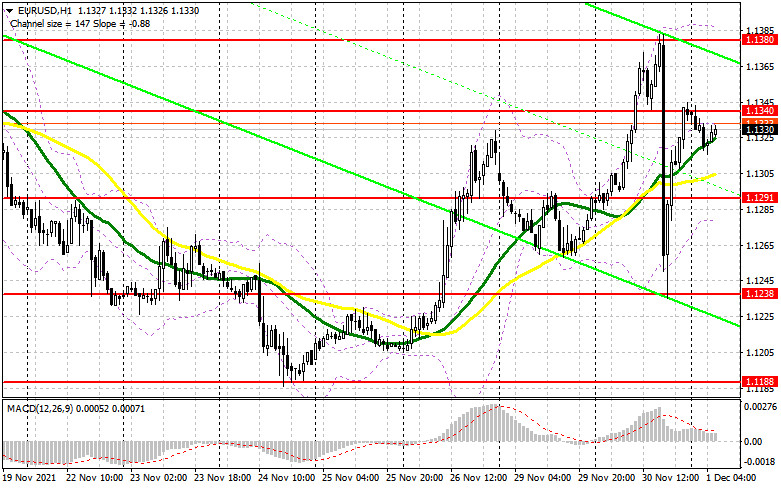
| Posted: 30 Nov 2021 10:12 PM PST To open long positions on EUR/USD, you need: Yesterday, the European currency rose in the first half of the day after strong inflation data in the eurozone, but then collapsed after the speech of the chairman of the Federal Reserve, who announced more active curtailment of the bond purchasing program this year and next. Volatility was quite high and against this background, many signals were formed to enter the market. Let's look at the 5-minute chart and figure out the points. Even at the very beginning of the European session, the bears managed to protect the resistance of 1.1326, forming a false breakout there, which led to a signal to sell the euro. However, there was no major downward movement, and after the pair fell by 12 points, the demand for risky assets returned. A repeated test and a breakthrough of 1.1326 and then a return to this level from top to bottom led to the formation of a signal to buy the euro, which resulted in a powerful growth of almost 50 points to the next resistance of 1.1371. In the afternoon, there were several false breakouts of the 1.1371 level, which gave sell signals each time. As a result, the euro collapsed by more than 140 points, but then quickly compensated for the losses. If you look at it this way, not much has changed from the technical picture.
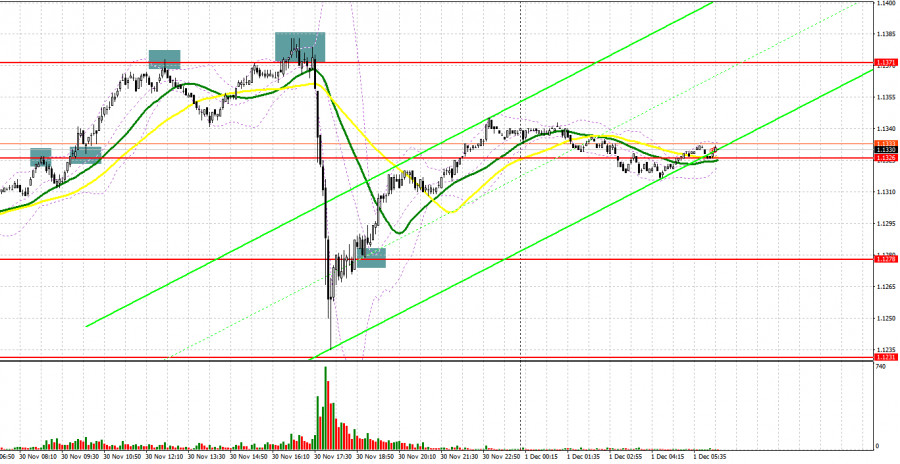
A number of data on activity in the manufacturing sector of the eurozone countries for November of this year will be released today, which may cool down the bulls in the morning. It is very important for bulls to reserve the nearest support of 1.1291, as the further upward correction of the pair depends on it. Only the formation of a false breakout there, along with good statistics on the manufacturing sector, will lead to the formation of the first entry point into the market after yesterday's collapse. The estimate will be on the pair's succeeding growth and the breakthrough of the resistance of 1.1340 formed by the results of yesterday. A breakthrough and a top-down test of 1.1340, similar to what I discussed above, will provide an excellent entry point into the market with the prospect of updating the 1.1380 high and reaching 1.1420. A more distant goal will be 1.1462, where I recommend taking profits. In case EUR/USD falls to 1.1291 and we receive weak fundamental statistics for the eurozone, it is best not to rush into long positions. I advise you to wait for the next fall and the formation of a false breakout at the 1.1238 low. You can open long positions on EUR/USD immediately for a rebound from 1.1188, or even lower - from 1.1155, counting on a correction of 15-20 points within a day. To open short positions on EUR/USD, you need: Bears have confidently declared themselves, but, as you can see, there are also quite a few bulls. The bears' main task for this morning is to protect the resistance of 1.1340, as the euro cant be released above it. The formation of a false breakout there, along with weak data on the eurozone manufacturing sector for November, will provide an excellent entry point into short positions in continuation of yesterday's bearish momentum formed after the speech of Federal Reserve Chairman Jerome Powell. Do not forget about the new strain of coronavirus, which will also keep the pair from a rapid recovery. Any news about its next rapid spread will return pressure on the euro. An equally important task for the bears is to regain control over the 1.1291 support, just above which the moving averages are now playing on the bulls' side. Its breakthrough and bottom-up test will lead to forming a signal to open short positions with the prospect of a decline in the area of 1.1238. A more distant goal is the support of 1.1188, where I recommend taking profits. If the euro rises and bears are inactive at 1.1340, it is better to wait for short positions. The optimal scenario will be short positions when forming a false breakout in the area of 1.1380. It is possible to open short positions immediately for a rebound from the highs: 1.1420 and 1.1462, aiming for a downward correction of 15-20 points.
I recommend for review: The Commitment of Traders (COT) report for November 23 revealed that both short and long positions increased. However, there are still more of the former, which led to an increase in the negative delta. The data on activity in the manufacturing sector of the eurozone countries provided significant support to the euro last week, but the pressure on risky assets remained. A strong US GDP report and Federal Reserve minutes from its last meeting have boosted the dollar as many traders look forward to more aggressive monetary policy changes as early as December this year. However, all this can be prevented by the new strain of the Omicron coronavirus, the spread of which is actively observed in the eurozone and African countries. This strain has not yet been registered in the US, but it is only a matter of time. Bulls can only wait for hawkish statements from European politicians, which were actively sounded last week, which also supported the euro. The latest November COT report indicated that long non-commercial positions rose from 198,181 to 204,214, while short non-commercial positions also jumped from 202,007 to 220,666. At the end of the week, the total non-commercial net position increased to -16,452 against -3,826. The weekly closing price dropped to 1.1241 against 1.1367. Indicator signals: Trading is carried out just above the 30 and 50 daily moving averages, which indicates an attempt by the bulls to continue the upward correction. Moving averages Note: The period and prices of moving averages are considered by the author on the H1 hourly chart and differs from the general definition of the classic daily moving averages on the daily D1 chart. Bollinger Bands In case of growth, the upper border of the indicator at 1.1380 will act as resistance. In case of a decline, the lower border of the indicator in the area of 1.1280 will act as a support. Description of indicators
|
| New COVID-19 vaccine needed for Omicron Posted: 30 Nov 2021 09:38 PM PST
Yesterday, Chair Jerome Powell's words about inflation triggered market jitters. Nevertheless, nothing extraordinary happened. Markets have long realized that what Powel and Lagarde mean by "transitory" differs from what other people think it is. Markets were shocked by Powell's suggestion that it was time to stop referring to inflation as " transitory". In other words, inflation is expected to grow further. So far, the reduction of the QE program by $15 billion a month has come to nothing, which is likely to be proved by the November inflation report that is set to come out in December. The Federal Reserve is expected to announce it will reduce asset purchases by $30 billion in December as well. This would already be a considerable step towards curbing inflation growth. Above all else, vaccine producers Pfizer and Moderna said earlier this week that the new Omicron variant was resistant to the existing vaccines and a more effective vaccine was needed. It could take at least several months to develop a new vaccine. At the same time, President Joseph Biden said that a new lockdown would not be introduced in the US in the near future. Thus, there seems to be no danger to the US economy. Actually, it is not entirely so. The problem is that people became more cautious during the pandemic. The news about the Omicron variant spread quickly across the world causing panic. At the same time, not so many people have been infected. However, a fairly large percentage of the population of any country takes the virus very seriously and does not want to get infected with the new strain resistant to all the existing vaccines. So, business and economic activity could fall. Moreover, the infection rate has been high enough even without Omicron. Some EU countries have already introduced a lockdown. This could also trigger supply chain issues worldwide, which, in turn, would boost inflation and cause an economic slowdown. If so, new stimulus would be needed to revive the economy. Generally speaking, the world is on the verge of another collapse. So far, the US Federal Reserve should bring inflation under control. The material has been provided by InstaForex Company - www.instaforex.com |
| Powell to stop referring to inflation as Posted: 30 Nov 2021 09:20 PM PST
Over the past several months, we have been wondering how long Christine Lagarde and Jerome Powell will be referring to the inflation currently ravaging the economy as "transitory". Indeed, delivering their speeches (and there were a lot of them in recent weeks), both policymakers have repeatedly said that inflation would go down next year. Although initially, they suggested that it would start to decrease at the end of this year. At the same time, neither Lagarde nor Powell ever mentioned how high consumer prices could rise before they begin to fall. This is actually a very important issue. Anyway, inflation keeps accelerating both in the European Union and the United States. Moreover, markets no longer trust statements made by the heads of these two central banks. By and large, rising inflation significantly increases the likelihood of monetary policy tightening in both the European Union and the United States. The ECB's Christine Lagarde insists that interest rates could be raised as early as next year. She believes that the European economy is not ready yet for the end of the quantitative easing (QE) program. Meanwhile, the Federal Reserve has started to gradually tighten its monetary policy. Therefore, the US regulator is now clearly expected to take more active steps towards tightening. As a reminder, the higher the likelihood of rate hikes and QE taper, the worse it is for the stock market and the better it is for a national currency. All in all, the greenback has been showing growth for several months. Therefore, its further strengthening is now questioned. The dollar could actually start falling as markets have already priced in the possibility of interest rate hikes next year as well as QE taper. Yesterday, Powell gave testimony in the Senate, which was his second one in two days. However, both his speeches sounded similar. Addressing the Senate for the second time, Powell was asked when he would stop referring to inflation as "transitory". Powell explained that while the word has "different meanings to different people," the Federal Reserve "tends to use it to mean that it won't leave a permanent mark in the form of higher inflation". Powell also noted that the issue of accelerating the pace of QE taper to curb further inflation growth would be discussed at the next meeting. Markets suggest that the pace of monthly asset purchases would be reduced to $30 billion. Powell's speech triggered a decrease in the leading stock indices - the S&P 500, the NASDAQ, and the Dow Jones - and boosted the greenback. The material has been provided by InstaForex Company - www.instaforex.com |


| You are subscribed to email updates from Forex analysis review. To stop receiving these emails, you may unsubscribe now. | Email delivery powered by Google |
| Google, 1600 Amphitheatre Parkway, Mountain View, CA 94043, United States | |


Comments