Forex analysis review
Forex analysis review |
- Bank of England's actions stirred doubts on GBPUSD bulls
- Technical analysis of GBP/USD for December 27, 2021
- Technical analysis of EUR/USD for December 27, 2021
- Trading signals for Ethereum (ETH/USD) on December 27 - 28, 2021: buy above $4,090 (200 EMA)
- US dollar strengthens against major currencies but falls against pound
- Trading signals for Crude Oil (WTI- #CL) on December 27 - 28, 2021: buy above $73.20 (200 EMA)
- Bitcoin will not be able to rise to $1 million due to competition with gold, NFT and other financial instruments
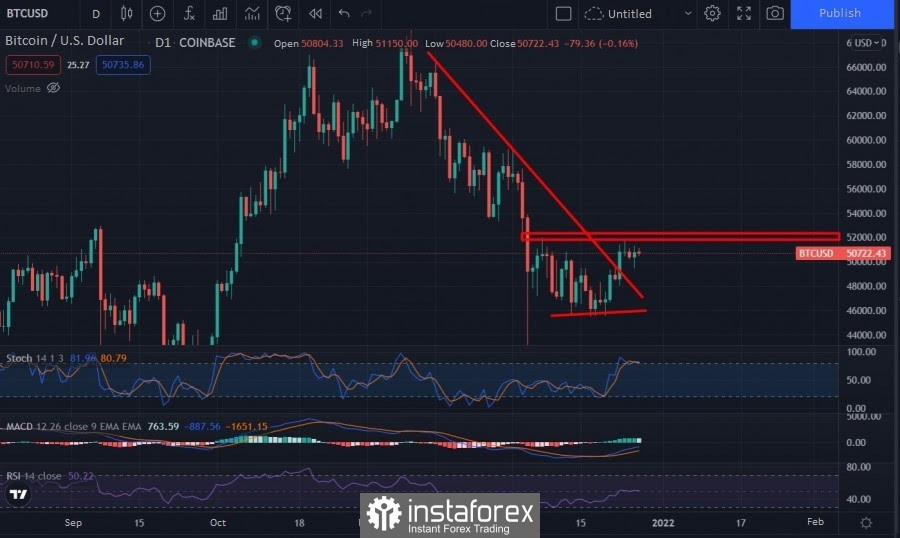
- BTC analysis for December 27,.2021 - Key level at the $51.820
- USDCHF analysis for December 27, 2021.
- Short-term Bitcoin analysis for December 27th, 2021.
- Asian stocks are almost steady
- Analysis of Gold for December 27,.2021 - Key pivot is set at $1.815
- Ichimoku cloud indicator analysis on Gold for December 27, 2021.
- EURUSD still trapped inside trading range.
- USD/JPY analysis for December 27, 2021 - Upside continuation in the play
- Video market update for December 27,,2021
- GBP/USD forecast for December 27. COT report. Sterling rally pauses
- US premarket for December 27: can stock market remain at highs until end of year?
- Technical analysis recommendations of EUR/USD and GBP/USD on December 27, 2021
- EUR/USD: the plan for the American session on December 27. Analysis of morning deals.
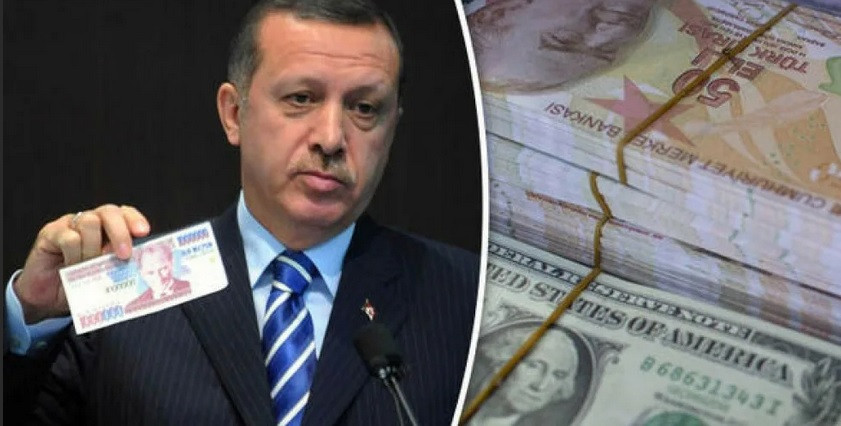
- What caused the Turkish lira to fall?
- China Evergrande Group increased pace of debt repayment
- Technical analysis for USD/CHF on December 27
- Trading plan for EUR/USD on December 27, 2021
- Turkey may tighten crypto regulation due to sharp fall in lira; BTC ends week on positive note
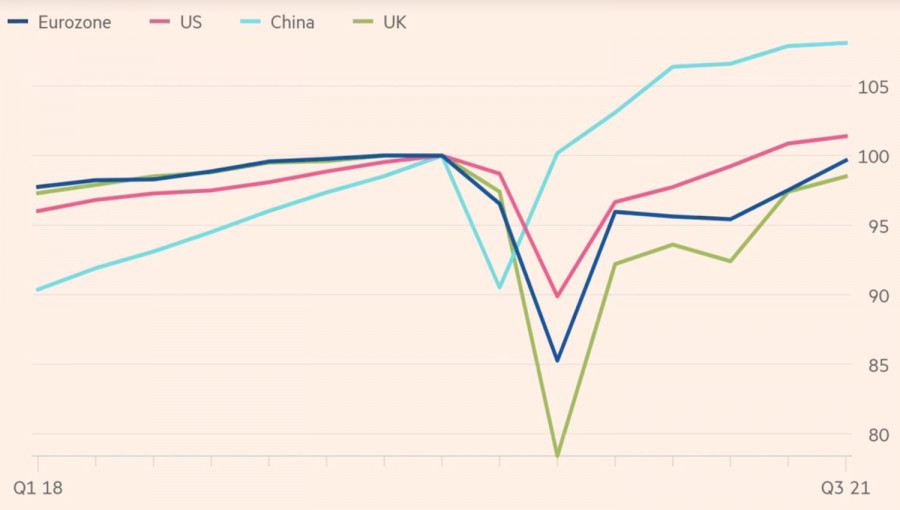
| Bank of England's actions stirred doubts on GBPUSD bulls Posted: 27 Dec 2021 06:39 AM PST If the Fed, looking at the strong U.S. economy, can afford to tighten monetary policy, then the Bank of England should think three times before continuing the cycle of monetary restriction. It started in December, when BoE, unexpectedly for most investors, raised the repo rate from 0.1% to 0.25%. Now the markets are demanding a continuation of the banquet - their expectations of further growth in borrowing costs pushed the GBPUSD quotes above the base of the 34th figure. The pandemic presented central banks with a difficult choice: either to start actively fighting inflation, or not to further slow down GDP growth, which is caused by the depletion of fiscal stimulus. Even before Omicron appeared, the British economy was losing steam. In the third quarter, it expanded not by 1.3%, as initially expected, but by 1.1%. Increasing the number of COVID-19 infections to record highs and imposing restrictions risk exacerbating the situation. No matter how Britain falls into recession. The recovery of gross domestic product in Britain is slower than in the eurozone, not to mention the U.S. or China. Dynamics of the recovery of the world's major economies
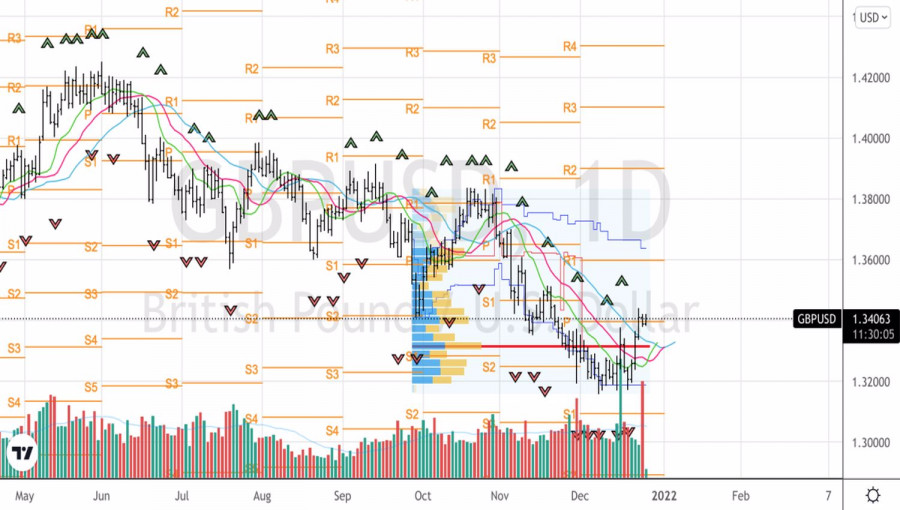
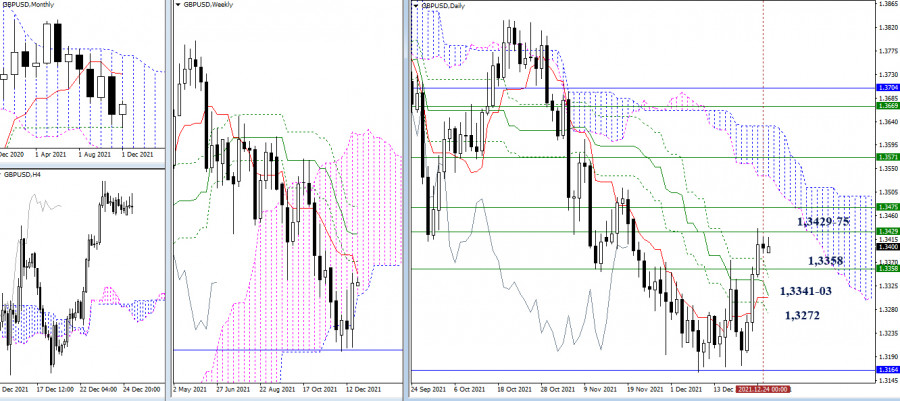
The reasons should be sought not only in COVID-19 but also in Brexit. In fact, the pandemic masked the problems associated with leaving the EU, but sooner or later they had to surface. The outflow of labor that local businesses relied on to Continental Europe and bureaucratic red tape exacerbated supply chain difficulties and fueled inflation and slowed foreign trade. Since 2016, when the decision was made to part with the European Union, the GDP of Britain has grown by 3.9%, while its American and European counterparts have grown by 10.6% and 6.2%, respectively. The risks of stagflation in Britain are significantly higher than in the United States or the eurozone, the more surprising the Bank of England's decisions to abandon QE and begin a cycle of monetary policy tightening look. Its unexpected decision spurred expectations of a further 100bps hike in the repo rate in 2022. We are talking about a higher rate of monetary restriction than the Fed, should we be surprised that GBPUSD soared to 6-week peaks? Investors also keep in mind the fact that the Bank of England is able to start winding down its own balance sheet faster than other leading regulators in the world. Indeed, according to the conditions developed by the BoE, it can stop reinvesting income from bonds when the repo rate reaches the level of 0.5%. With its growth to 1%, asset sales can start from the balance sheet. Based on the speed of monetary restriction, the GBPUSD pair should definitely be bought. The problem is that the Bank of England has proven itself to be an extremely unreliable guy over the past two months. In November, it refused to tighten monetary policy, although everyone expected it. In December, on the contrary, it increased borrowing costs, although few predicted such a step by the regulator. What will happen in February? Technically, the formation of the inside bar allows you to buy GBPUSD on the breakout of the resistance at 1.342 and sell the pair in case of a successful assault on the support at 1.338. GBPUSD, Daily chart
|
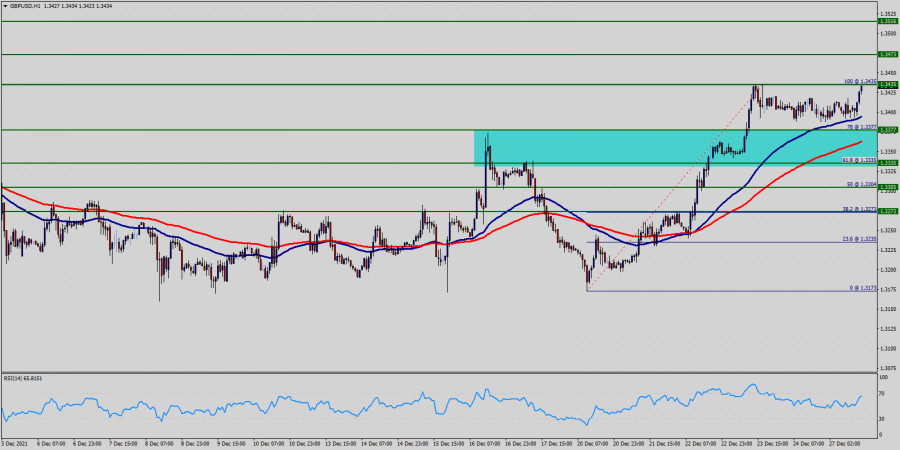
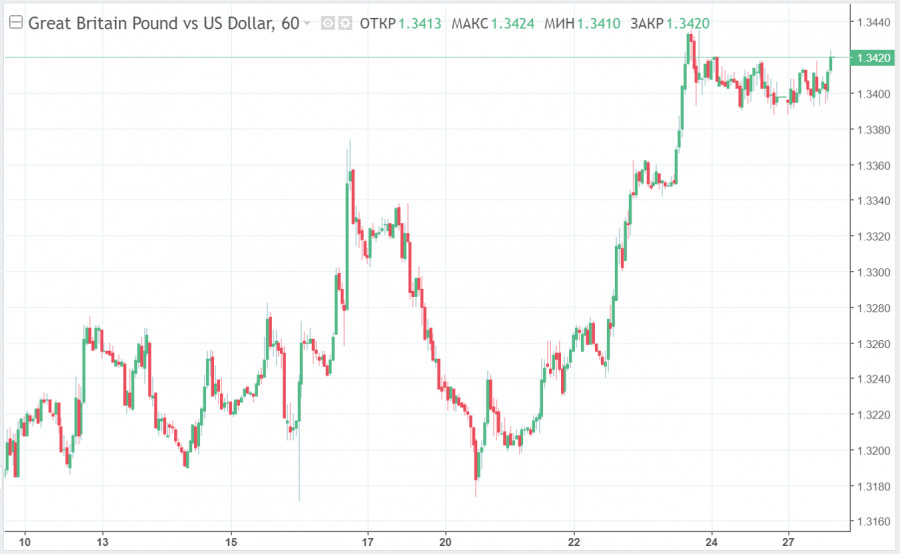
| Technical analysis of GBP/USD for December 27, 2021 Posted: 27 Dec 2021 06:35 AM PST
On one-hour chart, the GBP/USD pair is continuing in a bullish market from the supports of 1.3377 and 1.3335. Also, it should be noted that the current price is in a bullish channel. Equally important, the RSI is still signaling that the trend is upward as it is still strong above the moving average (100) since yesterday. Immediate support is seen at 1.3335 which coincides with a golden ratio (61.8% of Fibonacci). Consequently, the first support sets at the level of 1.3335. So, the market is likely to show signs of a bullish trend around the spot of 1.3335/1.3377. In other words, buy orders are recommended above the golden ratio (1.3377) with the first target at the level of 13477. Furthermore, if the trend is able to break through the first resistance of 13477. As a result, the pair will climb towards the scond resistance (1.3516) to test it. On the other hand, stop loss should always be in account, so, it must set the stop loss below the second support of 1.3305. The material has been provided by InstaForex Company - www.instaforex.com |
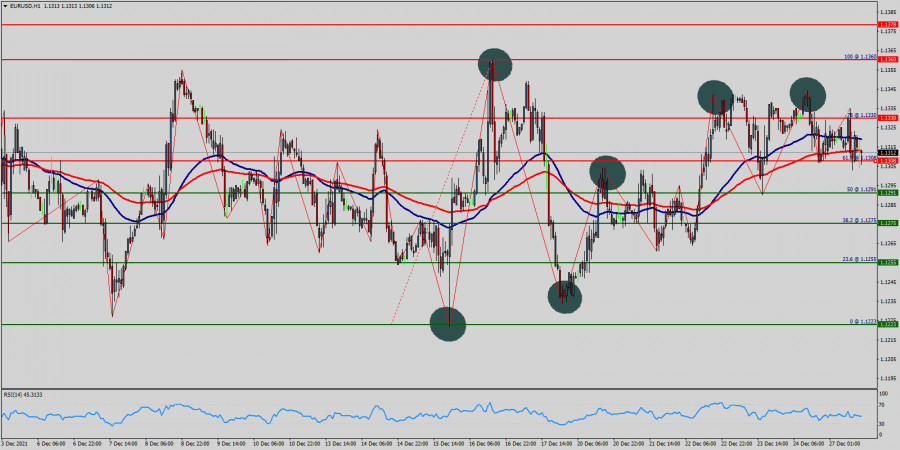
| Technical analysis of EUR/USD for December 27, 2021 Posted: 27 Dec 2021 06:15 AM PST
The trend of EUR/USD pair movement was controversial as it took place in the downtrend channel. Due to the previous events, the price is still set between the levels of 1.1223 and 1.1360, so it is recommended to be careful while making deals in these levels because the prices of 1.1330 and 1.1360 are representing the resistance and support respectively. Therefore, it is necessary to wait till the downtrend channel is passed through. Then the market will probably show the signs of a bearish market. In other words, sell deals are recommended below the price of 1.1360 with the first target at the level of 1.11255 . From this point, the pair is likely to begin an descending movement to the price of 1.11255 with a view to test the daily support at 1.1223. Forecast: If the pair fails to pass through the level of 1.1360, the market will indicate a bearish opportunity below the strong resistance level of 1.1360. In this regard, sell deals are recommended lower than the 1.1360 level with the first target at 1.1275. It is possible that the pair will turn downwards continuing the development of the bearish trend to the level 1.1223. However, stop loss has always been in consideration thus it will be useful to set it above the last double top at the level of 1.1360 (notice that the major resistance today has set at 1.1360). The material has been provided by InstaForex Company - www.instaforex.com |
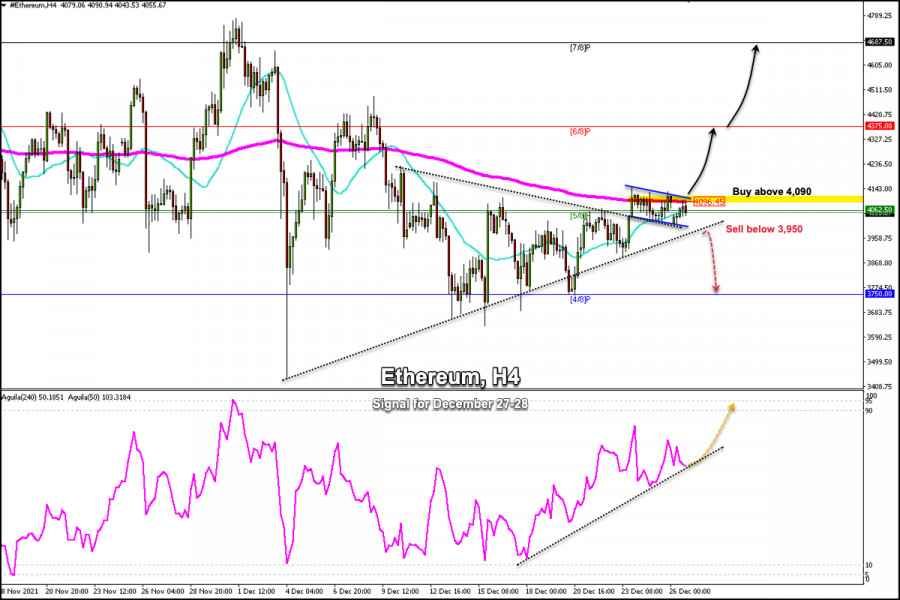
| Trading signals for Ethereum (ETH/USD) on December 27 - 28, 2021: buy above $4,090 (200 EMA) Posted: 27 Dec 2021 06:04 AM PST
Ethereum (ETH) together with Bitcoin (BTC) obtained good returns during 2021 due to rising inflation in all countries and US dollar depreciation during 2020 - 2021. Some analysts argue that a significant rise in Bitcoin and altcoins in recent months was caused by almost zero interest rates, or in some cases negative. In many countries with rising inflation, fiat currencies lose their value and investors seek refuge in assets such as Ethereum and other cryptocurrencies, which gave the crypto market strong gains. However, the strength of Bitcoin could be in danger because the United States and other countries have announced for 2022 the increase of their interest rates in order to control inflation. This would make Bitcoin less attractive as a form of digital gold. As a result, a strong correction in prices could occur and Ether could fall to $ 1,500 and BTC to $20,000. In the short term, Ether will probably continue to oscillate until approximately the second quarter of 2022, when the United States is planning to increase its interest rate. Therefore, we believe that it could continue to fluctuate between the levels of 3,500 – 5,000. According to the 4-hour chart, we can see that Ether is trading below the 200 EMA and below the 21 SMA. It could be moving sideways. However a sharp break below 3,950 would confirm the break of the symmetrical triangle pattern . Thus, the price could drop as low as 4/8 of a Murray around 3,750. On the other hand, a rise and a break above 200 around 4,096 could be a confirmation of a bullish move and could be a signal to buy with targets at 4,375(6/8). The price could go as high as 4,687 (7/8). Our trading plan is to wait for Ether to consolidate above 4,090 and buy with targets at 4,375. The eagle indicator is showing a positive signal and a bullish move is likely these days. Support and Resistance Levels for December 27 - 28, 2021 Resistance (3) 4,375 Resistance (2) 4,234 Resistance (1) 4,124 ---------------------------- Support (1) 3,991 Support (2) 3,918 Support (3) 3,750 *********************************************************** A trading tip for Ether on December 27 - 28, 2021 Buy above 4,090 (200 EMA) with take profit at 4,375 (6/8) and 4,687 (7/8), stop loss below 3,950. The material has been provided by InstaForex Company - www.instaforex.com |
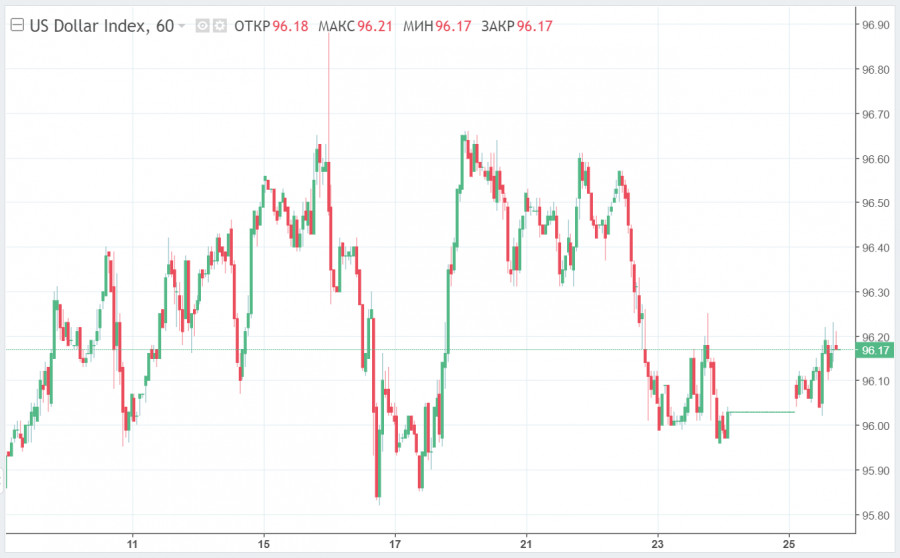
| US dollar strengthens against major currencies but falls against pound Posted: 27 Dec 2021 05:45 AM PST
The US dollar strengthened against major world currencies on Monday, but not against the pound. On the eve of the New Year holidays, the dollar index rose by 0.13% to 96.17 against the six major currencies amid weak trading activity.
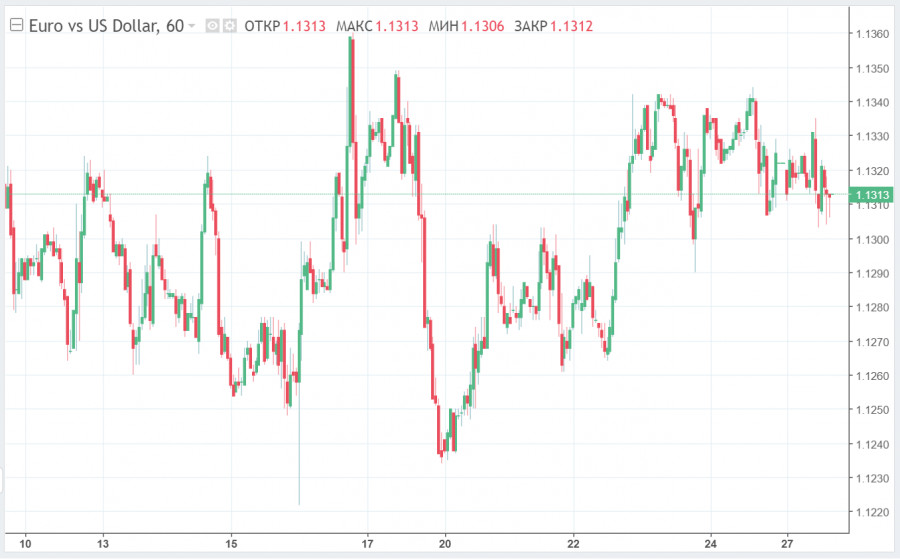
The weak trading of USD on Monday can be explained by the fact that markets are still closed after the Christmas celebrations in New Zealand, Australia, Canada and the UK. Those investors who show some activity on Monday's trading are locking in profits by the end of the year, rather than to actually perform trades. The euro against the US dollar in the last days of this year is clearly weakening. During December, the EUR/USD pair is trading sideways within the 1.2225 - 1.1360 channel. At the time of writing, the euro is trading at 1.1312. The movement of the EUR/USD pair is determined by both the frankly weak economy of the EU and the slowdown in global GDP growth. The new Omicron strain is forcing European governments to impose severe restrictions, due to which business and consumer activity in the Eurozone are close to recession. The energy crisis is still the biggest problem of the European Union, because Russia does not increase gas supplies, France has shut down its nuclear complexes, and the Russian Nord Stream 2 gas pipeline aimed at solving the problem of energy shortages is still unable to get approval from Germany. For these reasons, the bearish trend on EUR/USD will continue next year. Today, the pound against the US dollar rose to $1.3400 (from the previous closing level of $1.3385). According to BDSwiss analyst Marshall Gittler, the prospects that the Bank of England may raise the key rate next year support the pound.
Notably, market participants ignore the official data on the growing number of cases caused by the Omicron strain in the UK, France, Australia, and other countries. Perhaps the consolation is that this variant is not so lethal. If, after two weeks, it is clear that the new strain is not causing a lot of deaths, then any news about the COVID-19 may no longer have any impact on the market. The material has been provided by InstaForex Company - www.instaforex.com |
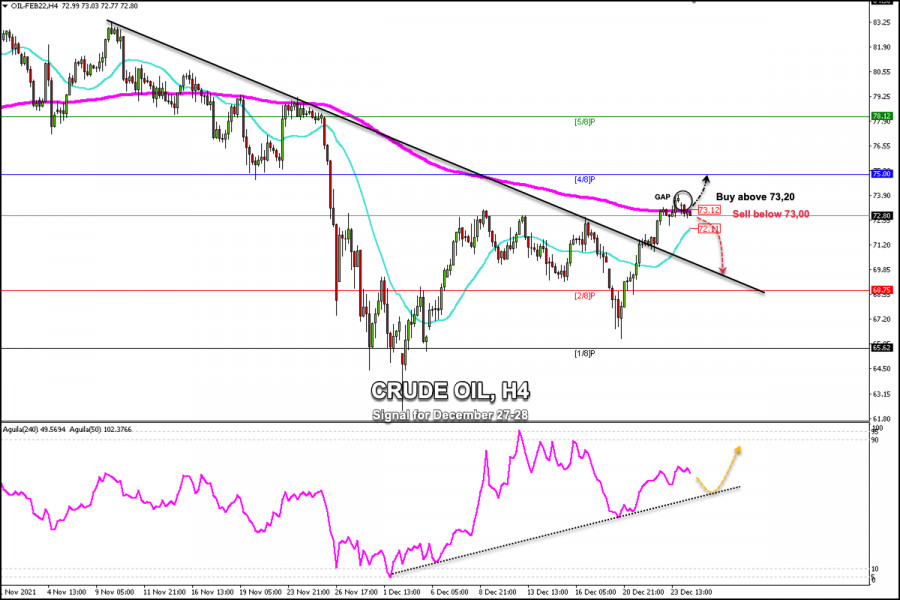
| Trading signals for Crude Oil (WTI- #CL) on December 27 - 28, 2021: buy above $73.20 (200 EMA) Posted: 27 Dec 2021 05:18 AM PST
Crude Oil (WTI- #CL) opened this week with a bearish GAP around 73.71. At this time, it is trading below the 200 EMA located at 73.12 and it is likely that under this zone there will be downward pressure. That is why the price could reach the 21 SMA located at 72.11. Lat week, WTI had a strong bullish rally and gained approximately 780 pips? rising from the low of 66.12 - 73.93. This week, it is likely to make a technical correction. As it is trading below the 200 EMA, a technical correction is expected. However, the price may decline to the support of 2/8 Murray around 68.75. Crude oil is likely to be under downward pressure this week due to some headlines as published by Bloomberg: where it mentions that the Japanese Ministry of Commerce announced earlier today that it is releasing oil from its national reserves in a coordinated effort with the United States to contain oil prices. On the other hand, if crude consolidates again above the 200 EMA and trades above this level, it is likely that the bullish force will continue to prevail. The price may close the gap at 73.71 and could quickly reach the resistance and psychological level of 75.00 (4/8). The eagle indicator is showing a bearish signal. It is highly possible that there will be a low volume and lack of liquidity due to the holidays. Therefore, it is possible that crude oil will trade sideways these days. Our trading plan is to watch the key level of 73.12, below we can sell with targets at 68.75. A close on the 4-hour chart above this zone will be time to buy with targets at 73.71 and 75.00. Support and Resistance Levels for December 27 - 28, 2021 Resistance (3) 75.00 Resistance (2) 74.34 Resistance (1) 73.30 ---------------------------- Support (1) 72.68 Support (2) 71.88 Support (3) 71.40 *********************************************************** A trading tip for WTI on December 27 - 28, 2021 Buy above 73.20 (200 EMA) with take profit at 73.71 (GAP) and 75.00 (4/8), stop loss below 72.80. The material has been provided by InstaForex Company - www.instaforex.com |
| Posted: 27 Dec 2021 05:18 AM PST Over the past month and a half, experts of different competencies and reputations have found themselves in an awkward position due to bold predictions regarding the cost of Bitcoin at the end of 2021. In December, the rhetoric of many crypto influencers has changed. For example, analyst PlanB believes that BTC will cost $100k only in 2023. Ray Dalio did not stand aside, who spoke critically about Bitcoin as an alternative means of settlement in the near future. According to Dalio, the value of the first cryptocurrency is overestimated. In the near future, the coin will face increased competition from the developing sectors of the digital economy, and therefore you should not wait for Bitcoin at a price of $1 million per coin. He also added that the cryptocurrency will not be able to double the capitalization of gold due to the stable positions of the precious metal and the presence of traditionalist investors on the market. Dalio also confessed his love for NFT tokens and stated that they can compete significantly with Bitcoin. There are grains of truth in Dalio's position because, in fact, gold and Bitcoin complement each other and are part of the diversification process. When the precious metals market falls, investors turn to Bitcoin, but when the fear and greed index goes into fear mode, players hedge risks in gold. Therefore, I believe that the competition between digital and classic gold will continue.
But it would be rash to think that BTC/USD quotes will stop growing in the future. Despite the reduction of the economic stimulus program, Bitcoin found its investors and continued to remain in demand. I immediately recall the record low BTC balance on cryptocurrency exchanges. The increased correlation with the S&P 500 index also indicates that market participants view cryptocurrency as a high-risk investment instrument, and not just a means of hedging risks. Therefore, I have no doubt that Bitcoin has a significant margin of safety, and its value forces institutions to look for additional resources to level the weakness of the ecosystem.
As for the technical picture, on the four-hour chart, Bitcoin made a confident rebound from the $49.5k support zone. This means that the price will soon test the strength of the resistance line at $52k. But I would not count on a confident breakdown of this peak, since high volatility and low purchase volumes still remain in the market. Moreover, the probability of falling into the range of $42k-$45k remains, as buyers do not show high activity. The main argument in favor of this assumption is the end of the year, which is always accompanied by increased volatility and profit-taking. I am by no means a pessimist, but this week I expect an increase in pressure on the price, which will not be something critical, but will definitely neutralize the probability of reaching the level of the previous absolute maximum.
|
| BTC analysis for December 27,.2021 - Key level at the $51.820 Posted: 27 Dec 2021 05:04 AM PST Technical analysis:
BTC has been trading sideways today at the price of $51,000 and I see potential for another test of $51,820. Trading recommendation: Watch carefully for the price action around the the key pivot at the price of $51,820 to confirm further direction. Further confirmation for the upside movement can be if the price breaks level at $51,820. If that is the case, watch for buying opportunities with upside objective at $53,483 Rejection of the key pivot at $51,820 can led price towards low at $49,870 The material has been provided by InstaForex Company - www.instaforex.com |
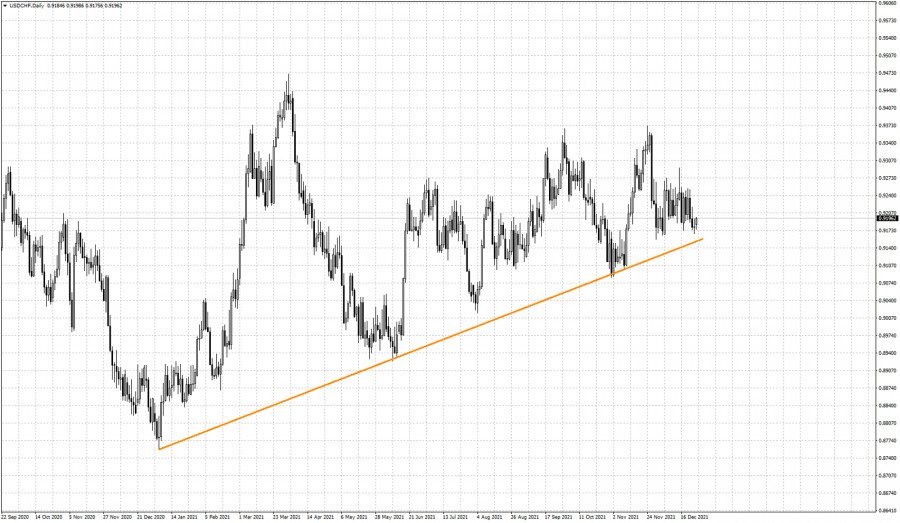
| USDCHF analysis for December 27, 2021. Posted: 27 Dec 2021 04:58 AM PST USDCHF is trading around 0.9190 just above the November lows and above the critical upward sloping support trend line we mentioned in previous posts. At current levels, since the decline in price has stopped and it seems that price has found a balancing point, we prefer to turn bullish as price continues to respect the key trend line.
The orange trend line has been tested several times and the fact that price continues to respect it, increases its importance. Bulls do not want to see price break below it. Breaking below the orange trend line would be a bearish sign. That is why just above the orange trend line we prefer to be bullish looking for another bounce higher as it did before. Support is found at 0.9140-0.9150. Bulls do not want to see price break below this support area. On the other hand, resistance is found at 0.9240 area where we witnessed several rejection attempts. So breaking above 0.9240 will increase chances of another run higher towards 0.9350. The material has been provided by InstaForex Company - www.instaforex.com |
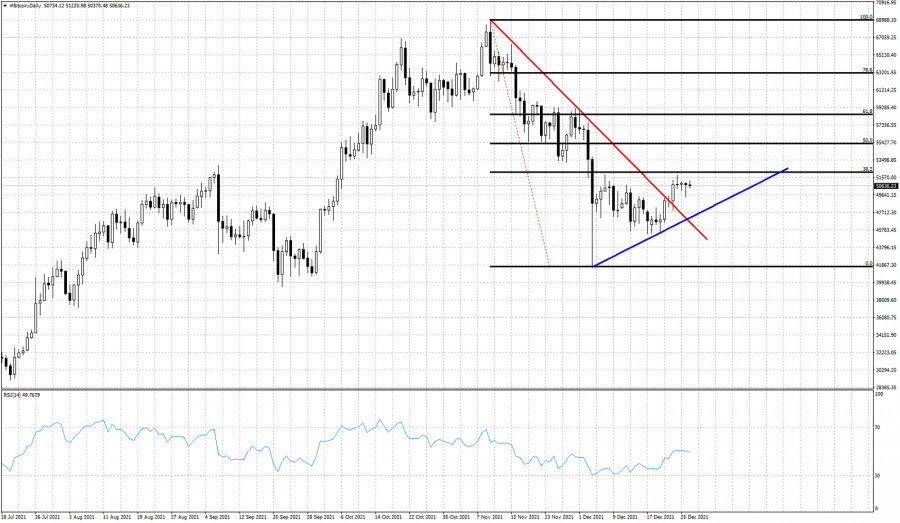
| Short-term Bitcoin analysis for December 27th, 2021. Posted: 27 Dec 2021 04:53 AM PST Bitcoin is trading around $50,000. After the sell off at the beginning of December and the dive towards $40,000, price has bounced and is finding equilibrium around $48,000. So far the 38% Fibonacci retracement of the entire decline at $52,000 remains our key resistance and price remains vulnerable to a move lower.
Blue line - support Black lines- Fibonacci retracements Bitcoin continues to trade below the short-term resistance of the 38% retracement. Bulls need to break above $52,000 in order to provide a new bullish signal. Support is found at $47,000. Bulls do not want to see price break below this level as it will put the $40,000 level in danger. Bulls want to see price form higher highs and higher lows. A pull back towards $47,000-$48,000 is not ruled out before the next upward move. Next upside target for Bitcoin is at $55,400 and next at $58,000. The material has been provided by InstaForex Company - www.instaforex.com |
| Asian stocks are almost steady Posted: 27 Dec 2021 04:50 AM PST
Asian stocks are almost steady at the opening of today's trading. Thus, China's Shanghai Composite and Shenzhen Composite added 0.15% and 0.31% respectively. Korea's KOSPI declined slightly by 0.26%, while Japan's Nikkei 225 fell by 0.33%. Australian and Hong Kong stock exchanges were closed for holidays. However, on Friday these indicators went up: the S&P/ASX 200 index grew by 0,44% and the Hang Seng Index increased by 0,13%. Despite the global fears about the COVID-19 strain being reduced, a certain amount of uncertainty about the economic outlook still remains. According to recent studies, the new variant is less dangerous than previous ones. At the same time, a high increase in the number of new cases of the Omicron variant is reported in the United States and the PRC. It exceeds the previous wave of COVID-19 caused by the Delta strain. Airlines have been forced to cancel nearly 6,000 flights since December 24 due to the rapid spread of the Omicron variant. Just yesterday, 1,500 flights were cancelled globally. Another factor affecting investor sentiment is China's uncertain real estate issue. Many experts believe that the largest property developer Evergrande is still close to bankruptcy. Following Japan's indicator decline, the shares of Z Holdings Corp. lost 3.42%, SoftBank Group Corp. fell by 2.9%, Toho Zinc Co. decreased by 2.61% and Fast Retailing went down 1.7%. At the same time, the stocks of Toyota Motor Corp. rose by 0.6% and Honda Motor Co. Ltd. added 0.4%. The shares of the following Chinese companies fell dramatically: Digital Technology (Group) Co., Ltd., Lanzhou Greatwall Electrical Co., Ltd. and Fsilon Furnishing & Construction Materials Corp. went down 10.03%, 10.01% and 9.99% respectively. Stocks of Korean companies Samsung Electronics Co. and Hyundai Motor dropped by 0.4% and 0.2% respectively. The material has been provided by InstaForex Company - www.instaforex.com |
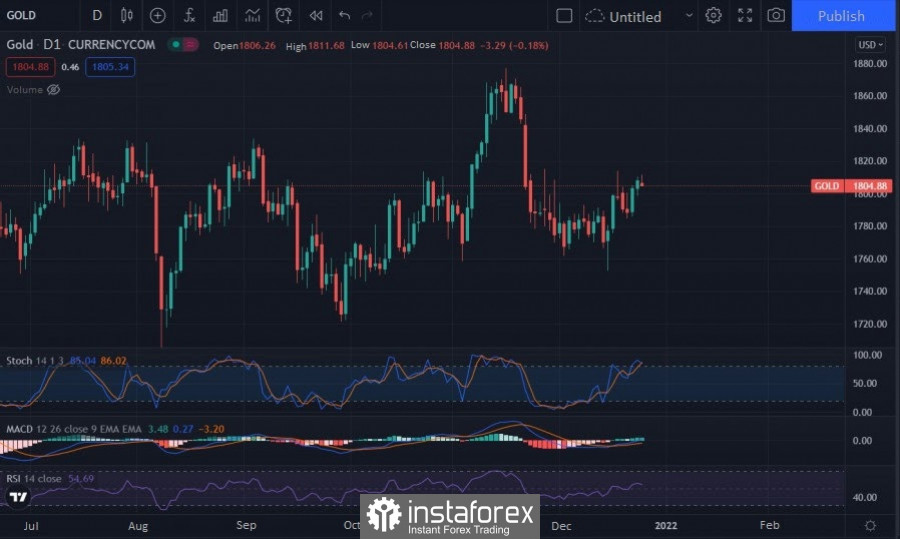
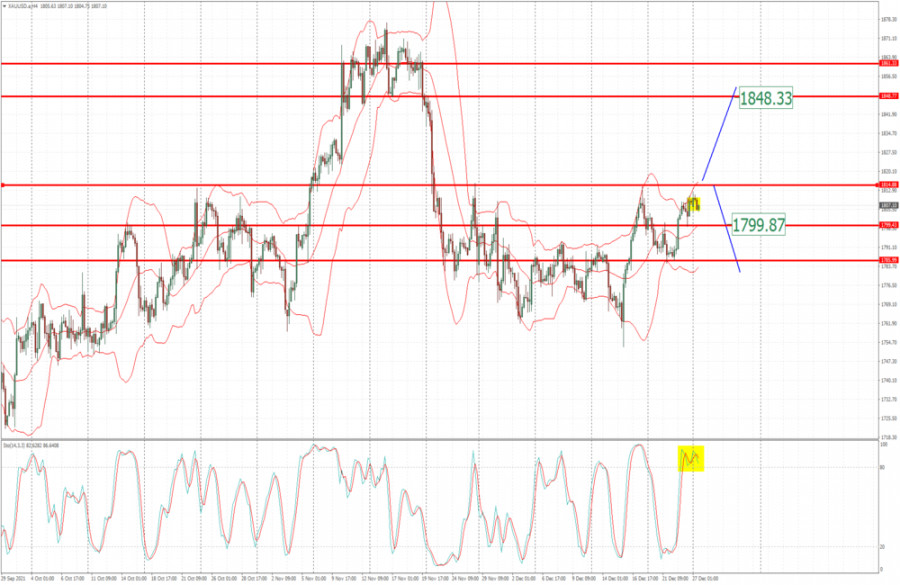
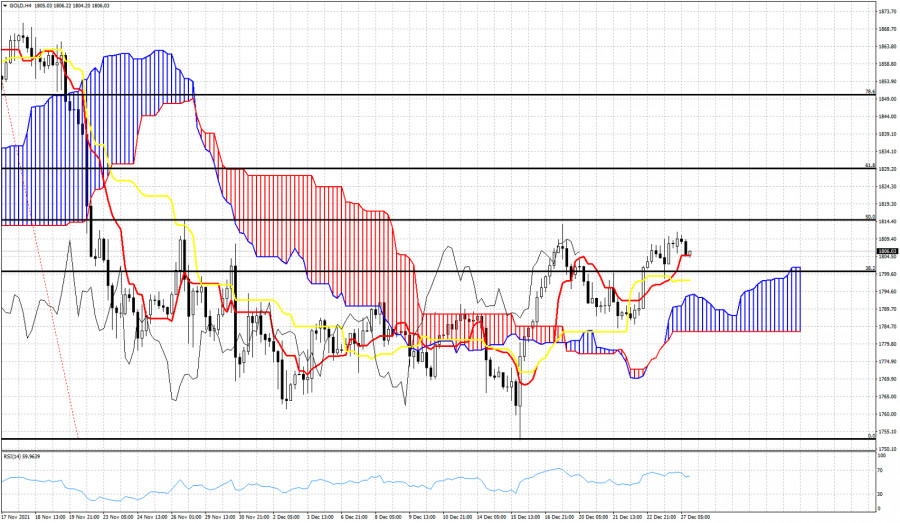
| Analysis of Gold for December 27,.2021 - Key pivot is set at $1.815 Posted: 27 Dec 2021 04:40 AM PST Technical analysis:
Gold has been trading sideways at the price of $1,806 but the key pivot is set at the price of $1,815. Trading recommendation: Watch carefully price action around the key pivot at $1,815 to confirm further direction. The rejection of the pivot at $1,815 can lead the price towards $1,800 and $1,785 The breakout of the pivot at $1,815 with the fallow trough can lead Gold towards $1,848 Stochastic oscillator is showing overbought condition.... The material has been provided by InstaForex Company - www.instaforex.com |
| Ichimoku cloud indicator analysis on Gold for December 27, 2021. Posted: 27 Dec 2021 04:38 AM PST Gold price is trading above $1,800, around $1,806. Price remains in a short-term bullish trend making higher highs and higher lows since the $1,752 lows and reversal day back on December 15th. Gold price is also in a bullish short-term trend according to the Ichimoku cloud indicator.
|
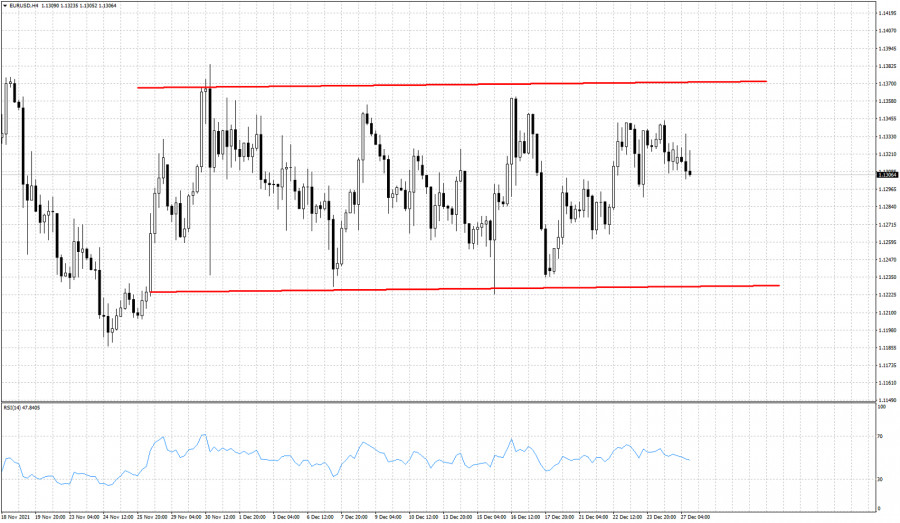
| EURUSD still trapped inside trading range. Posted: 27 Dec 2021 04:34 AM PST EURUSD is just above 1.13 after reaching as high as 1.1344 last week. Price remains trapped inside the trading range we mentioned before and is valid since the end of November. Key resistance remains unbroken at 1.1370 and as long as this is the case, price will be vulnerable to more downside.
EURUSD is turning lower after getting rejected at 1.1350. Price is vulnerable to another push lower towards the lower trading range boundary close to 1.1235. Trend remains neutral as price continues to trade sideways. Traders better be patient and wait for a break out before choosing sides. The material has been provided by InstaForex Company - www.instaforex.com |
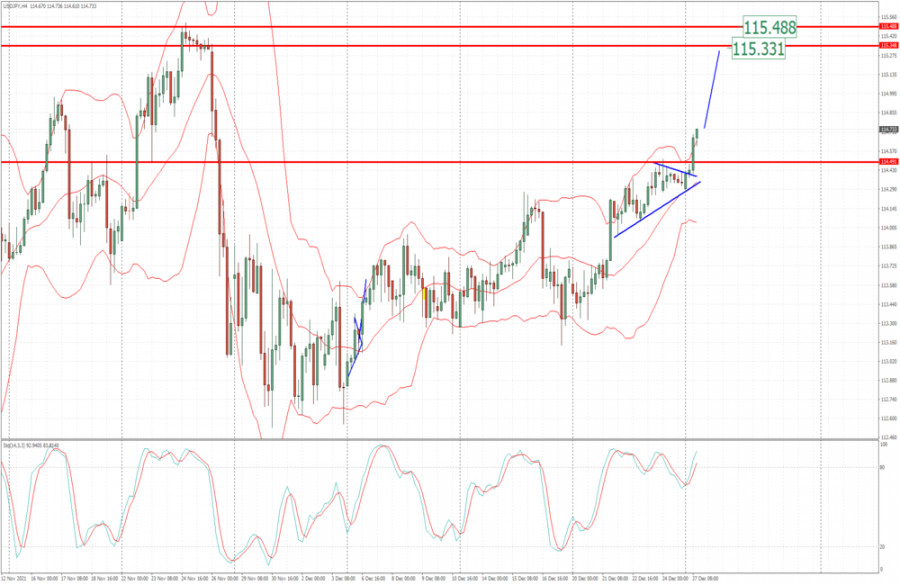
| USD/JPY analysis for December 27, 2021 - Upside continuation in the play Posted: 27 Dec 2021 04:34 AM PST Technical analysis:
USD/JPY has been trading upside today and I see potential for the further upside continuation. Trading recommendation: Due to breakout of the consolidation in the background and upside momentum, I see potential for the upside continuation. Watch for buying opportunities on the pullbacks with the upside targets at 114,90 and 115,40. Stochastic is showing fresh bull cross, which is another sign and confirmation for the upside continuation. Support is set at the price of 114,50 The material has been provided by InstaForex Company - www.instaforex.com |
| Video market update for December 27,,2021 Posted: 27 Dec 2021 04:22 AM PST Watch for bull continuation on the USD/JPY.... The material has been provided by InstaForex Company - www.instaforex.com |
| GBP/USD forecast for December 27. COT report. Sterling rally pauses Posted: 27 Dec 2021 03:43 AM PST GBP/USD – H1.
Hello, dear traders! The GBP/USD pair spent Friday trading in a narrow range on the hourly chart. In fact, the quotes were drifting below the 100.0% Fibonacci retracement, the level of 1.3411. At the moment, there are no active signals as most traders are out of the market. Accordingly, even if the pair consolidates above or fixes below this level, it will mean nothing. The macroeconomic calendar is also bereft of any important releases that could have a severe impact on the pair's dynamics. Moreover, it will be empty throughout the current week. Therefore, the market may well remain thin until 2022. The UK is now having a difficult time caused by the pandemic, in particular, the new Omicron strain. However, British traders are in no hurry to respond to a surge in coronavirus cases in both Britain and the United States. According to the latest data, the number of hospitalized cases related to the new strain is very small. Scientists in South Africa say that the latest wave of the pandemic is waning. This gives hope for a similar outcome in the United States and Europe. In general, traders are not yet worried about the Omicron variant. We hope that the situation will not worsen after the holidays. Indeed, in light of the New Year and Christmas holidays, team gatherings could lead to new infections. GBP/USD – H4.
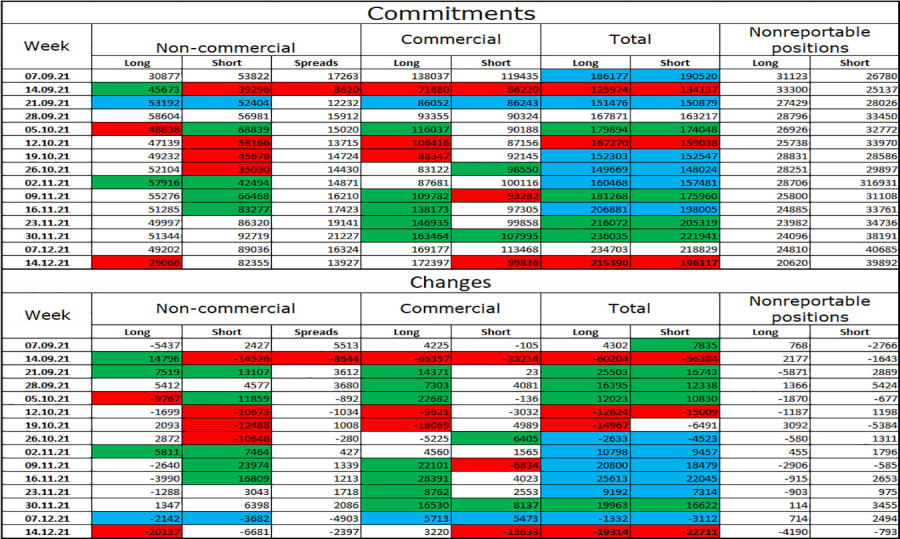
On the 4-hour chart, the pair has consolidated above the 61.8% Fibonacci retracement, the level of 1.3274. Thus, the pair may well extend gains, heading for the next Fibo level of 50.0% - 1.3457. A rebound from the 50.0% level will support the US currency and lead to a fall in the quotes, while consolidation above this level will most likely result in the pair's continued growth towards the next Fibonacci retracement of 38.2% - 1.3642. However, all these movements may occur as early as next year. None of the indicators are signaling maturing divergences. News calendar for the US and Britain: Today's macroeconomic calendar does not include any reports from Britain and the US. Thus, fundamental factors will have no impact on market sentiment. COT (Commitments of traders) report:
The latest COT report posted on December 14 showed that the sentiment of major players had changed dramatically. To be more precise, it became much more bearish as the "Non-commercial" category closed 20,000 long contracts at once. Market sentiment has become increasingly bearish for the last two months. Over the reporting week, speculators also closed 6,681 short contracts. The total number of short contracts in the "Non-commercial" category of traders is now more than twice as high as the number of long contracts: 82,000 versus 29,000. Thus, I cannot conclude that the situation for the pound sterling has improved. The British currency continues to suffer losses. GBP/USD forecast and trading recommendations: Long positions on the British pound can be considered in case of a rebound from the level of 1.3171 on the hourly chart, with a view to reaching the target levels of 1.3296 and 1.3411. The pair has failed to close above the level of 1.3411. Therefore, long positions can be closed. I do not recommend going short yet. There is no clear sell signal, and the pair's dynamics may be very subdued this week. TERMS: "Non-commercial" - major market players: banks, hedge funds, investment funds, private and large investors. "Commercial" - commercial enterprises, firms, banks, corporations, companies that buy a currency not to obtain speculative profit but to ensure current activities or export-import operations. "Non-reportable positions" - small traders who do not have a significant impact on the price. The material has been provided by InstaForex Company - www.instaforex.com |
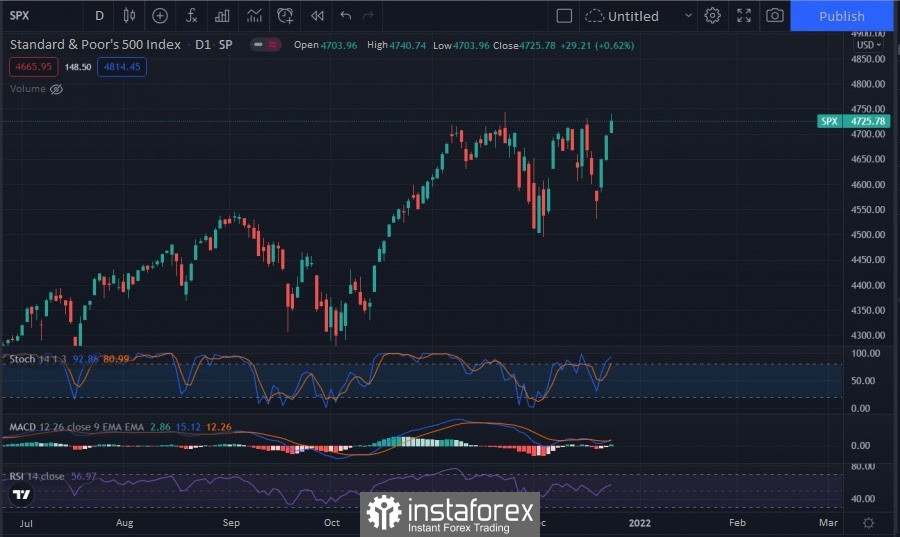
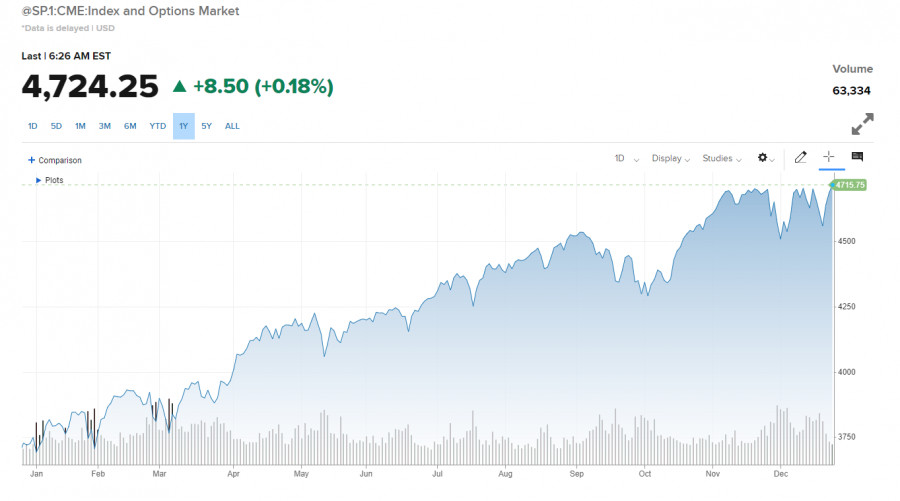
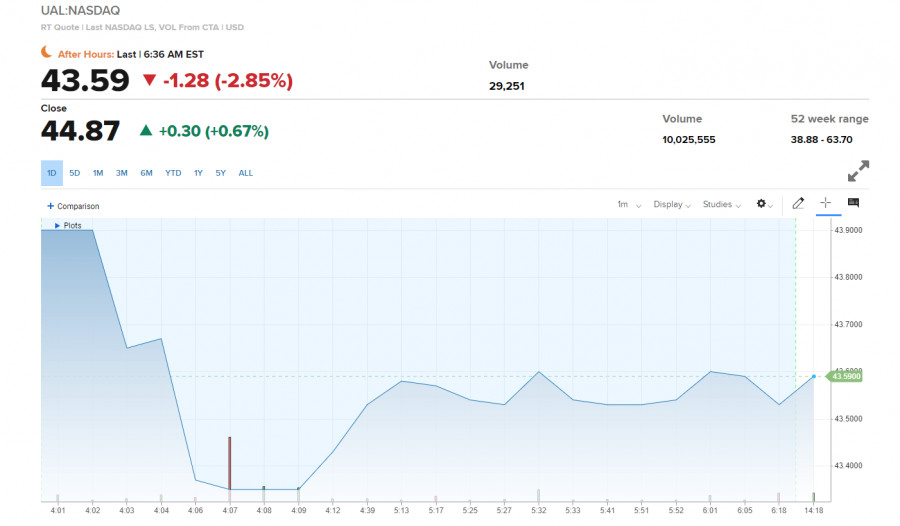
| US premarket for December 27: can stock market remain at highs until end of year? Posted: 27 Dec 2021 03:42 AM PST US stock index futures declined slightly from Thursday's close and are not showing much momentum because of the Christmas holiday, which is affecting traders and investors on Monday. However, the spread of the Omicron strain could have a negative effect by the end of the year. Dow Jones futures were down by 10 pips on Monday, while the S&P 500 and Nasdaq futures are also trading in the red zone, though markets are not under much pressure amid low volatility. On Thursday, the Dow Jones Industrial Average gained 196.67 pips, or 0.55%, while the S&P 500 increased by 0.62% and closed at an all-time high. That left less than 0.4% to another all-time high. The Nasdaq Composite Index was up by 0.85%. Investors' sentiment was boosted by new research suggesting that the Omicron strain will have a less severe impact on the economy than other COVID-19 variants.
Robust statistics also allowed investors to go into the Christmas holiday in a positive sentiment. Many of Thursday's economic data pointed to a stable economy with good prospects for job growth and consumer spending. The Personal Consumption Expenditures Index, closely watched by the Fed, was up by 0.6% in November on a monthly basis. The Core PCE index rose by 4.7% year-over-year in November. Only the Dallas Fed's manufacturing index is expected to be released today. On Sunday, US infectious disease specialist Dr. Anthony Fauci said that cases of COVID-19 are likely to continue to rise as the Omicron variant spreads rapidly around the world. The average was about 150,000 cases for the past week, and it is likely to be much higher after the Christmas and New Year's holidays. According to Johns Hopkins University, more than 52 million cases have been reported in the US. And now Omicron strain is the driving force behind the surge, which dominated earlier this month. Against this backdrop, at the premarket, securities of travel and airline companies, led by United Airlines Holdings Inc. were sold-off after news that hundreds of flights were canceled over Christmas due to a COVID-19 spike. Notably, the outlook for monetary policy now depends directly on how comfortable companies and businesses will feel in the future during the next wave of the pandemics. United Airlines Holdings Inc. stock has already lost more than 2.85% before the market opened and the pressure is likely to increase.
Dr. Anthony Fauci also said that Americans should remain alert because reported cases of Omicron lead to more hospitalizations for patients, even though the data suggest that symptoms of the strain may have less serious effects. As for the technical analysis of the S&P500 index On Thursday, the price broke through support at $4,718. In case of a return of pressure on the index, this level may provide support. Its breakthrough is likely to drag the index down to $4,665 and $4,611, below which the buyers may have real problems. Below that level there are $4,551 and $4,512, which we might return to very quickly if the situation with the pandemics worsens. Now the important target for the buyers is to go beyond the all-time high around $4,751. Following such a scenario, the price is likely to retest $4,766 and $4,779. The material has been provided by InstaForex Company - www.instaforex.com |
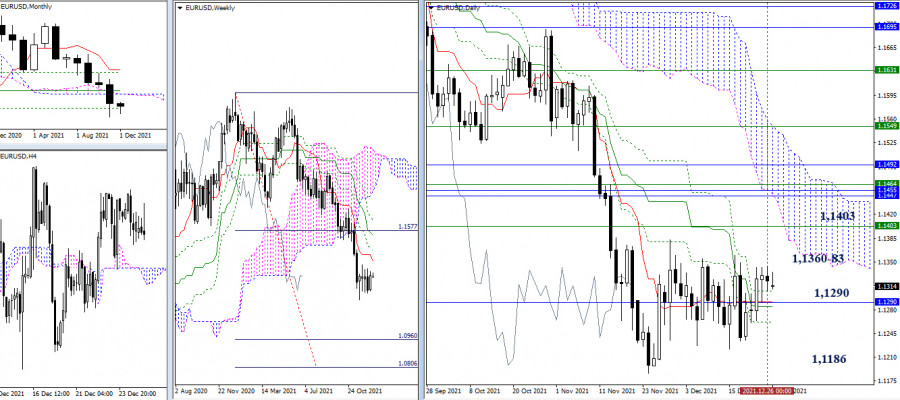
| Technical analysis recommendations of EUR/USD and GBP/USD on December 27, 2021 Posted: 27 Dec 2021 03:11 AM PST EUR/USD
The past week was spent in the active consolidation zone. None of the traders manage to achieve changes in the current situation. The end of the month and year is approaching, so it is possible that the results will somehow affect the distribution of forces, although it is very possible that changes and new prospects are already planned next year. The center of attraction is still the monthly level of 1.1290, which has recently been combining its efforts with the Ichimoku day cross (1.1308 - 1.1291 - 1.1261). For the bulls, it will be important for them to break through the nearest resistance levels of 1.1383 - 1.1360 (consolidation highs) and 1.1403 (weekly short-term trend). As for the bears, the minimum consolidation extremum (1.1186) remains to be a pivot point.
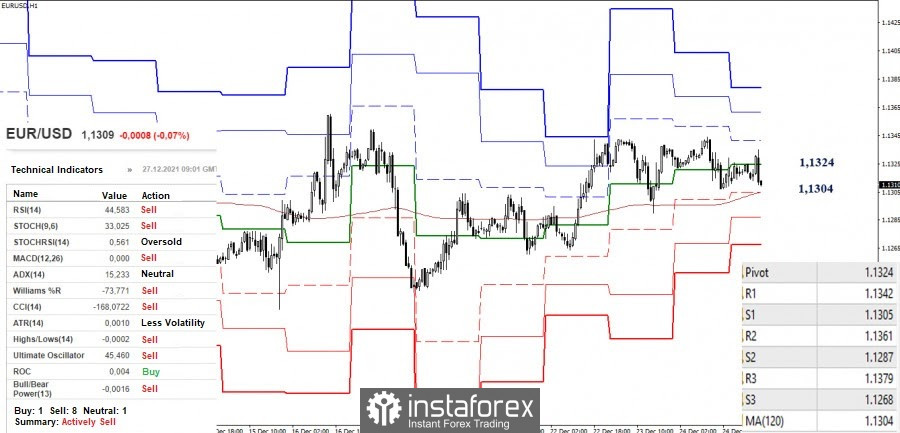
The key levels in the smaller timeframes (central pivot level 1.1324 + weekly long-term trend of 1.1304) are now in the attraction and influence zone of levels of higher timeframes (1.1308 - 1.1290 - 1.1261). Therefore, uncertainty dominates even in smaller intervals. To change the current situation, results, consolidation, and confirmation in the higher timeframes are needed. Today, intraday support can be designated at 1.1287 - 1.1268 (classic pivot levels). The resistances of the classic pivot levels are now at 1.1342 - 1.1361 - 1.1379. GBP/USD
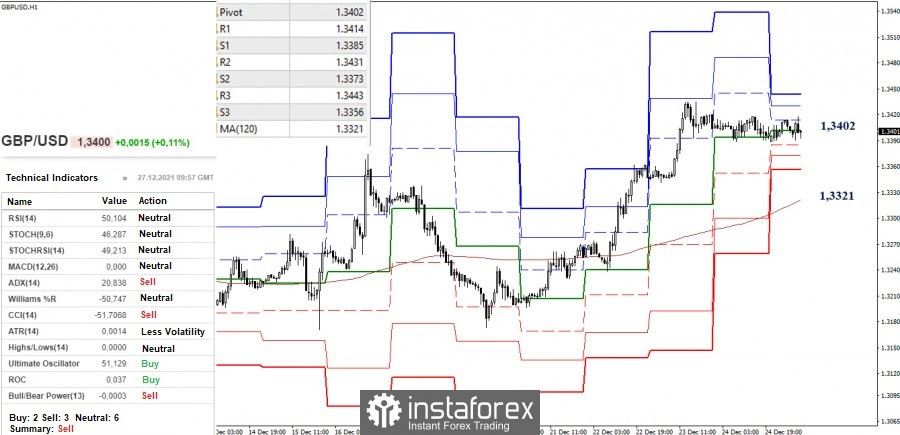
At the close of last week, bullish traders were able to form another pullback from the monthly support (1.3164) and returned to the weekly bullish cloud. As a result, the main task for holding positions and consolidating what has been reached is to maintain the position above the daily dead cross of Ichimoku (1.3341 - 1.3303 - 1.3272) and the lower border of the weekly cloud, which has changed its position today and is now at 1.3358. For the development of prospects and the emergence of new pivot points, the bulls should break through the resistance zone, consisting of weekly levels (1.3429 - 1.3475) and a daily cloud.
The bulls have the main advantage in the smaller timeframes. Nevertheless, the pair has been in the correction zone for a long time, the center of which is now the central pivot level (1.3402). The intraday upward targets are set at 1.3431 - 1.3443 (classic pivot levels). If a downward correction develops, the depth of decline without changing the current balance of power may be significant, since the next key level responsible for the distribution of benefits is currently at 1.3321 (weekly long-term trend). *** Ichimoku Kinko Hyo (9.26.52) and Kijun-sen levels in the higher time frames, as well as classic Pivot Points and Moving Average (120) on the H1 chart, are used in the technical analysis of the trading instruments. The material has been provided by InstaForex Company - www.instaforex.com |
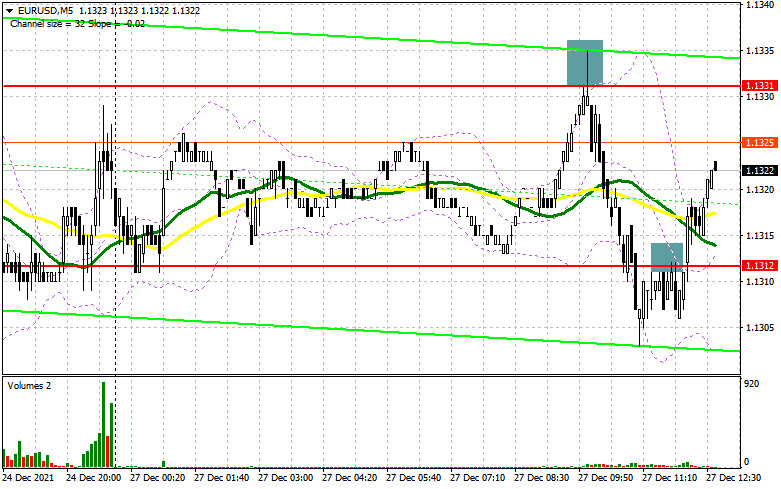
| EUR/USD: the plan for the American session on December 27. Analysis of morning deals. Posted: 27 Dec 2021 03:02 AM PST To open long positions on EURUSD, you need: In my morning forecast, I paid attention to the 1.1331 level and advised making decisions on entering the market. Let's look at the 5-minute chart and figure out what happened. Against the background of the lack of fundamental statistics and new buyers willing to open long positions at current highs, the euro sank slightly. An unsuccessful attempt to grow above 1.1331 and the formation of a false breakdown there led to the formation of a good sell signal. As a result, the euro fell by 25 points. Closer to the middle of the day, the bears achieved a breakdown and consolidation below 1.1312, testing it from the bottom up, but this did not lead to a new sale. I had to fix losses and revise the technical picture for the afternoon. And what were the entry points for the pound this morning?
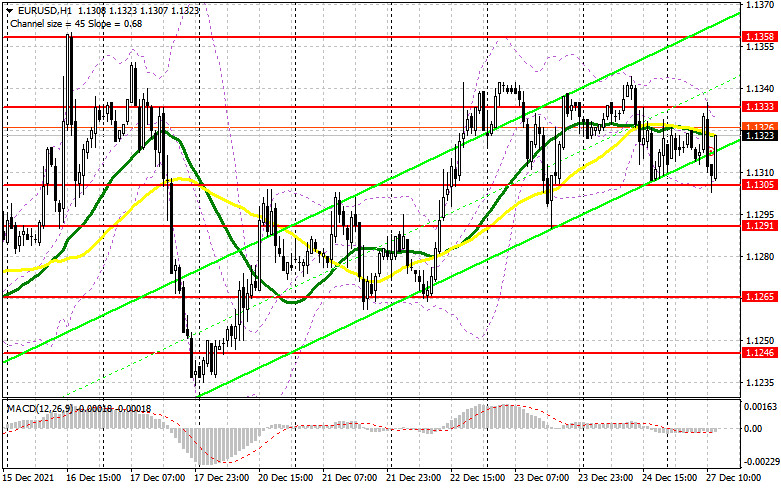
Most likely, during the American session, the pair will continue to trade in the wider side channel 1.1305-1.1333. Today, there are no important statistics on the American economy, and many markets are closed after Christmas, so volatility and trading volume will remain extremely low. A large buyer is visible on the market at the base of the 13th figure. The formation of a false breakdown at the level of 1.1305 in the afternoon will be a signal to buy the euro in the expectation of recovery to the resistance of 1.1333, just below which the moving averages are located, playing on the sellers' side. An equally important task will be the breakdown of this range, and the reverse test from top to bottom will open up the possibility of growth in the area of new levels: 1.1358 and 1.1381, where I recommend fixing the profits. A more distant target will be the 1.1415 area. With the pair declining during the European session and the absence of bull activity at 1.1305, it is best to postpone purchases to larger support of 1.1291. This strategic level is very important for buyers, so you can count on an active growth of the pair from this range. However, I advise you to open long positions there when forming a false breakdown. The last hope of buyers to keep the pair in the upward correction channel will be the minimum of 1.1265, from which it is possible to open long positions immediately for a rebound with the aim of an upward correction of 20-25 points within the day. To open short positions on EURUSD, you need: In case of further growth of the pair, and the balance has returned after another unsuccessful breakdown of the 13th figure, sellers need to try to do everything possible to protect the resistance of 1.1333. Given that there are no important statistics today, the bears may be able to do this, although trading is unlikely to go beyond the side channel. Low trading volume after Christmas will restrain volatility, which will lead to the formation of contradictory signals for entering the market. Only the formation of a false breakdown at 1.1333 forms the first entry point into short positions in the expectation of a return of pressure on the pair and a decline in the area of 1.1305. A more active struggle will unfold for this level. A breakdown and a bottom-up test of this range will give an additional signal to open short positions with the prospect of reducing the pair to a large support level of 1.1291. Only going beyond this level will demolish several buyers' stop orders and cause a larger drop in EUR/USD with the update of the lows 1.1265 and 1.1246, where I recommend fixing the profits. In the case of the growth of the euro and the lack of activity of bears at 1.1333, it is best not to rush with sales. The optimal scenario will be short positions when forming a false breakdown in the area of 1.1358. You can sell EUR/USD immediately on a rebound from the maximum of 1.1381, or even higher - around 1.1415 with the aim of a downward correction of 15-20 points.
The COT report (Commitment of Traders) for December 14 recorded a decrease in both short and long positions, but the latter turned out to be slightly more, which led to an increase in the negative value of the delta. However, it is worth noting that these data do not take into account the results of the meeting of the Federal Reserve System and the European Central Bank. But if we look at the overall picture, trading in the side channel remains the same, and even the meetings of the central banks did not allow us to decide on the further direction of the pair. Buyers of risky assets are not in a hurry to build up long positions even after the statement of the European Central Bank that it plans to fully complete its emergency bond purchase program in March next year - this indicates a change in the bank's policy towards its tightening. On the other hand, the Federal Reserve is already planning to raise interest rates by this time, which makes the US dollar more attractive. However, the uncertainty with the new strain of coronavirus continues to scare market participants away from active actions: no one wants to buy an overbought dollar, but the cheap euro is also not a very attractive tool yet. The COT report indicates that long non-commercial positions decreased from the level of 194,869 to the level of 189,530, while short non-commercial positions fell from the level of 203,168 to the level of 201,409. This suggests that traders are taking a wait-and-see attitude against the backdrop of all the uncertainty with the global economy. At the end of the week, the total non-commercial net position increased its negative value from -8,299 to -11,879. The weekly closing price did not change at all due to the side channel – 1.1283 against 1.1283 a week earlier. Signals of indicators: Moving Averages Trading is conducted below 30 and 50 daily moving averages, which indicates an attempt by bears to bring the market back under their control. Note. The period and prices of moving averages are considered by the author on the hourly chart H1 and differ from the general definition of the classic daily moving averages on the daily chart D1. Bollinger Bands A breakthrough of the lower limit of the indicator in the area of 1.1305 will lead to a larger drop in the euro. A break of the upper limit around 1.1330 will push the euro to new highs. Description of indicators
|
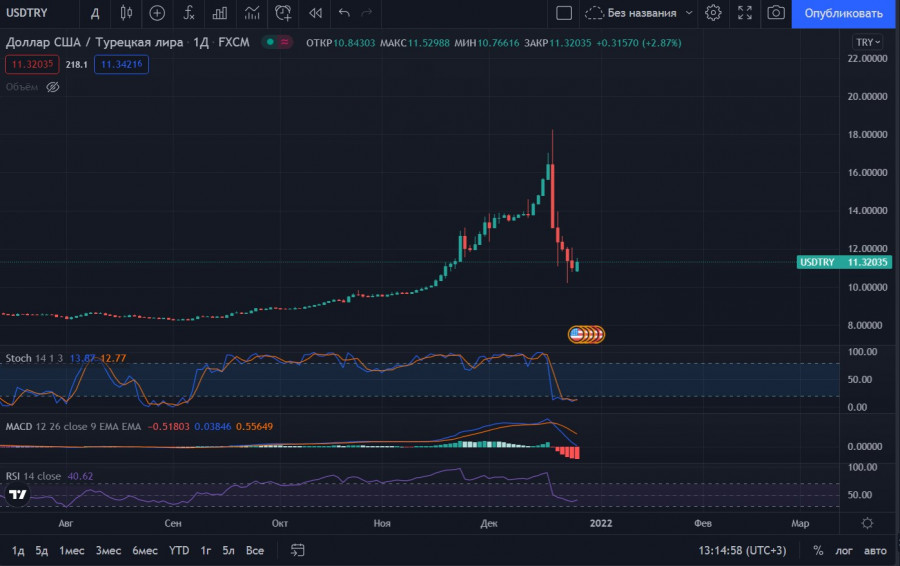
| What caused the Turkish lira to fall? Posted: 27 Dec 2021 02:41 AM PST
Following unprecedented growth last week, which was caused by the introduction of a new deposit instrument to protect depositors from currency depreciation, the Turkish lira plunged sharply against the US dollar as it headed towards equilibrium.
In accordance with the mechanism announced last week, the government will compensate for losses incurred by holders of lira deposits if the depreciation of the lira against hard currency exceeds bank interest rates. Despite the fact that such a move provoked a surge in the exchange rate last week, questions remain about the possible fiscal and inflationary impact of the policy. President Recep Tayyip Erdogan said the central bank will not rush to stabilize the exchange rate, saying it will settle it itself. Ibrahim Aksoy, HSBC Holdings Plc Turkey's chief economist, said the comments of the president could indicate that his government is seeking to maintain the exchange rate. "Despite this, Turkish residents are still trying to buy foreign currency," Aksoy said. He added that if the possible sales of foreign currency by the central bank decrease, then the rate of upward movement of the dollar may increase. According to the data, the producer confidence index fell in December, reflecting the effects of the extreme volatility observed this month. The Turkish Stock Exchange applied the so-called growth rule for the Borsa Istanbul 100 benchmark stock index, and at the start of trading, the index rose by as much as 5%. The material has been provided by InstaForex Company - www.instaforex.com |
| China Evergrande Group increased pace of debt repayment Posted: 27 Dec 2021 02:37 AM PST
China Evergrande Group announced that the company has resumed construction of most of its projects under pressure from the government to pay its debts.According to the company's statement, nearly 92% of Evergrande's real estate projects have been resumed, up from 50% in September. The number of workers involved in the projects that have resumed construction has increased to 89,000 by 31% since September.Evergrande is struggling with more than $300 billion in liabilities as the government's campaign to reduce developer debt and curb years of speculation in the housing market affect the situation.With concerns that a deepening industry crisis would hurt economic growth and undermine social stability, Beijing has begun cutting financing for some developers as well as homebuyers.In its quarterly monetary policy statement, China's central bank promised to boost support for the economy, while reiterating its goal of promoting strong growth in the real estate sector as well as protecting property buyers' rights and fully satisfying demand.According to Wang Menghui, Minister of Housing and Urban-Rural Development, the government will make efforts to stabilize land and housing prices and ensure reasonable demand. Evergrande will need maximum productivity to be able to provide 39,000 apartments in 115 projects during this month.The company also reported that more than 80% of Evergrande's business partners, such as decorators and permanent material suppliers, have resumed working with the company. In addition to obligations to banks, suppliers, and individual investors in capital management products, Evergrande has $7.4 billion in bonds maturing in 2022.The company expects to pay a coupon of about $255 million on the two-dollar bills on Tuesday. Most of the offshore dollar notes are trading below $0.23 on the dollar.Evergrande's stock declined by 90% this year. The material has been provided by InstaForex Company - www.instaforex.com |
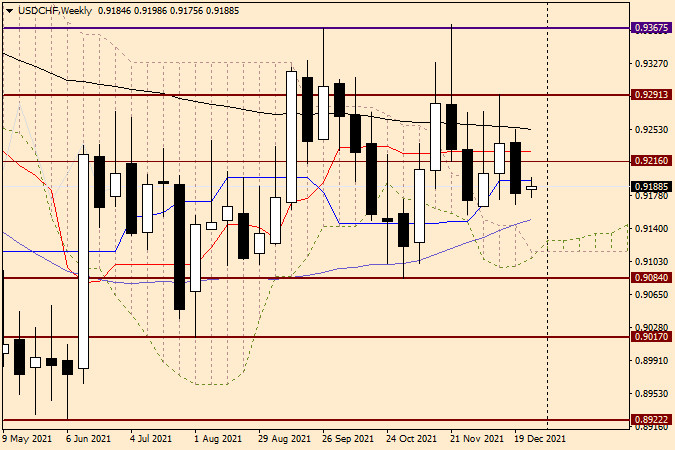
| Technical analysis for USD/CHF on December 27 Posted: 27 Dec 2021 02:34 AM PST Greetings! Today, we will analyze the technical indicators of another currency pair - USD/CHF. Today is Monday. This is why we will start the technical analysis of the dollar/franc pair by having a look at the weekly chart. Weekly
Judging the chart, traders are hesitant to pick up a trend now. As seen, recently the pair has been showing its growth for two weeks in a row, followed by a two-week decrease. In particular, at the session held on December 20-24, its rise was limited by the black 89 exponential moving average, which moved at 0.9254. It is also recommended to pay attention to the red line of the Tenkan Ichimoku indicator. I believe that it played a big role in the reversal of the pair and its subsequent decline. Moreover, the pair ended last week below the blue Kijun line. The rice is trying to approach this line now. Therefore, at all costs, bulls need to push the price above the Tenkan line and close above the 89 EMA. If this scenario comes true, the price is likely to rise to 0.9300, 0.9360, and 0.9400. If the downward scenario persists, the pair may fall to the 50 simple moving average, which is moving at 0.9150. This is a fairly strong level. The 50 moving averages pass there, which may facilitate the creation of the support level for the pair to rebound. Daily
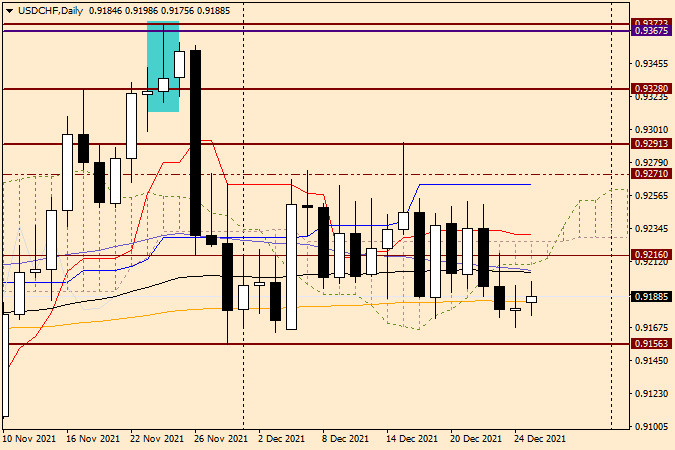
On the daily chart, the pair has declined below the lower boundary of the Ichimoku indicator cloud and closed two consecutive candlesticks below the strong orange 200 exponential average. Today, at the moment of finishing this article, the dollar/franc is trying to return above 200 EMA. We will find out whether the attempt has been successful or not only after the end of today's trading session. Currently, the price is already trading above 200 EMA. However, it will soon face a strong level of 0.9200. It also needs to test 50 MA and 89 EMA. Considering that the lower boundary of the daily cloud also passes a little higher, the odds that the price will be able to break above this level are extremely slim. Tips for trading USD/CHF Due to the unclear singles of technical analysis for this pair, both short and long positions are likely. To open short positions, we need to see reversal candlestick patterns near the 0.9200 and (or) 0.9250 mark at this or smaller time frames. To open long positions, it is better to wait for a short-term pullback to the 0.9180-0.9170 area and bullish candlestick signals. I do not recommend placing orders at high levels. The market is now thin and unpredictable. Good luck! The material has been provided by InstaForex Company - www.instaforex.com |
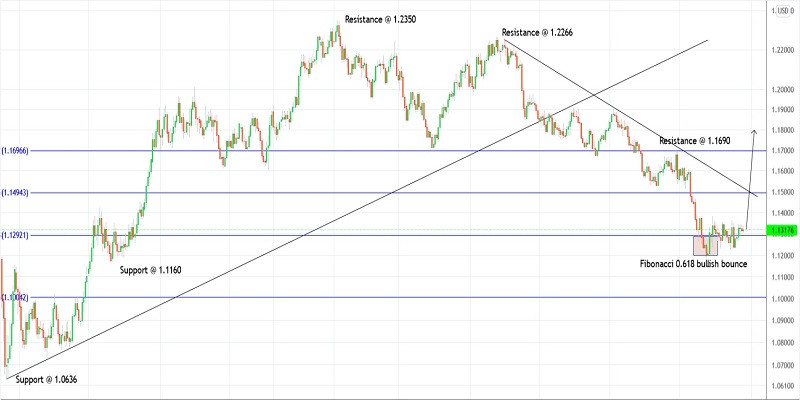
| Trading plan for EUR/USD on December 27, 2021 Posted: 27 Dec 2021 02:33 AM PST
Technical outlook:EU/USD continues to trade within a tight range between the 1.1240 and 1.1340 levels. The currency pair is into its fourth week of consolidation as we approach the last trading week of 2021. A breakout can be expected in the next few trading sessions, which could push prices higher towards 1.1500 at least. A bearish breakout might test 1.1000 before resuming higher again. EUR/USD is carving a potential bullish tringle consolidation within its recent upswing between 1.1186 and 1.1383. The bottom of the range is lcoated near the Fibonacci 0.786 retracement of the above rally around 1.1222. If the above holds well, the pair could be well on its way through the top of the range of 1.1383 as bulls come back into control. The wave structure of EUR/USD also suggests a potential rally towards 1.2350 and higher in the next several weeks. The earlier bullish boundary between 1.0636 and 1.2350 was retraced through the Fibonacci 0.618 level towards 1.1186. Ideally the next leg should rally through the 1.2350 resistance level before reversing lower. Trading plan:Potential rally towards 1.2350 against 1.1100 Good luck! The material has been provided by InstaForex Company - www.instaforex.com |
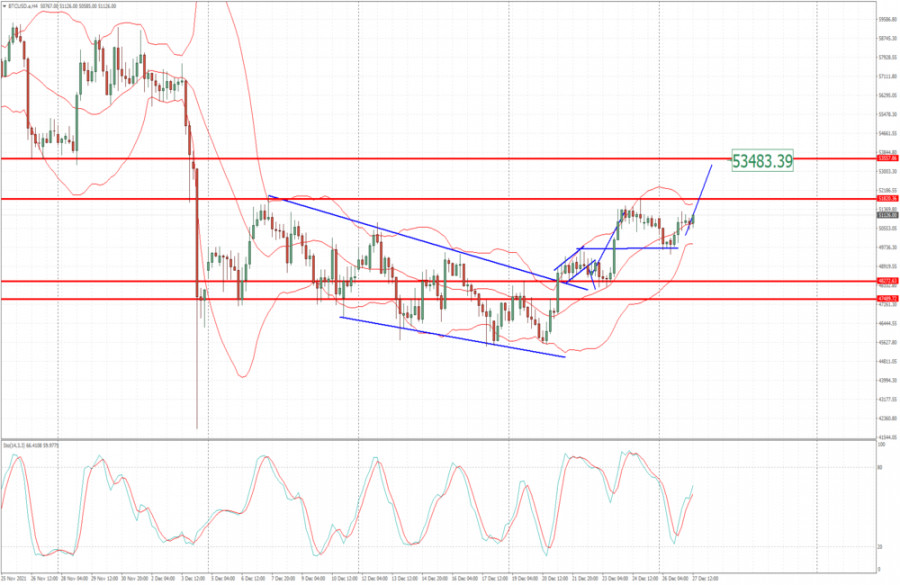
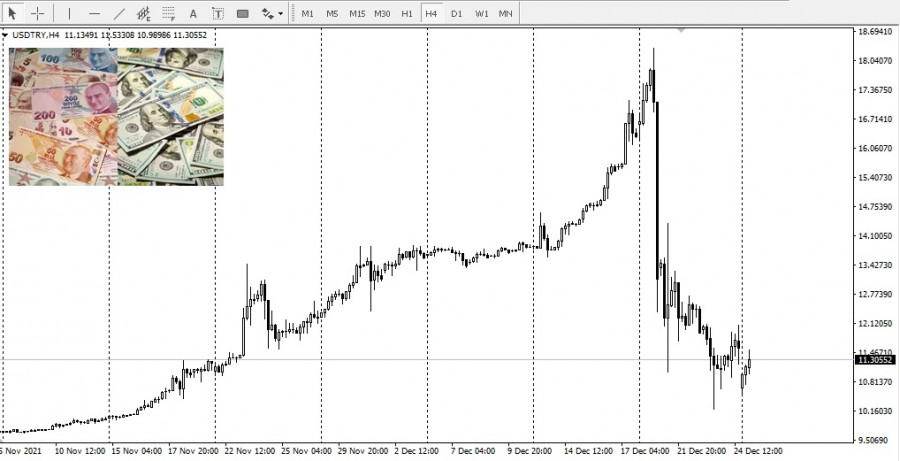
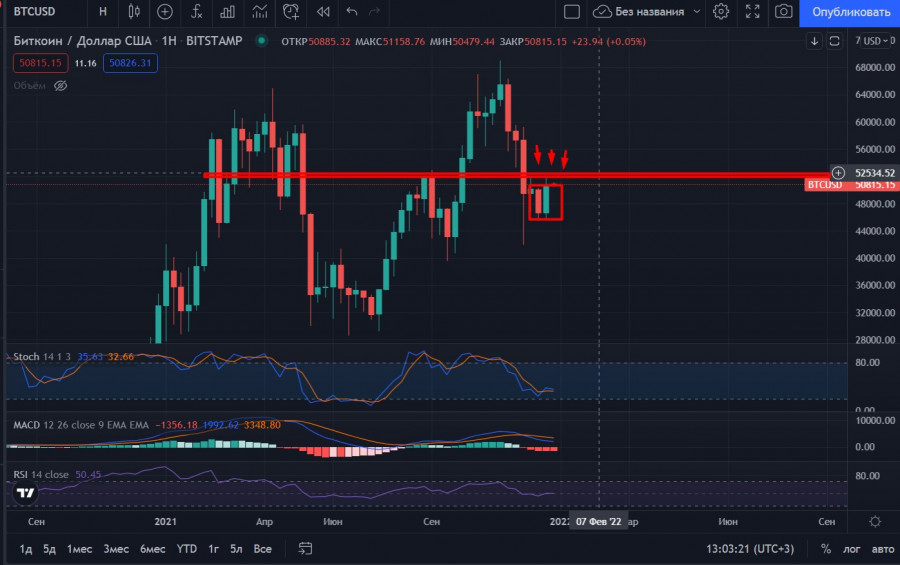
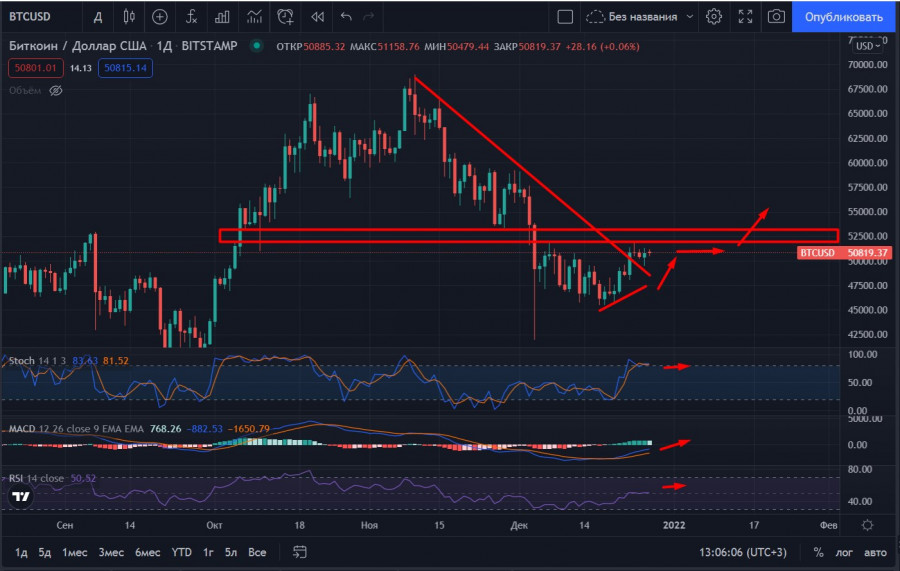
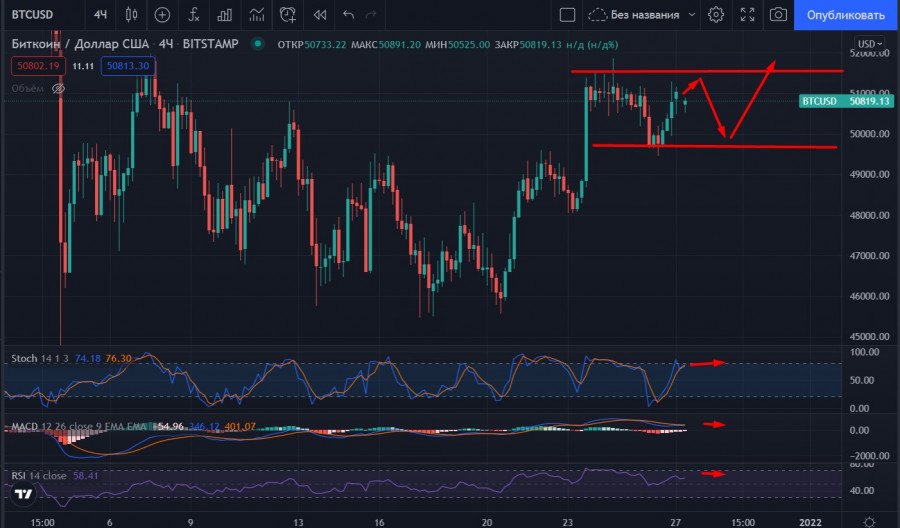
| Turkey may tighten crypto regulation due to sharp fall in lira; BTC ends week on positive note Posted: 27 Dec 2021 02:28 AM PST Bitcoin was able to break through a wide range and end the week with bullish momentum. To cement the upward movement, BTC needs to consolidate above $50.5k-$52k. Now, the on-chain activity is high and investor sentiment is positive. The main threat for a rally comes from the governments of certain states. Their actions may undermine the upward movement of BTC until 2022. Mining in IranDespite China's government crackdown on Chinese miners, about 20% of the bitcoin hashrate is still concentrated there. Naturally, it would be quite reasonable to expect negative news about the problems of BTC mining from China. However, this time, the Iranian government has suspended the mining of cryptocurrencies due to power outages. Near 30 official miners will be able to resume work in the fall of 2022. It is still difficult to assess the impact of this ban on bitcoin, but this is definitely a bearish factor. Demand for BTC is reaching its peak. Therefore, a drop in the computing power of BTC may adversely affect the BTC quotes. Turkey is to introduce a crypto lawAs of December 27, more than a million crypto transactions are carried out daily in Turkey. The main reason for this is the record fall in the national currency - the Turkish lira. It plunged by 60% against the US dollar last week. The citizens of the country have invested heavily into crypto to protect their funds against the high volatility of fiat money. The euphoria around cryptocurrencies forced the Turkish government to intervene. At the beginning of 2021, Turkey's President Recep Erdogan announced the adoption of a bill to tighten the regulation of digital assets. Earlier, Recep Erdogan stated that he did not rule out softening the country's stance on cryptocurrencies but he did not actually intend to promote their widespread use. This is why the new bill is highly likely to bring nothing good to cryptocurrencies. "We will take steps on this issue by sending (the bill) to Parliament without delay. Turkey will make a leap forward with its new economic model. It is worth taking these risks," he said.
BTC forms a bullish patternDespite negative fundamental background, bitcoin has risen above $50k. BTC exchange reserves dropped to the lowest level on record, while the number of unique addresses remains high. The main reason for optimism is the formation of a bullish pattern on the weekly BTC chart. This is the first green candlestick on the weekly chart since November 15. The price rebounded and closed near the previous highs of $52k, which indicates a possible breakout of the resistance level. To retain its bullish momentum, BTC needs to consolidate in the $50k support zone, push off from it and continue the upward movement.
Outlook for this weekOn the daily chart, bitcoin has broken through the downward resistance line from November 10. It is trying to consolidate above it. In addition, a breakout of the Wedge took place. As of 12:00, bitcoin is hovering above $50.5k. The formation of weak bullish and bearish candlesticks on the daily chart indicates that the forces of sellers and buyers are approximately equal. If bulls want to assert strength, they need to push the price above $52k.
The 4H chart clearly shows that the price is moving within the range of $49.6 k-$52k. The $52k level acts as the resistance zone. Judging by the formation of 4H candlesticks, the bullish momentum has fizzled away. It may signal a decline in the price to the lower boundary of the area. If the support level is not broken, the price may attempt again to test $52k. If the attempt turns out to be unsuccessful, the price will most likely break through the $49.6k zone and dive into the $42k-$45k range. Traders are sure to close their long positions and lock in profits at this level. After that, BTC may move to ATH but already in 2022. If bitcoin breaks above $52k after a test, then the price is expected to move to the $56k level. If this scenario comes true, BTC is likely to end the year near $60k.
|

| You are subscribed to email updates from Forex analysis review. To stop receiving these emails, you may unsubscribe now. | Email delivery powered by Google |
| Google, 1600 Amphitheatre Parkway, Mountain View, CA 94043, United States | |


Comments