Forex analysis review
Forex analysis review |
- December 31, 2021 : EUR/USD daily technical review and trading opportunities.
- December 31, 2021 : EUR/USD Intraday technical analysis and trading plan.
- December 31, 2021 : GBP/USD Intraday technical analysis and significant key-levels.
- Ichimoku cloud indicator analysis on MS stock price.
- Expecting bullish start in 2022 for NZDUSD.
- Weekly EURUSD analysis for December 31, 2021.
- USD/JPY technical analysis for December 31, 2021
- EUR/USD analysis and forecast for December 31, 2021
- EUR/USD analysis for December 31, 2021 - Key resistance set at 1.1385
- Trading signals for Crude Oil (WTI- #CL) on December 31, 2021: sell below 76.40 (21 SMA)
- USDCHF breaks below key support trend line.
- Ichimoku cloud indicator analysis on Gold for December 31, 2021.
- Sri Lanka's stock market booms
- Video market update for December 31,,2021
- Analysis of Gold for December 31,.2021 - Breakout of key resistance at $1.820
- Trading signals for GBP/USD on December 31, 2021: buy above 1.3470 (21 SMA)
- US stock market closes in negative territory ahead of New Year's Eve
- USD/CAD analysis for December 31, 2021 - Srong downside breakout of consolidation
- Technical Analysis of GBP/USD for December 31, 2021
- Technical Analysis of AUD/USD for December 31, 2021
- Forex forecast 12/31/2021 EUR/USD, GBP/USD, SP500, Gold and Bitcoin from Sebastian Seliga
- What will be the prices for platinum and palladium in 2022?
- Daily Video Analysis: USDCAD, H4 Bearish Breakout Opportunity
- 2022 could be a positive year for Bitcoin
- Bitcoin climbs higher
| December 31, 2021 : EUR/USD daily technical review and trading opportunities. Posted: 31 Dec 2021 09:25 AM PST
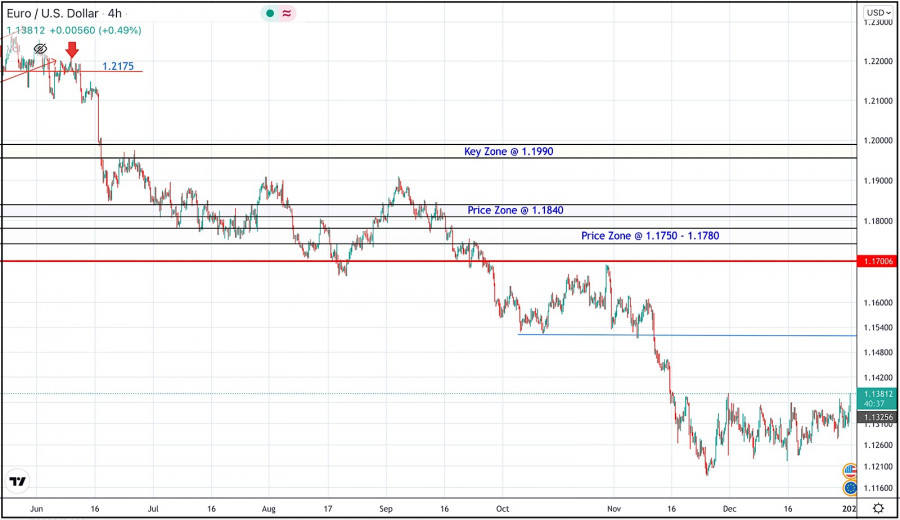
During the past few weeks, the EURUSD pair has been trapped within a consolidation range between the price levels of 1.1700 and 1.1900. In late September, Re-closure below the price level of 1.1700 has initiated another downside movement towards 1.1540. Price levels around 1.1700 managed to hold prices for a short period of time before another price decline towards 1.1200. Currently, the price zone around 1.1500 stands as a prominent supply-zone to be watched for SELLING pressure and a possible SELL Entry upon any upcoming ascending movement. Moreover, it is not advised to add new SELL Entries as the pair already looks oversold. The material has been provided by InstaForex Company - www.instaforex.com |
| December 31, 2021 : EUR/USD Intraday technical analysis and trading plan. Posted: 31 Dec 2021 09:24 AM PST
The bullish swing that originated around 1.1650 in August, failed to push higher than the price level of 1.1900. That's why, another bearish pullback towards 1.1650 was executed. However, extensive bearish decline has pushed the EURUSD pair towards 1.1600 and lower levels was reached. Shortly after, significant bullish recovery has originated upon testing the price level of 1.1570. The recent bullish pullback towards 1.1650-1.1680 was expected to offer bearish rejection and a valid SELL Entry. Significant bearish decline brought the EURUSD pair again towards 1.1550 levels which stood as an Intraday Support zone. Hence, sideway movement was demonstrated until quick bearish decline occurred towards 1.1200. Please note that any bullish movement above 1.1500 should be considered as an early exit signal to offset any SELL trades. The price levels around 1.1520 remain a reference zone that needs to be re-visited when the current bearish momentum ceases to dominate. The material has been provided by InstaForex Company - www.instaforex.com |
| December 31, 2021 : GBP/USD Intraday technical analysis and significant key-levels. Posted: 31 Dec 2021 09:23 AM PST
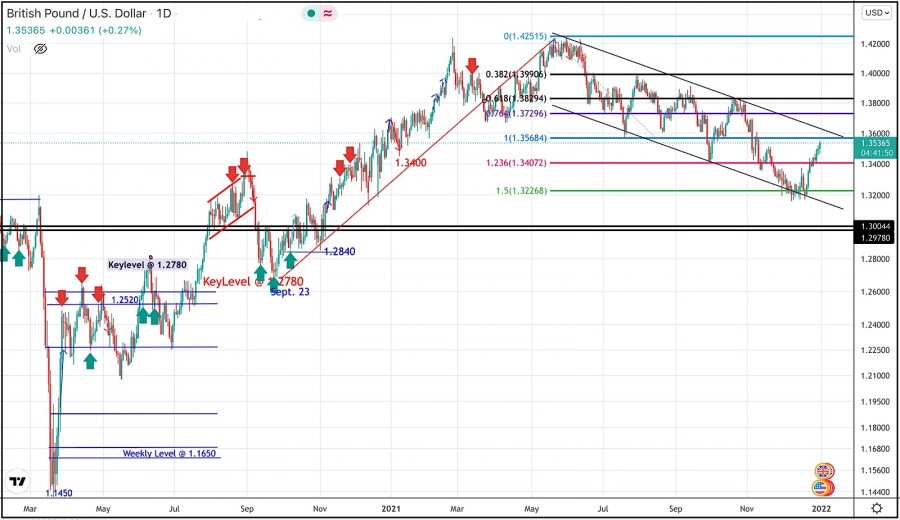
The GBPUSD pair has been moving sideways with some bearish tendency while bearish breakout below 1.3600 was needed to enhance further bearish decline. Bearish breakout below 1.3700 enabled quick bearish decline to occur towards 1.3400 which corresponded to 123% Fibonacci Level of the most recent bearish movement. This was a good entry level for a corrective bullish pullback towards 1.3650 and 1.3720 which was temporarily bypassed. Shortly after, the pair was testing the resistance zone around 1.3830 where bearish pressure originiated into the market. More bearish extension took place towards 1.3220 where the lower limit of the current movement channel came to meet with Fibonacci level. Conservative traders should have taken BUY trades around 1.3200 price levels as suggested in previous articles. Current BUYERS are looking towards 1.3570 and 1.3600 as the next target levels to have some profits off the trade. Moreover, the price level of 1.3570 stands as a key-resistance to be watched for bearish reversal if some bearish signs existed upon testing. The short-term outlook remains bullish as long as the pair maintains its movement within the depicted channel above 1.3400. The material has been provided by InstaForex Company - www.instaforex.com |
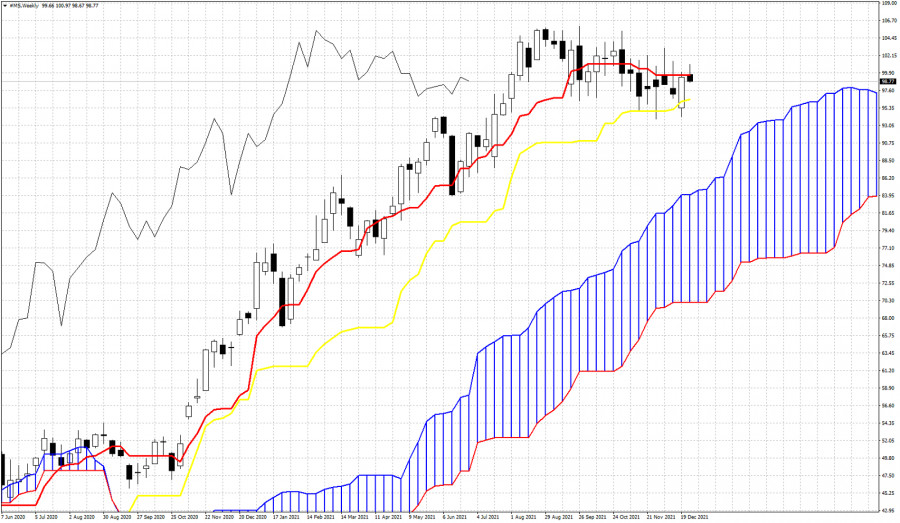
| Ichimoku cloud indicator analysis on MS stock price. Posted: 31 Dec 2021 07:06 AM PST Morgan Stanley stock price is trading around $98.50. As we mentioned in previous posts, we continue to expect that price has made an important top around $104 back in October. We noted the bearish divergence signals and the potential for a reversal.
The weekly price continues to trade above the weekly Kumo (cloud), however with price below the tenkan-sen (red line indicator) there are increased chances of more downside. Support is found by the kijun-sen (yellow line indicator) at $96.44. A weekly close below this level will be an added bearish signal and we should then expect price to move close to the Kumo around $86-88. Resistance is at $99.60 and as long as we see weekly closing prices below this level, we remain pessimistic for MS stock price. The material has been provided by InstaForex Company - www.instaforex.com |
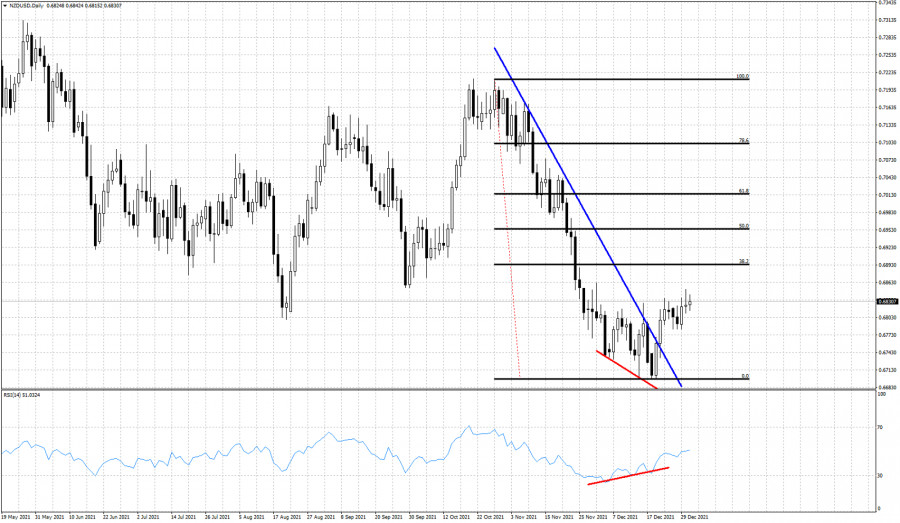
| Expecting bullish start in 2022 for NZDUSD. Posted: 31 Dec 2021 06:47 AM PST The end of the year finds NZDUSD having broken above key resistance and a bullish reversal pattern that could lead NZDUSD towards 0.69-0.70 at the beginning of the year. Recent price action in NZDUSD shows us that the decline from 0.7211 is most probably over and at least a counter trend bounce should be expected.
Blue line- trend line resistance (broken) Black lines- Fibonacci retracements NZDUSD has first given us a reversal warning by the bullish RSI divergence. Then price gave us another bullish signal by breaking the blue downward sloping trend line. NZDUSD has the potential to move towards 0.70 and the 61.8% Fibonacci retracement at least. I expect NZDUSD to be bullish at least for the start of 2022. There is a reversal in progress and at current levels we prefer to be neutral if not bullish. The material has been provided by InstaForex Company - www.instaforex.com |
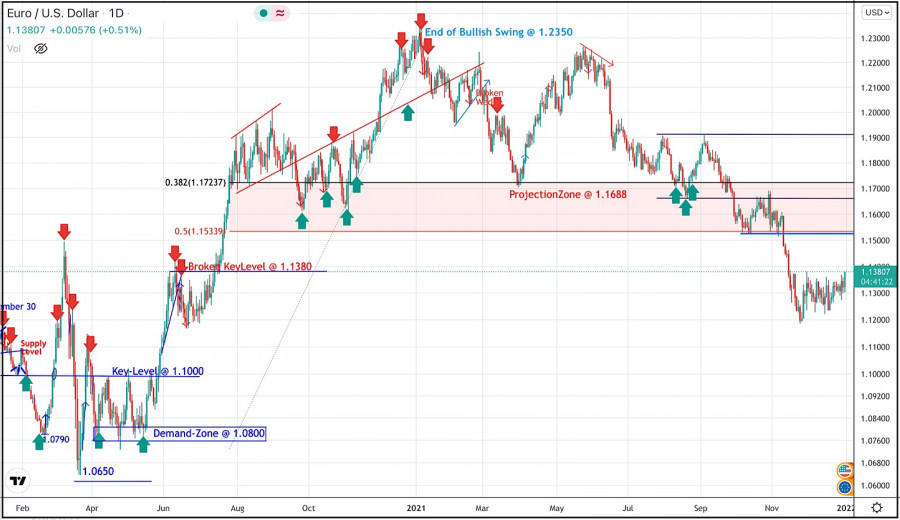
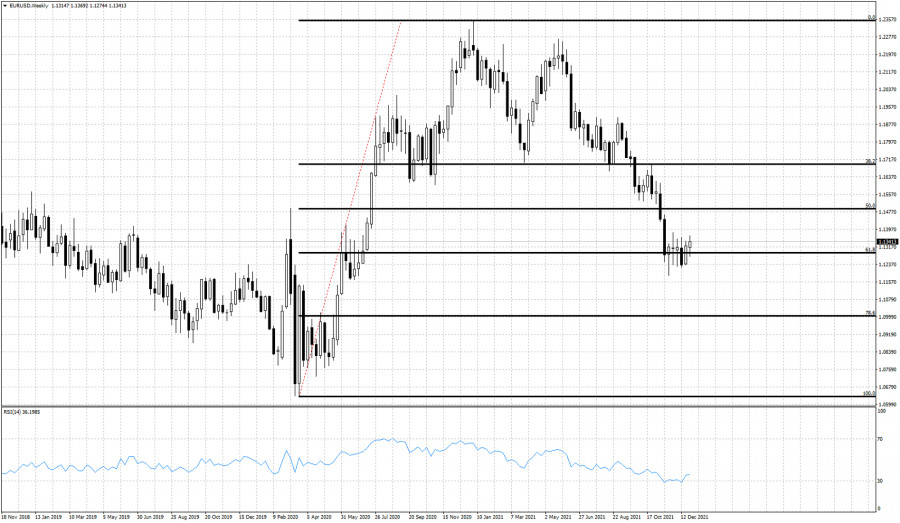
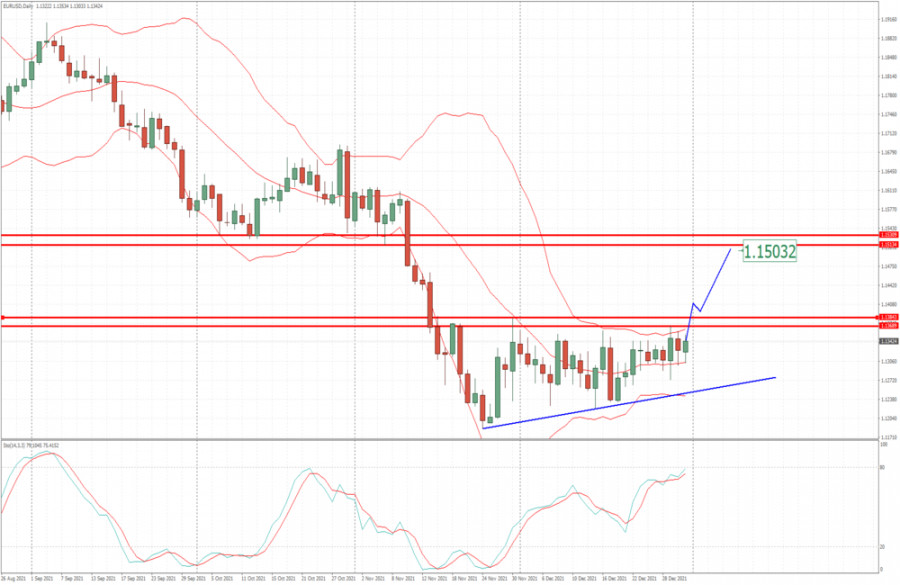
| Weekly EURUSD analysis for December 31, 2021. Posted: 31 Dec 2021 06:34 AM PST The end of the year finds EURUSD near 1.13 nearly 900 pips below from where we started back in January 2021. Price has retraced 61.8% of the entire upward move from 2020 lows to 1.2350 2021 high. The decline has stopped at a key Fibonacci retracement level and we anticipate the new year with increased interest.
At 61.8% retracement level we usually see trend reversals. The RSI in the weekly chart is turning higher from oversold levels. Price has stopped the decline right on top of the 61.8% Fibonacci level. There are increased chances that 2022 will find EURUSD is a bullish trend and price move closer towards 1.17 or even higher. Even a move above 1.2350 for 2022 is in the cards specially if a higher low has been formed at recent lows. EURUSD has the potential for a major reversal from current levels and to make new highs towards 1.25-1.30. The first step towards this direction would be for bulls to make a reversal from current levels and start making higher highs and higher lows. Previous support is now resistance, so the 38% Fibonacci retracement at 1.17 is now key resistance. Breaking above it will increase the chances that a new upward move has started. Over the coming weeks we will revisit this bullish scenario according to what new information the price has given to us. The material has been provided by InstaForex Company - www.instaforex.com |
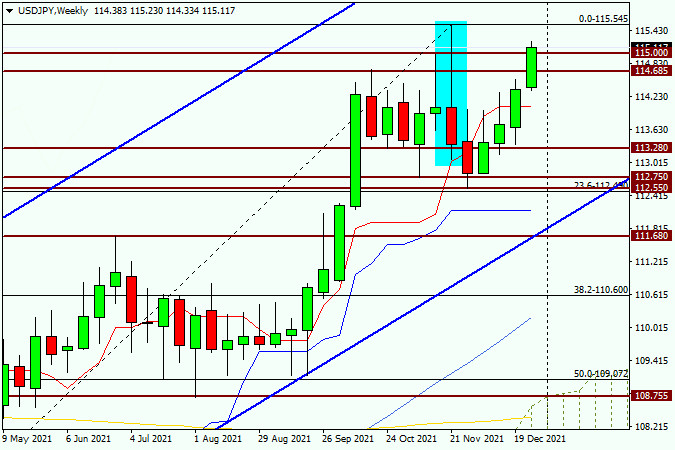
| USD/JPY technical analysis for December 31, 2021 Posted: 31 Dec 2021 06:22 AM PST On the last day of the outgoing year, I propose to consider the technical picture for another major currency pair - dollar/yen. I do not think that in this article it is necessary to thoroughly and for a long time considering the current situation. It would be more correct to do this on Monday, after the opening of the first week of the new year. In the meantime, I propose to summarize the preliminary results and start debriefing on a weekly scale. Weekly
First of all, I think it is important to pay attention to the growth that the USD/JPY pair demonstrated in the outgoing 2021. This is very clearly demonstrated by the Fibonacci tool grid, stretched to the rise of 102.60-115.54. It was from the 102.60 mark that the trading of the ending year started, so the upward trend for the dollar/yen pair does not cause any doubts. This can also be judged by the fact that after the appearance of the reversal highlighted candlestick analysis model, the market did not want to change the trend for this instrument, but only adjusted to the level of 112.55, after which the upward movement of USD/JPY was continued again. However, it will dbe possible to judge this only after the true breakdown of the sellers' resistance at 115.54. In my opinion, everything is going to this. At the moment, the pair is testing the most important historical, technical and psychological level of 115.00 for an upward breakdown, trading right now near 115.08. The closing of the week and the outgoing year above this landmark level will strengthen bullish sentiment on the instrument, as a result of which, most likely, a breakdown of the resistance of 115.54 will take place. However, today the pair can overcome this mark. What is the market not joking about? At least, there is a clear bullish sentiment for USD/JPY, which, taking into account the global bullish trend, leaves good prospects for the subsequent growth of the quote. And yet, at this point, the market is focused on the resistance level of 115.54. Let's see how today's weekly and annual trades will end. Daily
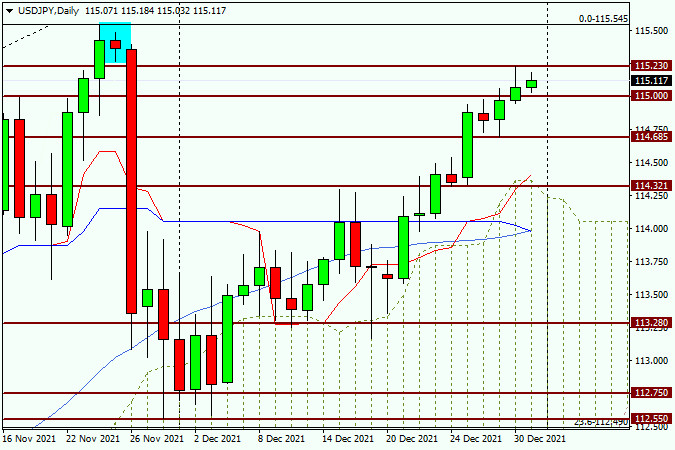
But on the daily chart, the overall bullish picture was slightly spoiled by yesterday's candle, which has a fairly significant upper shadow. Today, the main task of the players to increase the exchange rate will be to rewrite yesterday's highs at 115.23 and close trading above this mark. If the bulls on the instrument manage to complete this task, repeated testing for a breakdown of the sellers' resistance at 115.54 will become inevitable. However, I would like to remind you once again that after the new year, and in our case, it is January 3, the auction can open with a fairly impressive gap in one of the sides. Given the upward trend and the generally bullish sentiment for the dollar/yen pair, if such a gap happens, then, with a high degree of probability, it will go up. If so, then the 115.54 mark will be passed, and on the rollback to it, it will be possible to consider options for opening long positions. Today it no longer makes sense to open new positions, but I strongly recommend closing the old ones and quietly leaving for the celebration of the New Year. The material has been provided by InstaForex Company - www.instaforex.com |
| EUR/USD analysis and forecast for December 31, 2021 Posted: 31 Dec 2021 06:22 AM PST Today, on the last day of the outgoing year, we will try to summarize the main currency pair of the Forex market and start with the fundamental component. As many of you can well imagine, the US economy is demonstrating a faster pace of recovery from the negative consequences of the COVID-19 pandemic, the peak of which I consider to have already passed. The US Federal Reserve System (FRS) has taken tougher and earlier steps to support its national economy. Following the Fed, other leading world central banks have also reached out in this direction, which is not surprising, because most of the other leading world central banks are equal to the steps of the Fed in monetary policy. So the European Central Bank (ECB) launched a program to stimulate the region's economy, but a little later, the situation with the spread of COVID-19 in Europe was very difficult, and at times just critical. However, the United States was also in the lead in the number of daily coronavirus diseases. The current situation with COVID-19, in my personal opinion, is already much calmer than it was about a year ago. The last strain of the virus called "Omicron", according to most virologists, is not as dangerous in terms of the degree of influence and tolerability by the human body as the Delta strain. Nevertheless, as they say, it's too early to relax. However, I want to hope that in the new year the world will be able to cope and overcome the hated COVID. If we return to the two leading world central banks representing the EUR/USD currency pair, the ECB is primarily remembered for the vague speeches and comments of President Christine Lagarde. Often, the market simply ignored her comments, or the reaction to them was extremely weak. However, it is worth adding to the asset of the European Central Bank that, although with some delay, it still made the necessary adjustments for economic support. Regarding the Fed, it is worth noting the re-election of Jerome Powell for a second term as chairman of the Federal Reserve, as well as decisive steps to stimulate economic growth. It is also necessary to pay attention to the fact that by the end of the outgoing year, the Fed's rhetoric was becoming more and more "hawkish", and the number of Fed leaders who spoke in favor of starting tightening monetary policy was steadily increasing. The appointment of Finance Minister Janet Yellen, who led the Fed before Powell, can also be attributed to a very competent step by the administration of US President Joe Biden. In my personal opinion, Janet Yellen is a very competent financier, and with a lot of experience. Daily
If we turn to the consideration of the technical picture for the euro/dollar, then there has not been, and there is no significant progress. At yesterday's auction, the quote showed a decline, and the pair was again saved from a more significant downward trend by the red Tenkan line and the blue Kijun line of the Ichimoku indicator. It is also worth noting that, despite the decline, yesterday's trading on EUR/USD again closed above the most important technical level of 1.1300. At the end of the article, the pair is actively leveling the morning decline, and the current daily candle already has a rather big lower shadow and a bullish body. Dear colleagues, today, on the last day of weekly and annual trading, I do not consider it appropriate to give any trading recommendations for opening fresh positions. But I strongly recommend closing open transactions. As long-term experience shows, after the new year, and on the first of January, the market is closed, trading opens with fairly large price gaps, that is, gaps. Please keep this in mind. The material has been provided by InstaForex Company - www.instaforex.com |
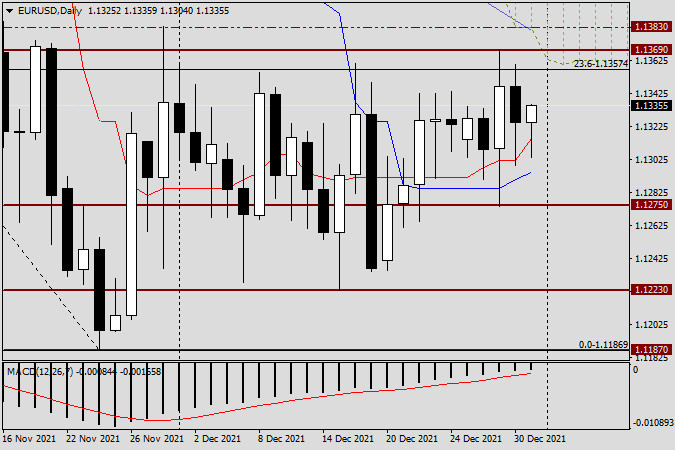
| EUR/USD analysis for December 31, 2021 - Key resistance set at 1.1385 Posted: 31 Dec 2021 06:19 AM PST Technical analysis:
EUR/USD has been trading sideways at the price of 1,1340. Watch for potential upside breakout of key resistance at 1,1385. Trading recommendation: Due to sideways market, watch for potential breakout mode. If the price breaks the level of 1,1385 and build continuation patterns, watch for buying opportunities with the main objective at 1,1500. Stochastic is showing upside regime and no signs for the reversal. Key support is set at the price of 1,1215 The material has been provided by InstaForex Company - www.instaforex.com |
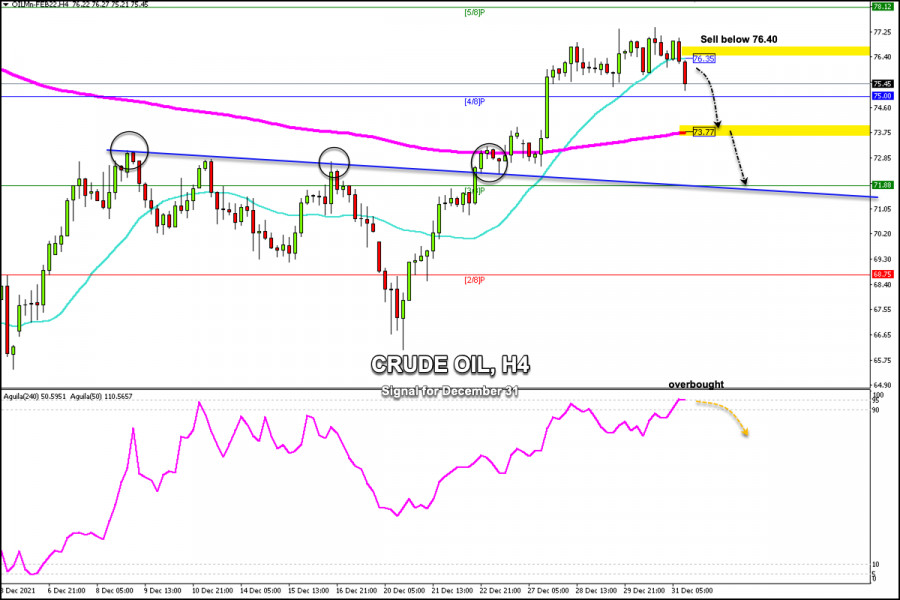
| Trading signals for Crude Oil (WTI- #CL) on December 31, 2021: sell below 76.40 (21 SMA) Posted: 31 Dec 2021 06:17 AM PST
The price of crude oil (WTI- # CL) is trading below the 21 SMA and above the 200 EMA, showing signs of exhaustion. Since the beginning of the week, it has been hovering below 77.00. The price fixation below the 21 moving average and a technical correction are likely to take palce in the coming days towards the 200 EMA located at 73.77. Yesterday, crude prices remained higher as US crude inventories fell -3.6 million barrels, more than expected, which is a positive sign for demand. However, it is technically overbought. A corrective moevement is expected in the next few hours only, if it remains below 76.40. A decline below the 21 SMA could ease upward pressure and give the market an opportunity to buy low with targets at 78.12 (5/8). The main trend is bullish according to the daily chart. A trade through the intraday high of $77.00 will indicate a resumption of the uptrend. A downward move through 73.70 (200 EMA) will turn the main trend down. In this case, the price could fall in the short term to 2/8 Murray at 68.75. The eagle indicator reached the extreme overbought level at 95 points which means that there could be an imminent correction in the coming days. Oil prices could fall to 3/8 of a Murray around 71.88. Support and Resistance Levels for December 31, 2021 Resistance (3) 78.12 Resistance (2) 77.31 Resistance (1) 76.54 ---------------------------- Support (1) 75.67 Support (2) 75.00 Support (3) 73.72 *********************************************************** A trading tip for CRUDE OIL on December 31, 2021 Sell below 76.40 (21 SMA) with take profit at 73.77 (200 EMA) and 71.88 (3/8), stop loss above 77.20. The material has been provided by InstaForex Company - www.instaforex.com |
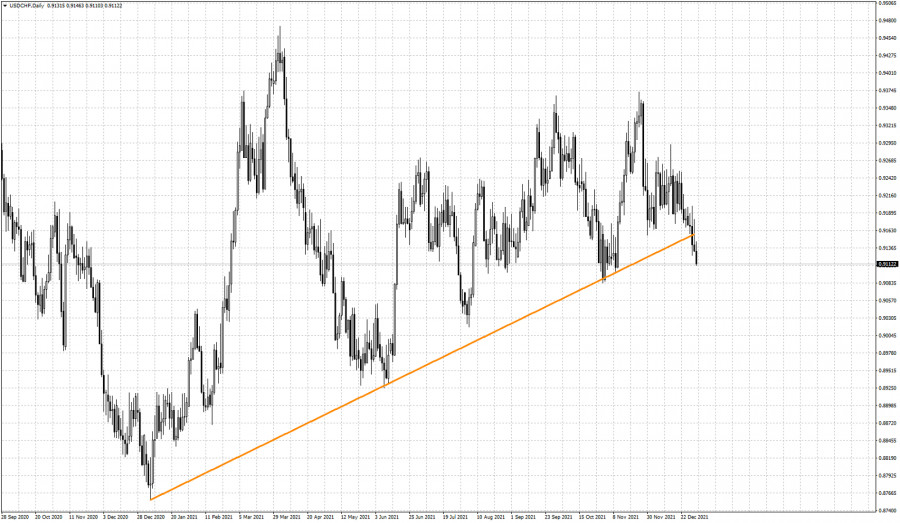
| USDCHF breaks below key support trend line. Posted: 31 Dec 2021 06:10 AM PST In previous posts we noted the importance of the upward sloping support trend line. We noted that trend would remain bullish as long as price were to respect the trend line. Two days ago USDCHF broke below the key support.
Orange line - support trend line USDCHF is trading just above 0.91 after having broken below the upward sloping orange trend line. Next support is the horizontal key level of 0.9084 where a previous low provides support. Short-term trend is bearish and breaking below 0.9084 will open the way for a deeper pull back, even towards 0.89. Price is making lower lows and lower highs. There is no sign of a divergence by the oscillators, so we remain confident that the new year will start with USDCHF being under pressure. The material has been provided by InstaForex Company - www.instaforex.com |
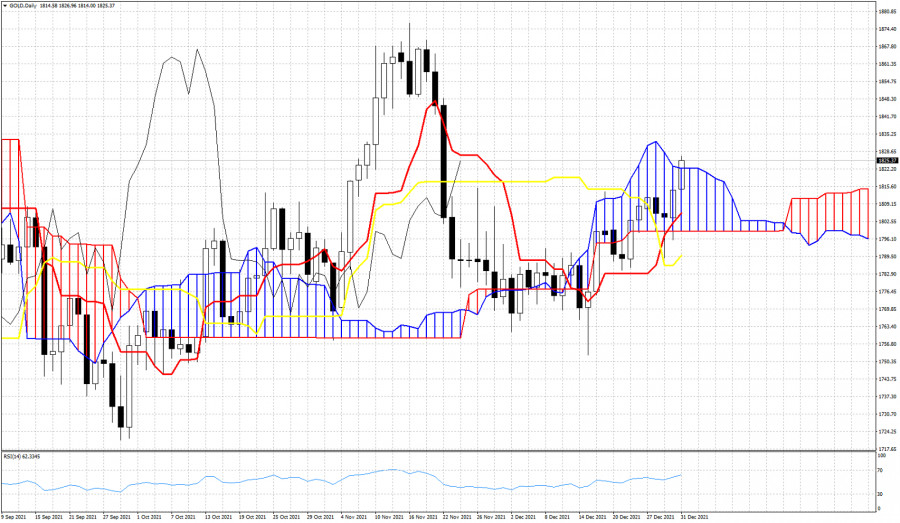
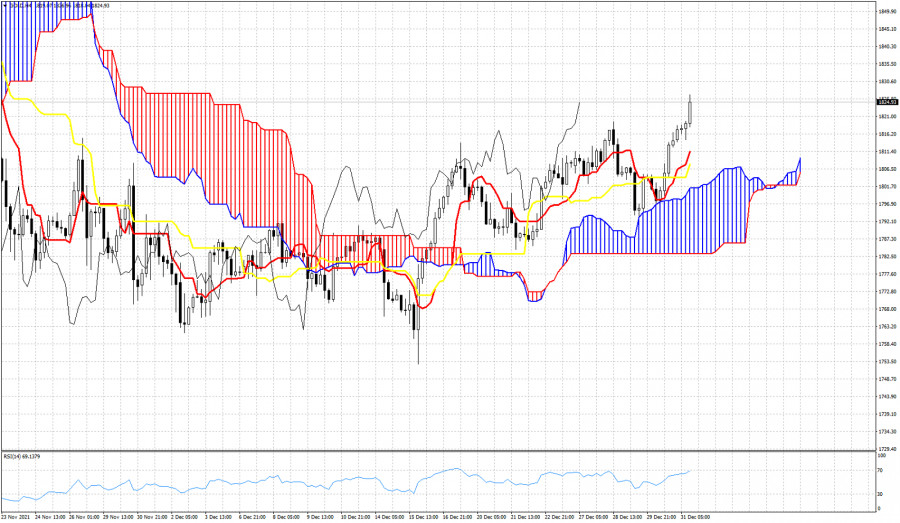
| Ichimoku cloud indicator analysis on Gold for December 31, 2021. Posted: 31 Dec 2021 06:04 AM PST Gold price ends the year on a bullish note. As we explained and mentioned in previous posts using the Ichimoku cloud indicator, Gold price was in a short-term bullish trend as price was above the 4 hour cloud, but in the Daily chart things were a bit unclear. Today we have a bullish signal as price is breaking above the Daily cloud resistance.
In the 4 hour chart, Gold price back tested the cloud support and bounced off of it. Price is now making higher highs. The tenkan-sen has crossed above the kijun-sen and the Chikou span is also making new highs above the candlestick pattern. All signs remain bullish and we continue to be optimistic for Gold first few sessions of 2022. Gold is expected to continue higher towards $1,850 if $1,830 is broken. At $1,830 we find important Fibonacci resistance. The material has been provided by InstaForex Company - www.instaforex.com |
| Sri Lanka's stock market booms Posted: 31 Dec 2021 06:02 AM PST Sri Lankan stocks closed at a record high on Friday. 2021 was their best year since 2010. For the year, the CSE All-Share Index has seen a whopping 80.45% increase and was up 1.72% on the last day of 2021, reaching a record high of 12,226.01 points at the close of trading. Sri Lanka's stock market is booming, with USDINR rising for the first time in a fortnight. Financial services provider Senkadagala Finance Plc, conglomerate Expolanka Holdings Plc and Lanka ORIX Leasing Company Plc were among the most profitable stocks in Sri Lanka this year. Energy stocks were the main driver for the CSE index on Friday due to the news. Thus, Sri Lanka's energy minister said on Friday that the country would sign an agreement with the Indian Oil Corp. unit to rehabilitate 75 oil reservoirs as part of securing a $500 million fuel credit line from India. Global rating agency Fitch downgraded Sri Lanka's sovereign rating to junk stock amid a growing risk of default in 2022 earlier this month. However, the country's central bank has assured that there will be a comfortable foreign exchange reserve position next year. Traders seem to have decided to put their trust in the Sri Lankan central bank, at least on short positions, creating a stir in the regional market. According to the stock exchange, the stock market had a turnover of 8.24 billion Sri Lankan rupees ($40.64 million) on the last trading day of the year. And trading volume in the securities rose to 858 million shares from 509.5 million shares in the previous session. One should not think that only Asian investors are interested in this market. For instance, foreign investors were net sellers in the stock market, selling Rs 77.6 million worth of shares, the bourse data showed. Notably, all this is happening amid the spread of the coronavirus within the country. So far, Sri Lanka has reported 586,746 cases of coronavirus and 14,962 deaths, as revealed by the country's health bureau. Nevertheless, residents are quite diligent about vaccination. According to Johns Hopkins University, about 63.48% of Sri Lanka's population has been fully vaccinated. This is a high figure among Asian third-tier countries, which makes the Sri Lankan rupee look like an attractive currency for speculators with short positions. Long positions are still in question due to the pre-default state of the economy. The Indian rupee is also expected to rise on energy news. USD/INR rises today for the first time in a fortnight. The material has been provided by InstaForex Company - www.instaforex.com |
| Video market update for December 31,,2021 Posted: 31 Dec 2021 05:56 AM PST Upside breakout on the Gold.... The material has been provided by InstaForex Company - www.instaforex.com |
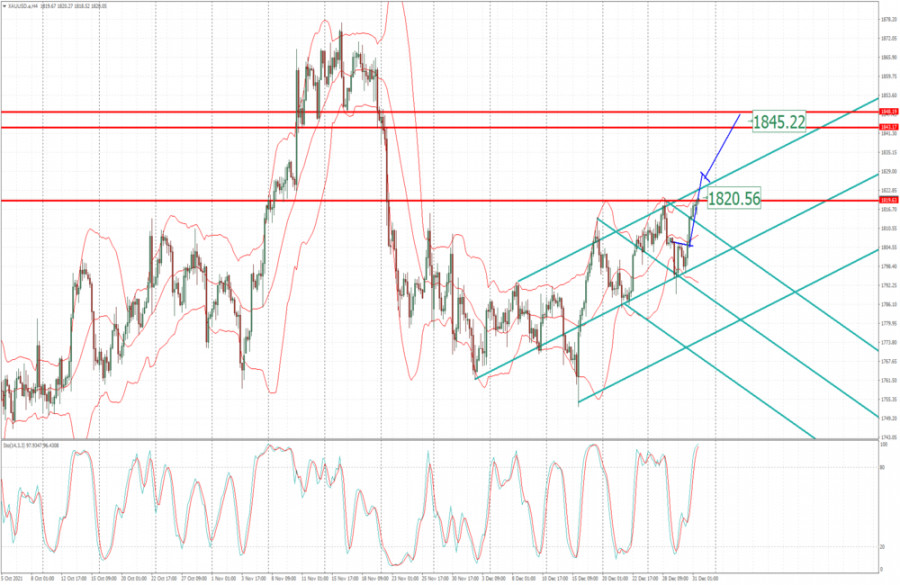
| Analysis of Gold for December 31,.2021 - Breakout of key resistance at $1.820 Posted: 31 Dec 2021 05:55 AM PST Technical analysis:
Gold has been trading upside as I expected. Anyway, I still see potential for much bigger upside movement due to the breakout of the key pivot at $1,820. Trading recommendation: Due to thee breakout of the key pivot resistance at $1,820, I see potential for higher price. Watch for buying opportunities on the pullbacks with the upside objectives at $1,845 and $1,860. Key support for today is set at the price of $1,820 The material has been provided by InstaForex Company - www.instaforex.com |
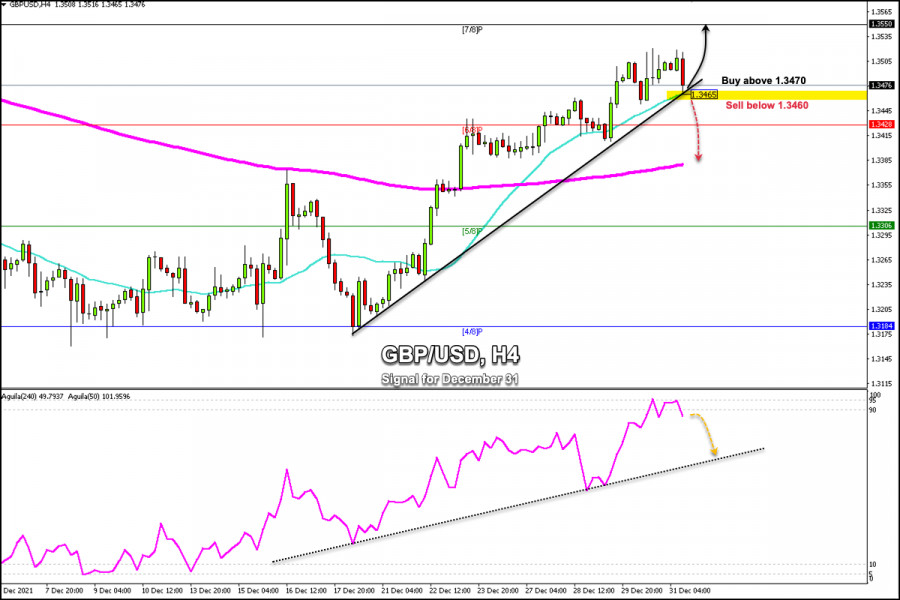
| Trading signals for GBP/USD on December 31, 2021: buy above 1.3470 (21 SMA) Posted: 31 Dec 2021 05:36 AM PST
The British pound on 4-hours chart, is trading above the 21 SMA and above the 200 EMA. Yesterday, it reached 1.3520. From that level it is making a technical correction and is likely to find a bounce around the SMA of 21 at 1.3470. Since December 17, the pound sterling has been hovering in an uptrend channel. This channel still remains intact. If a bounce at the bottom of the channel is confirmed, it could give it a further bullish momentum to reach 7/8 Murray around 1.3550. On the contrary, if in the next few hours, the pound makes a close on the 4-hour chart below 1.3460, the correction is likely to accelerate and could fall to the 200 EMA around 1.3380 and to 5/8 Murray around of 1.3305. The eagle indicator reached a key level of extreme overbought and a correction is imminent in the next few days. Therefore, as long as it remains below the psychological level of 1.3500, a correction could occur. Support and Resistance Levels for December 31, 2021 Resistance (3) 1.3596 Resistance (2) 1.3554 Resistance (1) 1.3521 ---------------------------- Support (1) 1.3427 Support (2) 1.3374 Support (3) 1.3305 *********************************************************** A trading tip for GBP/USD on December 31, 2021 Buy in case of a rebound at 1.3470 (21 SMA) with take profit at 1.3550 (7/8), stop loss below 1.3432. The material has been provided by InstaForex Company - www.instaforex.com |
| US stock market closes in negative territory ahead of New Year's Eve Posted: 31 Dec 2021 05:09 AM PST
On Thursday, US stock market indexes decreased slightly. The S&P 500, the NASDAQ and the Dow Jones lost 0.3%, 0.16% and 0.25% respectively. Earlier, the Dow Jones managed to reach 36,653.48 points. At this time of year, indexes have historically grown by 1.3% on average - a period called a Santa Claus rally by investors. Market players were encouraged by the latest US unemployment data. Despite the growing number of confirmed COVID-19 cases, the amount of jobless claims remained unchanged last week. Investors remain optimistic amid reports of Omicron being less severe than other strains, as well as rising vaccination rates. Governments in many countries are now mainly determining restrictions based on the number of hospitalizations and not the total amount of infections. On the Dow Jones, the best performers of the session were Walt Disney Co. (+0.68%), Johnson & Johnson (+0.44%), and International Business Machines (+0.42%). The worst performers were Procter & Gamble Co. (-0.86%), Microsoft Corp. (-0.77%), and Nike Inc. (-0.76%). On the S&P 500, Penn National Gaming Inc. (4.54%), Twitter Inc. (3.98%), and ViacomCBS Inc. (3.77%) led the upside, with Biogen Inc. (-7.09%), APA Corp. (-3.05%), and CF Industries Holdings Inc (-2.55%) being the worst performers. On the NASDAQ Composite, the best performers were Kiora Pharmaceuticals Inc., Supercom, Ltd., and Inspira Technologies Oxy BHN, Ltd., which gained 93.18%, 40.10% and 27.47% respectively. The worst performing stocks were Oncology Institute Inc. (-16.07%), Biofrontera Inc. (-13.93%), and Medavail Holdings Inc. (-11.69%). Rising stocks outnumbered declining ones on the New York Stock Exchange by 1,806 to 1,461. On the NASDAQ exchange, the amount of rising stocks was 2,326, and the number of declining stocks was 1,500. The VIX market volatility index increased by 2.24% to 17.33. Gold futures went up by 0.54% to $1,815.50 per ounce. WTI crude oil futures lost 0.14% and reached $76,45 per barrel. Brent crude oil futures edged up by 0.06% to $79.06 per barrel. The STOXX Europe 600 added 0.1% on Thursday. Asian markets were mixed. The Shanghai Composite and the Hang Seng were on the upside, gaining 0.6% and 0.1% respectively, while the KOSPI and the Nikkei 225 declined, losing 0.5% and 0.4% respectively. The material has been provided by InstaForex Company - www.instaforex.com |
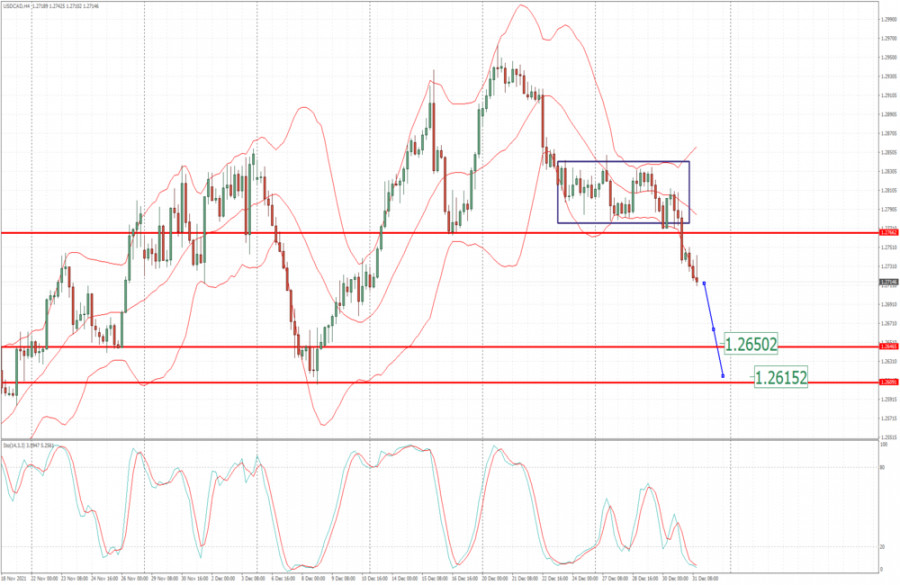
| USD/CAD analysis for December 31, 2021 - Srong downside breakout of consolidation Posted: 31 Dec 2021 05:07 AM PST Technical analysis:
USD/CAD has been trading downside in the background. I found the breakout of the musty-day balance, which is good sign for further downside continuation. Trading recommendation: Due to the downside breakout of the balance in the background, I see potential for the bigger drop in the next period. Watch for selling opportunities on the rallies and continuation al patterns. Downside objectives are set at 1,2650 and 1,2615. Stochastic is showing bear extreme condition but with no evidence for the reversal. Key resistance is seet at 1,2750 The material has been provided by InstaForex Company - www.instaforex.com |
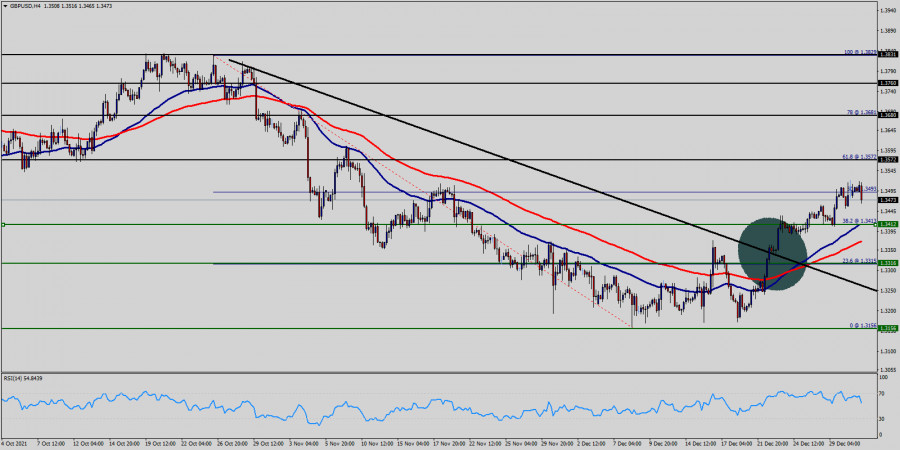
| Technical Analysis of GBP/USD for December 31, 2021 Posted: 31 Dec 2021 04:21 AM PST
The GBP/USD pair continues to move upwards from the level of 1.3412. Today, the first support level is currently seen at 1.3412, the price is moving in a bullish channel now. Furthermore, the price has been set above the strong support at the level of 1.3412, which coincides with the last bearish wave - low price 1.3316 (bottom). This support has been rejected several times confirming the veracity of an uptrend this week. According to the previous events, we expect the GBP/USD pair to trade between 1.3412 and 1.3572. So, the support stands at 1.3412, while daily resistance is found at the levels of 1.3500, 1.3572 and 1.3615. Therefore, the market is likely to show signs of a bullish trend around the spot of 1.3412. In other words, buy orders are recommended above the spot of 1.3412 with the first target at the level of 1.3500; and continue towards 1.3572 and 1.3615. On the other hand, if the GBP/USD pair fails to break through the resistance level of 1.3680 today, the market will decline further to 1.3156 next year 2022. The material has been provided by InstaForex Company - www.instaforex.com |
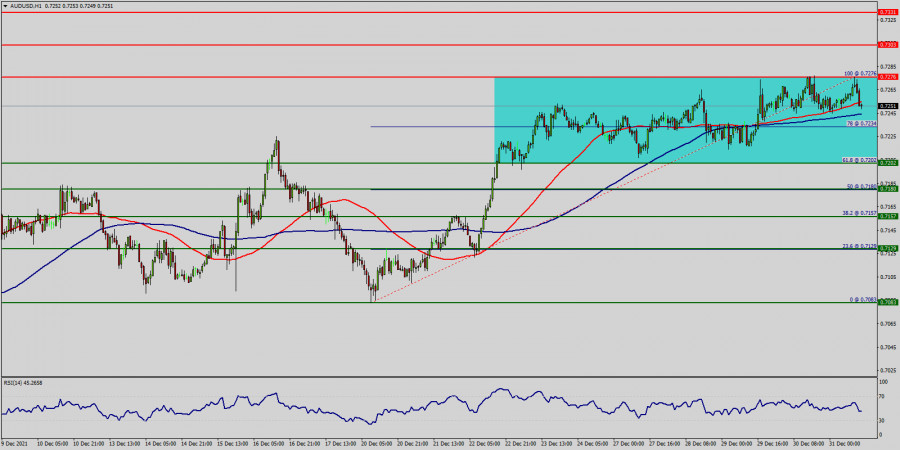
| Technical Analysis of AUD/USD for December 31, 2021 Posted: 31 Dec 2021 04:12 AM PST
The AUD/USD pair continues to move downwards from the level of 0.7276, which represents the double top in the 1H chart. This morning, the pair is dropping from the level of 0.7276 to the bottom around 0.7246. Today, the first resistance level is seen at 0.7303 followed by 0.7331, while daily support is seen at the levels of 0.7202 and 0.7180. According to the previous events, the AUD/USD pair is still moving between the levels of 0.7276 and 0.7180. Hence, we expect a range of (0.7180 - 0.7276) 96 pips in coming hours. The first resistance stands at 0.7303, for that if the AUD/USD pair fails to break through the resistance level of 0.7303, the market will decline further to 0.7002. This would suggest a bearish market because the RSI indicator is still in a negative area and does not show any trend-reversal signs. The pair is expected to drop lower towards at least 0.7180 in order to test the second support (0.7180). On the contrary, if a breakout takes place at the resistance level of 0.7331 (the double top), then this scenario may become invalidated. The material has been provided by InstaForex Company - www.instaforex.com |
| Forex forecast 12/31/2021 EUR/USD, GBP/USD, SP500, Gold and Bitcoin from Sebastian Seliga Posted: 31 Dec 2021 02:14 AM PST Let's take a look at the technical picture of EUR/USD, GBP/USD, SP500, Gold and Bitcoin at the last day of trading in 2021. The material has been provided by InstaForex Company - www.instaforex.com |
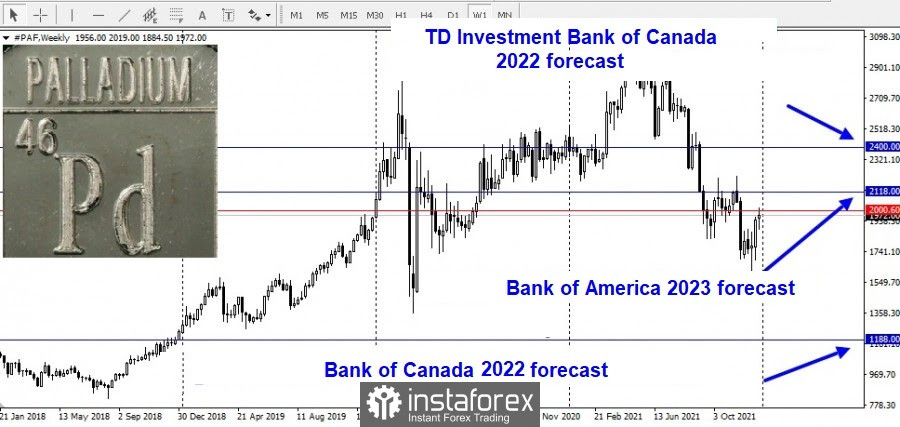
| What will be the prices for platinum and palladium in 2022? Posted: 31 Dec 2021 02:05 AM PST
2021 was a sad year for the entire precious metals sector, and disappointment was felt so much in platinum group metals (PGMs) as palladium performed worse. By the end of the year, palladium is already below $ 2,000 an ounce. Towards 2022, there is rising optimism among analysts that the value of the platinum-group precious metals will increase as the global supply chain recovers. Commodity analysts at TD Securities view the current price as an opportunity to buy. TD Investment Bank of Canada's analysts said that palladium's average price will be $ 2,400 per ounce next year. At the same time, economists at the Bank of Canada are forecasting an average price of $ 1,188 per ounce.
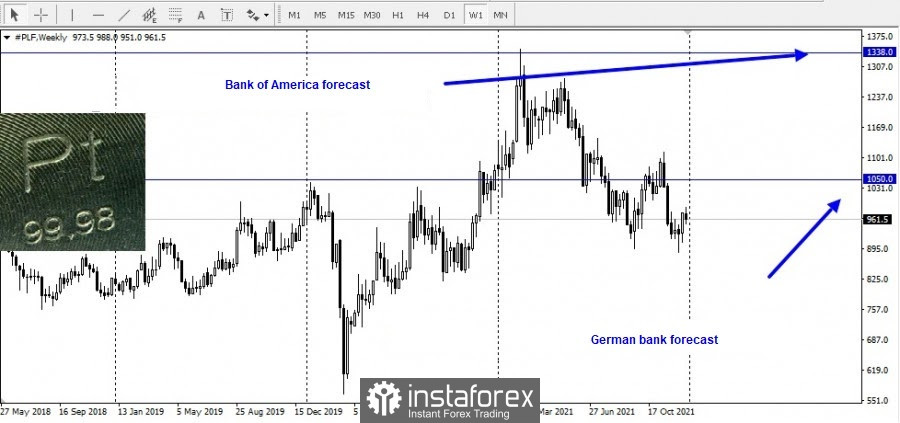
Even though platinum and palladium are considered precious metals, they are used almost exclusively as industrial metals and are important components of autocatalytic converters used to reduce emissions from diesel and gasoline engines. The UK-based precious metals research firm estimates palladium autocatalyst demand to grow by about 8% to 8.6 million ounces compared to 8.8 million ounces in 2019. The supply of platinum and palladium will rise in 2022. However, it should be noted that the demand is only half of the equation for the PGM market; prices also depend on the offer. Palladium is particularly sensitive as its current supply deficit narrowed due to lower demand and increased production from mines. Most likely, the global supply of platinum will increase in 2022 as production from mines increases. In November, the World Platinum Investment Council forecast a surplus of 637,000 ounces for 2022. Commerzbank expects the average annual price of platinum to be around $ 1,050 an ounce. Economists assume that the platinum and palladium markets will normalize in 2022 after two years of significant supply and demand disruptions; however, some analysts said that the development of the transition to green energy is an unknown growth factor, especially for platinum. The ability to use hydrogen to generate electricity is attracting a lot of attention as countries around the world strive to create more green energy. Platinum is an important component used to separate water into hydrogen and oxygen molecules. The hydrogen is then used to power the fuel cells. And while the technology is still in its early stage, Bank of America analysts said it will have a significant impact on platinum demand over the next ten years. The bank also said that a growing hydrogen economy could potentially lead to a platinum deficit by the end of 2022. The average price of platinum is expected to be around $ 1,338 an ounce next year. This is more optimistic for platinum than palladium. At the same time, analysts estimate that the average price of palladium will be $ 2,118 an ounce by 2022. By 2023, Bank of America believes platinum will trade again at a premium compared to palladium.
|
| Daily Video Analysis: USDCAD, H4 Bearish Breakout Opportunity Posted: 31 Dec 2021 02:02 AM PST Today we take a look at USDCAD. Combining advanced technical analysis methods such as Fibonacci confluence, correlation, market structure, oscillators and demand/supply zones, we identify high probability trading setups. The material has been provided by InstaForex Company - www.instaforex.com |
| 2022 could be a positive year for Bitcoin Posted: 31 Dec 2021 02:00 AM PST
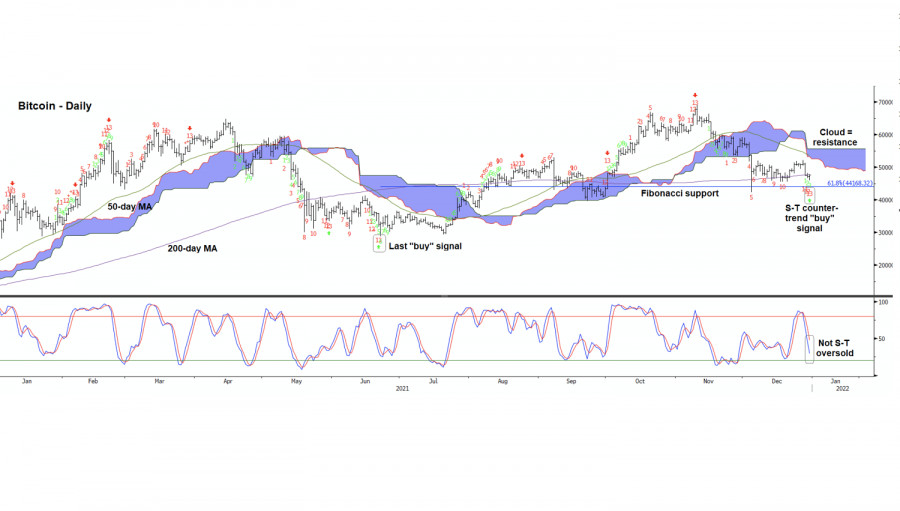
Bitcoin dipped by more than 15% this month amid a broader decline in the crypto sector. The fall has pushed the token near the 55 MA that actually held after the sudden crash this December. Technical research suggests that a decisive break below the average would result in a drop to $ 40,00.
Founder and managing partner of Fairlead Strategies, Katie Stockton, said Bitcoin is showing a new short-term buy signal, which suggests a two-week bounce. But that is a bit "unconvincing" because to other indicators, conditions do not appear to be oversold.
Quadency CEO and founder Rosh Singh believes retail investors may have been distracted by the massive rallies in some alternative coins. "That puts some pressure on Bitcoin as well," Singh said. "A lot of people in crypto are pretty optimistic about the next year and think we should see a rally with the way that things have been going," he added. Bitcoin continuing to rally is something we often hear, so crypto proponents remain undeterred, pointing to trends such as increased interest in the sector from financial institutions. "There has been a significant increase in the massive adoption of cryptocurrency and blockchain this year, thanks to a significant influx of institutional investment that has rekindled confidence in the sector," Analyst Walid Kudmani said. "This could ultimately lead to significant price gains and increased volatility as retail investors attempt to catch up." BitBull Capital CEO Joe Di Pasquale agrees that prices may recover soon and 2022 is likely to be a positive year for Bitcoin. He said: "We can expect relief in the new year and a possible recovery. If we saw a bear market like 2018 - $ 100,000 is definitely on the charts, but timeframes can vary, especially when changes in macroeconomic policies and rules start to emerge this year. " The material has been provided by InstaForex Company - www.instaforex.com |
| Posted: 31 Dec 2021 01:57 AM PST Bitcoin rose higher after failing to break through 47,111 - 46,201.01. It is trading at the 48,467.87 level at the time of writing far above 46,824.29 today's low and compared to 45,934.37 yesterday's low. Today, it has registered a 3.77% growth, from today's low to 48,589.47 today's high. From yesterday's low, BTC/USD increased by 5.78%. Technically, the crypto reached a demand zone. So, the current bullish momentum was expected. BTC/USD Rallies As Expected
As you can see on the H4 chart, the price retested the 46,201.01 critical support failing to close below it. Now, it has retested the 47,111 and the weekly S1 (46,966.85) confirming these levels as downside obstacles. You knew from my previous analyses that Bitcoin could turn to the upside after reaching this support zone. The weekly pivot point (49,410.55) and the 49,600 are seen as near-term targets. Also, the 50,000 psychological level and the upper median line (UML) could be used as targets as well. BTC/USD OutlookThe retest of 47,111 followed by the current rally was seen as a long opportunity with immediate targets at the weekly pivot point and at the 49,600. The Stop Loss could be hidden below 45,934.37. A larger upwards movement could be activated by a valid breakout above the descending pitchfork's upper median line (uml) and above the 51,991. The material has been provided by InstaForex Company - www.instaforex.com |

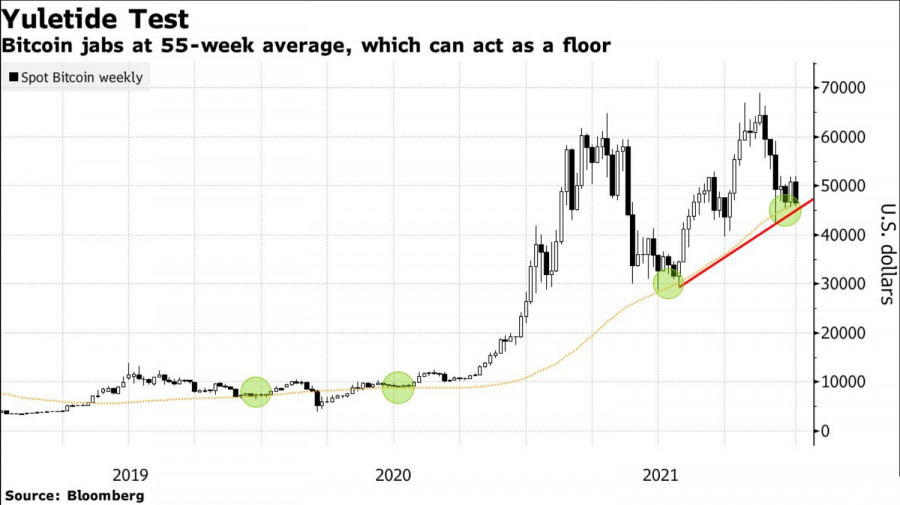
 Bitcoin is an emblem of volatility, and the main question facing 2022 is whether all of its fluctuations will eventually lead to a lower, rather than higher, level when the wave of pandemic-era stimulus recedes.
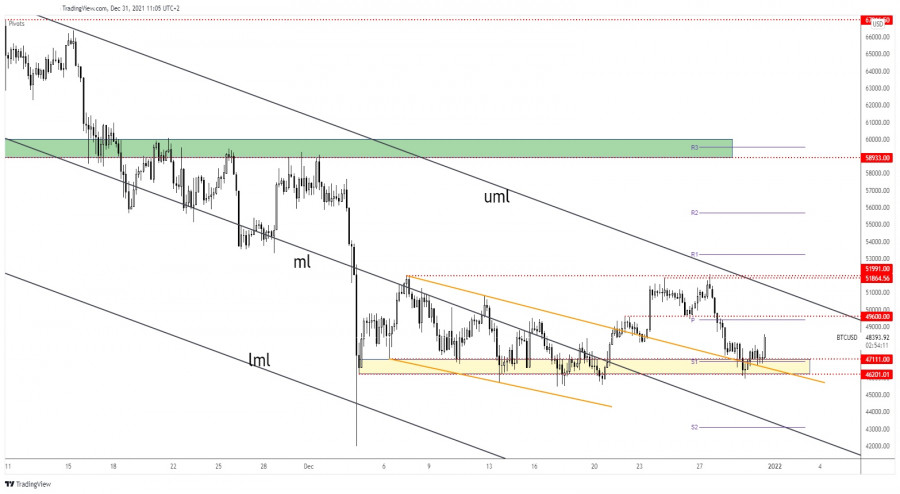
| You are subscribed to email updates from Forex analysis review. To stop receiving these emails, you may unsubscribe now. | Email delivery powered by Google |
| Google, 1600 Amphitheatre Parkway, Mountain View, CA 94043, United States | |


Comments