Forex analysis review
Forex analysis review |
- Trading plan for the GBP/USD pair for the week of December 6-10. New COT (Commitments of Traders) report. The British pound
- Trading plan for the EUR/USD pair for the week of December 6-10. COT (Commitments of Traders) report. The week ended with
- How large Bitcoin drop can be?
- EUR/USD: Contradictory Nonfarm Payrolls
- Bitcoin resumes downward movement, broke through an important support zone: where will price bounce
- USD/CHF accumulation or distribution
- Bitcoin Options Will Be the Key to New All-Time Highs for Digital Gold
- Bitcoin: How The SEC Is Hindering Innovation In The Crypto Industry
- December 3, 2021 : EUR/USD daily technical review and trading opportunities.
- December 3, 2021 : EUR/USD Intraday technical analysis and trading plan.
- December 3, 2021 : GBP/USD Intraday technical analysis and significant key-levels.
- Trading signal for CRUDE OIL (WTI- #CL) on December 03 - 06, 2021: buy in case of rebound at 67.18 (21 SMA)
- GBP/USD hot forecast on 3rd December
- Weak employment data divided experts into two camps
- EUR/USD post NFP analysis on December 3, 2021
- US market: Unemployment fell sharply to 4.2% - we are waiting for new growth
- The Fed may not keep its promises. What will happen to the dollar?
- EUR/USD: The dollar is invulnerable
- Trading signal for EUR/USD on December 03 - 06, 2021: sell below 1.1323 (21 SMA)
- Gold still trading around $1,770.
- EURUSD reaction to NFP announcement.
- EUR/USD. USD receives support but its rally may be short
- Bitcoin continues to give hopes for a bounce towards $63,000.
- Gold on the brink of another major fall in 2022
- Video market update for December 03,,2021
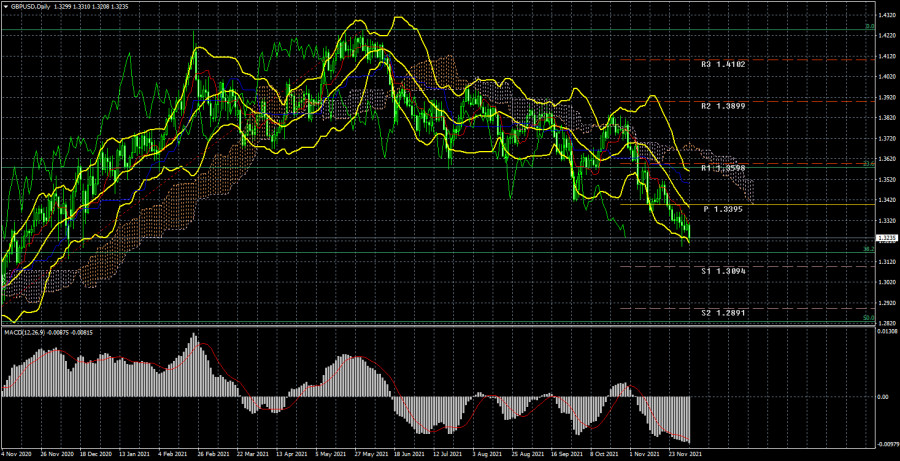
| Posted: 04 Dec 2021 06:04 AM PST Analysis of GBP/USD 24-hour TF.
The GBP/USD currency pair continued its steady decline during the current week. The quotes of the British currency dropped another 100 points and updated the annual lows. Thus, the technical picture for the pound/dollar has not changed this week either. The pair had the same effect on both major pairs, but at the same time, the European currency remained within the upward correction, and the pound continued to fall. And it's pretty weird. Especially judging by Friday, when the European currency again rose slightly, and the pound sterling fell by another 65 points, although there were few important events in the European Union and the UK that day. Almost all of the market's attention was focused on American statistics. But the euro and the pound moved differently. Of course, the British currency may be under pressure now because of everything that is happening in the UK itself. Recall that negotiations on the "Northern Ireland protocol" are at an impasse, and Boris Johnson managed to quarrel with French President Emmanuel Macron and, as political analysts note, there have not been such bad relations between the two countries since Waterloo. But at the same time, markets do not always work out political factors, and in terms of the economy in the UK now everything is no worse than in the EU. In general, the pound remains the currency that moves as ambiguously as possible. There are a huge number of factors that can influence its movements and it is very difficult to understand which of them the markets take into account and which ones do not. In general, the price continues to move towards the 38.2% Fibonacci level. And near this level, it can stop at least for a short time. Or it may bounce back, completing the entire downward movement of 2021. A lot will now depend on the meetings of the Bank of England and the Fed in December. Analysis of the COT report.
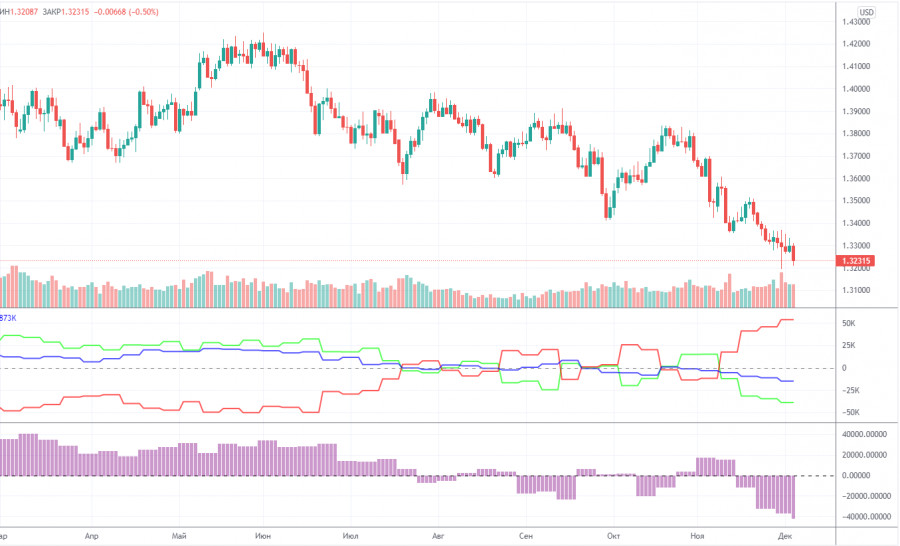
During the last reporting week (November 29 - December 3), the mood of professional traders became a little more "bearish". In principle, quite unexpectedly, the bears became almost twice as strong as the bulls. Recall that since about August, the bulls and bears could not decide who to dominate the market. This is seen by the two indicators in the illustration above: the net position of the "Non-commercial" group was constantly jumping from side to side. However, in the last few weeks, professional traders have increased the number of shorts to 93 thousand, and the number of longs has remained at 51 thousand. Thus, at this time, the mood can be described as "bearish". Consequently, the pound sterling can be concluded that the fall of the pound will continue. However, as always, it does not do without one "but". The red and green lines of the first indicator, which indicate the net positions of commercial and non-commercial traders, the two most important and large groups, have moved quite far from each other. They were at about the same distance in May-June, when the upward trend ended. And a strong distance from each other of these two lines just means that the trend may end. Of course, if the demand for the dollar does not decline, and there is still the same negative fundamental background in the UK, then nothing will prevent the US currency from continuing to grow. However, a further fall in the pound will mean that the number of shorts will continue to grow. And it already exceeds the number of longs by almost 2 times. Analysis of fundamental events. In the UK this week, there was absolutely nothing interesting in macroeconomic terms. Two reports on business activity in the service and manufacturing sectors, which in principle are not very important, turned out to be as neutral as possible. Therefore, only American statistics and events had an impact. And on Friday, the pound fell by weak statistics due to the ocean at the same time when the euro currency has grown. Of course, in addition to Non-Farms, we can also note the ISM report for the service sector, which grew to a record 69.1 points, significantly exceeding forecasts. We can also note the unemployment rate, which has fallen to 4.2%. However, then why was the dollar paired with the European currency trading lower? In general, it is impossible even to say unequivocally exactly how the markets reacted to the macroeconomic data from America on Friday. Trading plan for the week of December 6-10: 1) The pound/dollar pair continues its steady decline. Therefore, purchases are now impractical. To do this, you need to wait until the pair is fixed above the critical line, or better - above the Ichimoku cloud. Since the price is now very far from these lines, it is unlikely that this will happen in the near future. On a lower timeframe, the pair may change the downward trend to an upward one, which may be the beginning of a round of upward movement on the 24-hour TF. We assume that the pair may go up 400-500 points in the next month or two. But so far there are no signals about the beginning of such a movement. And without technical signals, it is not recommended to open purchase transactions. 2) The bears managed to keep the pair below the Ichimoku cloud and now continue to develop their success. The targets for further movement to the south are now 1.3162 (38.2% Fibonacci) and the support level of 1.3094. A rebound from any of these levels can provoke, at least, an upward pullback. Explanations to the illustrations: Price levels of support and resistance (resistance /support), Fibonacci levels - target levels when opening purchases or sales. Take Profit levels can be placed near them. Ichimoku indicators(standard settings), Bollinger Bands(standard settings), MACD(5, 34, 5). Indicator 1 on the COT charts - the net position size of each category of traders. Indicator 2 on the COT charts - the net position size for the "Non-commercial" group. The material has been provided by InstaForex Company - www.instaforex.com |
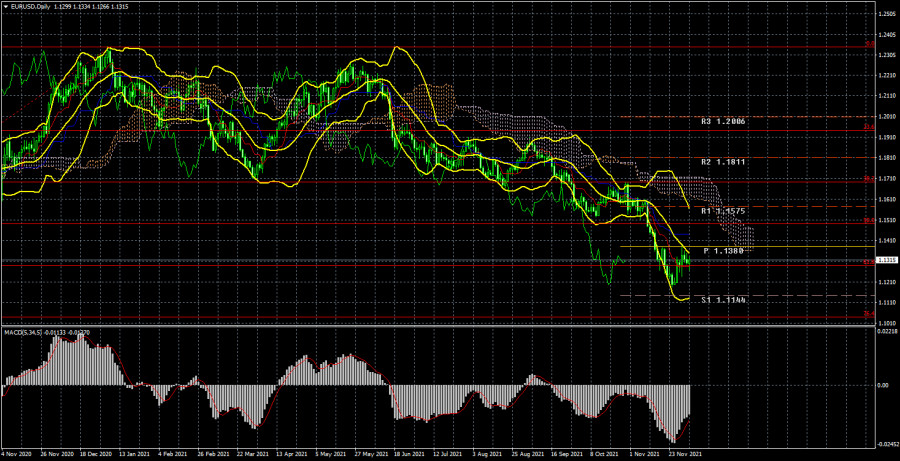
| Posted: 04 Dec 2021 06:04 AM PST EUR/USD 24-hour TF analysis.
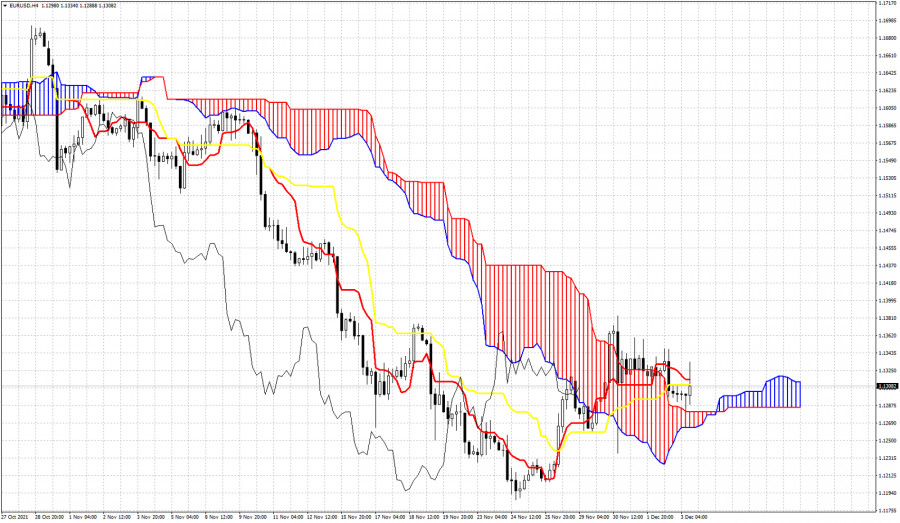
The EUR/USD currency pair has increased by 10 points during the current week. No, this pair has not been in the range of 30 trading points all week, it's just that the movements during the week were not strong and multidirectional. Thus, in technical terms, nothing has changed much in the last 5 trading days. The pair is still in the framework of a new round of upward correction, which has little chance of becoming the beginning of a new upward trend. However, as we can see, traders are in no hurry to buy the European currency and it seems that the technical picture will not change too much before the next Fed meeting. There were several rather important events this week (they will be discussed below), but the most important is still the performance of Jerome Powell, and it all ended with Nonfarm on Friday, which turned out to be very weak. In total, 210 thousand jobs were created in November, with a forecast of 550 thousand. What follows from this? It follows from this that the chances of accelerating the curtailment of the incentive program in December decreased slightly. And this means that the dollar is losing good reasons to continue its growth right now. The Fed has repeatedly stated that the main goal is to restore the labor market to the levels observed before the pandemic. However, recently, the Fed has been under enormous pressure due to high inflation, which is not going to stop. Consequently, the Fed is currently caught between two fires. On the one hand, it is necessary to tighten to slow down inflation, which has already exceeded 30-year highs. On the other hand, the labor market still needs stimulus to continue to recover. Especially now, when the fourth "wave" of the pandemic has covered the whole world, and another, new strain of the "coronavirus" "omicron" has appeared, which can aggravate the epidemiological situation around the world. And the worse things get in terms of the epidemic, the worse things will get in terms of the economy. Analysis of the COT report.
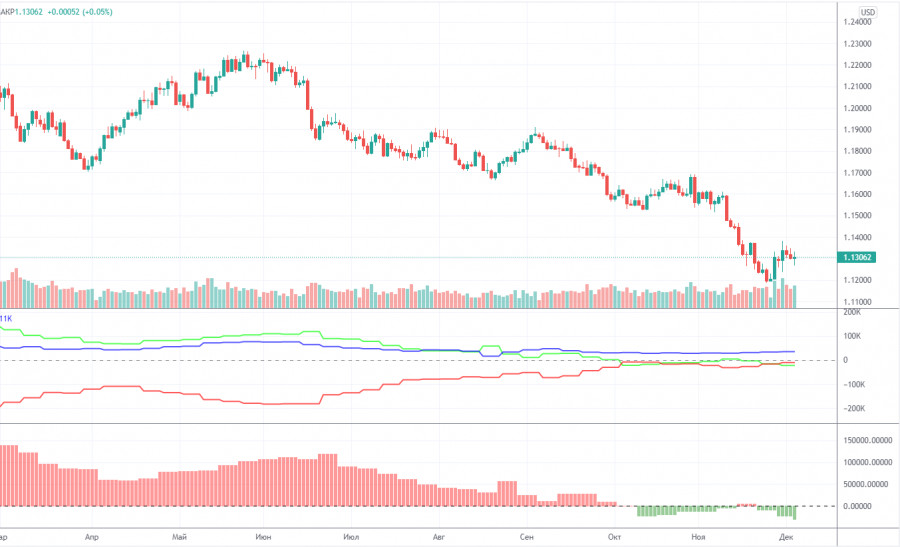
During the last reporting week (November 29 - December 3), the mood of non-commercial traders became more "bearish" again. Judging by the indicators in the illustration above, the changes are not so big anymore, but still, most professional traders continue to either increase shorts or reduce longs. During the reporting week, the Non-commercial group closed 15,000 buy contracts and 8.5 thousand sell contracts. Thus, their net position decreased by 6.5 thousand contracts. Indeed, a little. The green line of the first indicator has been near the zero level for a long time. And this, by and large, means that the number of open longs and shorts for non-commercial traders is approximately the same. And this, in turn, means that the mood is now more "neutral" than "bearish". But still, almost every week there is an increase in this "weak bearish mood", so now we can conclude that the European currency has excellent chances to continue falling. We just want to remind you about the factor of the market working out the reasons that could bring the dollar so high against the euro. From our point of view, the US currency as a whole continues to grow since the probability of tightening the monetary policy of the Fed is much higher than the probability of tightening the monetary policy of the ECB. Especially now, when EU countries are beginning to close for quarantine and break anti-records on morbidity. However, the dollar has been growing for a very long time, and the Fed has only reduced the QE program by $15 billion and that's it. Thus, the factor of a high probability of tightening the Fed's monetary policy has been worked out several times for a long time. Analysis of fundamental events. The current week was as interesting as possible. There were a lot of important events and it was even a little strange that the volatility, in the end, was not very high. The most important event of the week was the speech of Jerome Powell, who finally admitted that it is time to stop calling inflation "temporary", as it continues to grow from month to month. He also said that at the December meeting, the issue of accelerating the pace of curtailing the QE program will be considered, which provoked the strongest movement of this week – by 140 points. However, over the next couple of hours, the euro currency won back most of the losses. Also this week, a report on inflation in the European Union was published, which also continues to grow and is already 4.9% y/y. Christine Lagarde, we recall, has not yet abandoned the interpretation of "temporary inflation". However, all subsequent events had almost no effect on the movement of the euro/dollar pair. Trading plan for the week of December 6-10: 1) In the 24-hour timeframe, the trend remains downward. At the moment, the quotes remain below the Kijun-sen line, and the markets continue to show that they are not ready to buy the euro currency. Thus, the downward movement may resume with a target of 1.1038 (76.4% Fibonacci). The fundamental background currently supports the further fall of the euro and the growth of the dollar, but we also believe that all factors have been worked out by the market for a long time, so we assume the end of the downward trend. 2) As for purchases of the euro/dollar pair, in the current conditions, they should be considered no earlier than fixing the price above the critical line. And ideally - above the Ichimoku cloud, because the price has already overcome the Kijun-sen several times, but then could not continue moving up. There are a few prerequisites for a new upward trend to begin in the near future. First of all, technical. Explanations to the illustrations: Price levels of support and resistance (resistance /support), Fibonacci levels - target levels when opening purchases or sales. Take Profit levels can be placed near them. Ichimoku indicators(standard settings), Bollinger Bands(standard settings), MACD(5, 34, 5). Indicator 1 on the COT charts - the net position size of each category of traders. Indicator 2 on the COT charts - the net position size for the "Non-commercial" group. The material has been provided by InstaForex Company - www.instaforex.com |
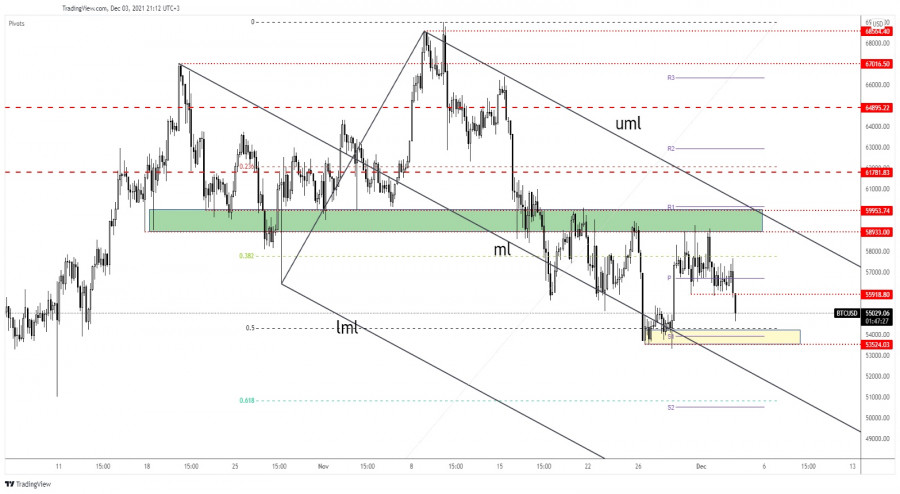
| How large Bitcoin drop can be? Posted: 03 Dec 2021 11:57 AM PST Bitcoin dropped after failing to make a new higher high. Actually, it has reached a strong supply zone, so the current drop is natural. I've told you in my previous analysis that, BTC/USD could come back down towards the previous former lows trying to accumulate more bullish energy before jumping higher. BTC/USD dropped by 5.53% from 57,652 today's high to 54,462.45 today's low. Its current sell-off is far from being over, so a further drop is in cards. Technically, it's almost to reach a strong demand zone, a bullish pattern printed here could announce that the downside movement is over. BTC/USD dropped as expected
BTC/USD announced a potential downside movement after failing to stabilize above the weekly pivot point of 56,710.94. As I mentioned in my previous analysis, Bitcoin could come back down towards the 50% retracement level and down towards 53,524.03 static support if it closes below 55,918.80. After registering only false breakouts above 58,933, a temporary downside movement was somehow expected. Also, its failure to approach and reach the Descending Pitchfork's upper median line (uml) signaled some pressure and a potential drop towards the median line (ml). BTC/USD outlookThe level of 53,524.03 stands as static support. Ignoring this downside obstacle may signal a further drop to the Descending Pitchfork's median line (ml) at least. Staying above the static support zone may signal potential sideways movement between 53,524.03 and 58,933 levels. Closing and stabilizing below 53,525.03 may announce a potential larger corrective phase. It could drop along the median line (ml). Only a strong bullish pattern in this support zone may announce a new upside movement. The material has been provided by InstaForex Company - www.instaforex.com |
| EUR/USD: Contradictory Nonfarm Payrolls Posted: 03 Dec 2021 11:07 AM PST The November Nonfarm Payrolls report turned out to be not as rosy as the October or September ones. Many components (almost all) came out in the red zone, falling short of the forecast values. This is not to say that the U.S. labor market "let down" dollar bulls, but traders definitely expected to see a stronger result. And yet, market participants have come to the conclusion that the "glass is half full," and not vice versa. After some fluctuations, the EUR/USD bears increased pressure on the pair, trying to gain a foothold in the area of the 12th figure. Greenback demonstrated similar ambitions in other currency pairs of the "major group." In general, it must be recognized that Friday's data has both strengths and weaknesses. Let's sort out the most important macroeconomic report "on the shelves."
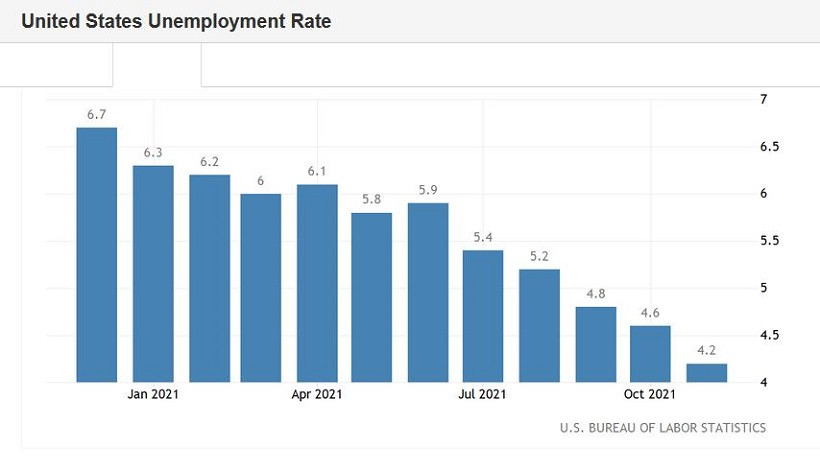
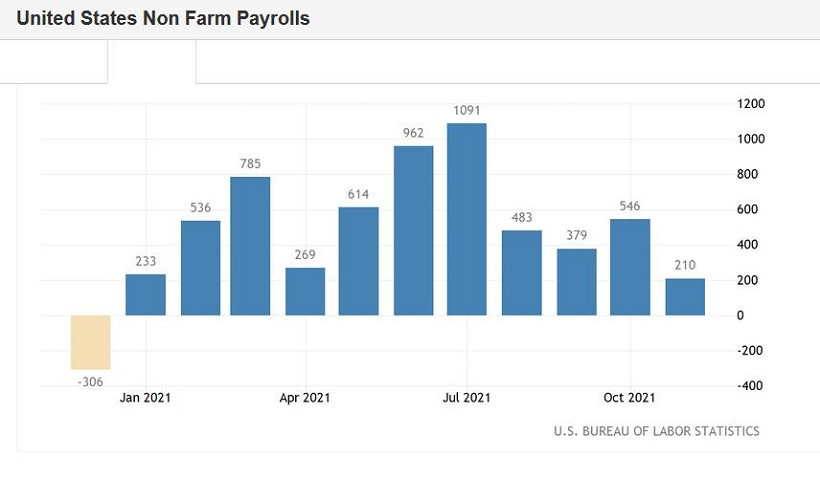
The strong point of the released data lies in the reduction in the unemployment rate. This indicator has been gradually, but consistently and quite steadily declining for almost a year and a half, since June last year. There were small (literally by 0.1%-0.2%) pullbacks up, but in general, the downward dynamics is visible to the naked eye. And on Friday, this indicator also supported the U.S. currency, falling to 4.2% (with a decline forecast to 4.5%). This is the best result since March 2020. Some other components of the data were also released in the "green zone." In particular, the share of the economically active population has increased – the indicator has reached 61.8% (the annual maximum). The average length of the working week for all employed also increased (34.8). However, the growth rate in the number of people employed in the non-agricultural sector was disappointing. With the forecast of growth up to 550,000, it grew by only 210,000. A similar dynamics was demonstrated by the growth rate of the number of employed in the private sector of the economy, which in November "issued" 235,000 (with the forecast of growth up to 530,000). In the manufacturing sector of the economy, 30,000 jobs were created, while most experts expected to see an increase of up to 50,000. Wages were also somewhat disappointing, although in this case, the issue is controversial: in annual terms, the average hourly wages rose to 4.8% in November (that is, the same as in October). In other words, the released data showed an ambiguous picture, and it could be interpreted in different ways - both in favor of the greenback and against it. But, as we can see, the scales tipped towards the U.S. currency. According to some experts, the November decline in the unemployment rate to 4.2% allows the Federal Reserve to accept the proposal voiced by Chairman Jerome Powell to accelerate the pace of reducing asset purchases. The American regulator may make the corresponding announcement by its next meeting, which will be held on December 15-16. Note that the representatives of the Fed at their meeting last September stated that the unemployment rate, in their opinion, in the period from October to December will fluctuate in the range of 4.5% - 5.1%. But in reality, this indicator continued to decline systematically, thereby "untying" the hands of the Fed members. Other macroeconomic reports also provided additional support to the greenback on Friday. The index of business activity in the service sector from ISM in the States jumped to 69.1. This, for a moment, is the strongest result in the history of this indicator. Dollar bulls were also pleased with the indicator of the volume of production orders, which came out in the "green zone," reaching a 1 percent mark in October with a growth forecast of up to 0.5%. Excluding transport, production orders immediately increased by 1.6% over the month (with a growth forecast of only 0.5%), which also indicates a significant acceleration in the growth rate of the indicator.
The "cherry on the cake" was the head of the St. Louis Fed, James Bullard, who occupies the most "hawkish" position among the members of the Federal Reserve System. On Friday, he said that the regulator should finish reducing QE by March. This, according to Bullard, will allow the Central Bank to raise the rate "if necessary." Earlier, he stated that the regulator needs to raise the rate "at least twice" within 2022. It is worth noting that next year, the head of the St. Louis Federal Reserve Bank will have the right to vote in the Committee, so his position should be considered through the prism of this fact. Moreover, he is not alone in his opinion: according to the latest "point forecast" (which was published in September), 9 members of the Fed allowed the option of tightening monetary policy next year. Thus, contradictory Nonfarm Payrolls did not break the dollar bulls on Friday. The market remains confident that the Fed will accelerate the pace of asset purchases at the December meeting, ending QE in March or April. Awareness of this fact keeps the dollar "afloat", allowing the bears to count on the further development of the downside trend of EUR/USD. In my opinion, the pair's sales are still a priority: any more or less large-scale upside pullbacks can be used to open short positions. The first target is located close enough – at 1.1250 (the lower line of the Bollinger Bands indicator on the W1 timeframe). The main target is 50 points lower – this is a psychologically important target of 1.1200. The material has been provided by InstaForex Company - www.instaforex.com |
| Bitcoin resumes downward movement, broke through an important support zone: where will price bounce Posted: 03 Dec 2021 10:24 AM PST After a long period of consolidation, Bitcoin continues its downward movement. And despite expectations of further growth, the collapse is not surprising. Throughout the period of consolidation and floundering in the lower part of the fluctuation range, the coin was subjected to speculative pressure, which ultimately led to its overheating. The first reason that triggered the fall of bitcoin is a greater influx of coins to exchanges. According to Santiment, more than 10k BTC have been transferred to cryptocurrency platforms over the past week, which equates to $580 million. This is a significant factor that triggered an increase in pressure on the price. This is a clear sign of the sharp decline in price that is happening right now. With the outflow of institutional investments, Bitcoin has significantly increased its position in the options market, which reflects the desire of speculative investors to play on the rise. A similar situation was observed in mid-August when more than 28k BTC were transferred to the exchanges. As a result, the asset made an impulse decline and reached a local bottom, after which it began a recovery period. To top it off, it is worth keeping a close eye on the futures market, where demand for cryptocurrency remains at the November highs. This is a clear negative signal because when the price falls, the demand for the future purchase of the coin should go off scale. The decline in activity in the futures market is also a sign of a decline, as the huge mismatch between the current speculative demand for crypto and the demand for futures indicates that the market is overheated. It is also worth keeping in mind the key rule of the market that the price, in most cases, goes against the expectations of the bulk of investors. As a result, we see that Bitcoin is trading in the $55k region as of 16:00 UTC and maintains a clearly pronounced downward trend. On the daily timeframe, the impulse decline is very well displayed on the stochastic oscillator: the indicator has formed a wide bearish crossover and continues to decline. The price of BTC is trying to grab the support at $54.6k, where the 0.5 Fibonacci level passes, which serves as a good support zone. However, I anticipate a further decline in the price to the lower end of the $52k - $53.7k range, where a strong buyback should occur.
I would like to believe that the coin will confidently test the $52k - $53.7k area and confidently bounce above $55k. However, comparing the facts, it can be concluded that BTC collapse could provoke a sell-off among retail and large investors. Players who have opened long positions for speculative purposes will disappear on their own, and institutions can aggravate the emerging trend to transfer coins to exchanges. In this case, the price may get close to the support level at $51.5k, where the 0.618 Fibo level passes. This will be an alarming signal, because according to the wave theory, the price cannot go down to the high of the previous wave. Note that the record of the previous wave is at around $52.8k. If the BTC quotes pass this milestone, the analysis will have to be revised, as there will be a possibility of a medium-term trend reversal downward.
|
| USD/CHF accumulation or distribution Posted: 03 Dec 2021 09:34 AM PST
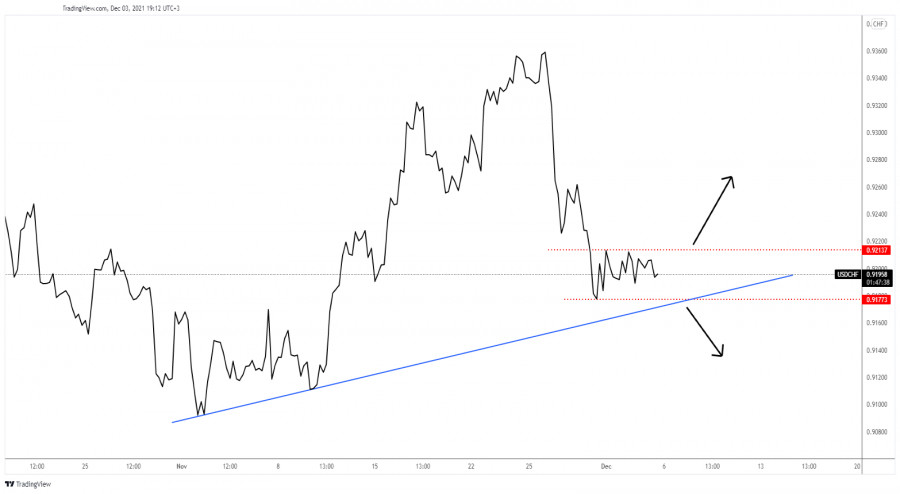
USD/CHF sideways movementAt the time of writing, the currency pair was moving somehow sideways between 0.9213 and 0.9177 levels. In the short term, it could extend its range movement before deciding a clear direction. As long as it stays above the uptrend line and above 0.9177, that are seen as downside obstacles, the USD/CHF could still develop a new swing higher. Actually, staying above the downside obstacles and jumping above the former high of 0.9213 which stands as a static resistance, an upside obstacle, signals a potential strong upwards movement. USD/CHF trading conclusionA drop below 0.9177 and under the uptrend line could signal a deeper drop and could bring new selling opportunities. On the other hand, staying above the uptrend line and jumping above 0.9213 could bring new buying opportunities as USD/CHF may develop an upside movement. The material has been provided by InstaForex Company - www.instaforex.com |
| Bitcoin Options Will Be the Key to New All-Time Highs for Digital Gold Posted: 03 Dec 2021 09:18 AM PST
The world's leading investment company Goldman Sachs is confident that the development of cryptocurrency options will be an important catalyst for the growth of cryptocurrency, as traditional financial investors very often come to the crypto market. Bitcoin desperately needs a developed options market. Goldman Sachs analysts are confident that there is an increased demand for Bitcoin options among institutional investors. Top analysts of the company are confident that there is an increased demand for hedging with financial derivatives, and the next important landmark event that will raise Bitcoin in price will be the development of the options market. At the moment, the demand for the bitcoin market is truly colossal. Data from analytical crypto site Skew, which monitors the derivatives market, shows that the total outstanding contracts for Bitcoin options are over $12 billion. Last year, this figure was six times less and amounted to only $2 billion. Traders are truly interested in trading futures and options instead of rebalancing their portfolios. Options trading allows traders to hedge different types of investments over the long term. Institutional investors tend to choose this trading option to hedge against potential risks, and also use this trading instrument to maximize their influence on the market. This trade is also often referred to as derivatives trading. Over the past day, the price of bitcoin has increased by 0.3%, the volume of digital gold trading has fallen by 10%. The material has been provided by InstaForex Company - www.instaforex.com |
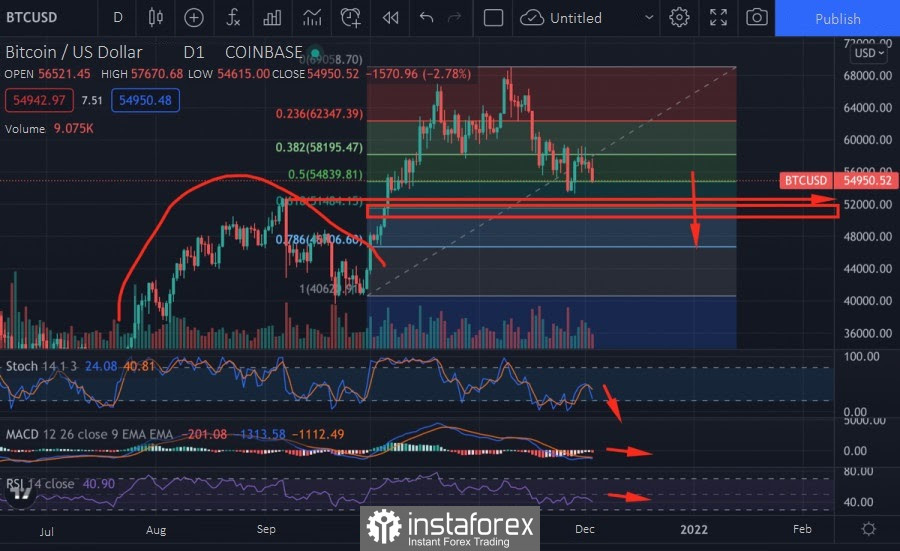
| Bitcoin: How The SEC Is Hindering Innovation In The Crypto Industry Posted: 03 Dec 2021 08:45 AM PST Discontent with the actions of the Securities and Exchange Commission (SEC) and its head Gary Gensler seems to be brewing among the participants of the cryptocurrency market. Fidelity Investments, the largest asset manager in the United States, has launched its first bitcoin spot ETF in Canada on Wednesday as the SEC continues to reject applications for spot funds. Crypto Industry vs GenslerThe crypto community claims that the Commission, under Gensler's leadership, is performing its function of "protecting investors" in a very strange way. For example, it seems rather suspicious that Gensler gave the green light to bitcoin futures ETFs instead of spot ones. It could of course be argued that the futures ETF only caters to large institutions and is definitely not suitable for small retail investors. However, this futures instrument can be used to short Bitcoin. Experts suggest that this is the real reason why these particular tools were chosen. They can be used to manipulate the price of bitcoin. On Friday, another application for the spot BTC-ETF, this time from WisdomTree, was rejected. Jake Chervinsky, head of policy for industry lobbyist The Blockchain Association, commented on the rejection: "I wonder how long before one of the spot bitcoin ETF sponsors gets sick of arguing with a brick wall and decides to sue the SEC. I get why nobody did this before, but the case is stronger now with futures ETFs live, and the incentive to play nice is much weaker." How Gensler Protects Investors from Fraud and Stifles InnovationGensler this week said the SEC would "use a coercive tool" against exchanges. He noted that even highly regulated exchanges like Kraken and FTX are not regulated as securities exchanges. With so many coercive warnings and a long-held belief that virtually all of the crypto industry is violating securities law, the SEC has been holding back the most innovative technologies since the Internet. For the SEC, the purported investor defender, struggling to bring cryptocurrency down is an absolute contradiction. Experts note that the current monetary system works completely against small investors. It is simply wrong to use the rules and regulations of this system for an innovative and disruptive system like cryptocurrency. Cryptocurrencies Are Holding On with All Their MightBitcoin, meanwhile, very accurately and clearly works out the boundaries of the narrow sideways 55,842.84 - 59,283.67. But one cannot say that his support will not be broken. Therefore, the forecast for BTCUSD remains the same: consolidation in the 55,842.84 - 59,283.67 corridor or its expansion to the support area of $52,000 - $53,000 per coin.
|
| December 3, 2021 : EUR/USD daily technical review and trading opportunities. Posted: 03 Dec 2021 08:17 AM PST
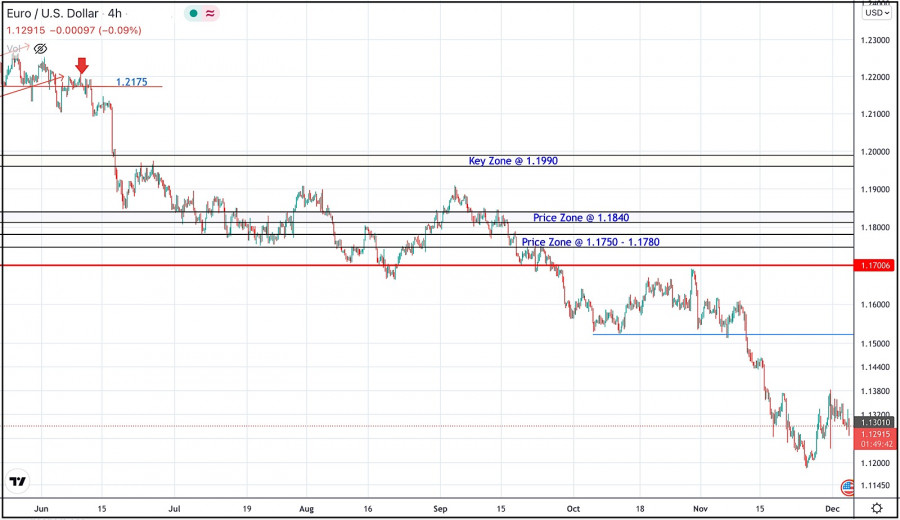
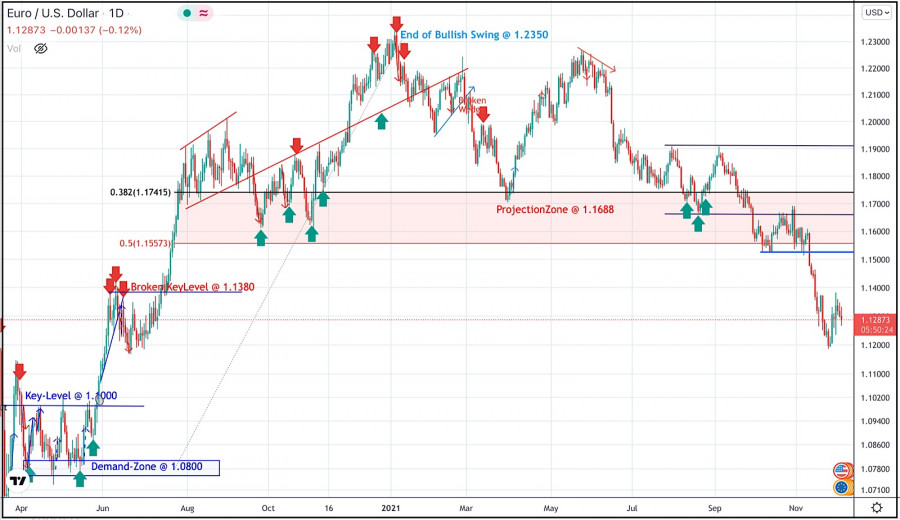
During the past few weeks, the EURUSD pair has been trapped within a consolidation range between the price levels of 1.1700 and 1.1900. In late September, Re-closure below the price level of 1.1700 has initiated another downside movement towards 1.1540 which managed to hold prices for a short period of time before another decline took place towards 1.1200. Currently, the price zone around 1.1500 stands as a prominent supply-zone to be watched for SELLING pressure and a possible SELL Entry upon any upcoming ascending movement. Moreover, it is not advised to add new SELL Entries as the pair already looks oversold. The material has been provided by InstaForex Company - www.instaforex.com |
| December 3, 2021 : EUR/USD Intraday technical analysis and trading plan. Posted: 03 Dec 2021 08:16 AM PST
The bullish swing that originated around 1.1650 in August, failed to push higher than the price level of 1.1900. That's why, another bearish pullback towards 1.1650 was executed. However, extensive bearish decline has pushed the EURUSD pair towards 1.1600 and lower levels was reached. Shortly after, significant bullish recovery has originated upon testing the price level of 1.1570. The recent bullish pullback towards 1.1650-1.1680 was expected to offer bearish rejection and a valid SELL Entry. Significant bearish decline brought the EURUSD pair again towards 1.1550 levels which stood as an Intraday Support zone. Hence, sideway movement was demonstrated until bearish decline occurred towards 1.1325. Please note that any Bullish movement above 1.1500 should be considered as an early exit signal to offset any SELL trades. The price levels around 1.1520 remain a reference zone that needs to be re-visited when the current bearish momentum ceases to exist. The material has been provided by InstaForex Company - www.instaforex.com |
| December 3, 2021 : GBP/USD Intraday technical analysis and significant key-levels. Posted: 03 Dec 2021 08:15 AM PST
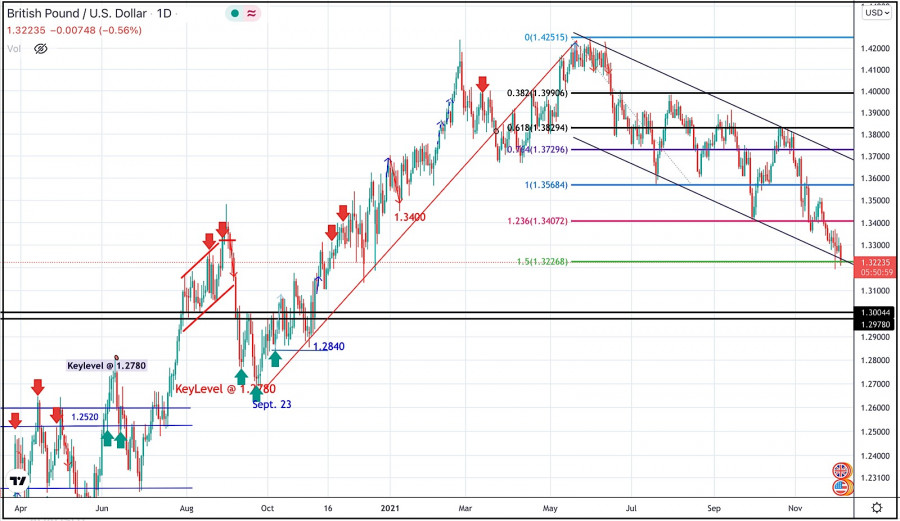
The GBPUSD pair has been moving sideways with some bearish tendency while bearish breakout below 1.3600 was needed to enhance further bearish decline. On the other hand, the nearest SUPPLY level was located around 1.4000 where bearish rejection and a valid SELL Entry was anticipated. Bearish breakout below 1.3680 enabled further bearish decline towards 1.3400 which corresponded to 123% Fibonacci Level of the most recent bearish movement. This was a good entry level for a corrective bullish pullback towards 1.3650 and 1.3720 which was temporarily bypassed. Shortly after, the pair was testing the resistance zone around 1.3830 where bearish pressure originiated into the market. Currently, the short-term outlook remains bearish as long as the pair maintains its movement within the depicted channel below 1.3400. More bearish extension is expected towards 1.3220 where the lower limit of the current movement channel comes to meet with 150% Fibonacci level. Conservative traders should be looking for BUY trades around these price levels. On the other hand, the price level of 1.3570 stands as a key-resistance to be watched either for bearish reversal or a continuation pattern upon any upcoming visit. The material has been provided by InstaForex Company - www.instaforex.com |
| Posted: 03 Dec 2021 08:07 AM PST
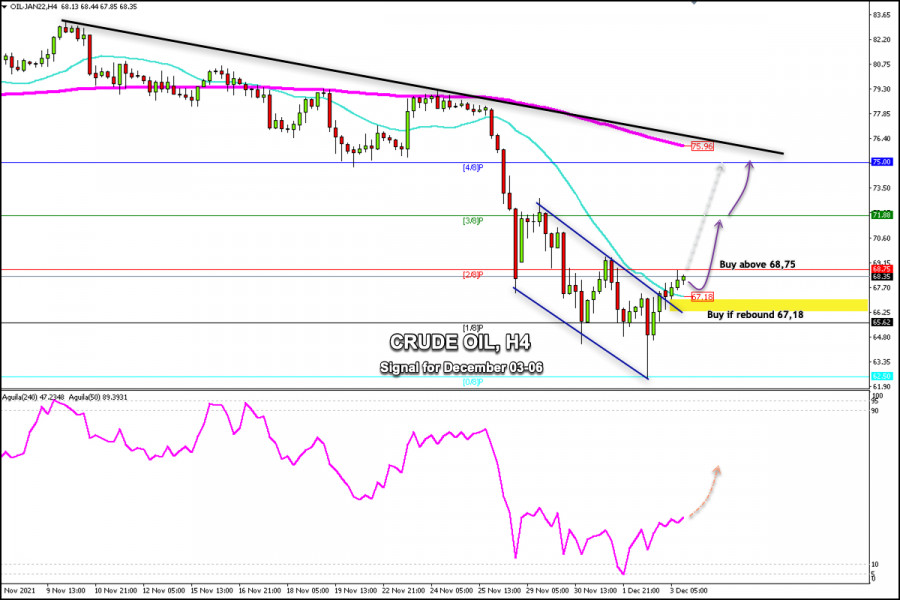
On December 2, crude oil (WTI- #CL) fell to the low of 62.50. This was the price level on August 23rd. It has recovered over 500 pips and is currently trading at 68.35 and consolidating above the 21 SMA and above the downtrend channel that was broken. This sharp drop in WTI that occurred yesterday was due to the decision of the Organization of the Petroleum Exporting Countries and its allies (OPEC +) to continue with the increase in production levels expected for January. The OPEC+ was expected to announce a pause in the pace of WTI production due to the impact of the Omicron variant and after the US and other countries released oil from their strategic reserves. The news took traders by surprise, and for this reason, WTI dropped to 62.50. This strong rebound of more than 5 dollars in the price of Crude Oil in the last 24 hours encourages investors to think that it will be a monthly support zone. In the future, an eventual drop in WTI will give us a good chance to buy back at those low-price levels. As long as it remains above the 21 SMA located at 67.18, Crude oil continued to rise to the resistance of 71.88 and up to the 200 EMA located at 75.96. Our trading plan is to buy crude if it makes a technical bounce at 67.18 or above 68.75, with targets at 4/8 of murray at 75.00. Support and Resistance Levels for December 03 - 06 2021 Resistance (3) 71.60 Resistance (2) 70.79 Resistance (1) 69.07 ---------------------------- Support (1) 67.19 Support (2) 65.75 Support (3) 64.01 *********************************************************** A trading tip for CRUDE OIL on December 03 - 06, 2021 Buy in case of a rebound at 67.18 (21 SMA) with take profit at 71.88 (3/8) and 75.00 (4/8), stop loss below 66.50. The material has been provided by InstaForex Company - www.instaforex.com |
| GBP/USD hot forecast on 3rd December Posted: 03 Dec 2021 08:05 AM PST
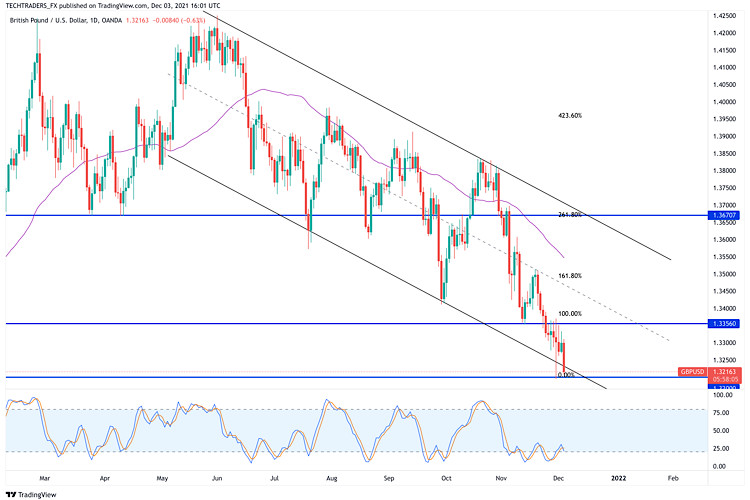
GBP/USD spiked above 1.3300 in the early American session with the initial market reaction to the gloomy US November jobs report. However, the greenback regathered strength on hawkish Fed commentary and forced the pair to turn south. On the four-hour chart, GBP/USD is trading below the 20-period and the 50-period SMAs. Additionally, the Relative Strength Index (RSI) indicator stays below 50, suggesting that sellers are starting to dominate the pair's action in the near term. Currently, GBP/USD is testing 1.3280 static support. In case this level turns into resistance, the next target on the downside aligns at 1.3240 (static level) before 1.3200/1.3195 (psychological level/ November 30 low). Resistances are located at 13300 (psychological level, 20-period SMA), 1.3320 (50-period SMA) and 13360 (static level). The material has been provided by InstaForex Company - www.instaforex.com |
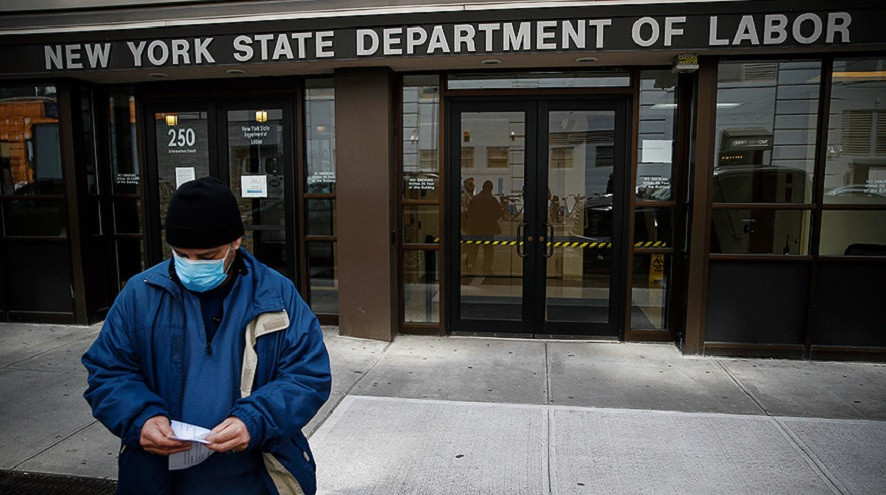
| Weak employment data divided experts into two camps Posted: 03 Dec 2021 08:05 AM PST Job growth in the US has barely shown an increase this year, while the unemployment rate has fallen more than forecast - to 4.2%, showing a controversial overall result that could still push the Federal Reserve to accelerate the curtailment of pandemic incentives.
Weak employment data divided experts into two camps The US Department of Labor on Friday reported that in November the number of jobs, excluding the agricultural sector, increased by 210 thousand after an upward revision in each of the previous two months. This is a very low indicator in comparison with the projected +550 thousand jobs and a decrease in unemployment by 4.5%. The labor force participation rate rose to 61.8%. The average hourly wage in November increased by 4.8% compared to last year, but these figures are not adjusted for inflation. There is practically no real increase. The average length of the working week increased slightly - to 34.8 hours in November from 34.7 hours a month earlier. The number of jobs was reduced, including in retail and education. Employment growth was also held back by the leisure and hospitality sector, which added only 23,000 jobs after an increase of 170,000 in the previous month. The number of jobs in the field of professional and business services increased by 90,000 people. Transportation and warehousing services added about 50,000 jobs, while the number of jobs in the construction sector increased by 31,000. Employment in the manufacturing industry increased by 31,000 people. The study shows that employees find a job fairly quickly. From May of last year to November of this year inclusive, more than 5 million people have already been employed. Service Sector - Controversial-favorable report The indicator of activity in the US service sector rose in November, reaching a new record level, as companies increased recruitment. This growth stunned economists, predicting a drop to 65 points. Last month, the indicator of new orders received by service enterprises amounted to a record 69.7. Alas, there were almost no signs that supply constraints were easing, although prices remained high. The Institute for Supply Management said Friday that its non-manufacturing activity index rose to 69.1 last month, the highest reading since the series began in 1997, from 66.7 in October. A reading above 50 indicates growth in the services sector, which accounts for more than two-thirds of U.S. economic activity. With the growth of employment in the service sector last month, it was possible to reduce the amount of work in progress. The reason for the sudden increase was the delay in deliveries. The indicator of supplier deliveries did not change and amounted to 75.6 (a value above 50% indicates slower deliveries). Usually, the growth of the index is based on the strengthening of economic indicators and increased consumer demand, which would be a positive contribution to the non-manufacturing ISM index. Price markers for services remain high, dropping only 0.6 points compared to last month. Unsatisfactory figures The decrease in the overall unemployment rate by four-tenths of a percent since October occurred even after almost 600 thousand people joined the labor force. The unemployment rate among black Americans is also showing lows since the beginning of the pandemic, but this is most likely due to a decline in economic activity, as the participation rate also fell by 0.3% - to the lowest level since July. For women aged 25 to 54, the participation rate has risen to a pandemic peak. This may mean that the problems with child care are decreasing. Nevertheless, it remains 1.3% below the pre-pandemic highs. The vacancy report consists of two parts - data from employers and households (including the category of self-employed). The survey of the first showed that recruitment slowed down in all industries, including automakers and trade. A survey of households showed that employment increased by 1.14 million people, and many remained out of the game. The number of open jobs may continue to decline if the recent appearance of omicron, a variant of the coronavirus, leads to new restrictions and deters people from looking for work. The number of jobs is still 3.9 million fewer than before the pandemic. Experts believe that recruitment is hampered by a shortage of workers. November was the second full month of hiring after the expiration of the federal-state unemployment benefit in early September. At the end of September, 10.4 million vacancies were opened. Sectors requiring low-skilled labor, which often attract migrants and the black population of the United States, have been particularly affected. Economists also note secondary factors among possible reasons: a strong stock market and high housing prices have increased the well-being of many Americans, contributing to early retirement. Households have also accumulated huge savings, so there is a surge in self-employment. The reaction of the Fed and the markets The main Wall Street indices opened higher on Friday, as investors decided that the Federal Reserve would postpone the tightening of monetary levers. "The numbers (jobs) are very disappointing, and the market is growing, because now the market expects that the Fed will not be able to act so quickly," analyst Thomas Hayes comments on the events. But some economists have already expressed the opinion that such a decrease in the unemployment rate and an increase in labor force participation may push the Federal Reserve System to tighten policy faster than planned since inflation is more stable than previously thought. Earlier this week, Fed Chairman Jerome Powell said the US central bank would consider at its upcoming meeting the possibility of winding down its bond-buying program more quickly, a move that many see as opening the door to an earlier interest rate hike. Recall that the central bank's dual goal requires it to weigh both price stability and maximum employment, and some policymakers fear that ending monetary support too quickly could hurt job recovery. "We have to balance these two goals when they conflict, as they are now," Fed Chairman Jerome Powell told the House Committee on Financial Services on Wednesday. "I assure you that we will use our tools to make sure that this high inflation that we are experiencing will not take hold." Powell's speech caused stock markets to fluctuate between gains and losses all week. Investors, among others, digested updated information about the recently discovered variant of the Omicron coronavirus, which is spreading around the world and forcing many countries to re-impose travel restrictions. "We had a very unstable week, and I see that this constantly changing environment remained somewhat balanced, as we receive more news on both sides of the impact of the Fed's policy decisions, as well as more information about the Omicron option," analyst Brian Wendig notes. In other words, it is difficult for the market to digest such multidirectional signals. After the report, several economists are still confident that the Fed will accelerate the pace of tapering at the meeting at the end of December since inflation leaves the regulator no choice. "While this still indicates that the economy has about 10 months left to close the full employment gap, the unemployment rate is approaching at a relatively rapid pace compared to the Federal Reserve's estimate of full unemployment," said Brian Bethune, a professor at Boston College. The resulting impact of all factors is impossible to predict yet. In addition, more will be known about the new strain by the end of the month. At one time, the delta variant strongly bent the indicators of the third quarter. Perhaps history will repeat itself. Will this force the Fed to abandon its plans to reduce stimulus? Unlikely. Inflation has accelerated, and we are not talking about raising interest rates yet - only about limiting the volume of bond repurchases. So most likely the hawks are right, and the tightening will take place. The material has been provided by InstaForex Company - www.instaforex.com |
| EUR/USD post NFP analysis on December 3, 2021 Posted: 03 Dec 2021 08:05 AM PST
EUR/USD jumped to a daily high of 1.1333 with the initial market reaction to the disappointing November Nonfarm Payrolls data but quickly returned below 1.1300. Rising US Treasury bond yields seem to be helping the dollar stay resilient against its major rivals. The Relative Strength Index (RSI) indicator on the four-hour chart retreated below 50, suggesting that sellers look to retain control of EUR/USD. At the time of the release, the pair was testing 1.1290 (Fibonacci 23.6% retracement of November downtrend). The 50-period SMA aligns as the next support at 1.1280 and additional losses could be witnessed toward 1.1235 (Tuesday low) in case this level turns into resistance. The bearish pressure could weaken if bulls reclaim 1.1320 (100-period SMA, 20-perios SMA). 1.1350/60 area (static level, Fibonacci 38.2% retracement) could be seen as the next resistance. The material has been provided by InstaForex Company - www.instaforex.com |
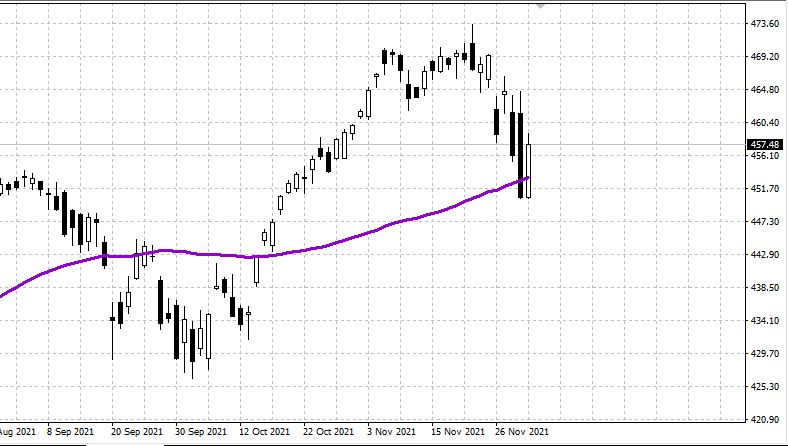
| US market: Unemployment fell sharply to 4.2% - we are waiting for new growth Posted: 03 Dec 2021 07:29 AM PST
S&P 500 The official report on employment in the United States for the month was released - "Nonfarm". The number of new jobs came out much lower than the forecast of +210 against +500. However, the unemployment rate fell sharply from 4.6% in October to 4.2% in November. This means two things: 1. The US market may grow on increased employment. 2. The Fed can now move much more freely to tightening monetary policy and the employment problem has been solved. It is possible to begin the fight against inflation. In the long term, it is good for the dollar but bad for the stock market. However, right now, the market can grow. The material has been provided by InstaForex Company - www.instaforex.com |
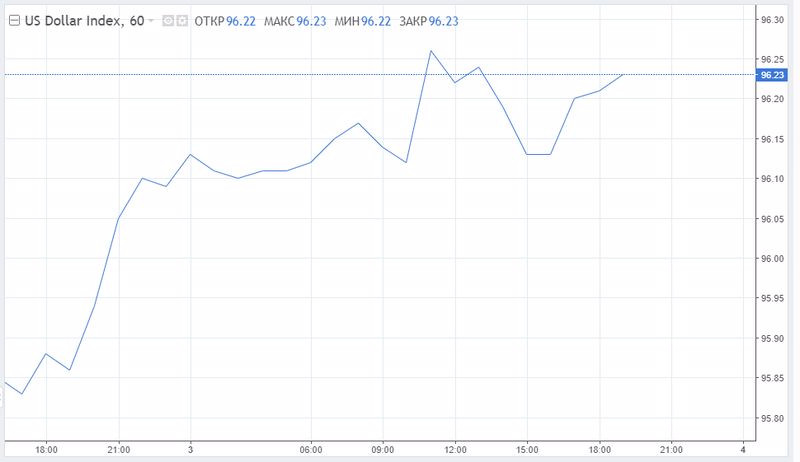
| The Fed may not keep its promises. What will happen to the dollar? Posted: 03 Dec 2021 07:29 AM PST
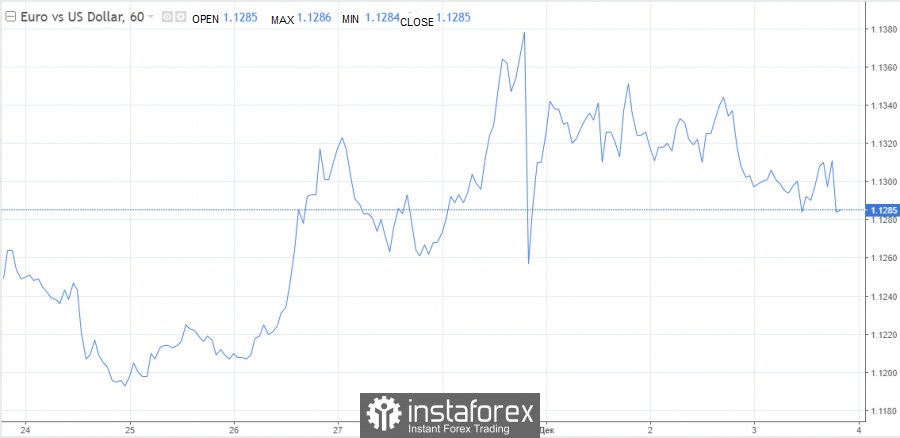
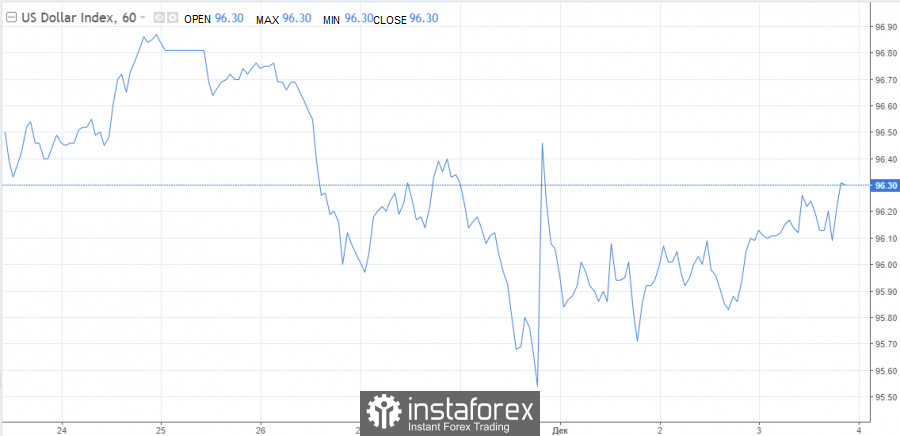
The dollar remains strong before the weekend, trading between a local multi-month high of 96.94 and a recent local low of 95.54 on the index. Another attempt to rise to a new maximum at 97.00 remains in force. Market players overestimate Jerome Powell's hawkish statements made earlier while taking into account Omicron's risks. Next week, the focus of the market will gradually enter the last meeting of the Fed this year (December 14-15), at which management should announce an acceleration in the pace of reduction of asset purchases. If they are reduced, for example, to $ 30 billion per month, then QE will be completed by March, which means that the first-rate hike will take place closer to the middle of 2022. This scenario is already being laid by the markets, but after they hear confirmation from Powell, expectations of a rate hike will increase. Investors are counting on three tightening of the PEPP in the new year and are buying the dollar-based on these expectations. This prospect creates prerequisites for further strengthening of the US currency. Next Friday, the US will publish an inflation indicator, which may affect the rigidity of the rhetoric of the Fed leadership at the December meeting. There is reason to believe that the growth rate of consumer inflation decreased slightly in November, and yet they remain high. Recall that by the end of October, the consumer price index (CPI) added 0.9% monthly, and for the year it rose by 6.2%. The core index (Core CPI) showed an increase of 4.6% in 12 months. Both indicators are at their maximum in more than 30 years, so a slight decrease in pressure on prices will not play a special role, the situation requires intervention, and the Fed now recognizes this fact. The state of the economy is close to when we can talk about raising rates. This week's indicators confirmed a good trend. The purchasing managers' index for the manufacturing sector rose in November stronger than forecast to 61.1 against 60.8 in October. The ISM index of new orders in manufacturing rose to 61.5 from 59.8 in October, and the ISM employment index for the same reporting period increased to 53.3 from 52.0. Employment also continues to recover, despite the existing difficulties in this direction. Signs of an improvement in the state of the economy and the labor market, as well as continuing high inflation, may be another reason for the Fed to start tightening policy earlier than previously planned. In this regard, today's nonfarm are of interest. Meanwhile, the picture of the labor market is ambiguous. Unemployment in November fell to 4.2% from 4.6% in October, but the growth in the number of people employed in non-agricultural sectors of the economy did not meet expectations. The indicator increased by 210 thousand with a forecast of 550 thousand. If investors are disappointed in the end, then we should expect a rally of EUR/USD to 1.1400. Otherwise, a drop to 1.1235 is possible.
Of course, this report is important for the market, as it comes out on the eve of the Fed meeting. However, it may not be given much importance, because the American Central Bank, judging by the rhetoric, intends to raise rates "no matter what." Here a counter-question arises: will the market decide that the Fed is making a political mistake by tightening policy ahead of time? Meanwhile, isolated comments began to appear on the network about the fact that the Fed will show firmness of character at the December meeting, and the acceleration of the stimulus reduction will be postponed. Can such remarks affect the positioning of the "American"? Rather no than yes. The dollar will get out. It is known for its ability to benefit. Goldman Sachs believes that the dollar will retain its growth potential in the coming weeks for two reasons and they do not plan to change its forecast yet. The growth factor will be the harsh rhetoric of the Fed and Omicron, which will play into the hands of the dollar as a protective asset.
Anyway, the euro looks extremely depressing against the dollar. Of course, it has an internal macroeconomic positive. Thus, the pace of business activity is accelerating in the Old World, despite rising inflation and problems in the supply chains of raw materials and components. The demand for European industrial products remains quite high. Since inflation in the eurozone has not reached the same magnitude as in the US or the UK, the ECB is unlikely to change its goal of maintaining a super-soft policy. Today, Christine Lagarde, during the Reuters next online conference, once again made it clear to the markets that a rate hike in 2022 is "very unlikely." Economists do not expect a change in the course of monetary policy in 2023. The only thing they hope for is the announcement of the end of the Emergency Asset Purchase Program (PEPP) in March 2022. However, these expectations may not come true. The EUR/USD pair has no other way but down. The growth of the euro should be considered solely as a temporary corrective movement. At the end of November, for example, it was triggered by a sharp drop in European stock indices. The material has been provided by InstaForex Company - www.instaforex.com |
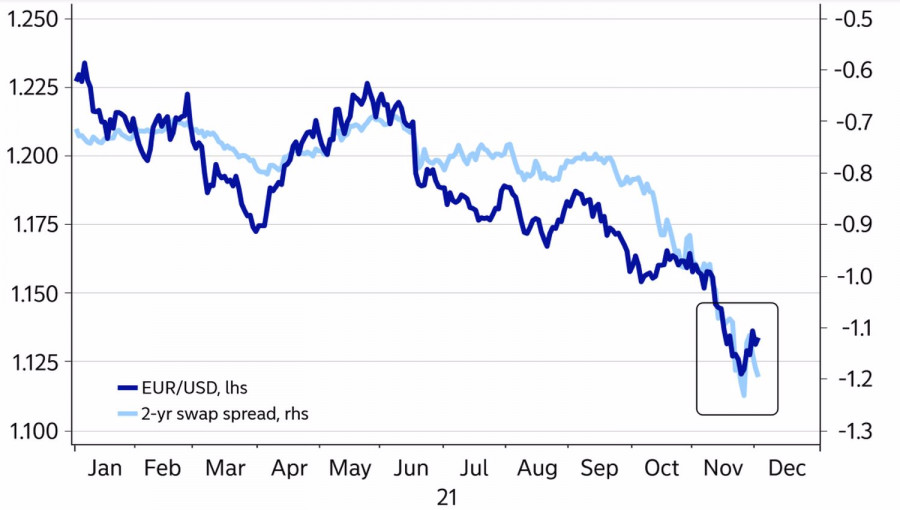
| EUR/USD: The dollar is invulnerable Posted: 03 Dec 2021 07:03 AM PST In order to look into the future, it is necessary to understand the reasons for what is happening now. The main drivers of the EURUSD correction were not the acceleration of European and German inflation to 4.9% and 6%, respectively, but the massive closing of positions in carry trade and doubts about the Fed's aggressive monetary restriction due to the Omicron variant of the COVID-19. And if Fed Chair Jerome Powell, in his speech to Congress, showed that the Fed is not going to back down from its plans to normalize monetary policy, then players on both sides continue to flee the market. Not only are the euro and the yen characterized by low, often negative rates on debt denominated in them, they have also fallen in price significantly since the beginning of the year. It is logical that these monetary units were used as funding currencies in the carry trade. As soon as the news about the new strain of COVID-19 appeared, the players on both sides began to close longs on the assets of developing countries and currencies, whose issuing central banks were talking about raising rates and buying euros and yen. The result on the charts is EURUSD and USDJPY corrections. The latter turned out to be more impressive, as speculators inflated net shorts in Japan to the highest levels since the beginning of 2019. Alas, the carry trade's support for the euro cannot continue indefinitely. This is a short-term factor that will soon become history. Even if Omicron turns out to be the deadliest of all known variants of the coronavirus, and the economies go into lockdowns again, the U.S. dollar will benefit from this as a safe-haven asset. It was so in March 2020, and it will happen now. In contrast, the absence of severe symptoms and low mortality could turn COVID-19 into seasonal flu, reassure consumers and investors, and allow the Fed to tighten monetary policy with a clear conscience. Gaps in German and U.S. bond yields and interest rate swaps will continue to play into the bears' hands on EURUSD, as a result of which the major currency pair will easily restore the downward trend Dynamics of EURUSD and interest rate differential swaps
While the Fed has abandoned the mantra of the temporary nature of high inflation, the ECB continues to adhere to it, which testifies in favor of divergence in monetary policy and puts pressure on the euro. The key event of the week by December 10 will be the release of data on U.S. consumer prices. The indicator in November is capable of accelerating from 6.2% to 6.4%, core inflation - from 4.6% to 4.7%, which will be a pretext for an attack by the FOMC hawks. In just a few days, the Federal Reserve may decide to speed up the process of winding down QE. Technically, the rebound from the resistance at 1.133 made it possible to earn a modest profit on the EURUSD shorts. If the statistics on the U.S. labor market for November are positive, the downward movement in the direction of 1.122 is likely to continue. If not, traders should still sell the pair on growth. Including the rebound from the resistance at 1.142. EURUSD, Daily chart
|
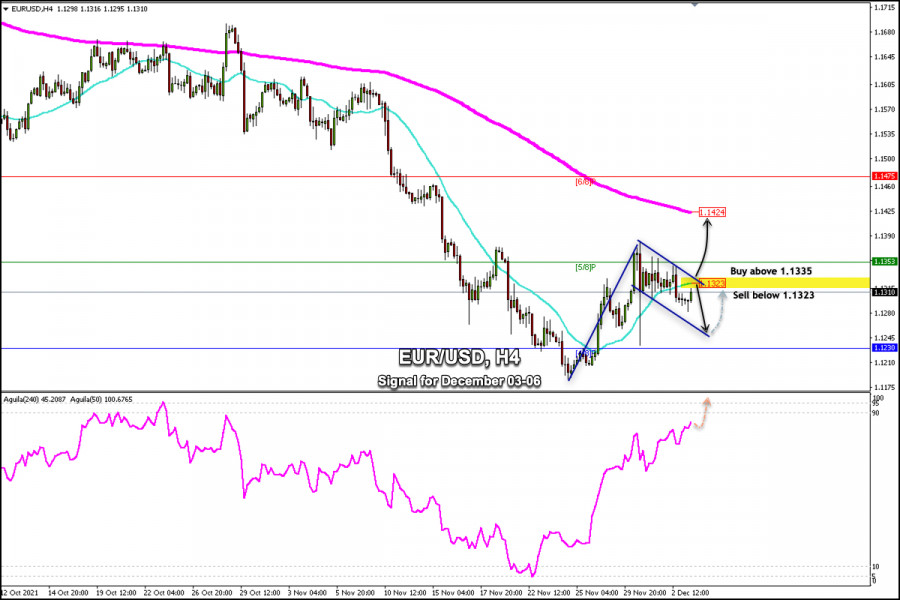
| Trading signal for EUR/USD on December 03 - 06, 2021: sell below 1.1323 (21 SMA) Posted: 03 Dec 2021 06:33 AM PST
EUR / USD has managed to recover the 1.1300 zone and is now stabilizing around the SMA of 21 prior to the publication of the monthly report of the labor market in the United States. On the 4-hour chart, you can see the formation of a bullish pennant technical pattern. The confirmation of a sharp break above 1.1335 will be the beginning of an upward movement with targets at the 200 EMA located at 1.1424. Also, if the labor report is negative for the US dollar, then the Euro could gain momentum and could rise to the resistance zone of 1.1352. In the event that the Euro fails to consolidate above the SMA of 21 and trades below 1.1323, we will continue selling with targets up to 1.1245 where there is the bottom of the bearish channel that forms the technical pattern. The US dollar asserts strength against other currencies due to growing expectations that the Fed could increase rates from the second half of 2022. Investors will continue to take refuge in the dollar, so the euro could be under downward pressure for a long time. Our forecast in the next few hours for the euro is a consolidation above 1.1335. As long as EUR / USD is trading above this zone, we will have an opportunity to buy with the target at 1.1350 and 1.1424 (200 EMA). The market sentiment report for today, December 03, shows that there is 62.77% of operators who are buying the EUR / USD pair. This data provided a bearish sign in the long term. It is bearish because investors act against the trend. First, we could expect a recovery to 1.1424. Then, the price may again resume its downward movement with the target at 1.1116. Support and Resistance Levels for December 03 - 06 2021 Resistance (3) 1.1382 Resistance (2) 1.1352 Resistance (1) 1.1330 ---------------------------- Support (1) 1.1275 Support (2) 1.1260 Support (3) 1.1225 *********************************************************** A trading tip for EUR/USD December 03 - 06, 2021 Sell below 1.1323 (21 SMA) with take profit at 1.1245 and 1.1230 (4/8), stop loss above 1.1355. The material has been provided by InstaForex Company - www.instaforex.com |
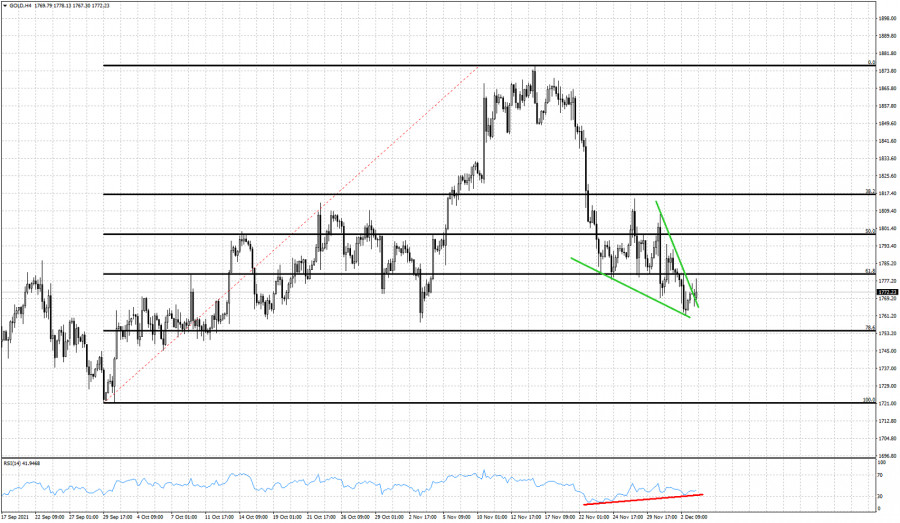
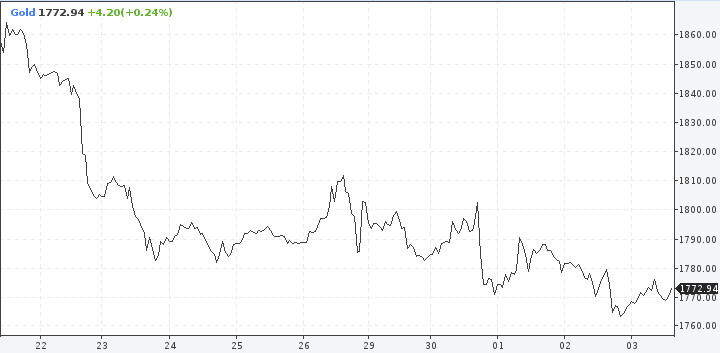
| Gold still trading around $1,770. Posted: 03 Dec 2021 06:04 AM PST Gold price spiked to $1,778 after the NFP announcement earlier today, but now Gold is trading again around $1,770. Short-term trend remains bearish as price continues making lower lows and lower highs. As we explained in our previous analysis on Gold, we believe that soon we should witness a major upward reversal in Gold.
Black lines - Fibonacci retracements Green lines - wedge pattern Price continues to trade inside the wedge pattern, despite briefly moving above it. The RSI continues to provide bullish divergence signals and price continues to trade between the 61.8% and 78.6% Fibonacci levels. This is the most probable area for a reversal to the upside. Gold price needs to break resistance at $1,780 and stay above current lows. Gold bulls need to push price outside of the wedge pattern. This will be the confirmation of a trend reversal. Until then, price remains under pressure. The material has been provided by InstaForex Company - www.instaforex.com |
| EURUSD reaction to NFP announcement. Posted: 03 Dec 2021 05:53 AM PST With US NFP just announced volatility is rising. The NFP outcome was disappointing as the numbers missed the expectations by a lot. Initial reaction to the market news is Dollar weakness and that is why EURUSD is now bouncing towards 1.1320-1.1330.
|
| EUR/USD. USD receives support but its rally may be short Posted: 03 Dec 2021 05:52 AM PST
Health experts remain concerned about the worldwide spread of a new variant of COVID-19, Omicron, but it could be weeks before we know how dangerous this strain can actually be. investors continue to emphasize that the US stock market is strong and the Fed is ready to accelerate the unwinding of its monetary stimulus program. This statement is supported by the 2% rally in the major Wall Street indices and the rebound in the greenback. At the end of yesterday's trading session, the US stock market increased after the two previous trading sessions closed in the red. Stock indices should overcome the recent streak of declines and may rise over the next 12 months, according to analysts recently polled by Reuters. The S&P 500 index is expected to extend its rally this year and rise by 7.5% by the end of 2022, reaching the level of 4,910. According to BNP Paribas, the S&P 500 index is likely to climb to 5,100 by the end of the next year. Despite fears caused by the new COVID-19 strain, bank specialists expect corporate profits to rise faster than Wall Street experts estimate. BNP Paribas considers that tax hikes for companies are unlikely to occur next year. Other risks for business, including supply chain disruptions and the Fed's interest rate hike, markets would easily overcome, analysts said. There is also a possibility that the Fed may not tighten its policy so much as it was in the past.
The Fed's previous rate hike peaked at 2.25%-2.5% in 2018. But the upcoming cycle could end below 2%, according to the US rate futures forecast for five years. This rate, which is lower than the 2.5% forecast by the Fed, reflects that the regulator's policy tightening could end before interest rates reach the central bank's inflation target of 2%. This means that real interest rates in the US are likely to remain negative. What is now driving the longer part of the treasury yield curve is the expectation that once the US central bank starts to raise rates, it will not be able to approach the levels it has reached in previous cycles, according to the Bank of America strategists. Investors still perceive any stock market downsides as an opportunity to make purchases, believing that in a world where inflation-adjusted bonds yield well below 0%, there is simply no alternative. The US dollar is trading near a 17-month high and remains a favorite currency among investors. The USD index closed Thursday's session with a slight surplus for the second day in a row and continues to hold its higher levels on Friday. The difference in interest rates will be a hot topic on Forex over the next three months, according to a consensus forecast by Reuters experts, putting the greenback in a unique position to improve its performance against its counterparts. The USD index has gained nearly 7% for the year to its high since 2015 and got a boost on Wednesday from Fed Chairman Jerome Powell, who gave the markets a hint that the central bank would raise rates earlier than expected. The dollar is likely to find new supporters in the coming weeks, even among those analysts who still expect it to weaken in the short to medium term.
"The dollar is well placed to repeat what it tends to do," JP Morgan analysts said. "Typically, on average, the dollar has gone up by four percentage points in broad index terms in the six months before the first Fed hike, and that's probably not an unreasonable projection for thinking about how much upside there could be for the dollar this time around," they added. Despite concerns that long positions on the dollar may prevent further growth in the next month or so, Rabobank strategists continue to favor the dollar against the euro, given the potential for more aggressive action by the Fed. "Risk of further USD pullbacks means that we have held off from revising lower our EUR/USD 1.12 target for now. That said, the possibility of a break lower to 1.10 during the course of next year has increased," the experts said. The EUR/USD struggled to benefit from its modest rise on Thursday, but ended up retreating more than 50 pips from the swing highs and closed yesterday's trading near 1.1300. The Eurozone reports released the day before exceeded expectations. Producer prices rose sharply in October and the unemployment rate declined. However, this data did not add optimism to the euro, which continues to suffer because the coronavirus is again shattering Europe, and countries in the region are forced to tighten restrictive measures. In addition, the ECB policy remains rather soft compared to other major central banks, and this also puts pressure on the euro. Meanwhile, growing expectations that the Fed will sooner or later tighten its monetary policy to curb stubbornly high inflation continue to support the dollar. Several FOMC members - Fed Vice Chairman Randal Quarles, Atlanta Fed President Rafael Bostic, and San Francisco Fed Chair Mary Daley - supported the idea of accelerating the pace of stimulus program tapering. In addition, the greenback was strengthened by the data on the US economy released on Thursday. The number of initial claims for unemployment benefits for the week that ended on November 26 rose less than expected to 222,000. The reading of the previous week was revised to 194,000 from 199,000.
On Friday, the EUR/USD pair is trading in a narrow range within 30 pips. The US labor market report for November is in the spotlight. The US economy created 550,000 jobs last month. If the payrolls meet or exceed expectations, the dollar is likely to strengthen. Strong data may also give the Fed reasons to accelerate the tapering of the asset purchase program at the next meeting, which will be held on December 14-15. Recent data point to strong US GDP growth in Q4, which will prompt the Fed to cut quantitative easing faster. Therefore, the greenback will trade at higher levels at least until the end of Q1 of 2022, according to specialists at MUFG Bank. "But we do not believe a faster taper through Q1 2022 by the Fed will be followed by numerous (three) rate hikes and expect the Fed to prove much more cautious in raising rates and will ultimately deliver less than market pricing – perhaps just hiking once. This caution will prompt a repricing that ultimately results in USD depreciation," they added. Following such a scenario, experts do not exclude the return of the EUR/USD pair to 1.2000 in the first quarter of 2022. Increasing divergence in monetary policy between the Fed and the ECB has been a key factor in euro weakness in recent months, and this situation may continue in early 2022. However, the ECB policy could become more hawkish if eurozone inflation proves to be more resilient than the regulator believes, and this would strengthen the euro, the experts added. The EUR/USD pair was recovering below 1.1200, or from lows since July 2020, but stopped near the 38.2% Fibonacci retracement level of the decline to 1.1185 from 1.1690. If the pair breaks through resistance at the area of 1,1380 - 1,1385, it may bring additional short-term gains for the buyers. A breakthrough of 1,1400 would allow the bulls to reach 1,140 and 1,1500. On the other hand, sustained weakness below the 1.1260-1.1255 area, leading to a subsequent breakout of 1.1235, would be seen as a new trigger for bears. The pair could retest the yearly low at 1.1185, followed by 1.1145 and 1.1100. The material has been provided by InstaForex Company - www.instaforex.com |
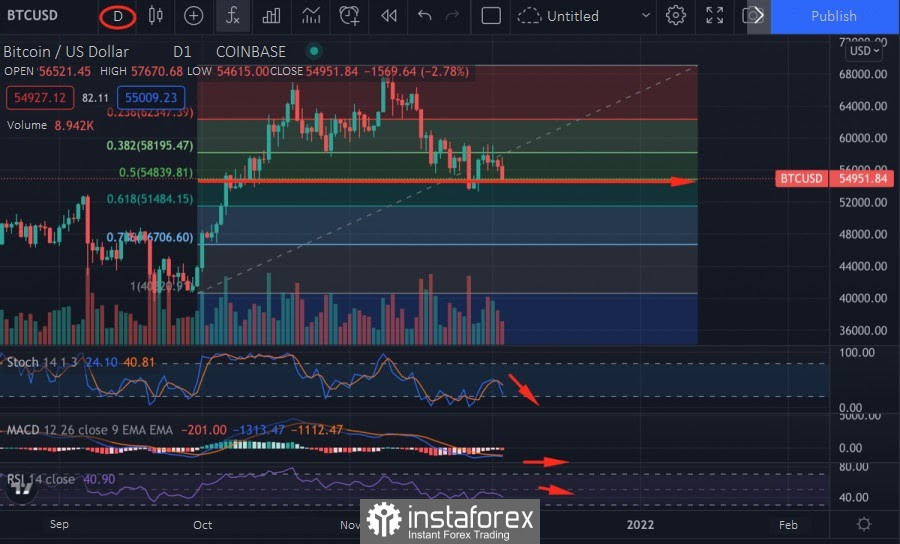
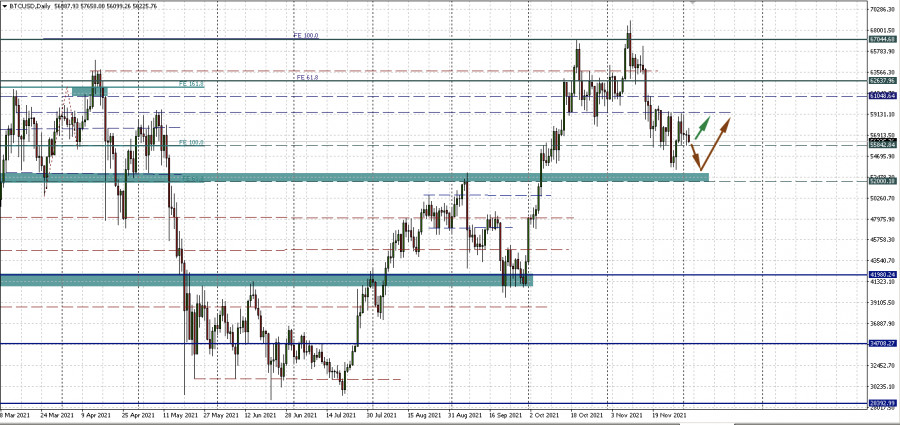
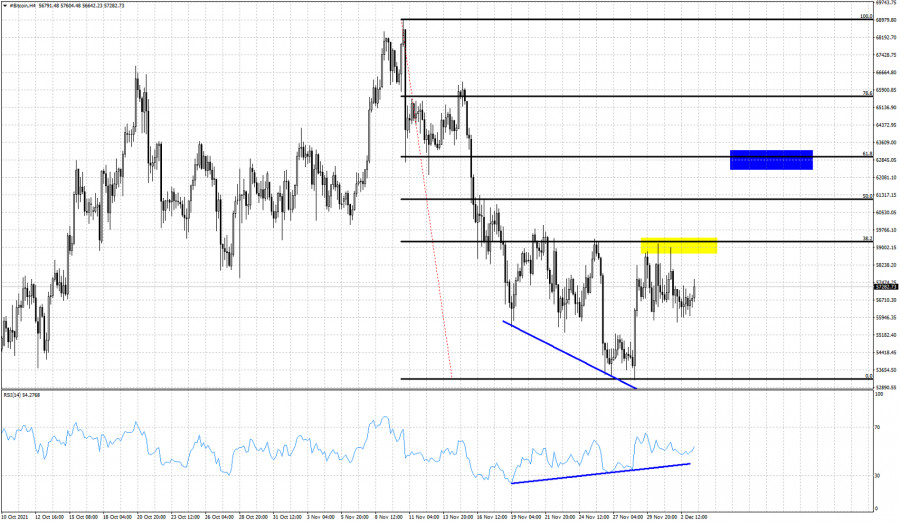
| Bitcoin continues to give hopes for a bounce towards $63,000. Posted: 03 Dec 2021 05:44 AM PST Bitcoin continues to trade around $57,000 as price is mostly moving sideways the last couple of sessions. Price remains below the short-term resistance at $59,000 and above the recent key lows at $53,500.
Blue rectangle- target if resistance is broken Blue lines - Bullish RSI divergence Black lines - Fibonacci retracements Bitcoin as we mentioned in previous posts, has most probably completed its first leg down around $53,000 and is now bouncing. Our first target was the 38% Fibonacci retracement. Our second and final target is at the 61.8% Fibonacci level. I believe a move towards the blue rectangle is the most probable scenario. This scenario gets cancelled if price breaks below $53,000 level. The material has been provided by InstaForex Company - www.instaforex.com |
| Gold on the brink of another major fall in 2022 Posted: 03 Dec 2021 04:48 AM PST
Gold is gradually sliding down and is now trading near the lowest levels for the month. It seems that market players, who bet on precious metals in the midst of panic due to inflation, have become disillusioned with this asset. The news about Omicron played a role here. The main fundamental factor playing against gold is the Fed's hawkish rhetoric. Faster stimulus cuts and rate hikes in the U.S. have diminished interest in gold as a hedge against inflationary risks. It is unusual that the precious metal continues to decline, despite the uncertain and contradictory dynamics of the dollar. The U.S. Dollar Currency Index is completing the trading week in line with the upward trend. Volatility is increasing due to the news about Omicron, but, on the other hand, is dampened by expectations of an earlier rate hike. The upside potential for the dollar remains, which suggests medium-term pressure on other assets, including gold. Investors began to buy gold from October, an obvious upward price jump took place from the beginning of November. In the 20th, the quote was located near the 50- and 200-day moving averages and was in a state of perfect balance. Something went wrong and by the end of November the bulls had lost control of the situation and the bears became the main dominant force. Judging by the chart, the November growth was completely leveled, and, what is more important, the quote went below important technical and psychological levels. Looking at the weekly timeframe, it is obvious that the price has returned under the 20-week SMA. If Friday's trading closes at current levels, it will be the lowest weekly close since early October. All indications are that the local sell impulse will be the main one in the coming sessions. The bears' sentiment can be traced to move the quote to the $1,730 area. The next target will be the level of $1,680. There will most likely be a stop here. It is unlikely that it will be possible to sell gold below as quickly. The $1,680 mark acts as a more significant support line, from where buyers have been able to buy back more than once this year and thereby keep the precious metal from falling deeper. However, the picture for gold already looks pessimistic. A blockage below the $1,730 mark will be a clear signal that the situation is out of control and that we are no longer talking about a corrective pullback. The breakdown of the strong level of $1,680 can be considered a control shot by sellers.
If this scenario really comes true, then market players will witness a repeat of the 2011-2012 situation. The upward prospect will be postponed, and in 2022 it will be possible to tune in to a price decrease in the $1,300-1,500 region. Until the $1,680 level is broken through, an alternative scenario, namely growth after a downward correction, should be kept in mind. As soon as gold is confidently on the track of an upward trend, the price will rush further up. Here a new leap for $2,600 is possible in a year. Meanwhile, markets' focus on Friday is on the release of key data on the US labor market. Strong results from the NFP report could put pressure on gold, as it strengthens investors' expectations for a Fed rate hike in the first half of next year. This will cause a break of the $1,760 support level, to begin with, and head towards $1,730. The material has been provided by InstaForex Company - www.instaforex.com |
| Video market update for December 03,,2021 Posted: 03 Dec 2021 04:34 AM PST Continuational pattern... The material has been provided by InstaForex Company - www.instaforex.com |


| You are subscribed to email updates from Forex analysis review. To stop receiving these emails, you may unsubscribe now. | Email delivery powered by Google |
| Google, 1600 Amphitheatre Parkway, Mountain View, CA 94043, United States | |


Comments