Forex analysis review
Forex analysis review |
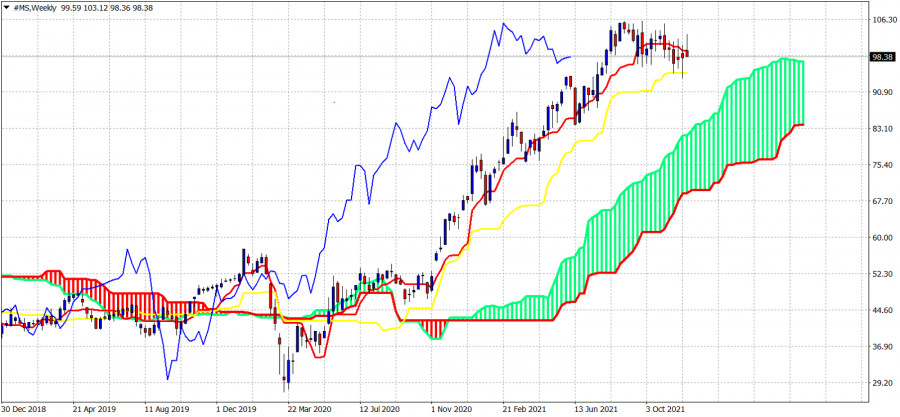
- Ichimoku cloud indicator analysis on MS stock price.
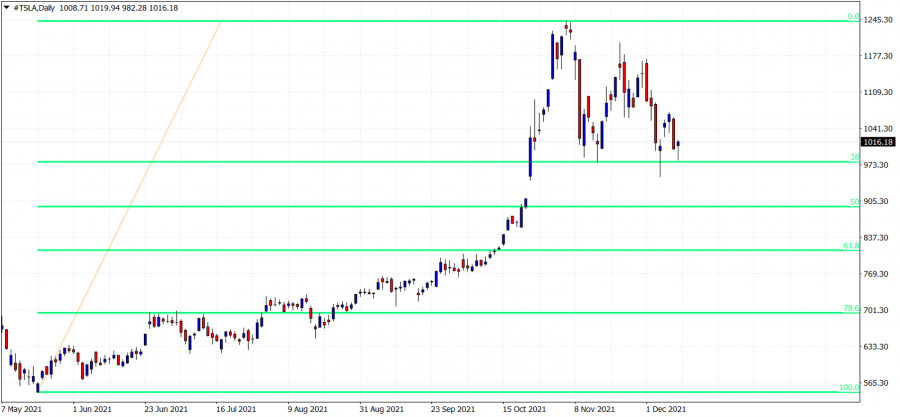
- Another bullish hammer candlestick by TSLA stock price.
- Cardano remains in a bearish trend.
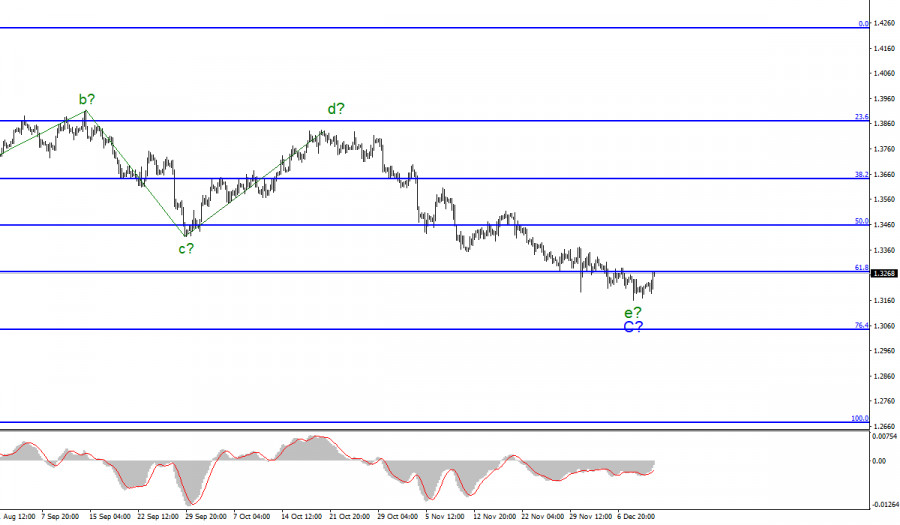
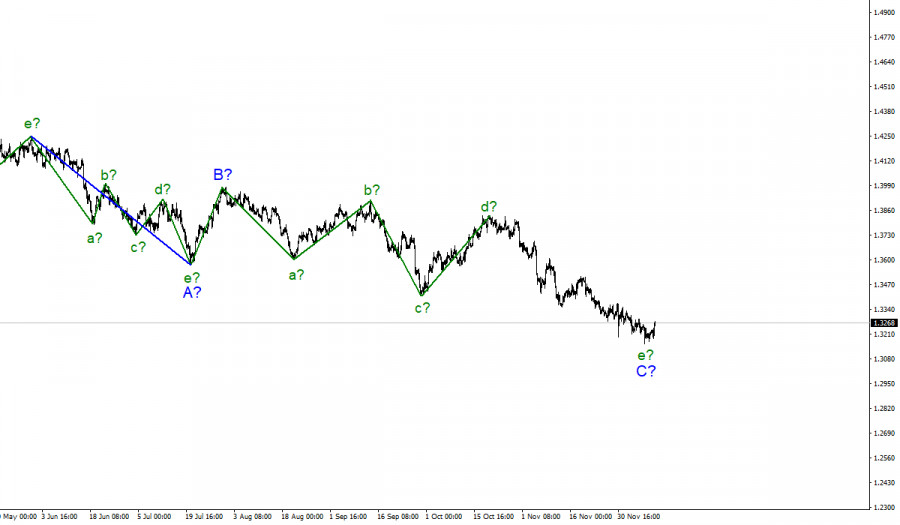
- Analysis of GBP/USD on December 11. Goldman Sachs does not believe in a rate hike by the Bank of England.
- Bull market is culminating in bitcoin's potential to hit new all-time high or decline below $30,000
- EUR/USD analysis on December 11. The week is over – the euro currency has refrained from a new decline.
- The Fed will continue to drag bitcoin to the bottom
- A return to 30,000 is more than likely
- Analysis of the trading week of December 6-10 for the GBP/USD pair. New COT (Commitments of Traders) report. A perfect technical
| Ichimoku cloud indicator analysis on MS stock price. Posted: 12 Dec 2021 02:21 AM PST At the end of November we posted our technical analysis on the MS stock, saying we expect a major reversal to start specially if price were to break below the support at $95 on a weekly basis. Although on a daily basis price fell as low as $93.86, the weekly close was higher than $95.
|
| Another bullish hammer candlestick by TSLA stock price. Posted: 12 Dec 2021 02:15 AM PST TSLA stock price is respecting on a daily basis the major Fibonacci support level at $975. Our first pull back target has been achieved and price has formed twice a bullish hammer candlestick pattern around these levels.
At the beginning of November when price was around $1,170 our analysis warned bulls that price could start a pull back towards the 38% Fibonacci retracement level. Price was expected to find support around $1,000-$970. Price has formed bullish hammer candlesticks twice around this retracement level. The first time price bounced towards $1,070. Then price made a higher low and formed a second hammer on Friday. As long as price is above $948 on a daily basis, bulls have the potential to move higher towards $1,200. Resistance is at $1,070 and breaking above it will increase chances of price pushing to new all time highs. The material has been provided by InstaForex Company - www.instaforex.com |
| Cardano remains in a bearish trend. Posted: 12 Dec 2021 02:09 AM PST Cardano remains in a bearish trend after it broke below $1.83 support. Price continues making lower lows and lower highs. Price has now reached $1.31 and is trading below the 78.6% Fibonacci retracement of the entire rise from $0.99 to $3.08.
Red lines - Bearish channel The RSI in the Daily chart is at oversold levels. Price is trading near the lower channel boundary. A bounce higher towards $1.40-$1.50 is justified from current levels, however it is very early to talk about major trend reversals. Price has retraced most of the upward movement and this is not a good sign for longer-term bulls. So far there is no bullish divergence signal, implying the downtrend remains intact and we should expect more downside. Resistance by the bearish channel is at $1.90-$2, as long as price is below that level we remain bearish. The material has been provided by InstaForex Company - www.instaforex.com |
| Posted: 11 Dec 2021 10:06 PM PST |
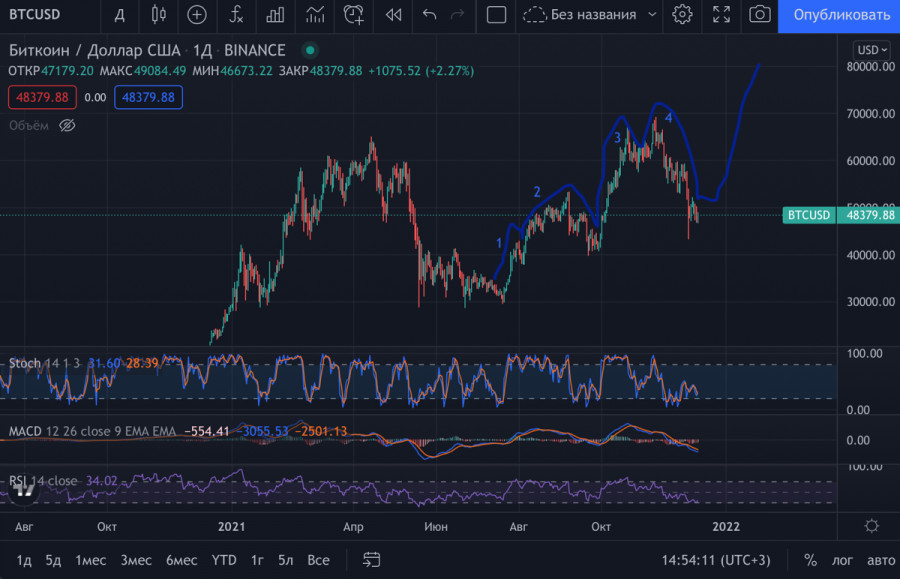
| Bull market is culminating in bitcoin's potential to hit new all-time high or decline below $30,000 Posted: 11 Dec 2021 10:27 AM PST After its recent plunge bitcoin has managed to stabilize and is holding steady at $48,000. Another positive aspect is that the market reacted calmly to the news on inflation growth, also indicating the stability of the current consolidation range. However, there are signals that the coin will hold below $50,000 for about a week, accumulating the necessary volumes for growth. Taking this fact into account, it is worth considering likely scenarios for price movement in a bull market or identifying likely targets for a correction if the current growth cycle ends. Bitcoin at crossroadsThe cryptocurrency's positions are quite weak even despite its successful consolidation above $48,000. Bitcoin's further upward movement is limited due to the lack of necessary volumes and investors' fear. The asset crossed the no-return line at $52,000, which made analysts reconsider the technical analysis. Well-known analyst PlanB, who predicted the coin to climb $98,000 in November and $100,000 at the end of 2021, expressed his view. The expert stated that the coin was at a crossroads and could both resume a bull rally and enter a full bull market. I support that view. However, I stick to the bullish scenario, according to which bitcoin is in the embryonic state of the fifth wave of growth, and the current correction was caused by a complicated structure of the 4th wave in a five-wave structure. At the same time, I do not exclude the possibility that the price could go down and a bear market starts.
Positive scenarioIn a positive scenario, bitcoin has not hit its high in the current growth cycle yet. It indicates that at least one more wave of growth is expected, which will occur at the end of 2021 and the beginning of 2022. I also back this idea, and I believe that the price of the cryptocurrency still retains the potential to move towards $75,000-$80,000. Considering that in the next week and a half the asset will try to recover above $62,000, I assume that BTC will mostly rise in early January.
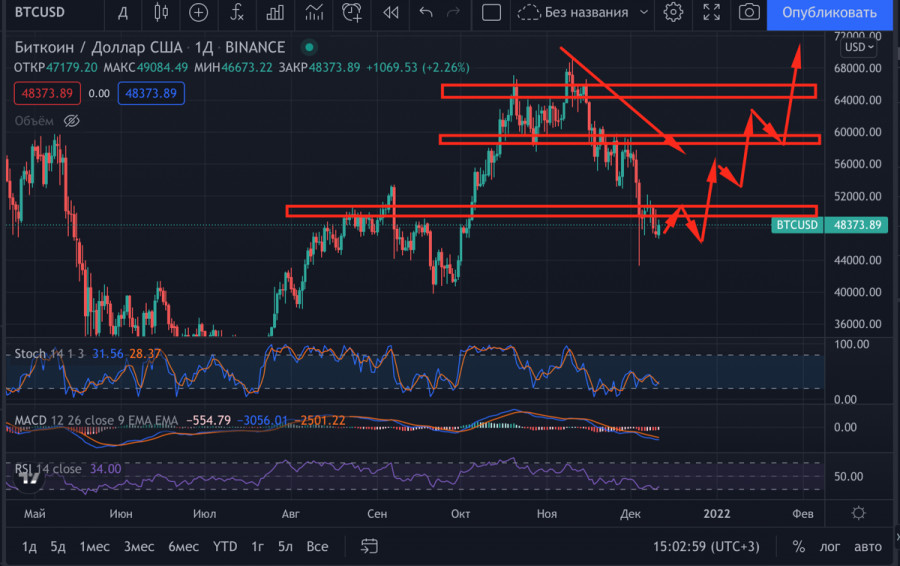
Negative scenarioIn a negative scenario, bitcoin heads into a full bear market, which historically comes with a correction up to 80% of ATH. This is an extremely negative scenario in which the crypto's downside potential is estimated to be around $14,000. The PlanB analyst believes that a sharp drop in quotations is unlikely as the asset has not hit its high in the current cycle yet. Even with an immediate correction, the market would most likely not allow BTC to fall below $20,000, the high of 2017. Considering $69,000 as the absolute high of the current price movement period, a correction to the $25,000-$30,000 range is possible. However, it is more likely to be around the previous local low at $28,700.
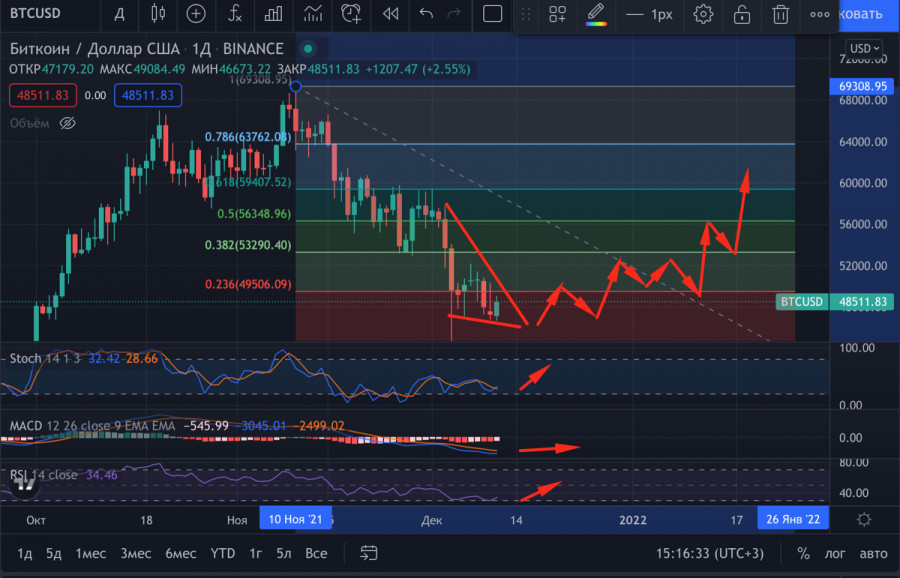
Current situationAs of 2:00 pm, bitcoin is moving in a narrow downward channel of $46,000-$51,200, which could be broken in the near future. This is indicated by the tightening and formation of a triangle pattern with a high chance of being broken upward. Technical indicators of the cryptocurrency confirm this fact: the stochastic oscillator has formed a bullish cross and is starting an upward movement in the bullish zone. It indicates the emergence of upward momentum, and the growth of the relative strength index to the 50 mark, refers to the activity of bulls and the start of the accumulation period with a parallel exit from the channel. In case of a successful break the price has good chances to go towards the Fibo level of 0.236 and to consolidate above the psychological mark of $50,000. With such a scenario the range of $50,000-$60,000 becomes the key one for the third week of December, indicating the movement to the new highs before 2022.
|
| Posted: 11 Dec 2021 09:19 AM PST |
| The Fed will continue to drag bitcoin to the bottom Posted: 11 Dec 2021 09:19 AM PST
Over the past year, we have regularly talked about the fact that the growth of bitcoin, like many stocks and other assets, is largely accidental. If there had been no pandemic, if there had not been trillions of dollars printed by central banks and created in their accounts, the markets would not have inflated like soap bubbles. Thus, bitcoin grew primarily not on increased demand with unchanged supply, but on the increased money supply, which had to be put somewhere. Formally, the demand for bitcoin (and many other assets) was growing. Therefore, its course also grew. But they did not grow based on fundamental factors. Not based on the fact that Bitcoin is getting better. Not on the basis that it displaces fiat money and becomes closer to the people. No, it is also an investment tool and, according to various analytical agencies, more than 80% of coins are already concentrated in the hands of large and institutional investors. Thus, when the Fed stops its QE program, the growth of bitcoin will have to at least stop, because the cash flow to the cryptocurrency market will stop. Accordingly, demand will stop growing. Perhaps, by the way, in this case, mass sales will not follow. First, because there will be no less money in the economy, only the growth of the money supply will stop. Second, because inflation should decrease first, and only then investors can think about transferring their capital from risky bitcoin to quieter and less profitable assets. After all, with inflation of almost 7%, hardly anyone is eager to invest in US Treasury bonds with their yield of 1.25-1.5%. Nevertheless, the "Fed factor", from our point of view, will stall the growth of the main cryptocurrency. Robert Kiyosaki: markets may collapse due to "fake inflation". A similar opinion is shared by the author of the bestseller "Rich Dad, Poor Dad" Robert Kiyosaki. He believes that soon the value of precious metals, real estate, and cryptocurrencies may collapse down. This will happen because of the "fake inflation", which is managed by Jerome Powell and Joe Biden. "Collapse and depression are coming. It's time to get richer after the collapse of fake inflation," Kiyosaki wrote on Twitter, who in the last few months has been calling for buying gold, silver, and bitcoin after the collapse. We would like to clarify right away that Kiyosaki had previously predicted a crash in October, which, as we see, did not happen. Thus, we recall that any forecasts should be treated very carefully. Technical confirmation of any fundamental hypothesis or any assumption is always required.
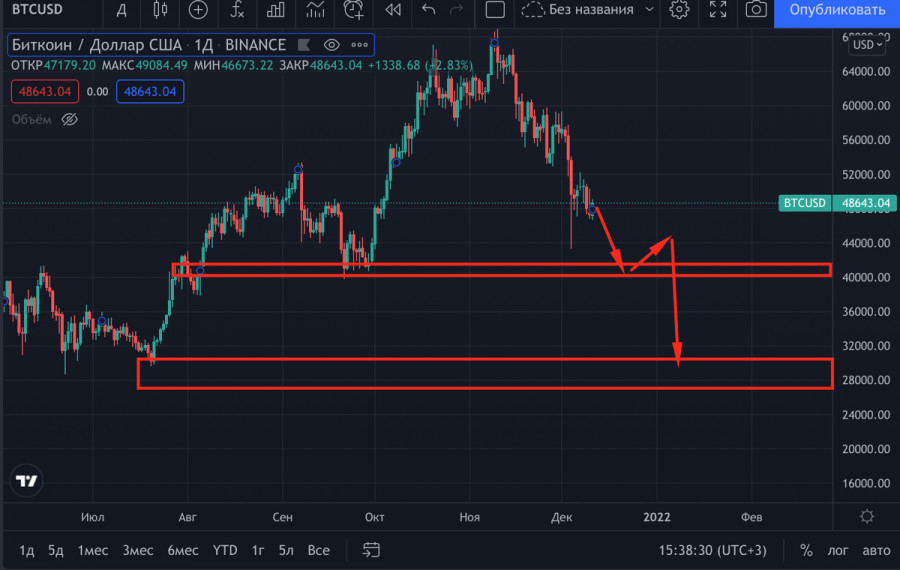
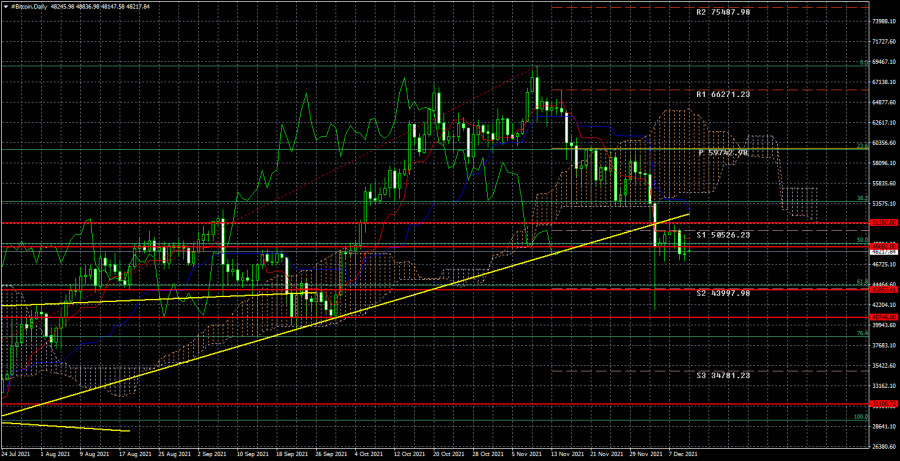
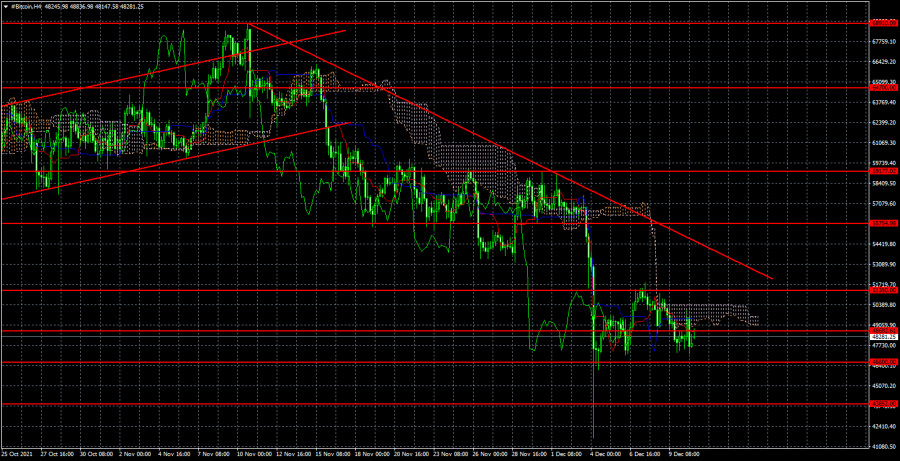
A very important event happened in the 24-hour timeframe. The quotes of the "bitcoin" are fixed below the ascending trend line, so the "bullish" trend is broken on the long-term TF. Consequently, the fall may continue. We have already outlined the goals in the previous article, they are also clearly visible in the illustration above. It should be noted that the price is also now below the Senkou Span B and Kijun-sen lines. Therefore, the technical picture says an unambiguous "down" BTC. The material has been provided by InstaForex Company - www.instaforex.com |
| A return to 30,000 is more than likely Posted: 11 Dec 2021 09:19 AM PST |
| Posted: 11 Dec 2021 06:04 AM PST Analysis of GBP/USD 24-hour TF.
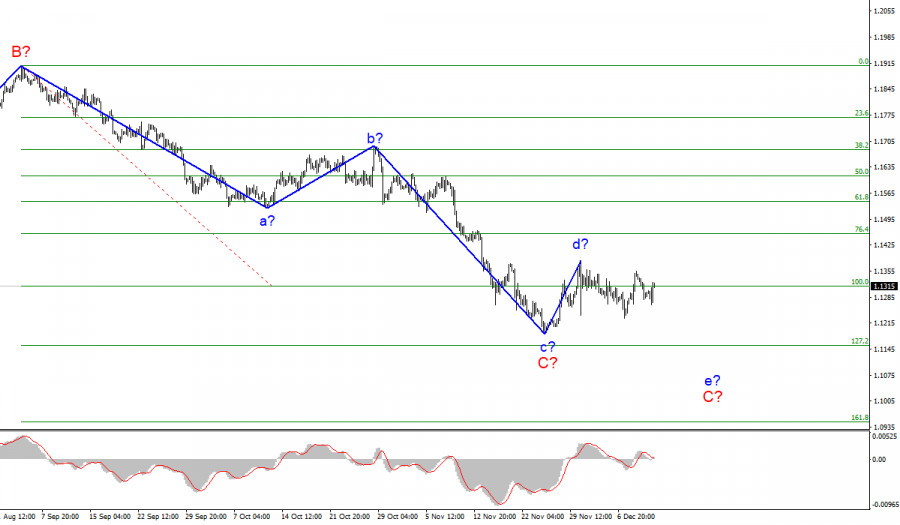
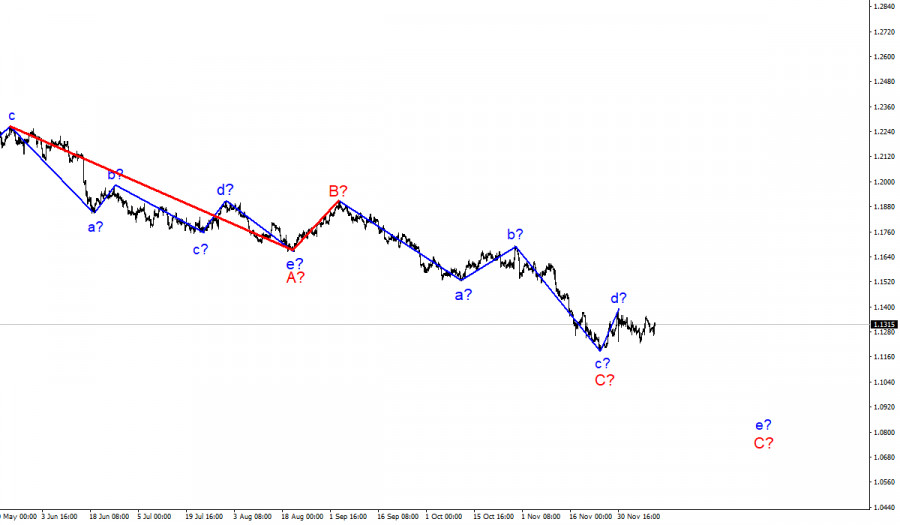
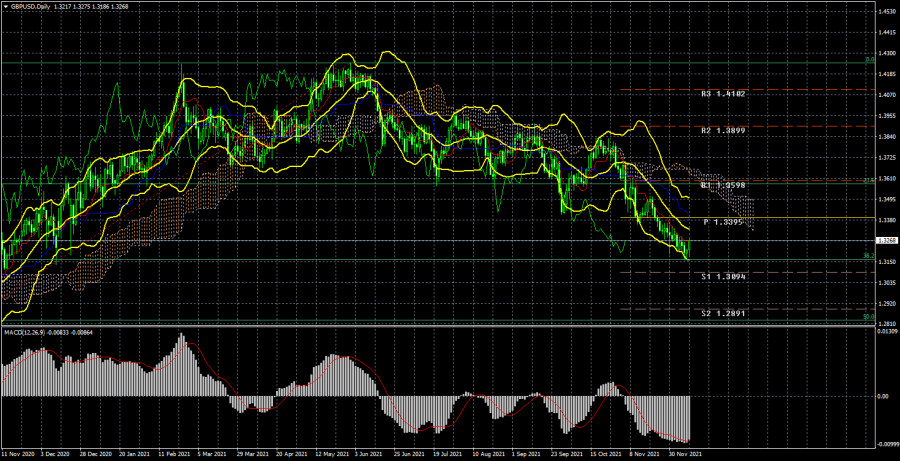
The GBP/USD currency pair has worked out the 1.3162 level during the current week, which is an important 38.2% Fibonacci level. Thus, a rebound from this level was very likely in any case. And it happened. Now the pair will try to show a more or less strong correction. However, both pairs have obvious problems with the correction. Both are adjusted very reluctantly and very strained. Therefore, the pound/dollar pair now has chances to grow towards the critical Kijun-sen line, but at the same time, if the downward movement resumes on Monday, we will not be surprised at all. On the one hand, the pound, like the euro, is in decline for most of 2021. And this fall can still be interpreted as a correction against the global upward trend. Actually, at the moment, the pair has managed to adjust by only 38.2%. However, the fundamental background may continue to force traders to sell the pound and buy the dollar. Recall that in recent weeks, extremely unpleasant reports and news have been received from the UK. First the "fuel" crisis, then the "logistics" crisis, then the conflict over the "Northern Ireland protocol" with the European Union, then the conflicts with France on the "fish" issue and illegal migration. To top it all off, Boris Johnson got into a corruption scandal and a Christmas party scandal last year. Thus, all these factors do not contribute to the growth of the British currency. In addition, the pressure on the pair continues to be exerted by the fact that the Fed is ready to continue to wind down the QE program, and immediately after its completion – to start raising the key rate. The Bank of England, which showed in November that it could also raise the rate and start curtailing QE, may abandon these plans in December due to a new strong "wave" of the pandemic in the UK. Analysis of the COT report.
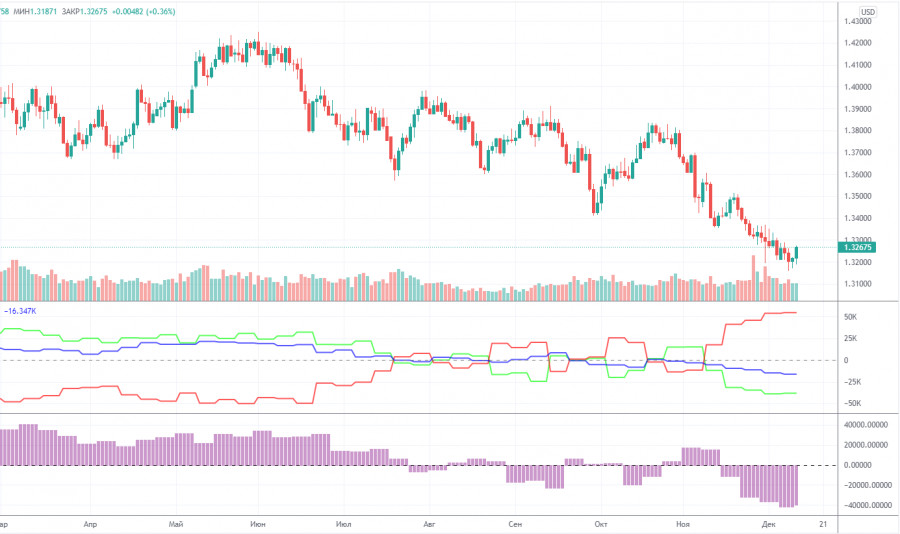
During the last reporting week, the mood of professional traders became a little less "bearish". Professional traders closed 3.6 thousand contracts for sale and 2.1 thousand contracts for purchase during the week. Thus, the net position for the "Non-commercial" group of traders increased by 1.5 thousand contracts. This is a very small change even for the British pound. In general, the mood of non-commercial traders continues to be "bearish", and quite strong. We draw the attention of traders to how low the green line of the first indicator is located in the illustration above, which reflects the net position of the "Non-commercial" group. Thus, unlike the European currency, the fall of the pound sterling in recent weeks looks just logical: major players sell off the currency, and it falls. A further fall in the British currency is also now quite likely, but at the same time, we draw the attention of traders to the fact that the green and red lines of the first indicator have moved quite far from each other. This may indicate that the downward trend is drying up. Thus, we get a situation in which the euro currency is not moving down quite logically, and the pound sterling may complete its movement in the near future. Thus, for both major pairs, we recommend waiting for the downward trend to end, but do not start buying until specific buy signals are formed. Analysis of fundamental events. There is an extremely small amount of important news and events in the UK this week. Only on Friday, a report on GDP was published, which turned out to be significantly weaker than forecasts, as well as a report on industrial production, which also fell short of forecasts. However, despite these disastrous statistics, at the end of the day, the pound rose in price, although in the first half of Friday it was still declining. However, the report on American inflation quite unexpectedly provoked a drop in the dollar. It seems that the markets no longer consider the growth of inflation in the States as a factor in accelerating the pace of curtailing the QE program or faster rate hikes. Or maybe the downtrend is just nearing its end since the growth factors of the dollar have already been played out several times. Anyway, so far we are talking only about a correction, which may later turn into an upward trend. Trading plan for the week of December 13-17: 1) The pound/dollar pair maintains a downward trend. Therefore, purchases are still not relevant now. We need to wait for the pair to consolidate above the critical line, or even better - above the Ichimoku cloud. We still assume that the pair may go up 400-500 points in the coming month. But a lot next week will depend on the outcome of the meeting of the Fed and the Bank of England. The fundamental background will be very strong, which we will talk about in the following articles, and the British pound will count on support from the Bank of England. 2) Bears continue to hold the pair below the critical line. The targets for further movement to the South are now the support levels of 1.3094 and 1.2891. However, at least a small upward correction should take place first. If the pair's quotes bounce off the critical line, this may trigger a resumption of the downtrend with the specified goals. Explanations to the illustrations: Price levels of support and resistance (resistance /support), Fibonacci levels – target levels when opening purchases or sales. Take Profit levels can be placed near them. Ichimoku indicators(standard settings), Bollinger Bands(standard settings), MACD(5, 34, 5). Indicator 1 on the COT charts - the net position size of each category of traders. Indicator 2 on the COT charts - the net position size for the "Non-commercial" group. The material has been provided by InstaForex Company - www.instaforex.com |

| You are subscribed to email updates from Forex analysis review. To stop receiving these emails, you may unsubscribe now. | Email delivery powered by Google |
| Google, 1600 Amphitheatre Parkway, Mountain View, CA 94043, United States | |


Comments