Forex analysis review
Forex analysis review |
- EUR/USD. Preview of the new week. The New Year's week will be as boring as possible in terms of the "foundation".
- Analysis of GBP/USD. Results of outgoing year.
- EUR/USD analysis. Outcomes of 2021.
- Analysis of the trading week of December 20-24 for the GBP/USD pair. COT (Commitments of Traders) report. The pound sterling
- EUR/USD analysis for December 20 - 24. COT (Commitments of Traders) report. Pair continues to trade sideways
- Results of the day and week. Simple tips and analysis of deals for beginners. The pound sterling plunged into the festive
- Results of the day and week. Simple tips and analysis of deals for beginners. The pair continues the festive movement.
- Analysis of GBP/USD on December 24
- EUR/USD analysis on December 24. All the hopes of the euro currency are transferred to the next year.
- Elon Musk: Bitcoin is a means for the ric
- Czech crown shows highs
- BTC/USD on December 24. Bitcoin is approaching the previous maximum
| Posted: 26 Dec 2021 12:57 AM PST
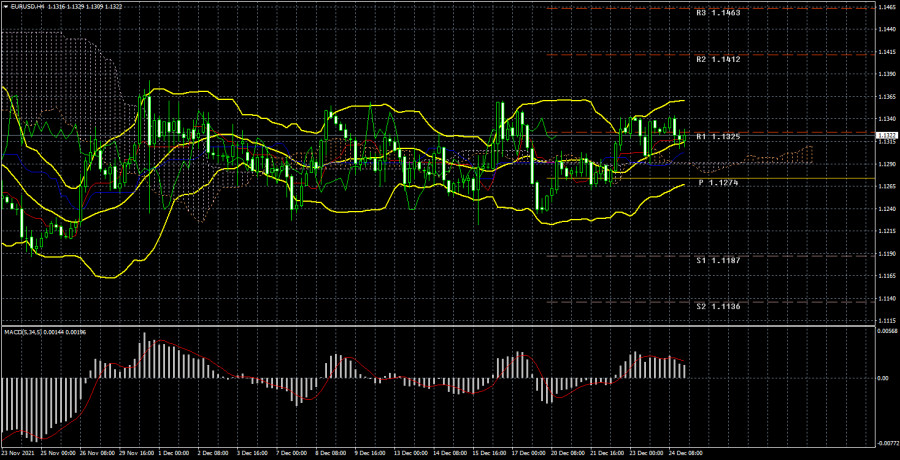
Well, the New Year's week begins. And the euro/dollar pair meets it inside the same side channel, which we have already talked and written about more than once. On the 4-hour timeframe (illustration below), it is visible that the pair has been flat for several weeks. Bollinger bands are not ideally directed sideways, but still, their orientation cannot be called ascending or descending. But in the 24-hour timeframe, everything is perfectly visible and understandable. After another round of downward movement, a flat began, and the Bollinger bands narrowed and turned sideways. Thus, the Ichimoku indicator lines are not strong inside the outright flat. This applies to both 4-hour TF and 24-hour. Accordingly, first of all, you need to wait for the flat to end. As for the "foundation" and "macroeconomics", next week, there will be neither one nor the other. And nothing is surprising in this, since the week is New Year's. Thus, the volatility of the euro/dollar pair may remain low, although this assumption is twofold. On the one hand, it is logical, since many traders will leave the market, and those who remain will have nothing to react to. On the other hand, in the conditions of a "thin" market, there may be movements of the pair, even if there is no "foundation". Thus, the "festive" status of the week does not mean that the pair will stand in one place. But to leave the side channel, it will have to work hard, and we do not believe that this will happen on New Year's Eve. Separately, I would like to mention the "coronavirus". In the last week, in the absence of other news and events, everyone has been discussing it, as well as a new strain of "omicron", which is less dangerous, but more contagious. However, the markets are still not responding to this news in any way. Therefore, if the situation continues to deteriorate, then theoretically there may be a panic, which, of course, will lead to strong movements in the foreign exchange market, but for this everything must become much worse than it is now.
Trading recommendations for the EUR/USD pair: The technical picture of the EUR/USD pair on the 4-hour chart according to the Ichimoku strategy looks extremely eloquent. Bollinger bands have been directed sideways for most of the last four weeks, which signals a flat. The pair is located between the levels of 1.1236 and 1.1360. For most of the past week, the pair was in a one-way upward movement, but even this did not lead to the pair's exit from the side channel. Thus, the lines of the Ichimoku indicator have practically no meaning now. You need to wait for the flat to end or trade for a rebound from the upper or lower boundaries of the channel. Explanations to the illustrations: Price levels of support and resistance (resistance /support), Fibonacci levels - target levels when opening purchases or sales. Take Profit levels can be placed near them. Ichimoku indicators (standard settings), Bollinger Bands (standard settings), MACD (5, 34, 5). The material has been provided by InstaForex Company - www.instaforex.com |
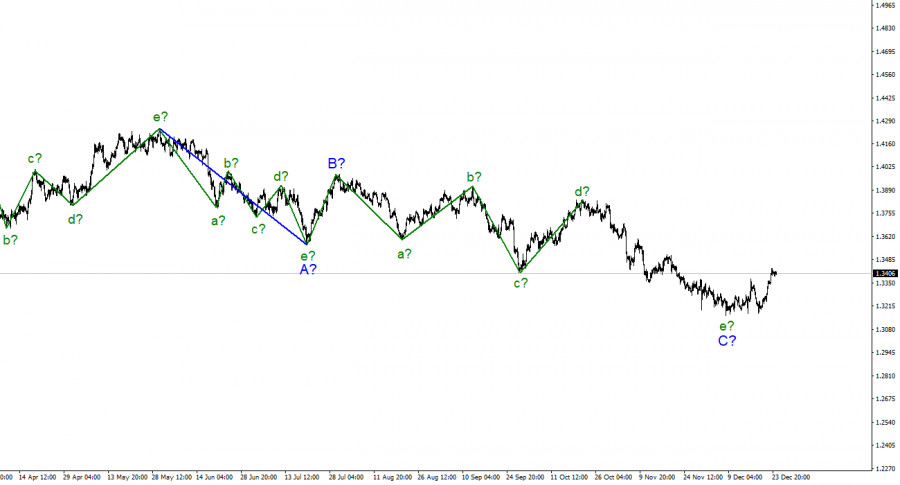
| Analysis of GBP/USD. Results of outgoing year. Posted: 25 Dec 2021 05:57 AM PST
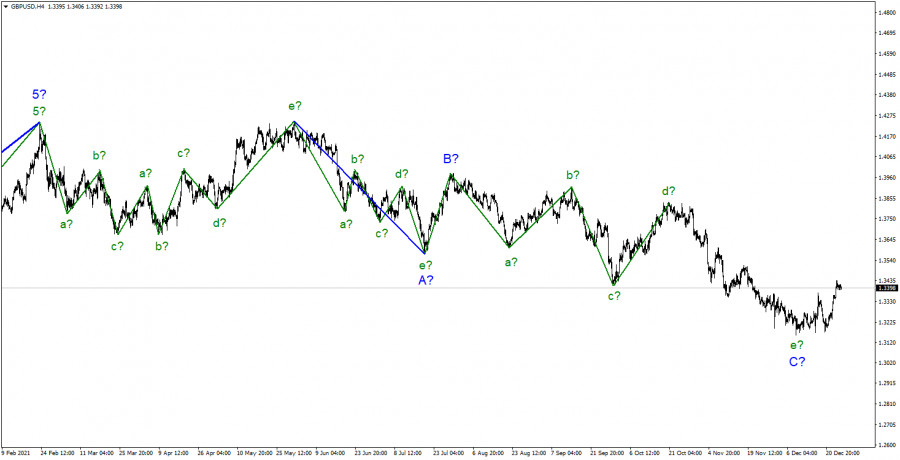
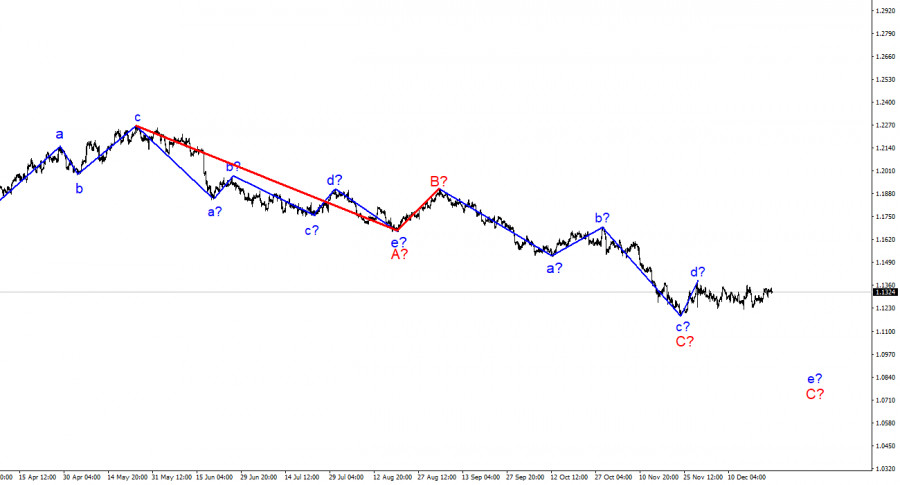
In the first part of 2021, the pound/dollar pair was forming downward and upward waves. When the formation was completed, the quote returned to the levels from which it began the decline. Then, the pair started the formation of a downward section of the trend, which now is becoming more complicated. Its correctional nature allows us to say that this section could be of almost any length. The internal wave structure could be of any complexity. At the moment, it is quite possible that the formation of wave C is completed. This could be proved by five clear waves within wave C as well as the pair's increase from the recent lows in the last few days. However, the current growth in the instrument could be considered wave D. If the wave finishes its formation, the pound sterling may resume falling in the long term. Thus, during the first week of the year, traders should find out within what wave the price is rising. The internal structure of wave D is turning into a correctional three-wave section. It is highly possible that the wave will end its formation in the near future. However, it is better to see where the wave ends and then take a trade decision. Notably, it could be rather long since all the previous correctional waves were quite strong. The material has been provided by InstaForex Company - www.instaforex.com |
| EUR/USD analysis. Outcomes of 2021. Posted: 25 Dec 2021 05:05 AM PST
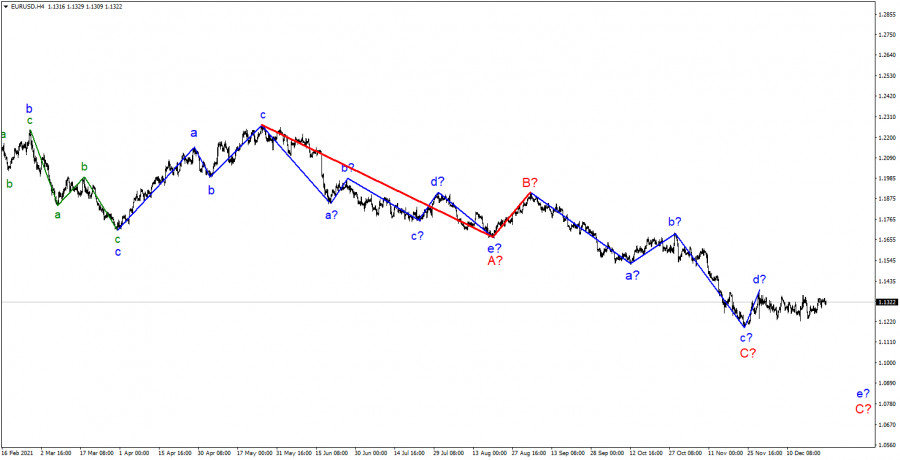
On the 4-hour chart, the wave pattern for the EUR/USD pair continues to be consistent even considering the movements for the whole year. After several series of corrective waves in the first half of the year, the market was showing a bearish sentiment. Thus, by the end of December, the anticipated wave C is approaching its formation. However, it may still take a five-wave a-b-c-d-e form. Therefore, the wave pattern of the whole downtrend section could also take the form of A-B-C-D-E. This is the problem with corrective patterns. They can take almost any shape and duration. However, until a successful attempt to break through the peak of wave d in C, I still believe that another downward wave will be built inside wave C. Most likely this will happen after the New Year, as market activity remains very weak right now. As for the prospects of building waves D and E, much will depend on the background during the first months of 2022. If it remains weak for the euro, we will probably observe a new downward wave. The material has been provided by InstaForex Company - www.instaforex.com |
| Posted: 25 Dec 2021 01:05 AM PST Analysis of GBP/USD 24-hour TF.
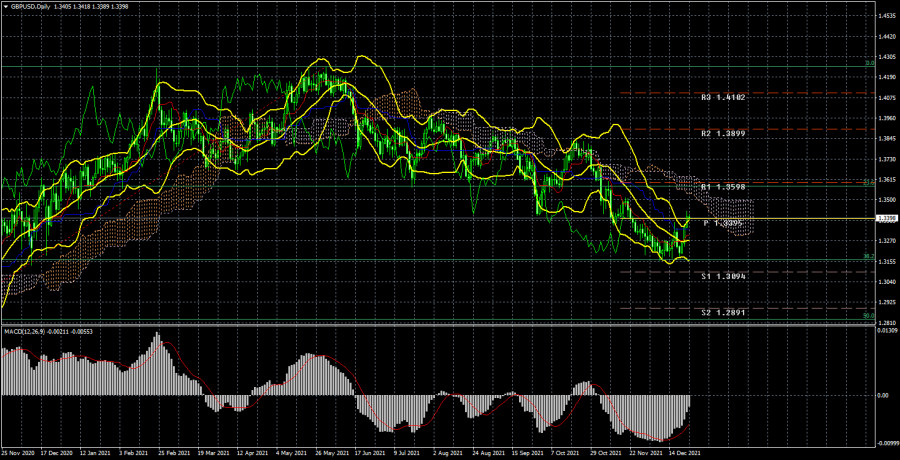
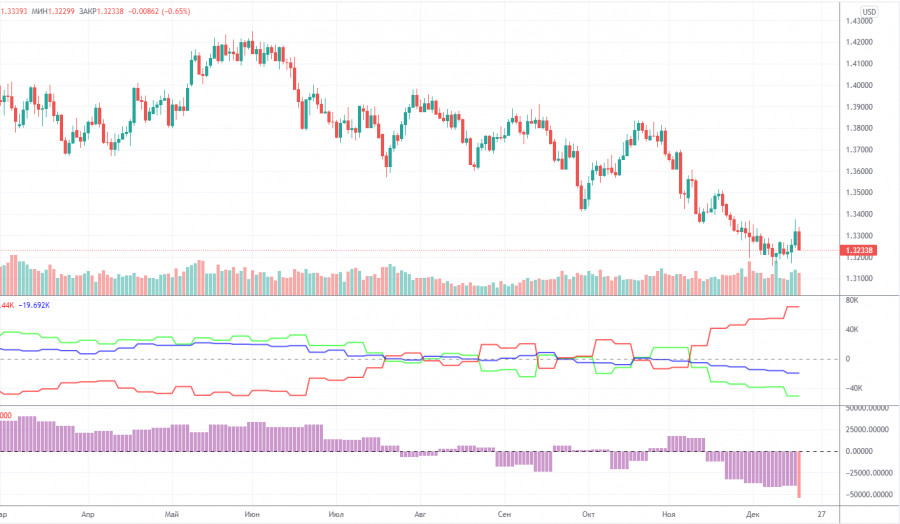
The GBP/USD currency pair has increased by 150 points during the current week. Although this week's status was festive, the market still found grounds for fairly strong purchases of the British currency, although these grounds were not obvious to most traders. By and large, these grounds had to be sought out, and nothing came to mind. The only two possible options are the absence of a "lockdown" before Christmas, as stated by Boris Johnson, and the technical factor. Let's analyze both in more detail. Earlier this week, the British Prime Minister announced that despite the increase in the number of cases of omicron, strict quarantine will not be introduced in the country, at least until Christmas. If Boris Johnson were a patriarch, he would never introduce a "lockdown" at all, since he hurts the UK economy (like any other country). However, there is still a Parliament, and many deputies in it believe that tightening quarantine measures is vital. The fact is that omicron may not be as dangerous as other strains, but it is much more contagious. More people get sick with it and in absolute terms, there may be even more hospitalizations than from Delta. However, Boris Johnson is already afraid to talk about "lockdown", since last winter, just at Christmas, a "lockdown" was already introduced in Britain, and recently it became known that during it Boris Johnson and about 50 other members of Parliament had fun at a government party. The second factor (technical) suggests that the pair bounced from a very strong Fibonacci level of 38.2% - 1.3162 on a 24-hour timeframe. Thus, the probability of at least a corrective movement was very strong, as we discussed in the last week's articles. And the British currency still does not have fundamental growth factors. Analysis of the COT report.
During the last reporting week (December 13-17), the mood of professional traders was much more "bearish". Professional traders closed 6.7 thousand contracts for sale and 20.1 thousand contracts for purchase during the week. Thus, the net position for the "Non-commercial" group of traders decreased by 13.4 thousand contracts, which is a lot for the pound. Thus, unlike the euro currency, the pound sterling, according to COT reports, continues to fall quite reasonably: major players continue to sell it. However, the green and red lines of the first indicator (which mean the net positions of the "Non-commercial" and "Commercial" groups) have already moved far away from each other. Recall that such a deletion signals the imminent end of the trend. However, as with any fundamental assumptions, specific technical signals are required to work out this hypothesis, which is not currently available. If we do not take into account the increase in the key rate by the Bank of England, then there are no special fundamental reasons for the growth of the pound now either. Recall that Boris Johnson continues to get into various scandals in the UK and there is already talk that he will leave his post before the end of the deadline. The pandemic in the UK is gaining momentum and the other day an anti-record was set for the daily number of infections. Omicron is also spreading quite rapidly across the country, creating additional risks for the healthcare system and the economy. London, on the other hand, cannot find a common language with Paris and Brussels, which threatens it with the deterioration of relations with its closest neighbors and the loss of markets for the sale of products. The new COT report was not released on Friday. We expect it at the beginning of the new week. Analysis of fundamental events. In the UK, a report on GDP for the third quarter was released this week, which turned out to be weaker than forecasts. And in the US, a report on GDP for the third quarter was released, which turned out to be stronger than forecasts. Therefore, it would be more logical for the dollar to rise, and not vice versa. The US also released an indicator of consumer confidence for December, which also grew stronger than expected. Orders for durable goods are better than forecasts. The consumer sentiment index from the University of Michigan is better than forecasts. The change in the levels of spending and income of the American population is at the level of forecasts. It turns out that all the statistics from overseas were strong. But the euro/dollar has been standing still all week, and the pound/dollar has been growing. Therefore, there was no reaction to these not the most important reports. Trading plan for the week of December 27-31: 1) The pound/dollar pair maintains a downward trend, although the price has fixed above the critical line this week. Therefore, purchases can now begin to be considered slowly. As we said earlier, the pound sterling may well rise in price by 400-500 points in the coming weeks. Moreover, it did not react too much to the festive status of the last days. The nearest target is the Senkou Span B line. 2) The bears let the initiative out of their hands this week. Now it will be possible to consider selling the pair again no earlier than fixing the pair below the Kijun-sen line. And even in this case, you need to be careful with the level of 1.3162, from which prices bounced at least 4 times. Explanations to the illustrations: Price levels of support and resistance (resistance /support), Fibonacci levels - target levels when opening purchases or sales. Take Profit levels can be placed near them. Ichimoku indicators (standard settings), Bollinger Bands (standard settings), MACD (5, 34, 5). Indicator 1 on the COT charts - the net position size of each category of traders. Indicator 2 on the COT charts - the net position size for the "Non-commercial" group. The material has been provided by InstaForex Company - www.instaforex.com |
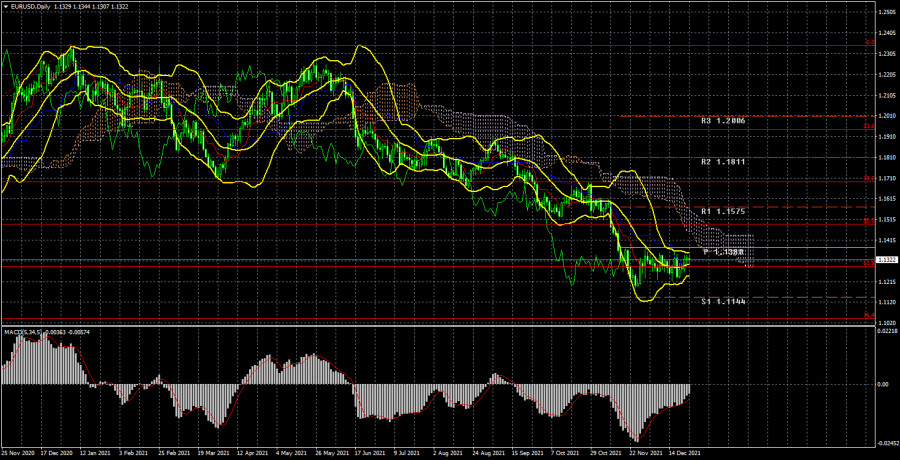
| Posted: 25 Dec 2021 01:03 AM PST EUR/USD analysis on daily chart
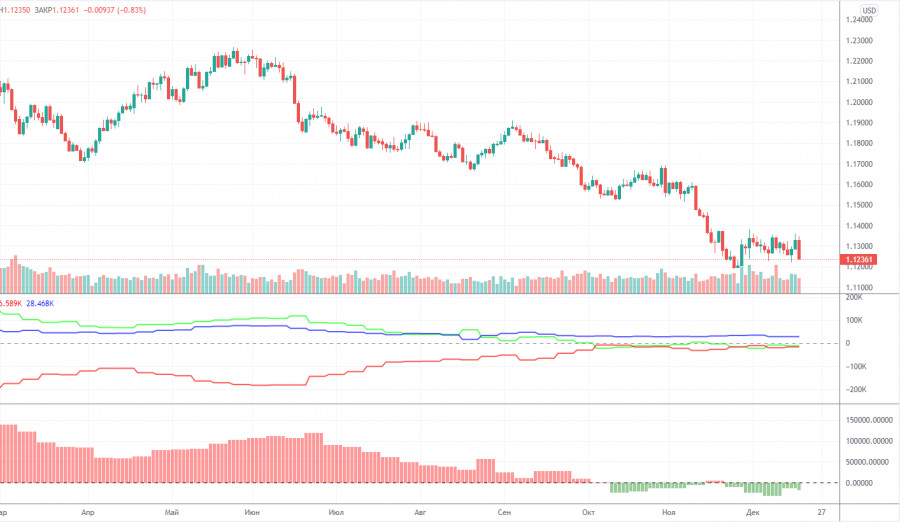
The EUR/USD pair continued to remain inside the sideways channel during the current week. This can be seen on the chart above. In general, the technical picture has not changed for a month. All this time EUR/USD has been trading near 61.8% Fibonacci - 1.1288, in the 120 pips wide sideways channel. Thus, even the formal breakout of the critical line does not play any role now, for it is not the price that has consolidated above the important line, but the line itself has fallen below the price. This is a fundamental difference. Therefore, it is impossible to make a conclusion about the beginning of correction now. Moreover, if this week the pair's sideways movement was justified, as there was no macroeconomic statistics and fundamental background, then during the previous three weeks the pair was moving in the flat exclusively on its initiative. As a result, the current downtrend persists and at any moment it may resume its downward movement. Bulls show lack of activity week after week, so it is unclear what to expect from the euro now. There was not a single interesting event in the EU or the US this week. The market was discussing the new strain of Omicron during the week, which continues to spread at a high rate in both EU countries and the US. However, Joe Biden has already said that he is going to fight the new strain solely with vaccination and revaccination, and there is no talk of shutting down the economy for a lockdown. In the European Union, several countries have imposed lockdowns, but most counties do not intend to do so. Yesterday, it also became known that Omicron strain leads to hospitalizations 2-3 times less often than Delta strain. This news eased tensions in the market. COT report analysis
During the last reporting week (December 7 - 13), the mood of non-commercial traders became slightly more bearish. The "Non-commercial" group of traders now has more short positions open than long ones, but this difference is not significant. The difference is only 18,000 contracts, which is not much. During the reporting week professional traders closed 7,200 buy contracts and 2,800 sell contracts. Thus, the net position of professional players decreased by 4,000. However, the main thing is that the green and red lines of the first indicator (indicating the change in the net positions of the "Non-commercial" and "Commercial" groups) have been near the zero level for a long time, as well as close to each other. That is, in the last few months, when the euro continued to fall against the US dollar, the big players stopped opening short positions. Thus, the question arises, why was the euro falling at all, if the market participants didn't sell it out? Perhaps, global factors, like the change of the balance between the money supply in the EU and the US, interfere with the rate-making process. We can only conclude from the COT reports that the bearish sentiment is minimal and has not increased in recent months. Nonetheless, given the fundamental background, the decline in the euro might continue. The technical picture does not give any reasons to assume that the decline of the euro is over. Big players' sentiment remains bearish and bulls do not intend to change anything. The new COT report was not released on Friday due to the Christmas holiday. Fundamental data analysisThere is almost a complete absence of fundamental data this week. Notably, nothing influenced the traders' sentiment or the trend of the EUR/USD pair. However, even a week before the results of the ECB and Fed meetings were summed up, the pair remained in the same sideways channel. So, the pair is flat now and there is nothing we can do about it and hardly anything will change next New Year's week. Trading plan for December 27 - 31:1) On the daily chart the trend remains downward. However, the movement itself in recent weeks is flat. So, the downside movement may continue at any moment with the support levels of 1.1144 and 1.1038 (76.4% Fibonacci), but most likely, it may happen next year. The general fundamental background at the moment supports a further drop of the euro and growth of the US dollar. The only hope for the euro is that all the growth factors of the US dollar have already impacted the market. 2) As for the long positions in the euro/dollar pair, traders should refrain from opening them before the price fixes above the Ichimoku cloud, because the price has already broken through the Kijun-sen several times, but then could not continue to move up. There are no prerequisites for a new uptrend to start shortly. Descriptions to charts:Price levels of support and resistance (resistance/support), Fibonacci levels, which are target levels for the opening of purchases or sales. Take-profit orders may be placed near them. Indicators Ichimoku cloud (standard settings), Bollinger Bands (standard settings), MACD (5, 34, 5). Indicator 1 on the COT charts - the size of the net position of each group of traders. Indicator 2 on the COT charts - the size of the net position for the "Non-commercial" group. The material has been provided by InstaForex Company - www.instaforex.com |
| Posted: 24 Dec 2021 01:18 PM PST Analysis of Friday's deals: 30M chart of the GBP/USD pair.
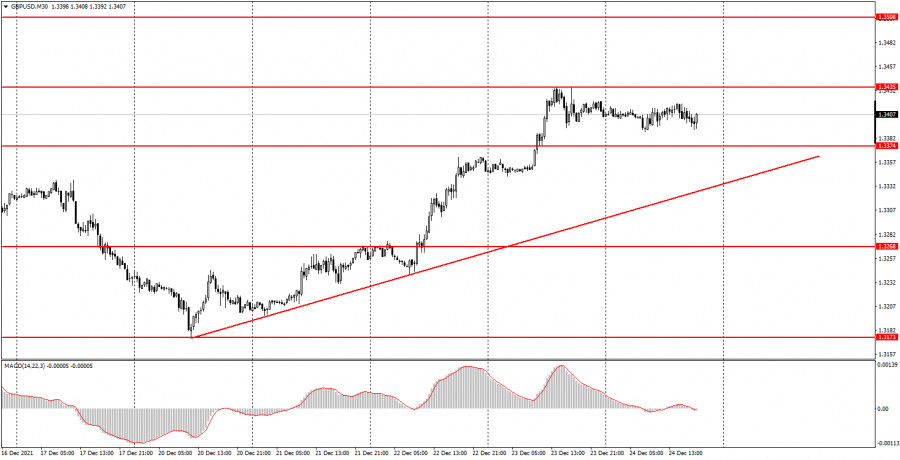
The GBP/USD pair continued its upward movement on Friday after leaving the side channel. However, if in the last few days the movement of the pair was trending and even strong, then on Friday it was the opposite. In principle, there were no compelling fundamental or macroeconomic reasons for the strong growth of the British currency this week. Thus, we believe that they are purely technical. But today, the pound traders also took a day off in honor of Christmas. Thus, the price has been moving exclusively sideways all day, but at the same time maintaining an upward trend. The ascending trend line currently supports traders to increase and it is impractical to consider short positions before fixing below it. There was not a single important macroeconomic report or fundamental event on Friday. The volatility was 30 points. 5M chart of the GBP/USD pair. On the 5-minute timeframe, the movement of the pound/dollar pair on Friday was even more eloquent. The price moved exclusively sideways in a very narrow side channel. Volatility dropped due to Friday's semi-holiday status. But it doesn't matter to us why volatility has fallen. It is important that no trading signal was formed today, which means that novice traders should not have entered the market. The price did not even approach any of the important levels today. Therefore, there is nothing to analyze. How to trade on Monday: At this time, an upward trend is maintained on the 30-minute timeframe. The pound may continue to grow against the dollar at the end of the year and next week. On the 5-minute timeframe, the important levels are 1.3342, 1.3366, 1.3435, 1.3470. We recommend trading them on Monday. From them, the price can bounce or overcome. As before, we set Take Profit at a distance of 40-50 points. On the 5TH TF, you can use all the nearest levels as targets, but then you need to fix the profit, taking into account the strength of the movement. When passing 20 points in the right direction, we recommend setting the Stop Loss to breakeven. On December 27, not a single interesting report will be published in the UK and America. Also, not a single important event is planned. Therefore, volatility may remain low. Basic rules of the trading system: 1) The strength of the signal is calculated by the time it took to generate the signal (rebound or overcome the level). The less time it took, the stronger the signal. 2) If two or more trades were opened near a certain level on false signals (which did not trigger Take Profit or work out the nearest target level), then all subsequent signals from this level should be ignored. 3) In a flat, any pair can form a lot of false signals or not form them at all. But in any case, at the first signs of a flat, it is better to stop trading. 4) Trade deals are opened in the period between the beginning of the European session and the middle of the American session when all transactions must be closed manually. 5) On a 30-minute TF, signals from the MACD indicator can be traded only if there is good volatility and a trend, which is confirmed by a trend line or a trend channel. 6) If two levels are located too close to each other (from 5 to 15 points), then they should be considered as a support or resistance area. What's on the chart: Price support and resistance levels - target levels when opening purchases or sales. Take Profit levels can be placed near them. Red lines - channels or trend lines that display the current trend and show in which direction it is preferable to trade now. MACD indicator - a histogram and a signal line, the intersection of which are signals to enter the market. It is recommended to use it in combination with trend constructions (channels, trend lines). Important speeches and reports (always contained in the news calendar) can greatly influence the movement of a currency pair. Therefore, during their exit, it is recommended to trade as carefully as possible or exit the market to avoid a sharp price reversal against the previous movement. Beginners in the Forex market should remember that every trade cannot be profitable. The development of a clear strategy and money management is the key to success in trading over a long period. The material has been provided by InstaForex Company - www.instaforex.com |
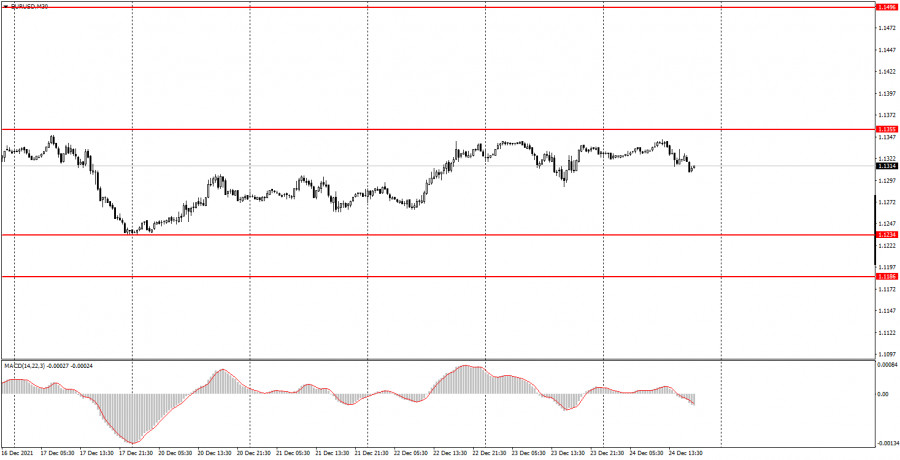
| Posted: 24 Dec 2021 01:18 PM PST Analysis of Friday's deals: 30M chart of the EUR/USD pair.
The EUR/USD currency pair continued to stay inside the side channel on Friday, between the levels of 1.1234 and 1.1355. It has remained within its limits for a month, so every time, every day on a 30-minute timeframe, nothing new can be added – the pair continues to stay inside the flat every day. During today's trading session, the pair's quotes even showed a slight movement, although we thought there would be no movement at all. The market closes earlier today than usual, Christmas will be celebrated tomorrow in the Catholic style, and today was a pre-holiday and semi-holiday day. Thus, the volatility of 40 points looks ultra-high today. Needless to say, there was not a single important macroeconomic report or fundamental event during Friday? Needless to say, there was not a single trading signal on the current TF? The pair finished the current week almost perfectly, because on Monday there was a rebound from the level of 1.1234 (the lower limit of the side channel), and on Friday the price was near the upper limit. 5M chart of the EUR/USD pair. On the 5-minute timeframe, the pair's movements on Friday were as neutral and fresh as possible. The movements were also weak, so it was not necessary to count on a large number of trading signals. They did not exist at all, although in the middle of the European trading session the price approached the distance of 3 points to the level of 1.1348 and could have rebounded from it, but still did not do it. Thus, not a single trading signal was formed during the day. Next week, the pair may continue to stay inside the side channel, and it may still be very tense with signals. How to trade on Monday: On the 30-minute timeframe, the euro/dollar pair continues to be in the side channel 1.1234-1.1355. The price rose from the lower to the upper limit, and if a rebound from 1.1355 followed, then the probability of a new fall to 1.1234 would be very high. It is already available, but still, there was no clear signal to sell. On the 5-minute timeframe, the key levels for December 27 are 1.1262, 1.1290, 1.1348-1.1355, 1.1422. Take Profit, as before, we set at a distance of 30-40 points. Stop Loss - breakeven when the price passes in the right direction by 15 points. At 5M TF, the target can be the nearest level, if it is not located too close or too far away. If it is located– then you should act on the situation or work on Take Profit. There are no important events or reports scheduled for Monday in the European Union and America. Thus, novice traders will again have nothing to turn their attention to during the day. Basic rules of the trading system: 1) The strength of the signal is calculated by the time it took to generate the signal (rebound or overcome the level). The less time it took, the stronger the signal. 2) If two or more trades were opened near a certain level on false signals (which did not trigger Take Profit or work out the nearest target level), then all subsequent signals from this level should be ignored. 3) In a flat, any pair can form a lot of false signals or not form them at all. But in any case, at the first signs of a flat, it is better to stop trading. 4) Trade deals are opened in the period between the beginning of the European session and the middle of the American session when all transactions must be closed manually. 5) On a 30-minute TF, signals from the MACD indicator can be traded only if there is good volatility and a trend, which is confirmed by a trend line or a trend channel. 6) If two levels are located too close to each other (from 5 to 15 points), then they should be considered as a support or resistance area. What's on the charts: Price support and resistance levels - target levels when opening purchases or sales. Take Profit levels can be placed near them. Red lines - channels or trend lines that display the current trend and show in which direction it is preferable to trade now. MACD indicator (14, 22, 3) - a histogram and a signal line, the intersection of which are signals to enter the market. It is recommended to use it in combination with trend constructions (channels, trend lines). Important speeches and reports (always contained in the news calendar) can greatly influence the movement of a currency pair. Therefore, during their exit, it is recommended to trade as carefully as possible or exit the market to avoid a sharp price reversal against the previous movement. Beginners in the Forex market should remember that every trade cannot be profitable. The development of a clear strategy and money management is the key to success in trading over a long period. The material has been provided by InstaForex Company - www.instaforex.com |
| Analysis of GBP/USD on December 24 Posted: 24 Dec 2021 01:18 PM PST
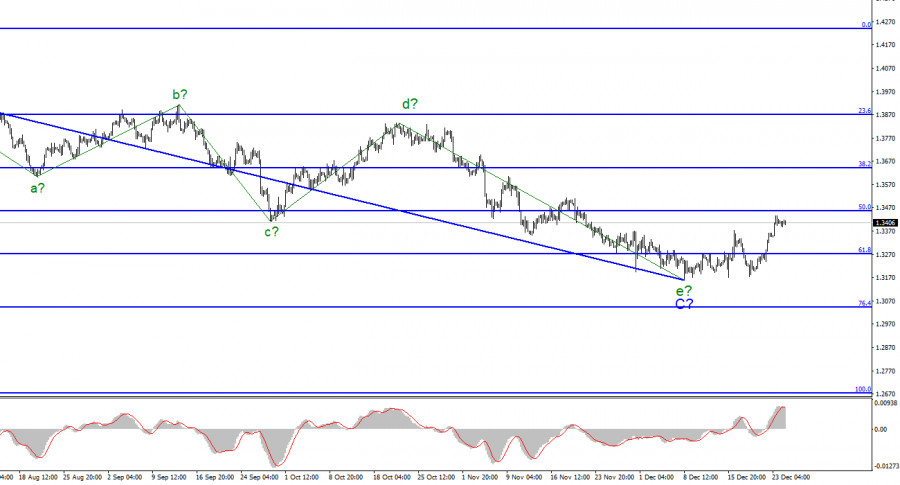
For the pound/dollar instrument, the wave markup continues to look quite convincing. The increase in quotes in the last few days suggests that the construction of wave D has begun after all. Also, the current increase in quotes can be interpreted as the first wave of a new upward trend segment. A three-wave structure is already visible inside this wave. If this is Wave D, then this may be the end of it for the Briton. If not, then the increase of the instrument will continue with the targets located around 36 and 38 figures. A successful attempt to break through the 50.0% Fibonacci level will indicate the readiness of the markets for further purchases, but the wave can still be interpreted as D. The instrument continues to move with the help of corrective structures, so at any moment the downward trend section may take a more complex form. Moreover, it is also possible to build a new downward wave for the euro. Omicron leads to hospitalizations much less often than Delta. The exchange rate of the pound/dollar instrument moved with an amplitude of 15 basis points during Friday. Thus, both instruments on Friday were already on weekends and holidays. As I have already said, Christmas will be celebrated all over the world tomorrow, so already today many banks and institutions were closed, and most of the market participants left ahead of schedule for the weekend. However, the Briton at the end of the year still managed to show that not everything is hopeless for it. Just like a European, next year, it may try to start building a new upward trend section. However, if the news background remains as weak as it is now, then another global downward wave is likely to be built. However, the British news background is still not as weak as the European. Let me remind you that the Bank of England did raise the interest rate in December, thus giving rise to the process of tightening monetary policy. If this action does not remain the only one in the coming months, then the pound will still have a chance to increase. The latest news on Omicron in the UK also gives reason to assume that everything will be fine. The first studies by the UK Health Safety Agency have shown that this strain causes hospitalizations in patients 50-70% less often than the Delta strain. Similar data came the other day from South Africa, Denmark, and Scotland. But at the same time, this strain is much more contagious than Delta, so the total number of hospitalizations may be the same as Delta or even higher. Everything will now depend on how fast the number of daily infections will grow. General conclusions. The wave pattern of the pound/dollar instrument looks quite convincing now. The supposed wave e could complete its construction. Thus, now I would advise buying a tool with targets located near the estimated mark of 1.3457, which corresponds to 50.0% Fibonacci, for each MACD signal "up". A successful attempt to break through this mark – and purchases can be saved with a target of 1.3641.
Senior schedule. Starting from January 6, the construction of a downward trend section continues, which can turn out to be almost any size and any length. At this time, the proposed wave C may be nearing its completion (or completed). However, the entire downward section of the trend may lengthen and take the five-wave form A-B-C-D-E. The material has been provided by InstaForex Company - www.instaforex.com |
| Posted: 24 Dec 2021 01:18 PM PST
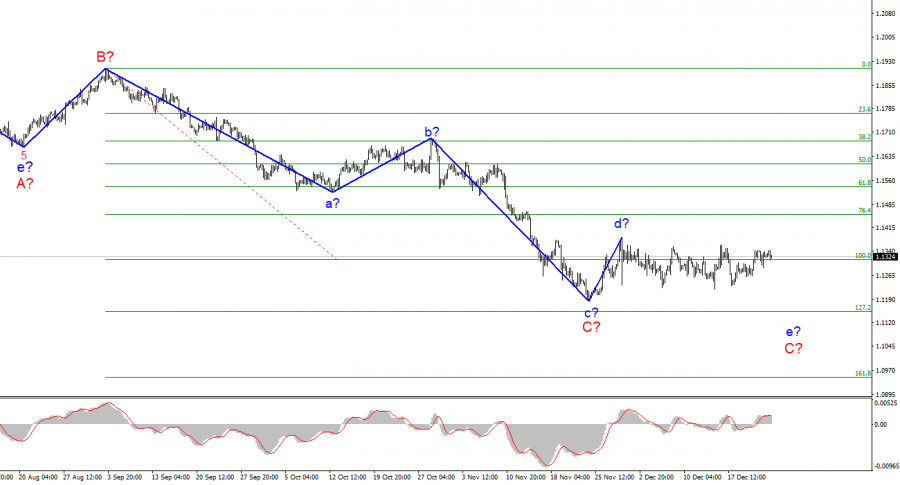
The wave marking of the 4-hour chart for the euro/dollar instrument continues to remain integral and does not require additions. The construction of a descending wave e-C is still questionable since the current wave takes a very extended, horizontal form. If the descending wave does not continue its construction, then wave C will have to be recognized as three-wave and completed, although I believe that it should still take a five-wave form. The wave that originates on November 30 cannot be attributed now either to wave C or to the first wave of a new upward trend segment if this is it since neither the peak of wave d-C nor the low of wave c-C have been broken over the past few weeks. In the current situation, we can only wait for the situation to develop. Given that the holidays are slowly beginning, the current wave may take on an even longer form. And now it makes no sense to understand its internal waves since this structure can turn out to be almost any length. Christmas week continues. There was no news background for the EUR/USD instrument on Friday and could not have been, since Christmas will be celebrated all over the world tomorrow, and the day before this holiday, many exchanges and commercial structures no longer work with banks. Thus, an amplitude equal to 15 base points on Friday should not confuse anyone. And as a result, the instrument ends in 2021 around its annual low. Since the current wave marking still allows us to assume the completion of the downward trend segment, in any case, all the hopes of the euro currency are transferred to the next year. It's hard for me to even imagine what could make the market suddenly start actively buying the euro currency this year. There will be almost no news and reports next week either. In the next year, at first, the hopes of the euro will consist only in wave marking, which we assume at least the construction of an upward wave D. However, the entire downward section of the trend can take the form A-B-C-D-E. That is, another downward wave can be built. And if the news background for the euro continues to remain so weak, then, most likely, this is exactly what will happen. General conclusions. Based on the analysis, I conclude that the construction of the descending wave C can be completed. However, the internal wave structure of this wave still allows the construction of another downward, internal wave. Thus, I advise selling the instrument with targets located around the 1.1152 mark, for each MACD signal "down", until there is a successful attempt to break the peak of wave d. New sales should not be opened on each signal. It is better to place a restrictive order above the peak of wave d once.
Senior schedule. The wave marking of the higher scale looks quite convincing. The decline in quotes continues and now the downward section of the trend, which originates on May 25, takes the form of a three-wave correction structure A-B-C. Thus, the decline may continue for several more weeks until wave C is fully completed (it should take a five-wave form in this case). The material has been provided by InstaForex Company - www.instaforex.com |
| Elon Musk: Bitcoin is a means for the ric Posted: 24 Dec 2021 01:18 PM PST
Elon Musk spoke very ambiguously about bitcoin, thereby supporting his favorite cryptocurrency dogecoin. Musk believes that Bitcoin has become a financial tool for rich gentlemen, and Dogecoin is a popular cryptocurrency that is available to everyone with convenient and simple transactions. The tech king responded in his trademark style to former Twitter CEO Jack Dorsey, as always, with his caustic phrase. Musk wrote that Bitcoin gives power to new rich people, and he also agrees with the creator and father of dogecoin, Billy Marcus, that Dogecoin is a means for everyone on this planet. This month, Tesla has already made ambiguous hints, and the company also announced that dogecoin will be added as a payment method for branded merchandise from the giant corporation. After that, Elon Musk and the company will look at the outcome, and as a result, they will make decisions about whether they will add dogecoin as payment for cars. Musk believes that Bitcoin is an accumulative means for accumulating and saving one's income, as well as a means of power. Dogecoin is an everyday coin for everyone. In a recent interview with Time magazine, Elon Musk stated that dogecoin dominates Bitcoin, and it is also much closer to the people and easier to use, it is much better adapted for conducting transactions. Musk noticed that the transaction value of bitcoin continues to be high, although the volume of daily transactions is significantly reduced. He says Bitcoin will never be a 100% great replacement for fiat. Dogecoin, being created as a humorous meme, becomes a truly popular means of payment. Musk also noted that although dogecoin is essentially a cryptocurrency that is not adapted for storage, but encourages investors to spend money, all indicators and on-chain indicators show that investors prefer to keep dogecoin for a long time rather than spend it. Elon Musk is sure that Dogecoin has a lot of advantages over the dollar since fiat can be subject to huge inflation. He may also be dependent on the government, whatever it may be. Dogecoin remains the same people's currency, no matter who will be at the helm, Democrats or Republicans, but the dollar is in great doubt. The material has been provided by InstaForex Company - www.instaforex.com |
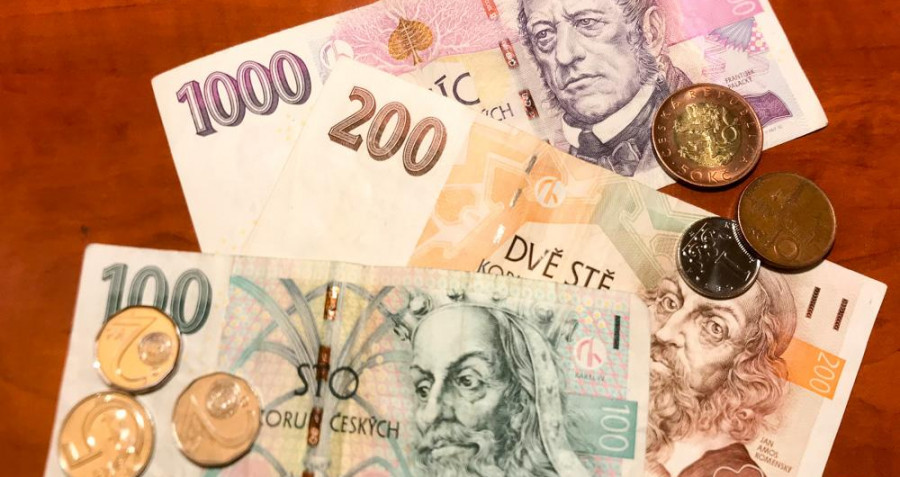
| Posted: 24 Dec 2021 01:18 PM PST The Czech koruna paired with the euro strengthened in holiday trading on Friday to its highest level since February 2020, adding weight after the central bank raised interest rates for the third time in a row this week. Czech crown shows highs
Recall that the local exchange is not working on the eve of Christmas. The koruna is trading 0.4% higher at 25.00 against the euro at 14:36 GMT. The currency briefly broke through the psychological support level of 25 euros for the first time since the coronavirus pandemic hit the markets in early 2020. The koruna was the most profitable currency in Central Europe in 2021 with an increase of 4.9%, which once again confirms the thesis about the benefits of the early introduction of rate hikes by the Central Bank. The exchange rate rose 0.9% after the Czech National Bank surprised the markets on Wednesday by raising the rate by 100 basis points more than expected and said it was ready to strengthen its influence even more to contain the growth of inflation. The bank's main discount rate now stands at 3.75%, the highest level since February 2008. This is 300 basis points higher than the rate just three months ago. The material has been provided by InstaForex Company - www.instaforex.com |
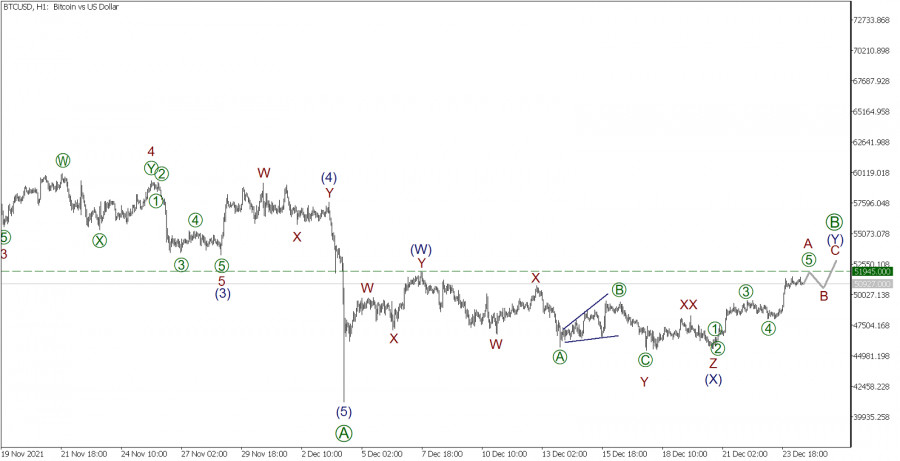
| BTC/USD on December 24. Bitcoin is approaching the previous maximum Posted: 24 Dec 2021 01:18 PM PST The main news from the world of cryptocurrencies: Regulatory clarity and an influx of institutional capital are needed to continue the growth of the cryptocurrency market, and 2022 "promises to be interesting for the industry." This opinion was expressed by a partner of The Spartan Group under the nickname SpartanBlack. According to his observations, many holders of cryptocurrencies recorded profits after each strong upward price movement. Therefore, there was no FOMO and parabolic movement of quotes, as in the previous three phases of the bull market. Another notable factor is the increase in institutional capital. According to SpartanBlack, whales have become more disciplined in terms of profit-taking and risk/leverage management. On the other hand, institutions actively entered the market during periods of corrections. In his opinion, 2022 promises to be interesting for the world of cryptocurrencies. Among the potential future risks, he noted: an increase in interest rates (by central banks); an increase in geopolitical tensions; a deterioration in the situation with COVID-19. We continue to consider Bitcoin from the point of view of Elliott's theory on an hourly timeframe. BTCUSD H1:
For the BTCUSD cryptocurrency pair, the internal structure of the downward trend is presented, which hints at a simple zigzag (A)-(B)-(C). In early December, the market completed a decline within the wave (A), which took the form of a five-wave pulse. From the beginning of December to the present day, we have been observing the construction of a correction wave (B), which has a horizontal structure and, most likely, takes the form of a double-triple (W)-(X)-(Y). Now we are in the active wave (Y), more precisely in its first part - the subwave A. Wave A is like a simple pulse (1)-(2)-(3)-(4)-(5). It is assumed that the last fifth of the A pulse will be completed at 51945.00. The current wave (W) was completed earlier at this level. An approximate scheme of possible future movement is shown on the graph. In the current situation, it is possible to consider opening transactions for purchases, to take profit at the end of impulse A. The material has been provided by InstaForex Company - www.instaforex.com |


| You are subscribed to email updates from Forex analysis review. To stop receiving these emails, you may unsubscribe now. | Email delivery powered by Google |
| Google, 1600 Amphitheatre Parkway, Mountain View, CA 94043, United States | |


Comments