Forex analysis review
Forex analysis review |
- December 24, 2021 : EUR/USD daily technical review and trading opportunities.
- December 24, 2021 : EUR/USD Intraday technical analysis and trading plan.
- December 24, 2021 : GBP/USD Intraday technical analysis and significant key-levels.
- Video market update for December 24,,2021
- EUR/USD analysis for December 24, 2021 - Watch for breakout or rejection
- BTC analysis for December 24,.2021 - Watch for potential pullback play
- Analysis of Gold for December 24,.2021 - Watch for price action around $1.815
- EUR/USD: The dollar will take its toll
- Bitcoin growth forecast worked out; Additional prerequisites for bullish momentum
- Wave analysis of EUR/USD on December 24, 2021
- GBP/USD Forecast and COT report for December 24, 2021
- EUR/USD Forecast and COT report for December 24, 2021
- Technical analysis of EUR/USD for December 24, 2021
- Technical analysis of GBP/USD for December 24, 2021
- Analysis of GBP/USD for December 23. UK reports more than 100K new virus cases
- Trading signals for Ethereum (ETH/USD) on December 24 - 27, 2021: buy above $4,000 (21 SMA)
- Bitcoin reverses downtrend with bullish breakthrough of resistance at $50,000
- Technical analysis recommendations of EUR/USD and GBP/USD on December 24, 2021
- Trading plan for Bitcoin for December 24, 2021
- Gold and silver owners will not be distressed in the next decade
- Trading plan for EURUSD for December 24, 2021
- US SEC rejects Valkyrie and Kryptoin bitcoin trusts
- Analysis and forecast of AUD/USD on December 24, 2021
- EUR/USD analysis and outlook for December 24, 2021
- Canada's domestic production of resources grows for the sixth month in a row
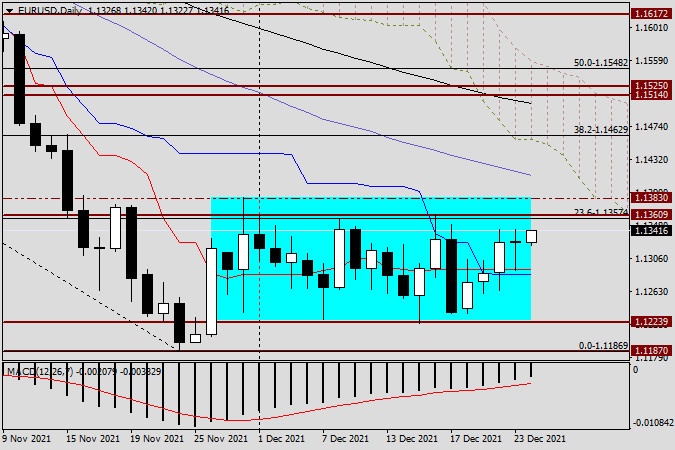
| December 24, 2021 : EUR/USD daily technical review and trading opportunities. Posted: 24 Dec 2021 08:45 AM PST
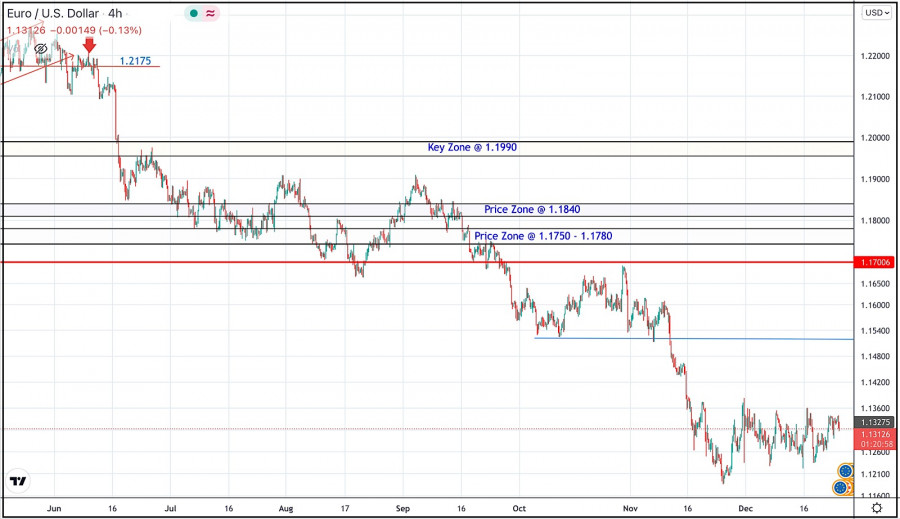
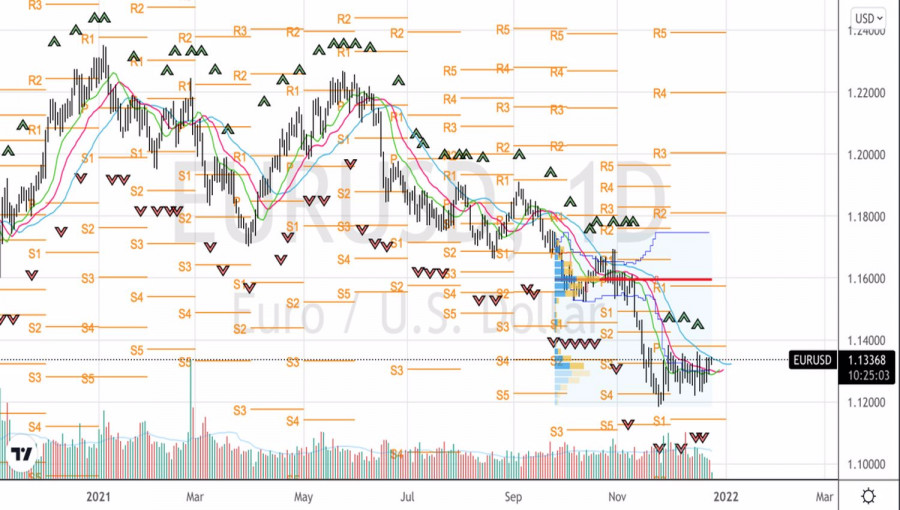
During the past few weeks, the EURUSD pair has been trapped within a consolidation range between the price levels of 1.1700 and 1.1900. In late September, Re-closure below the price level of 1.1700 has initiated another downside movement towards 1.1540. Price levels around 1.1700 managed to hold prices for a short period of time before another price decline towards 1.1200. Currently, the price zone around 1.1500 stands as a prominent supply-zone to be watched for SELLING pressure and a possible SELL Entry upon any upcoming ascending movement. Moreover, it is not advised to add new SELL Entries as the pair already looks oversold. The material has been provided by InstaForex Company - www.instaforex.com |
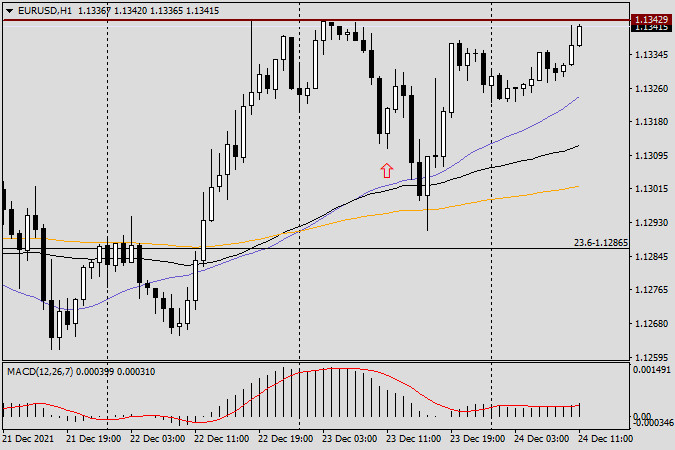
| December 24, 2021 : EUR/USD Intraday technical analysis and trading plan. Posted: 24 Dec 2021 08:44 AM PST
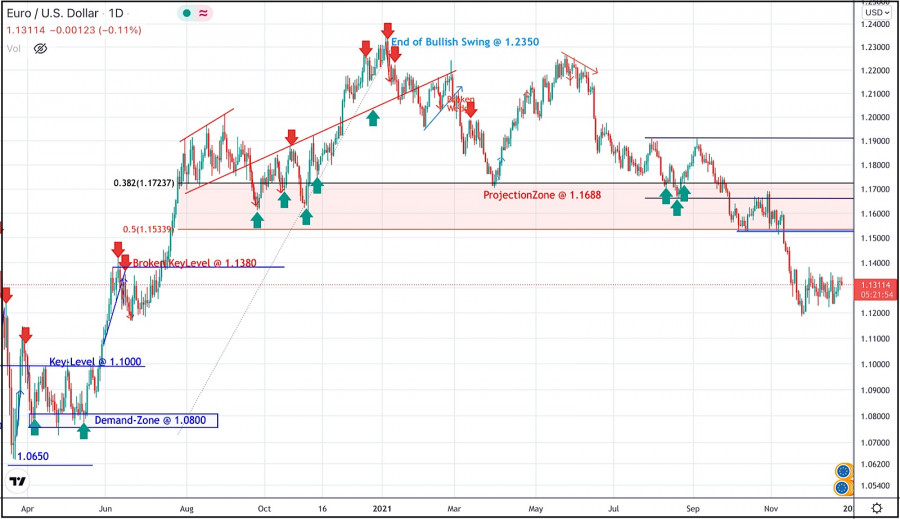
The bullish swing that originated around 1.1650 in August, failed to push higher than the price level of 1.1900. That's why, another bearish pullback towards 1.1650 was executed. However, extensive bearish decline has pushed the EURUSD pair towards 1.1600 and lower levels was reached. Shortly after, significant bullish recovery has originated upon testing the price level of 1.1570. The recent bullish pullback towards 1.1650-1.1680 was expected to offer bearish rejection and a valid SELL Entry. Significant bearish decline brought the EURUSD pair again towards 1.1550 levels which stood as an Intraday Support zone. Hence, sideway movement was demonstrated until quick bearish decline occurred towards 1.1200. Please note that any bullish movement above 1.1500 should be considered as an early exit signal to offset any SELL trades. The price levels around 1.1520 remain a reference zone that needs to be re-visited when the current bearish momentum ceases to exist. The material has been provided by InstaForex Company - www.instaforex.com |
| December 24, 2021 : GBP/USD Intraday technical analysis and significant key-levels. Posted: 24 Dec 2021 08:43 AM PST
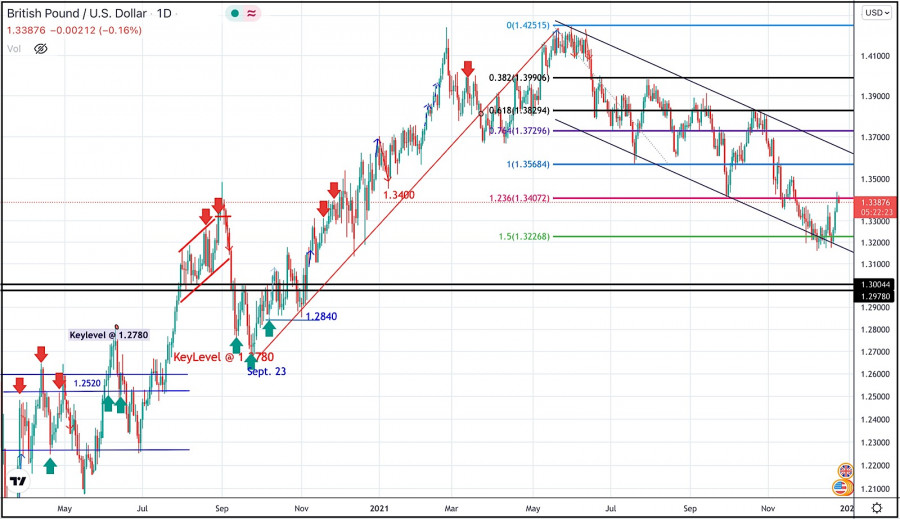
The GBPUSD pair has been moving sideways with some bearish tendency while bearish breakout below 1.3600 was needed to enhance further bearish decline. Bearish breakout below 1.3680 enabled further bearish decline towards 1.3400 which corresponded to 123% Fibonacci Level of the most recent bearish movement. This was a good entry level for a corrective bullish pullback towards 1.3650 and 1.3720 which was temporarily bypassed. Shortly after, the pair was testing the resistance zone around 1.3830 where bearish pressure originiated into the market. Currently, the intermediate-term outlook remains bearish as long as the pair maintains its movement within the depicted channel below 1.3400. More bearish extension was expected towards 1.3220 where the lower limit of the current movement channel came to meet with Fibonacci level. However, Conservative traders should be looking for BUY trades around these price levels after significant bullish recovery has originated around 1.3220. That's why, the price levels around 1.3220 constituted a valid Entry Point for BUYERS with projected targets around 1.3570 and 1.3600. On the other hand, the price level of 1.3570 stands as a key-resistance to be watched either for bearish reversal or a continuation pattern upon any upcoming visit. The material has been provided by InstaForex Company - www.instaforex.com |
| Video market update for December 24,,2021 Posted: 24 Dec 2021 08:32 AM PST Watch for breakout.... The material has been provided by InstaForex Company - www.instaforex.com |
| EUR/USD analysis for December 24, 2021 - Watch for breakout or rejection Posted: 24 Dec 2021 08:29 AM PST Technical analysis:
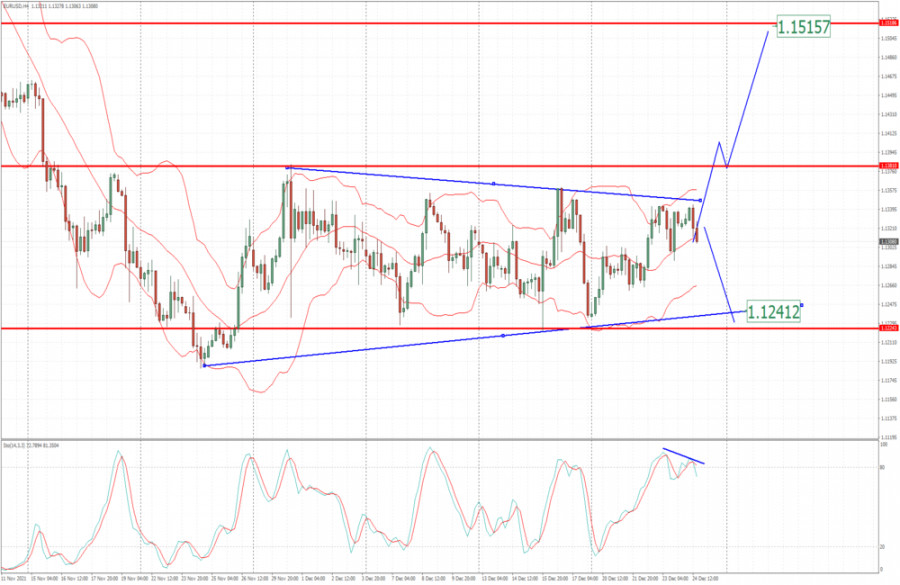
EUR/USD has been trading inside of the bigger sideways range. I see potential for downside rotation based on the current condition. Trading recommendation: Since the EUR is inside bigger sideways regime, watch for potential breakout of rejection of the upper extreme. Upside breakout of 1,1380 can lead us towards 1,1515 Stochastic oscillator is showing bear divergence and overbought condition. The material has been provided by InstaForex Company - www.instaforex.com |
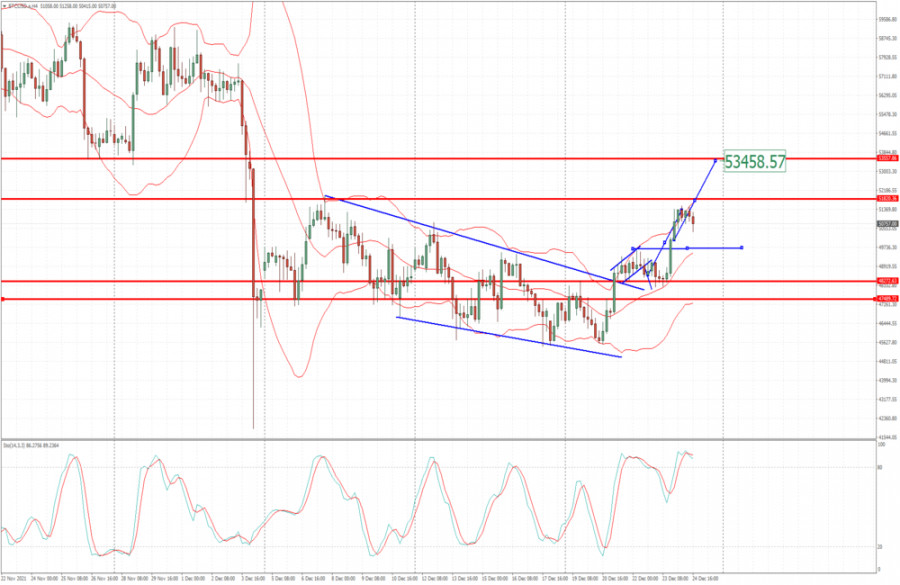
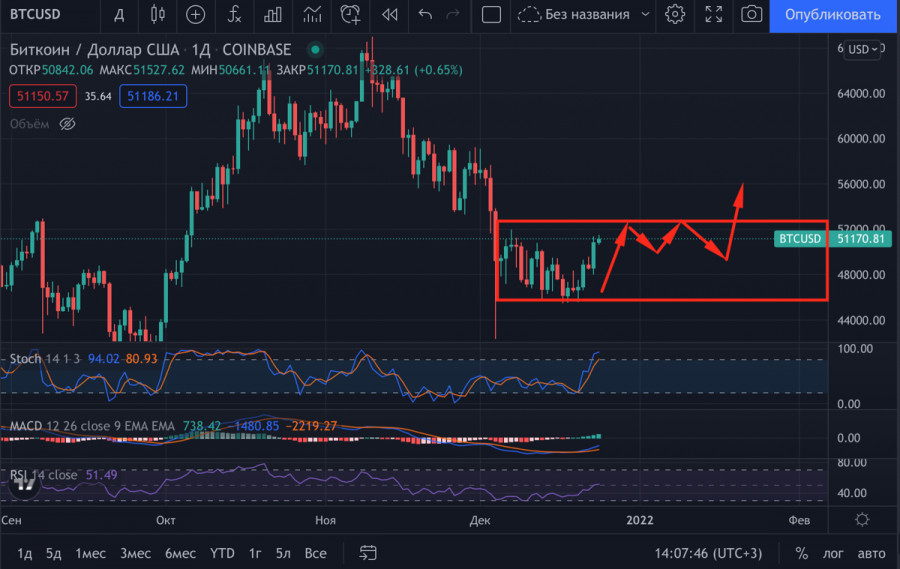
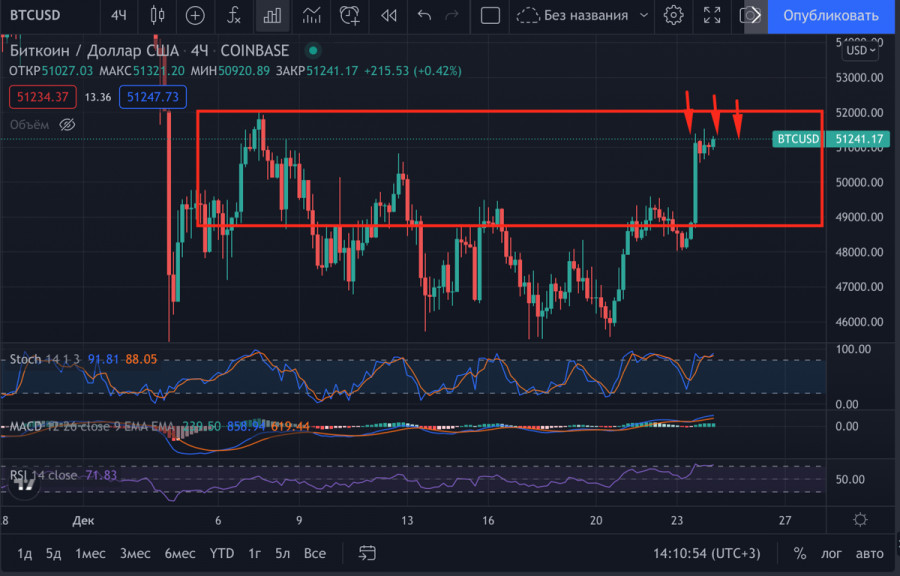
| BTC analysis for December 24,.2021 - Watch for potential pullback play Posted: 24 Dec 2021 08:02 AM PST Technical analysis:
BTCUSD has been treading upside after the pullback as we expected. I see potential for further rise and potential test of $53,450 Trading recommendation: Due to strong upside momentum in the background, I see potential for further rise. My advice is to watch for buying opportunities on the pullbacks with the upside target at $53,458 Stochastic is in overbought area so BTC might need correction before another upside cycle. Key support is set at the price of $48,000 The material has been provided by InstaForex Company - www.instaforex.com |
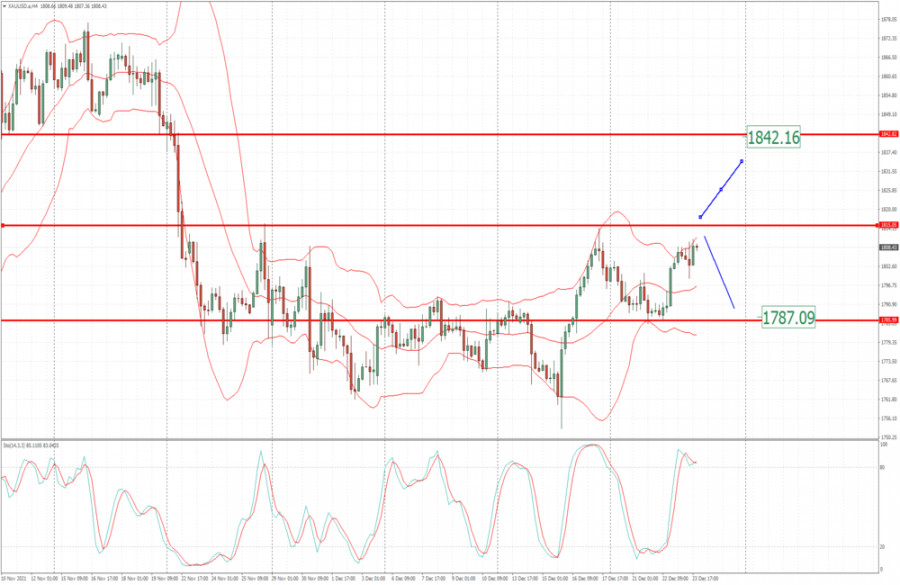
| Analysis of Gold for December 24,.2021 - Watch for price action around $1.815 Posted: 24 Dec 2021 07:43 AM PST Technical analysis:
Gold has been trading sideways at the price of $1,808 but there is important pivot point at $1,815. Trading recommendation: If you see thee aggressive breakout of the pivot at $1,815, watch for potential buying opportunities on the pullbacks with potential target at $1,842 If you see see rejection of the $1,815, watch for downside opportunities on the rallies with the downside objective at $1,787 The material has been provided by InstaForex Company - www.instaforex.com |
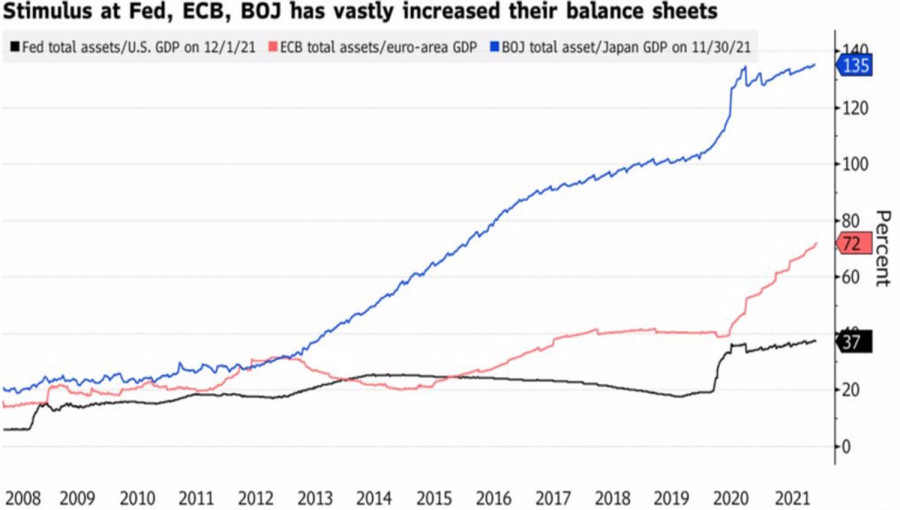
| EUR/USD: The dollar will take its toll Posted: 24 Dec 2021 07:37 AM PST The Santa Claus rally on the U.S. stock market, which allowed the S&P 500 to reach its 68th historical high in 2021, increased risk appetite and contributed to the worst weekly result of the U.S. dollar since September, should not deceive anyone. At the end of the year, investors close positions, fix profits. They got tired of monetary policy and turned their attention to stock indices. At the beginning of 2022, everything should return to normal. It is obvious that Omicron, the Fed's intention to accelerate the normalization of monetary policy, as well as problems with the passage of a new $1.75 trillion fiscal stimulus package from Joe Biden will lead to a slowdown in U.S. GDP from 7% to 2-3% in the first quarter. It is unlikely that this will stop the Federal Reserve, which needs to fight the highest inflation in almost four decades. FOMC forecasts provide for 3 acts of monetary restriction in 2022, QE will become history in March. The eurozone economy is even weaker than the U.S., and the ECB is mired in deflationary thinking. They fear the repetition of when colossal monetary stimulus does not help the Central Bank of Japan to bring consumer prices back to the 2% target. Hence the reluctance to part with the quantitative easing program, and the firm belief that rates in 2022 will remain at the same levels. The faster growth of the balance of the European regulator in comparison with the U.S. unequivocally hints that the downtrend in EURUSD is likely to continue. Central bank balance sheet dynamics
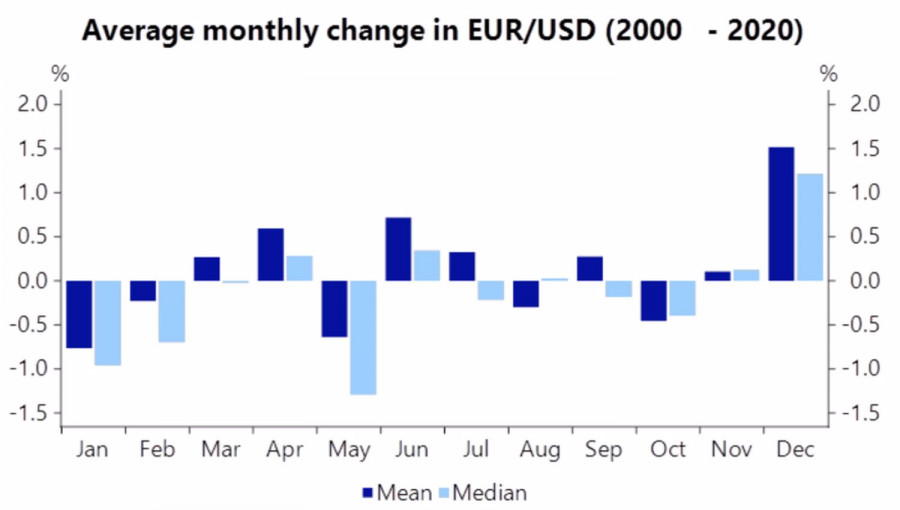
The U.S. dollar will also benefit from an earlier increase in the federal funds rate than is currently predicted by the derivatives market. The CME derivatives issued June as the most likely date for the first act of monetary restriction, but some FOMC hawks are ready to take action in March. If inflation in the U.S. accelerates to 7%, other representatives of the Central Bank will join their number. At the end of December, the EURUSD bulls were supported by a seasonal factor: the last month of the year, as a rule, is favorable for the euro and U.S. stock indices. In contrast, the S&P 500 falls more often than it rallies in January, and the U.S. dollar feels more than confident amid worsening global risk appetite. EURUSD dynamics in different months of the year
The rally of U.S. stock indices is facilitated by the positive statistics for the United States, indicating that the economy is strong. However, if it is firmly on its feet, and inflation is significantly higher than the target, why not raise rates? If it is strong, why is there any fear that tightening monetary policy will significantly slow down GDP? I believe that at the beginning of 2022, investors will realize the absurdity of such concerns and will return to buying the U.S. dollar. Technically, the formation of an inverted "Splash and Shelf" pattern on the daily timeframe of EURUSD indicates that traders have the opportunity to open positions both to buy on the breakout of the upper border of the consolidation range ("shelf") 1.1225–1.1355, and to sell in case of a successful storming of the support at 1.1225. EURUSD, Daily chart
|
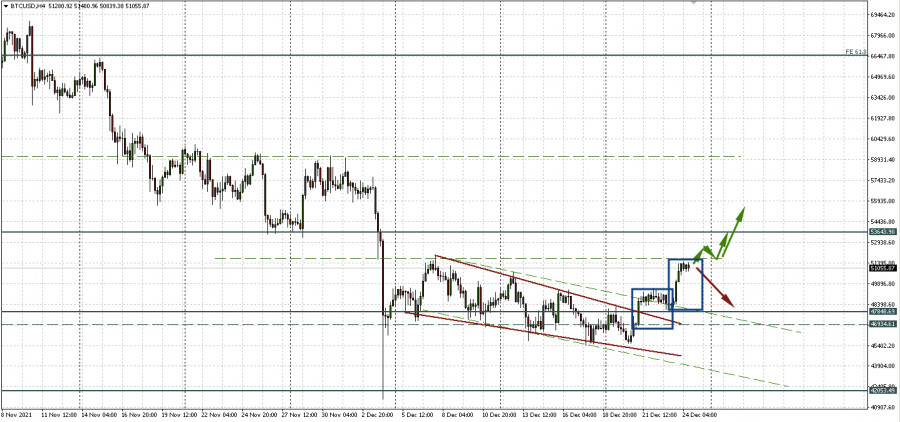
| Bitcoin growth forecast worked out; Additional prerequisites for bullish momentum Posted: 24 Dec 2021 07:14 AM PST Bitcoin swiftly and very skillfully worked out Wednesday and Thursday's forecast. After the downtrend resistance line (green slanted dotted line) and the horizontal level of 47,848.69 were very nicely confirmed by the pullback as support, the price painted the second flag, reaching local resistance 51,697.58 (green horizontal dotted line). After such a beautiful triggering of technical analysis (everything is like a textbook!), We will immediately assess what further scenarios may be. Now the consolidation below the level of 51,697.58 within the framework of drawing the flag canvas may continue. And then either a reversal and a decline to the level of 47,848.69, or a breakdown of the current border of 51,697.58 and an increase to the next target of 53,643.90. The accumulation of Bitcoins continuesThis has been previously reported by Glassnode . Similar data was published Friday by on-chain analytics firm CryptoQuant. Overall, they said, the trend towards the net accumulation of bitcoins continues. According to CryptoQuant, the main cryptocurrency miners remain bullish on the bitcoin price. Their inventory balance has so far reached a six-month high. An article from CryptoQuant analyst Venturefounder mentioned miners now have more bitcoins than when the main cryptocurrency was trading at an all-time high of $69,000. The article also stated that since July this year, miners have been buying more to build up reserves. Accumulation is similar to the September story: should we expect a new upward impulse?The CryptoQuant report also revealed that Bitcoin is now facing a second accumulation period. Recently, about 3,700 Bitcoins have been transferred from centralized crypto exchanges. The author of the report emphasizes that these data are similar to the level of accumulation in September. Then after that, the price of BTCUSD rose by about 70% from a low of $41,000. Does this mean that a similar price impulse can occur now? Bitcoin whales sell some of their coinsAdditional data from CryptoQuant shows the Exchange Whale Ratio data hit an annual high above 0.65. This means that the whales are dumping some of their bitcoins. Until the major cryptocurrency surpasses the $51,000 level, the report says traders need to be on the lookout. Once the $51,000 bar is hit, another major resistance will occur in the $56,800 area. The same is indicated by the technical analysis data, although my forecast speaks of two levels: in the area of 56,000 and 59,000 per bitcoin.
|
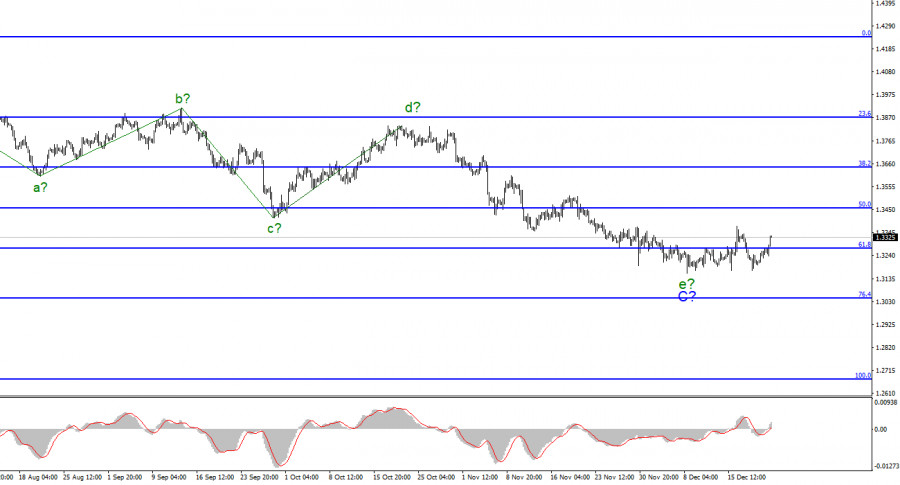
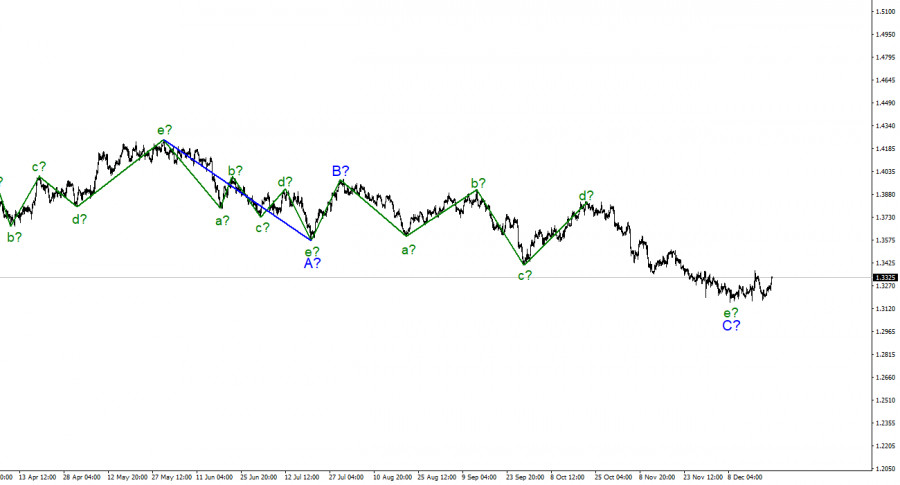
| Wave analysis of EUR/USD on December 24, 2021 Posted: 24 Dec 2021 06:59 AM PST EURUSD, H4:
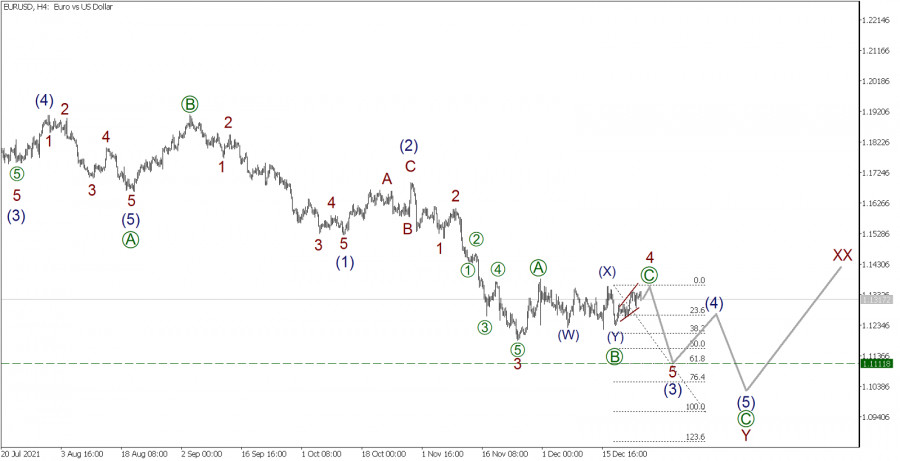
For the EURUSD currency pair, we see a major downward trend. There is an assumption that a triple zigzag is being built, which will consist of subwaves W-X-Y-XX-Z. A downward active wave Y is currently under development, which is assuming the form of a zigzag, consisting of three main subwaves [A]-[B]-[C]. The first impulse wave [A] was completed at the end of August, then the price increased slightly in the corrective wave [B]. Since the beginning of September, the market began to move downward within the impulse wave [C]. At the current time, only the first two parts of wave [C] have been fully completed - subwaves (1)-(2). The subwave (3) in the form of an impulse is in the development stage. Most likely, correction 4 is being formed in wave (3). Perhaps, for the full completion of this correction, subwave [Y] is needed, which may soon come to an end, approximately at the level of 1.1415. After reaching the specified level and full completion of correction 4, the market will begin to move down in wave 5. The value of wave 5 can be 61.8% of wave 3 along the Fibonacci lines from impulse 3. In the current situation, it is possible to consider opening buy deals in order to take profit at the end of wave 4. The material has been provided by InstaForex Company - www.instaforex.com |
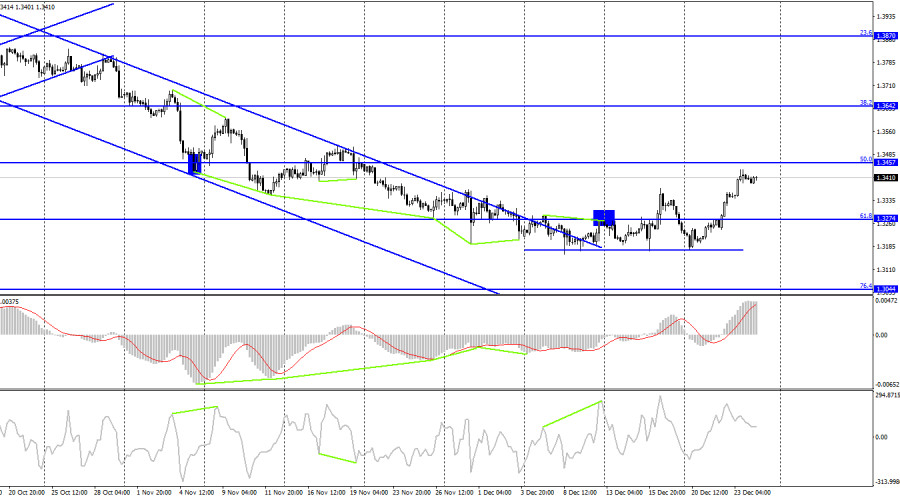
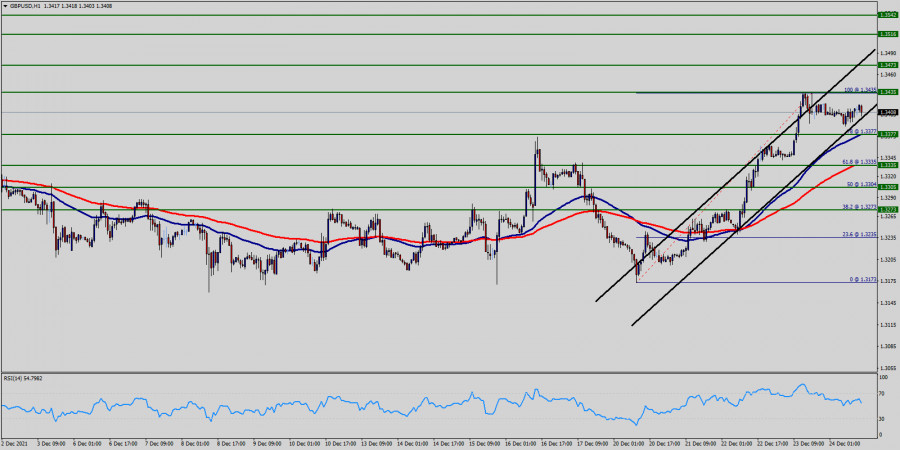
| GBP/USD Forecast and COT report for December 24, 2021 Posted: 24 Dec 2021 06:41 AM PST GBP/USD, H1
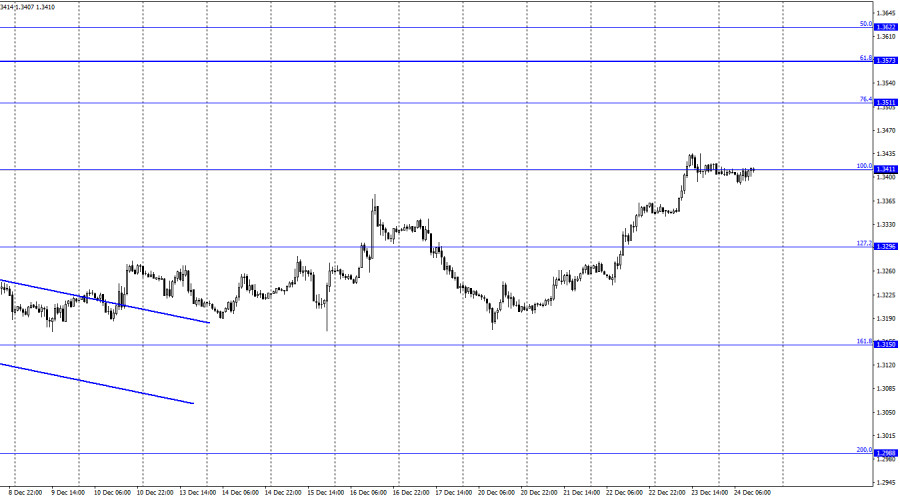
On the hourly chart, the GBP/USD pair continued its growth on Thursday and at the end of the day was near the correction level of 100.0% - 1.3411. There was no rebound from this level, but there was no consolidation above it either. Thus, on Friday, when most financial institutions and banks are closed, and most traders have already left the market and are preparing for Christmas, no one expects a strong movement from the pound-dollar pair. There is no information background today, and it will be absent throughout the next week. Thus, the British pound made the final leap at the end of the year upwards, but this leap could be caused by graphical factors. In other words, we saw a pretty strong correction. After all, if you go to the higher timeframes, the downward trend is clearly visible there. And all the growth in recent days is really just a correction. I do not think that any reasons for the growth of the pound should be sought now. It could rise in price due to the fact that there will be no lockdown in the U.K. But it will not yet be in the United States and in many countries of the European Union. The pound could not get traders' support based on this factor. But the pound sterling is burdened with political and geopolitical problems. In the past two weeks, attention was somehow more focused on the meetings of the Fed and the Bank of England, but negotiations with the European Union and France faded into the background. However, they have not ended with anything, but only put on pause, since the Christmas and New Year weeks are not the best time for new negotiations. Perhaps the pound rose even in the absence of a negative information background. But in recent weeks, nothing has changed so much so that it suddenly starts to rise in tandem with the U.S. dollar. Thus, I believe that the growth will not be sustained. GBP/USD, H4
On the 4-hour chart, the pair consolidated above 1.3274, the 61.8% retracement level. Thus, the growth process can be continued in the direction of 1.3457, the 50.0% Fibo level. A rebound of quotes from the level of 50.0% will work in favor of the U.S. currency and the beginning of the fall, and consolidation above this level will increase the chances of continued growth in the direction of 1.3642, the 38.2% retracement level. However, all these movements may occur as early as next week. None of the indicators show any maturing divergences. U.S. and U.K. News Calendar: Both the U.K. and U.S. Economic Calendars are blank on Friday. The information background today will not have any impact on the mood of the traders who remain on the market. COT Report (Commitments of traders):
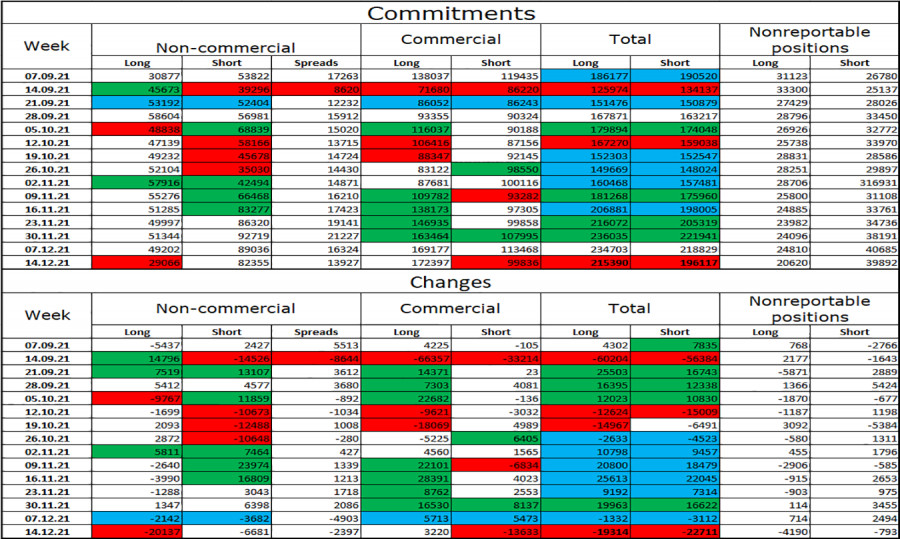
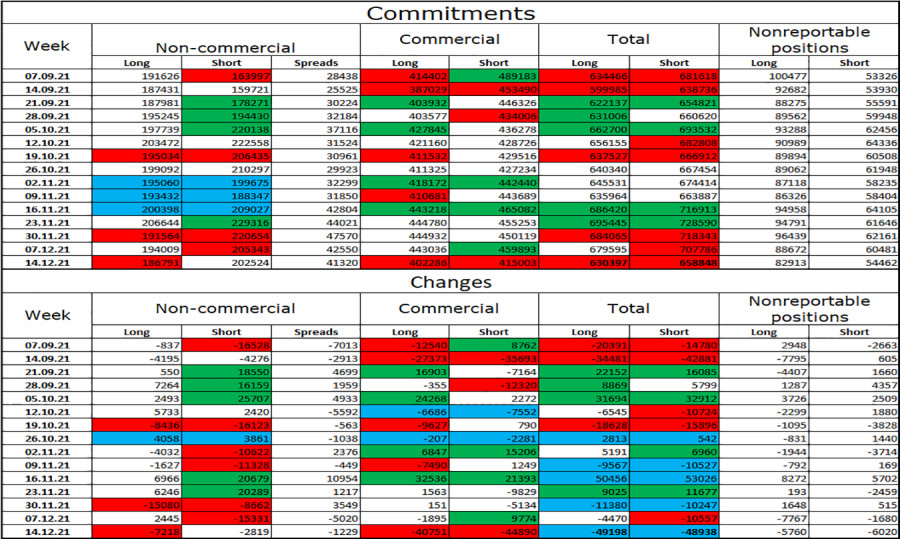
The latest COT report from December 14 in the U.K. showed that the mood of major players has changed dramatically. To be more precise, it became much more "bearish," since the "Non-commercial" category closed 20,000 Long contracts at once. The trend of strengthening the "bearish" mood has been observed for two months. In the reporting week, speculators also closed 6,681 Short contracts. The total number of Short contracts in the "Non-commercial" category of traders is now more than twice as high as the number of Long contracts: 82,000 versus 29,000. Thus, at the end of the next week and the next COT report, I cannot conclude that the situation for the British pound has improved a little. It can still continue the process of falling. Forecast for GBP/USD and recommendations for traders:I recommended buying the British pound in case of a rebound on the hourly chart from the level of 1.3171 with targets at 1.3296 and 1.3411. Closing did not take place above the level of 1.3411, so you can exit from purchases. I do not recommend opening sales yet - the British pound has grown too strong in recent days, and today the pair is unlikely to show at least some movement. TERMS:"Non-commercial" - major market players: banks, hedge funds, investment funds, private, large investors. "Commercial" - commercial enterprises, firms, banks, corporations, companies that buy currency not to obtain speculative profit, but to ensure current activities or export-import operations. "Nonreportable positions" - small traders who do not have a significant impact on the price. The material has been provided by InstaForex Company - www.instaforex.com |
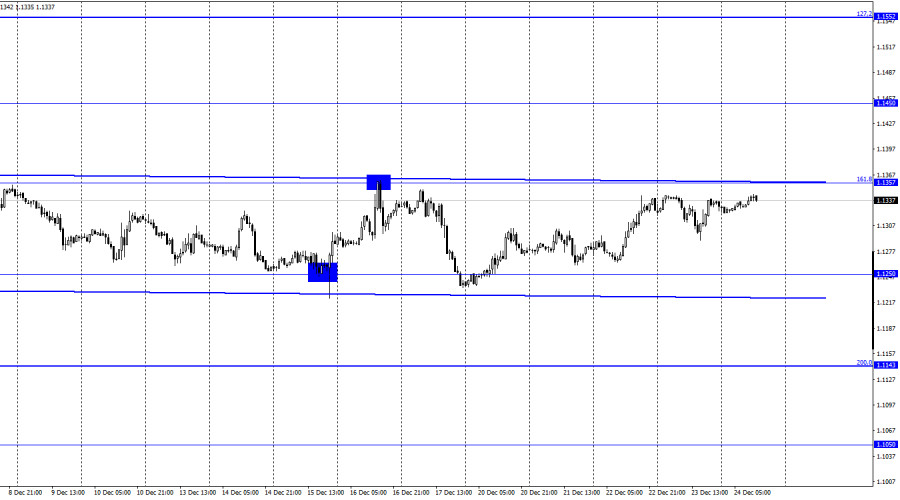
| EUR/USD Forecast and COT report for December 24, 2021 Posted: 24 Dec 2021 06:18 AM PST EUR/USD, H1
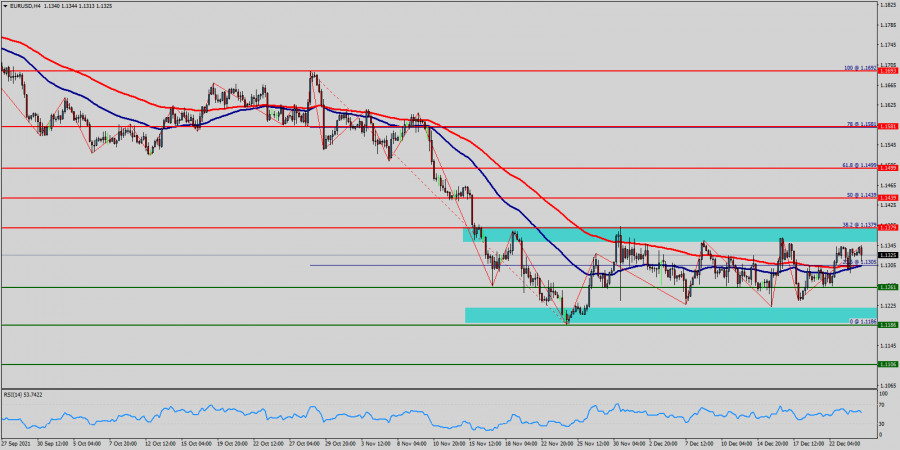
The EUR/USD pair slightly fell inside the sideways channel and then rose at the same volume on Thursday. At the moment, it continues to trade near the upper border of the sideways channel, which practically coincides with the correction level of 161.8% - 1.1357. A rebound of quotes from this level or line will work in favor of the U.S. currency and some fall towards the level of 1.1250 and the lower border of the corridor. Consolidation of price above the channel will work in favor of continued growth towards the next level of 1.1450. However, today I definitely do not expect the pair to consolidate above the corridor. And even more so below. Traders' activity is at zero, and the market will be closed a few hours earlier in light of the celebration of Christmas day. It is already clear that traders have already left the market, and most banks and financial institutions are closed today. Thus, traders are most likely just waiting for the end of the Christmas week and are not going to make any gestures. Probably, it is not worth saying that the economic calendar does not contain a single interesting entry on Friday. Yesterday, the information background was expressed by several reports in the U.S., which also did not have a strong influence on the mood of traders. The omicron strain continues to gain momentum in the European Union and the United States and this is the only topic that is currently being discussed. However, the euro-dollar pair has been in a sideways channel for a month now, so I conclude that traders are not worried about the omicron, the new wave of coronavirus and the possible consequences of this. Next week the activity of traders may increase slightly, as today it is practically at zero. At the same time, the next week is New Year's, and one cannot expect much from it either. There is not a single interesting entry in the calendars of the European Union and the United States during the said week. EUR/USD, H4
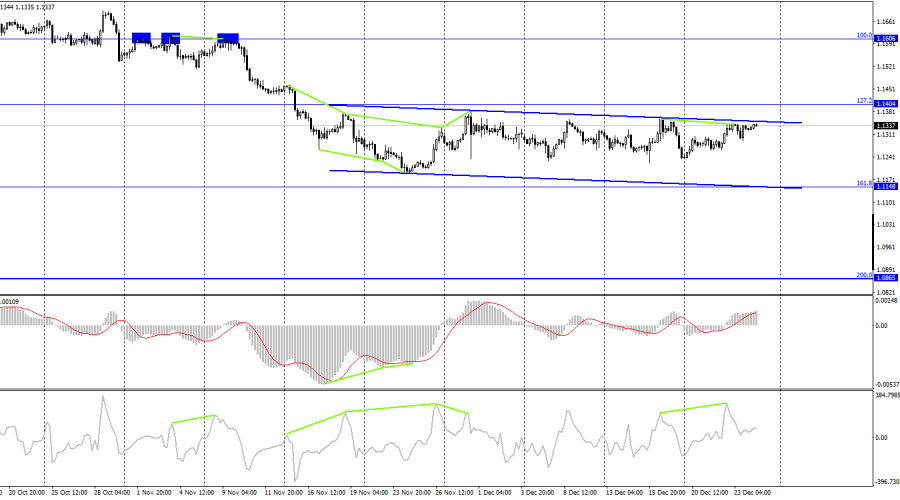
On the 4-hour chart, the pair has completed the rally towards the upper border of the downward trend channel, which can just as well be called sideways. The bearish divergence formed by the CCI indicator allows us to expect a reversal in favor of the U.S. currency and a slight fall in the direction of the correction level of 161.8% - 1.1148. The situation on the hourly chart is almost identical. The closure of the pair above the corridor will allow us to expect further growth of the euro in the direction of the 100.0% Fibo level - 1.1606. News calendar for the United States and the European Union: December 24: the calendar of economic events in the European Union and the United States is completely empty. Thus, today I do not expect that the information background will have any effect on the mood of traders. COT Report (Commitments of traders):
The latest COT report showed that the sentiment of the "Non-commercial" traders category became more "bearish" during the reporting week. The speculators got rid of both Longs and Shorts. In total, 7,218 Long contracts and 2,819 Short contracts in the euro currency were closed. Thus, the total number of Long contracts in the hands of speculators decreased to 186,000, and the total number of Short contracts, to 202,000. Moderately bearish sentiment continues for the most important category of traders. The most interesting changes were observed among traders of the "Commercial" category, who closed 40,000–45,000 contracts of both types. In total, about 100,000 contracts for the euro currency were closed during the reporting week. Forecast for EUR/USD and recommendations for traders:Selling will be possible in case of a rebound from the 1.1357 level on the hourly chart with the target at 1.1250. I recommended buying the euro when the rebound from the level of 1.1250 with the target of 1.1357. I recommend new purchases if the pair closes above the sideways channel on the hourly chart with the target at 1.1450. Terms:"Non-commercial" - major market players: banks, hedge funds, investment funds, private, large investors. "Commercial" - commercial enterprises, firms, banks, corporations, companies that buy currency not to obtain speculative profit, but to ensure current activities or export-import operations. "Nonreportable positions" - small traders who do not have a significant impact on the price. The material has been provided by InstaForex Company - www.instaforex.com |
| Technical analysis of EUR/USD for December 24, 2021 Posted: 24 Dec 2021 05:54 AM PST
The EUR/USD pair broke resistance which turned to strong support at the level of 1.1261 yesterday. The level of 1.1379 coincides with a golden ratio (38.6% of Fibonacci) - resistance 1, which is expected to act as major resistance today. If the trend is able to break out through the first resistance level at 1.1379, we should see the pair climbing towards the double top (1.1379) to test it. Therefore, buy above the level of 1.1261 with the first target at 1.1379 in order to test the daily resistance 2 and further to 1.1439. Also, it might be noted that the level of 1.1439 is a good place to take profit because it will form a new double top. On the other hand, in case a reversal takes place and the EUR/USD pair breaks through the support level of 1.1261, a further decline to 1.1186 can occur which would indicate a bearish market. Accordingly, the pair is still in the uptrend from the area of 1.1186 and 1.1261. The EUR/USD pair is trading in a bullish trend from the first resistance line of 1.1379 towards the first resistance (2) level at 1.1439 in order to test it. Thus, the market is indicating a bullish opportunity above the above-mentioned support levels, for that the bullish outlook remains the same as long as the 100 EMA is headed to the upside. At the same time, if a breakout happens at the support levels of 1.1261 and 1.1186, then this scenario may be invalidated. But in overall, we still prefer the bullish scenario. The material has been provided by InstaForex Company - www.instaforex.com |
| Technical analysis of GBP/USD for December 24, 2021 Posted: 24 Dec 2021 05:46 AM PST
The GBP/USD pair will continue to rise from the level of 1.3335. The support is found at the level of 1.3335, which represents the 61.8% Fibonacci retracement level in the H1 time frame. The price is likely to form a double bottom. Today, the major support is seen at 1.3335, while immediate resistance is seen at 1.3473. Accordingly, the GBP/USD pair is showing signs of strength following a breakout of a high at 1.3400. So, buy above the level of 1.3400 with the first target at 1.3435 in order to test the daily resistance 1 and move further to 1.3473. Also, the level of 1.3516 is a good place to take profit because it will form a double top. Amid the previous events, the pair is still in an uptrend; for that we expect the GBP/USD pair to climb from 1.3400 to 1.3516 today. At the same time, in case a reversal takes place and the GBP/USD pair breaks through the support level of 1.3400, a further decline to 1.3272 can occur, which would indicate a bearish market. The material has been provided by InstaForex Company - www.instaforex.com |
| Analysis of GBP/USD for December 23. UK reports more than 100K new virus cases Posted: 24 Dec 2021 05:42 AM PST
According to the wave analysis of the pound/dollar pair, we see that wave D started its formation. The current rise in the pair could be considered the first wave of a new upward section of the trend. Thus, inside this wave, we can see three waves. If it is wave D, the British pound is likely to stop gaining in value. If it is not, the pound sterling may continue climbing to targets located near patterns 36 and 38. If the price successfully breaks the 50.0% Fibonacci levels, this will prove that traders are ready to go on buying the asset. Notably, in any moment, the downward part of the trend may become even more complicated. A new coronavirus wave has swept over the UK. On Thursday, the pound/dollar pair advanced by another 100 pips. In the last four days, the asset has gained 250 pips. Taking into account that the news flow was rather weak, the reasons for the rise are not strong. It is quite possible that there is an upward wave in the structure of the downward trend. Although the pound sterling continues gaining in value, news about the UK epidemiological situation is rather gloomy. The number of new virus cases is rising almost every day. On Wednesday, December 22, for the first time since the beginning of the pandemic, more than 100,000 cases were recorded in one day. In addition, 140 people died. Although almost 90% of the country's population received at least one dose of the vaccine and 82% received both doses, we see such figures at the end of 2021. A government group of scientists announced that by the end of the month, the number of infections could jump to 600,000 per day. Doctors believe that the government should immediately take measures to stop the virus spread. It is also reported that vaccination will not be able to stop the increase in the number of new cases. Those who received two or three doses may catch the virus. Notably, vaccinated people do not suffer as those who refused to receive their doses. However, the number of vaccinated people does not affect the pace of the Omicron spread in any way. If scientists are right and the country sees 600,000 a day, it will mean that within a month the entire population of the United Kingdom may catch the new strain. It is hard to imagine what consequences the UK may face if these predictions come true. Conclusion Wave e might have completed its formation. That is why I recommend buying the asset with the targets near 1.3457, that is the 50.0% Fibonacci level. Even if wave D is under formation, the pound/dollar is able to hit the level of 1.3457. If the price breaks the mentioned level, the next target could be located at 1.3641. |
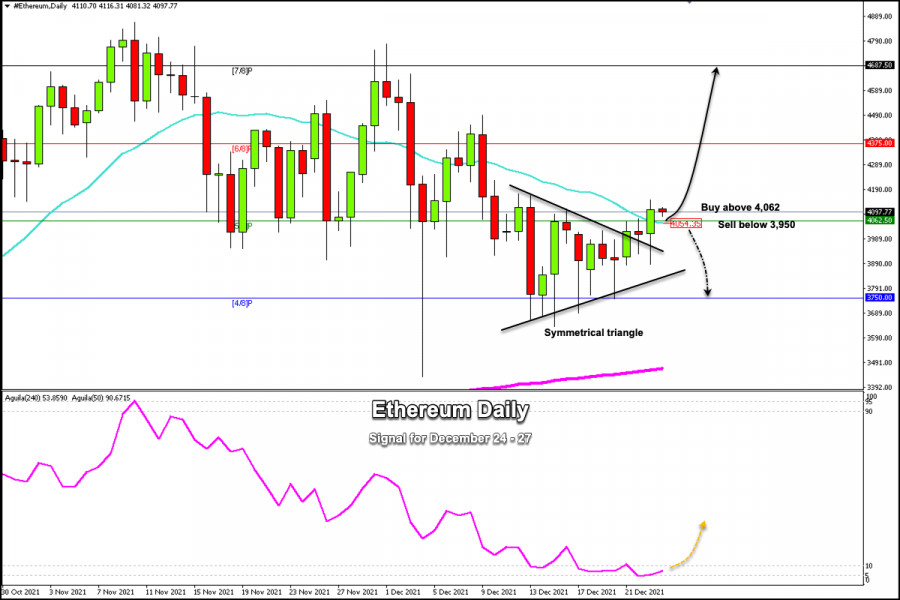
| Trading signals for Ethereum (ETH/USD) on December 24 - 27, 2021: buy above $4,000 (21 SMA) Posted: 24 Dec 2021 05:19 AM PST
The price of Ethereum (ETH) has started to consolidate above the 21 SMA on daily charts. As long as it remains above this psychological level of 4,000, it could gain momentum and reach the resistance of 6/8 Murray at 4,375. The price of Ethereum has seen a sharp drop so far this month. After establishing a series of tests at the 4/8 Murray support around 3,750, it is now rebounding, and the outlook may be positive for the next few days. Ethereum market sentiment is bullish for today as we expect it to consolidate above 4,062. There may be a bullish sequence that could go as high as 4,687. Therefore, ETH/USD should be heading to test more highs, with the closest resistance at 4,375 (6/8). On the daily chart, we can see that the price of Ether has formed a symmetrical triangle pattern. Yesterday, a breakout confirmed the upward potential that may exist in the next few days. While it is true ETH is now consolidating above the 5/8 Murray and the 21 SMA, it may be a sign that more buyers are positioned to push the price up to the psychological level of 5,000. Our trading plan is to buy above the 21 SMA and above the 5/8 Murray with targets at 4,375 and 4,687. The eagle indicator is giving a bullish signal. Support and Resistance Levels for December 24 - 27, 2021 Resistance (3) 4,375 Resistance (2) 4,208 Resistance (1) 4,174 ---------------------------- Support (1) 3,947 Support (2) 3,786 Support (3) 3,642 *********************************************************** A trading tip for ETH on December 24 - 27, 2021 Buy above 4,000 (21 SMA) with take profit at 4,375 (6/8) and 4,687 (7/8), stop loss below 3,910. The material has been provided by InstaForex Company - www.instaforex.com |
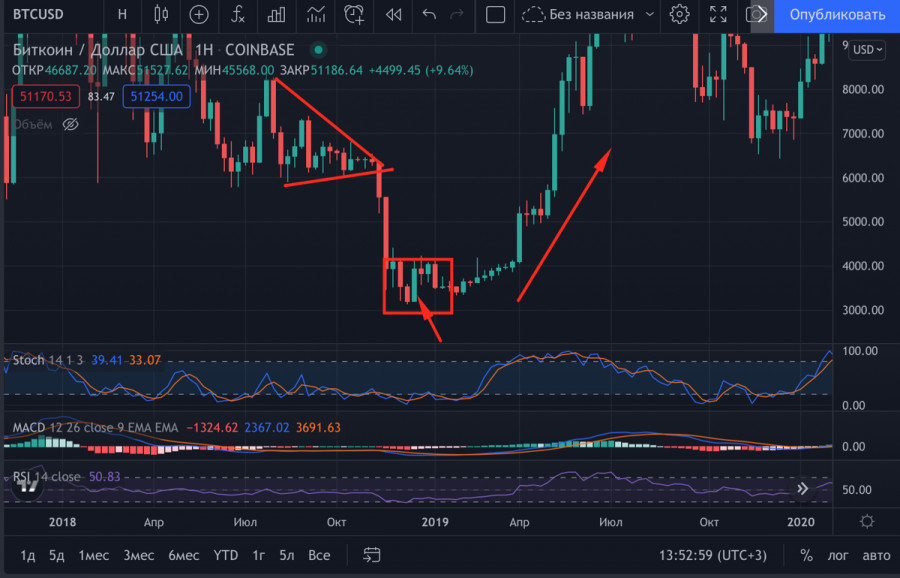
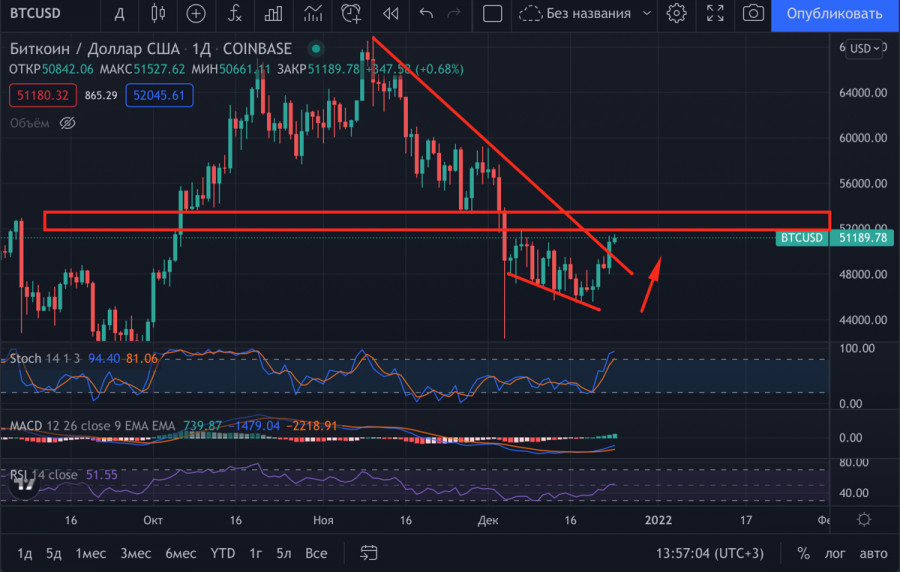
| Bitcoin reverses downtrend with bullish breakthrough of resistance at $50,000 Posted: 24 Dec 2021 03:25 AM PST Holidays are coming and bulls are starting to show more activity. Bitcoin manages to reverse the downtrend from November 10. There were a lot of prerequisites both for bullish rally and a decline towards $42,000-$45,000. However, the digital asset could break out of the wide trading range and is likely to continue rising towards $69,000. Similar to 2019In this paragraph I would like to draw your attention to the New Year's holiday and the market's reaction to it. On the weekly time frame, the BTC price moves as it was moving in 2019. The digital asset was in consolidation after a correction. The market was dominated by bears at the time, which was reflected in the red weekly candlesticks. However, a strong bullish candle was formed between December 17 and December 24. Subsequently, Bitcoin failed to break an important resistance level and the price dropped back into the trading range. However, this case indicates that one should not underestimate the holiday periods.
Bullish end of 2021Let's get back to the end of 2021. Bitcoin, contrary to many expectations, rebounded from support and made a confident bullish breakthrough of two key resistances. The first resistance is located at $49,700 and the second one is at $50,800. The level of $50,000 was also a difficult psychological level for the sellers. Thanks to such a confident rally, BTC/USD quotations grew by 5.5% during the day. The altcoin market is also in the green, which is a bullish signal and reflects investors' desire to buy cryptocurrencies.
Bitcoin finished the downtrend according to the classic scenario with a powerful bullish breakout of massive sales clusters. Good buying volumes did appear on the market, but a significant part of BTC growth can be explained by bearish expectations. A significant amount of short positions was closed above $50,000, as bears hoped for a further decline. At the same time, Bitcoin has accumulated buying volumes, which are not enough yet to reach highs, and therefore there is an assumption that the big bulls are still acting passively. We'd like to be wrong, but Bitcoin needs to fix at the current levels and continue to go upwards. Main events aheadThe digital asset needs to continue its upward movement above $51,200 and $52,000 to prove the bullish breakout and growing bullish strength. In the near future, I expect a fierce fight for the upper boundary of the sideways trading range at $52,000. If the price breaks through this range it is possible to speak about full completion of corrective and sideways movement. I assume that over the weekend the situation is likely to be resolved. Technical indicators show a positive sentiment and support this scenario: the MACD indicator shows an upward trend and targets at the zero mark, and the stochastic oscillator and the relative strength index indicate that the strength of the upward momentum and growth of buying volumes is preserved.
Forecast for the weekendThe intraday situation remains bullish: the price has moved into the $49,000-$52,000 range and started to experience sellers' pressure as it approaches the upper boundary of the channel. This suggests the need for consolidation and a local period of accumulation. I assume the price to decline to the support zone in the middle of the impulse candlestick near $50,000. Subsequently, the price may make the same impulse bounce and reach $52,000. This scenario is a priority, as the cluster of purchases above $51,000 is not formed, and therefore the quotations can decrease beyond this boundary. In general, I expect the end of the current trading week with bullish sentiment above the sideways range. Bitcoin is unlikely to finish the year above the all-time high, but the asset may get closer to it.
|
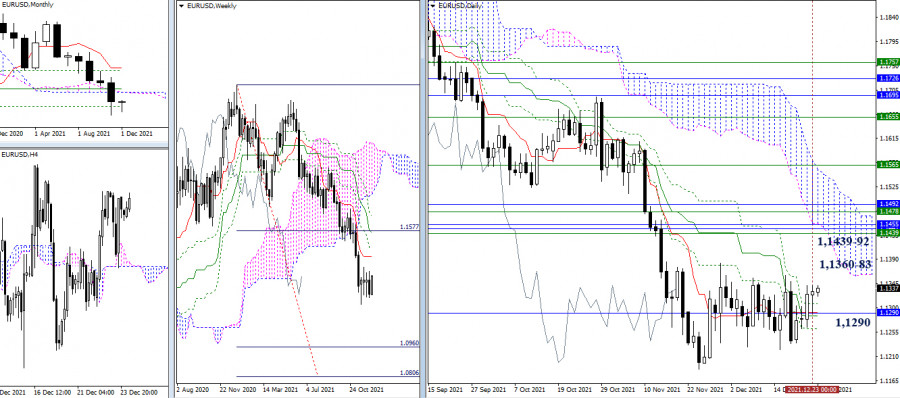
| Technical analysis recommendations of EUR/USD and GBP/USD on December 24, 2021 Posted: 24 Dec 2021 02:58 AM PST EUR/USD
The euro consolidated above the center of attraction of the current level at 1.1290 (monthly level + day Ichimoku cross) on the last day of the trading week, which resulted in the bulls having the advantage. Now, the main question is whether they will be able to maintain the situation by closing the week with the most optimistic mood in their favor. The consolidation highs (1.1383 - 1.1360) and resistance levels of various timeframes in the area of 1.1439-92 continue to serve as pivot points for the resumption of growth.
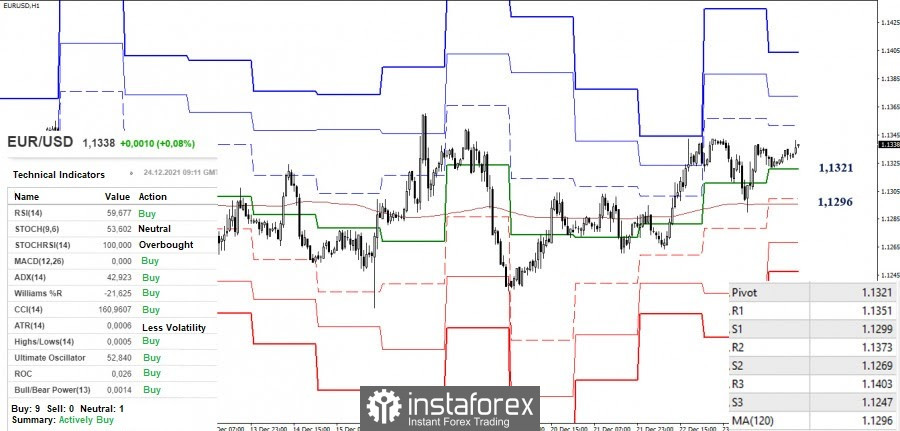
The bulls continue to have the advantage in the smaller timeframes, having the support of all analyzed technical instruments. If the rise continues, the intraday pivot points will be the resistance of the classic pivot levels 1.1351 - 1.1373 - 1.1403. On the other hand, a consolidation below the key levels, which are set at 1.1321 (central pivot level) and 1.1296 (weekly long-term trend), can change the current balance of power. GBP/USD
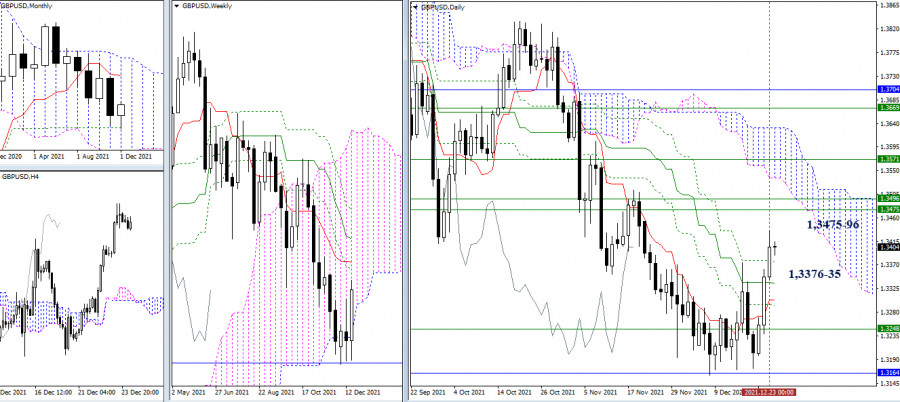
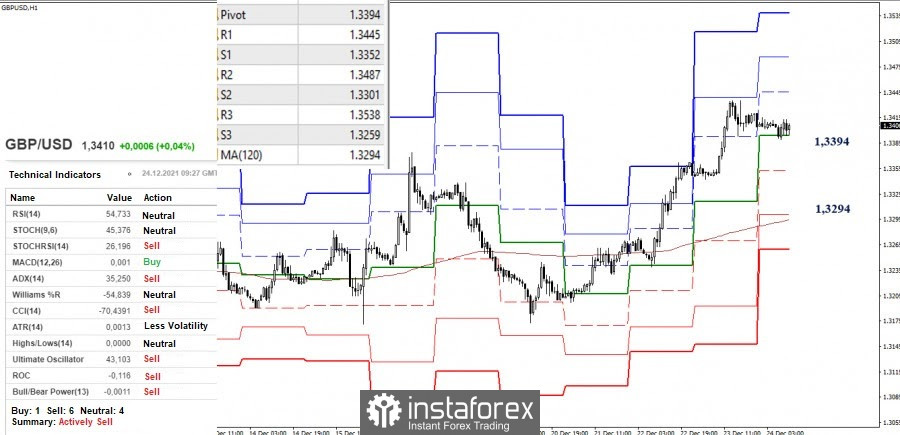
The bulls are close to fixing another pullback from the tested support levels (1.3164 - 1.3248) in the higher timeframes. A consolidation of the weekly result will allow us to hope that the monthly candle will also have a bullish mood since there will be only one trading week left until December ends. If a decline occurs, the levels of the daily cross (1.3376-35 - 1.3303 - 1.3295) can act as support. The levels of the Ichimoku weekly cross (1.3475 - 1.3496) and the daily cloud are now serving as upward pivot points.
The smaller timeframes are favoring the bulls who show an upward movement. However, they are currently in the downward correction zone and testing the strength of the first important support level - the central pivot level of the day (1.3394). The next key support level is located today at 1.3294 (weekly long-term trend), and then at 1.3352 (S1). If the upward trend is restored and the rise continues, the intraday upward targets will be the resistances of the classic pivot levels, which are located at 1.3445 - 1.3487 - 1.3538 today. *** Ichimoku Kinko Hyo (9.26.52) and Kijun-sen levels in the higher time frames, as well as classic Pivot Points and Moving Average (120) on the H1 chart, are used in the technical analysis of the trading instruments. The material has been provided by InstaForex Company - www.instaforex.com |
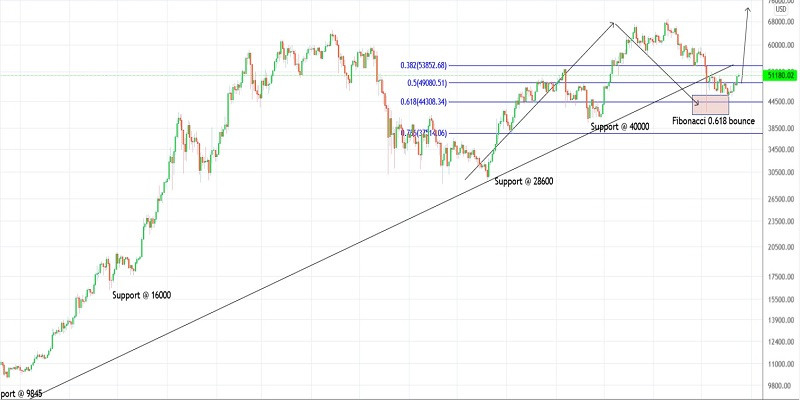
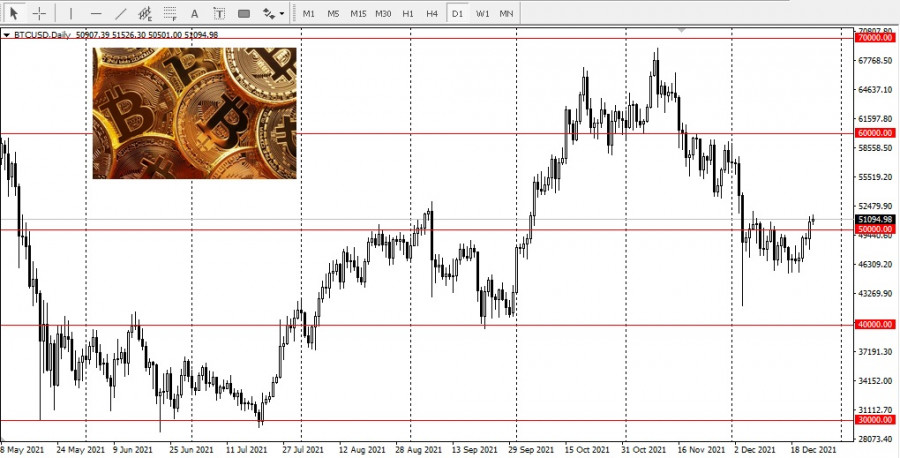
| Trading plan for Bitcoin for December 24, 2021 Posted: 24 Dec 2021 02:47 AM PST
Technical outlook:Bitcoin has resumed its uptrend against $42,000 lows as bulls are just a few points away from $52,000 interim resistance. A break above would open the door to push through $60,000 mark, the next in-line resistance. The crypto remains on track to push through fresh all-time highs through $75,000 and up to $125,000 going forward. Bitcoin had earlier dropped through $42,000 mark, which was close to the Fibonacci 0.618 retracement of the entire rally between $28,800 and $67,000 levels respectively. After finding support, bulls managed to push through $52,000 mark before pulling back. Furthermore, bears dragged lower towards $45,500 mark before finding support again (fibonacci 0.618 retracement of the recent upswing). After bouncing off the golden ratio phi twice in succession, Bitcoin now remains poised to push through $75,000 high in the next several weeks. Only a drop below $42,000 and subsequently $40,000 will change the intermediate trend to bearish. Trading plan:Potential rally through $75,000 against $40,000. Good luck! The material has been provided by InstaForex Company - www.instaforex.com |
| Gold and silver owners will not be distressed in the next decade Posted: 24 Dec 2021 02:40 AM PST
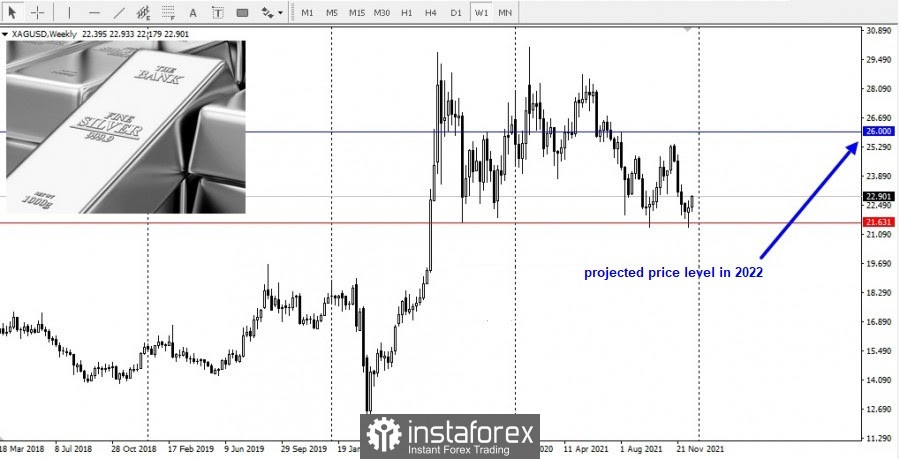
It is worth looking into silver next year after its unsuccessful investment year this 2021. The ratio of gold to silver also indicates the potential superiority of silver. According to Peter Schiff, chief economist and global strategist at Euro Pacific Capital, the gold to silver ratio is 80 to 1. Silver's price movements this year suffered in part due to supply disruptions and a significant increase in electricity costs. Nevertheless, its industrial component will drive the price of the precious metal upward next year as some supply chain issues are addressed. The Silver Institute predicts that there will be a supply gap in 2022 due to rising industrial demand and global decarbonization efforts. According to the commodity strategists at BofA (Bank of America), the transition to more solar energy is another important factor that can lead to an increase in silver prices. Analysts' price predictions for next year range from $ 24 per ounce to over $ 30 per ounce. Commerzbank's analyst Carsten Fritsch believes that silver will hit $ 26 an ounce in 2022.
Silver should be considered as a means of protection against inflation next year. According to Lee Goehring, managing partner of Goehring & Rozencwajg Associates, silver is a typical inflationary metal. Goehring also does not rule out that silver could rise to more than $ 500 in the long term, probably this decade. According to him, if the ratio of gold to silver falls to 20:1, and gold reaches $ 10,000, then there is a chance that silver will be worth $ 500. A decade of scarcity will come, people will become poorer, and only those who own gold and silver will not be affected by inflation. The material has been provided by InstaForex Company - www.instaforex.com |
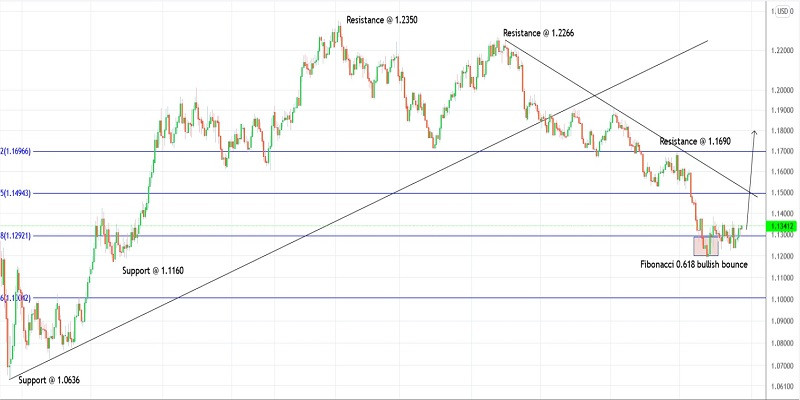
| Trading plan for EURUSD for December 24, 2021 Posted: 24 Dec 2021 02:31 AM PST
Technical outlook:EURUSD has rallied through 1.1343 in the past hour after dropping to 1.1290 lows on Thursday. The currency pair might be looking to push through 1.1360-70 zone intraday, before finding resistance. A consistent push through 1.1383 would be considered as breakout as bulls remain poised to push further towards 1.1500 and 1.1700 levels. EURUSD has retraced its recent upswing between 1.1186 and 1.1383 in the past week. The currency dropped through fibonacci 0.786 levels of above drop and bounced back. Ideally, bulls should remain in control until prices remain above 1.1222 mark going forward. Also note that the near term targets could be pointing towards 1.1500 at least. On the flip side, if prices turn lower from here and break below 1.1186, it could further open the door for a test of 1.1000 mark. A bullish bounce there could bring back bulls into play as they attempt to regain 1.1400 handle. Immediate resistance on the daily chart is now seen at 1.1690, while support comes around 1.1160. Trading plan:Potential rally through 1.1500 against 1.1150 Good luck! The material has been provided by InstaForex Company - www.instaforex.com |
| US SEC rejects Valkyrie and Kryptoin bitcoin trusts Posted: 24 Dec 2021 02:28 AM PST
After the approval of futures-backed bitcoin funds in October, the US Securities and Exchange Commission still vetoed the proposal for two bitcoin exchange-traded funds, dealing a blow to market participants. In a notice, the markets regulator said both of the proposals to list and trade shares of Valkyrie Bitcoin Fund and the Kryptoin Bitcoin ETF Trust failed to be approved because they did not meet its standard. In October, the SEC approved two bitcoin futures-based funds, the ProShares Bitcoin Strategy ETF and the Valkyrie Bitcoin Strategy ETF, which debuted on Wall Street the same month. However, the regulator has yet to accept an application for a spot bitcoin ETF. Last month, the SEC rejected an application to create a spot bitcoin fund from VanEck. On December 17, it delayed a decision on a similar proposal from Grayscale Bitcoin Trust. ETFs are investment tools that track baskets of stocks and have become popular due to lower fees. Bitcoin-ETFs, which provide exposure to the digital currency, aims to save the hassle of buying the cryptocurrency from an exchange and managing the private keys. Industry groups and stock exchanges have long sought SEC approval for these products. However, Securities and Exchange Commission chairman Gary Gensler and investor advocates worry about what they see as a lack of regulatory oversight and surveillance which heightens the potential for fraud and manipulation.
|
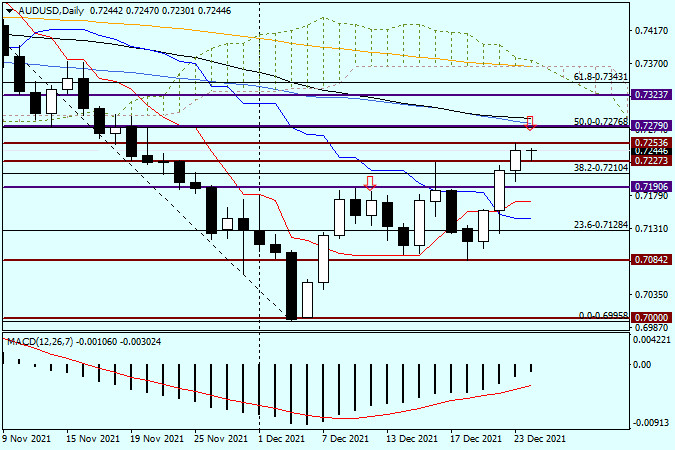
| Analysis and forecast of AUD/USD on December 24, 2021 Posted: 24 Dec 2021 02:26 AM PST Good day, dear traders! Today, on the last day of the week's trading, we will briefly analyze the AUD/USD currency pair. Let's start with the two central banks' positions. As we know, the Reserve Bank of Australia (RBA) has recently taken a more optimistic stance, which is still more of a wait-and-see nature. Following the Federal Reserve in the US, the RBA is getting ready to markedly reduce or even end its quantitative easing program next year. Of course, this will only happen if the situation with the COVID-19 pandemic and its new Omicron strain favors this approach in the Australian central bank's monetary policy. At the moment, in the view of the Australian regulator, the economic recovery is very robust and the new Omicron strain does not pose such a significant threat to the further recovery of the labor market and the Australian economy. At the same time, there has been some recovery in US inflation expectations. In particular, this was announced by the St Louis Fed. However, the Open Market Committee's main report has yet to confirm all of this. In the meantime, let's consider the AUD/USD price charts. Daily
As it is shown on the chart, in the last three days the Australian dollar has been rising actively against the US dollar. If this trend continues, the pair AUD/USD could reach the price range of 0.7276-0.7292. That is where the 50.0 Fibonacci retracement grid level of 0.7557-0.6995 passes. There also passes the strong technical level of 0.7280, right above which are the blue 50-simple and black 89-exponential moving averages. In my personal opinion, in case Aussie bulls reach the marked zone, they will face a very serious challenge in terms of further upside. I believe that only confident consolidation of the quotation above 0.7300 will create good prerequisites for the continuation of the rise. At this point in time, the pair is trying to continue the three-day rise seen earlier. However, this is not very successful so far. H1
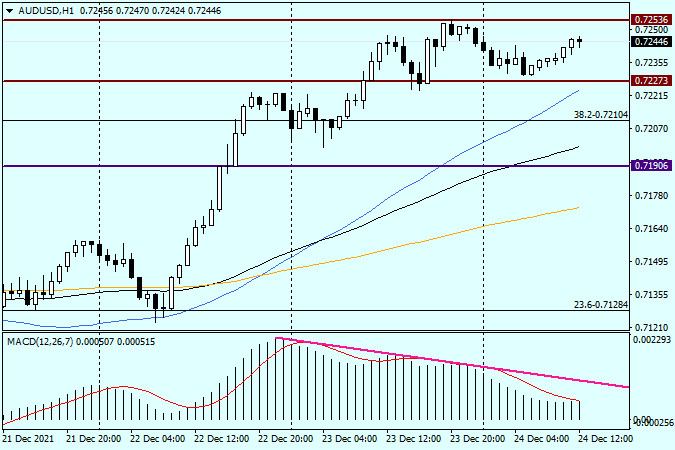
On the hourly chart, we can see the attempts of the upside players to continue moving the quote upwards. However, much will depend on whether they can overcome the nearest resistance at 0.7253. If a candle or a pattern of candles, which would indicate a downwards reversal, appears below this level, this would be a signal to open a sell. I also recommend paying attention to the presence of a bearish divergence in the MACD indicator. I think that in the current situation it is rather risky to buy. Firstly, the pair has already strengthened quite well, and downward correction pullback is very probable. Secondly, bearish divergence and thin market are not favourable to open buy deals, especially near strong sellers' resistance. It is quite possible that on Monday, given the actual weekly trading close, we will take another look at this instrument and identify more specific trading options. Have a good weekend! The material has been provided by InstaForex Company - www.instaforex.com |
| EUR/USD analysis and outlook for December 24, 2021 Posted: 24 Dec 2021 01:54 AM PST Everything changes Hi, dear traders! Yesterday's trading session ended inconclusively for both bulls and bears. Thursday's rather positive US data releases still failed to give significant support to the US dollar. Initial jobless claims matched the forecasted 205,000. The core PCE price index, used by the Fed to gauge inflationary pressure, grew to 4.7%. Economists expected the index to reach 4.5%. It seems the market's activity weakened in the run-up to Christmas. The Santa Claus rallies observed in the past few years are clearly a thing of the past now. In the meantime, the European tourism sector is struggling - due to the new restrictions, holiday travel is out of the question for many Europeans. The COVID-19 situation is unlikely to improve until late 2022. In the best case scenario, the pandemic could begin to recede in mid-2022. Daily
Due to Christmas's Eve, there are no events on the economic calendar today. Yesterday, EUR/USD found strong support at 1.1291 and recovered most losses it suffered earlier, despite the efforts of bearish traders. The pair closed at 1.1327 on Thursday. The red Tenkan-Sen line of the Ichimoku cloud gave additional support to EUR/USD. Yesterday's advice for traders to open long positions with low targets after the pair's decline into the 1.1305-1.1295 area turned out to be accurate. H1
The exchanges are closed in both the EU and the US due to Christmas, meaning there is a thin market at the moment. Today is not the best day for opening any positions. Traders could consider opening short positions if EUR/USD reaches the strong resistance in the 1.1343-1.1360 area. Emerging reversal candlestick patterns would serve as sell signals. It is recommended to set low targets when opening positions. Good luck! The material has been provided by InstaForex Company - www.instaforex.com |
| Canada's domestic production of resources grows for the sixth month in a row Posted: 24 Dec 2021 01:47 AM PST
According to Statistics Canada's (StatCan) October data, which was published yesterday, domestic mining, quarrying, and oil and gas production rose by 1.5%, increasing for the sixth straight month as all three subsectors of the industry grew. StatCan said that Canada's oil and gas subsector has grown by 1.5% – the fifth time in six months. Oil sands production surged by 3.9%, as a significant increase in the production of crude bitumen and synthetic oil in Alberta also led to an increase. On the other hand, StatCan noted that domestic oil and gas production (excluding oil sands) declined 1.8% as higher natural gas production was offset by lower crude oil production, especially off the North Atlantic coast of Canada. It is also worth noting that based on the report, the domestic mining subsector (excluding oil and gas) grew 1.7% on the back of overall industry growth. Non-metallic mining and quarrying increased by 4.1% due to the higher production of potash fertilizers (+5.1%). Metal ore production rose 0.6% on the back of higher iron ore (+ 3.6%), while copper, nickel, lead, and zinc (+ 1.5%) production was facilitated by an increase in exports. However, gold mining and silver ore (-4.6%) slightly slowed down their growth. In addition, StatCan said that coal production in Canada increased by 1.6%. The material has been provided by InstaForex Company - www.instaforex.com |


| You are subscribed to email updates from Forex analysis review. To stop receiving these emails, you may unsubscribe now. | Email delivery powered by Google |
| Google, 1600 Amphitheatre Parkway, Mountain View, CA 94043, United States | |


Comments