Forex analysis review
Forex analysis review |
- The dollar is plagued with doubts: Will there be a pre-New Year rally?
- Bitcoin's $100,000 forecast is not yet canceled says Bloomberg's McGlone
- Oil is finally recovering
- EUR/USD. Time bomb: US inflation sets a 39-year record
- Ethereum updates amid growing on-chain activity: when will altcoin update its absolute maximum?
- The rise in US prices confirms the expectation of hawkish signals from the Fed
- Elon Musk would like to leave Tesla
- Trading signal for Crude Oil (WTI - #CL) on December 10 - 13, 2021: sell below $71,88 (3/8)
- USDHCF technical analysis for December 10, 2021.
- Ichimoku cloud indicator analysis on Gold for December 10, 2021.
- Trading plan for EUR/USD on 10 December, 2021
- Hot forecast for GBP/USD on 10 December, 2021
- Technical analysis on EURUSD for December 10, 2021.
- Weekend sell off for Bitcoin or not?
- Increased volatility, whale passivity and engulfing pattern: Bitcoin heads to local bottom
- Trading signal for EUR/USD on December 10 - 13, 2021: buy above 1.1270 (weekly support)
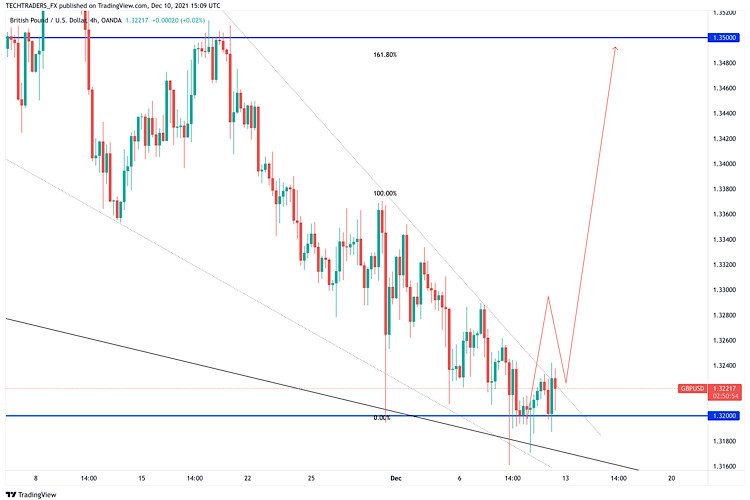
- Trading signal for GBP/USD on December 10 - 13, 2021: buy if breaks above 1.3225 (bearish channel - 21 SMA)
- EUR/USD. Dollar awaits data on US inflation amid Fed's meeting in December while euro seeks hope for hawkish ECB comments
- BTC analysis for December 10,.2021 - Rejection of key support
- Analysis of Gold for December 10,.2021 - Falling wedge in play
- Video market update for December 10,,2021
- AUD/USD Update for December 10, 2021 - Watch for the upside continuation
- The pound hopes for February
- December 10, 2021 : EUR/USD daily technical review and trading opportunities.
- December 10, 2021 : EUR/USD Intraday technical analysis and trading plan.
| The dollar is plagued with doubts: Will there be a pre-New Year rally? Posted: 10 Dec 2021 10:41 AM PST
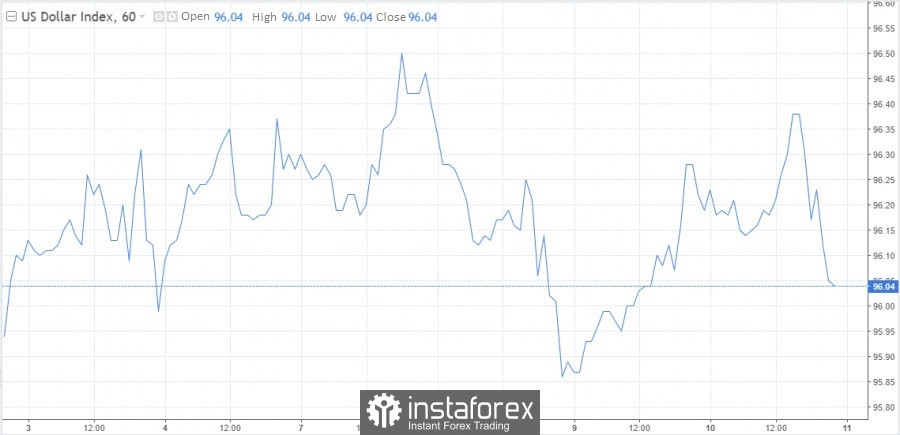
Judging by the latest data, the peak of inflation has not been passed, the rise in prices continues to eat into the economy. As predicted, U.S. annual inflation accelerated to a 40-year high, or 6.8%, in November. In theory, this should force the Central Bank to increase its efforts to combat it. It is believed that the new numbers will not have much of an impact on the Fed's December monetary policy meeting. Despite the fact that Federal Reserve Chair Jerome Powell spoke about the occurrence of unpleasant surprises, if he does not accelerate the process of abandoning bond purchases, next week there may be a confrontation between the doves and the hawks of the Fed. The former will look for signs of a short-term weakening in the growth of prices for goods sold. Gasoline prices, for example, have been declining for a month. The latter focuses on the penetration of inflation in such areas as rent. The CPI will also be taken into account with its important component – inflation expectations. In the meantime, the markets are laying down a high probability that the Fed will double the pace of curtailing incentives with the expectation of completing QE in March or April. Thus, the first-rate increase may occur in May. There is a 63% probability for such a scenario development. One increase by the end of 2022 is estimated at 98%, two – at 89.5, and three - at 67%. Yes, Powell has switched to the side of the hawks, investors' expectations look too optimistic somehow. What if inflation starts to slow down? After the crisis of 2008, inflation began to recover quite quickly, while economic growth remained unstable. Perhaps America is already approaching an inflationary peak, given the growth of the dollar index by 8% in six months and a decrease in the intensity of logistical problems. Of course, there is no question of returning to the target of 2%. A temporary stop somewhere in the region of 4% would be quite a suitable option. Otherwise, the Fed will have to move away from the zero interest rate policy. However, it is not a fact that the regulator will start acting from the series right now. The most reasonable thing, as economists like to say, is to leave the door open for a faster tightening of monetary policy. Dollar forecast As for the dollar, analysts predict that its direction will remain bullish in the coming days. There is no other way here yet: The Fed should accelerate the curtailment of QE, while other regulators, including the ECB and the Bank of Japan, take a much less hawkish position. The fact that the U.S. currency index broke through and held above 94.65 indicates its long-term bullish positioning. The technical picture will remain on its side, even if it shows weakness at some point.
Growth towards the upper limit of the 6-year range looks quite viable. The main target remains the level of 100.00, especially considering that the greenback failed to stay above it several times. The outlook for the dollar will look very attractive, at least until other Central Banks are revived. Next week, the meetings of the Bank of England and the ECB are scheduled. They will not raise rates - it is not even discussed, but they will hint at the possibility of taking action in response to inflation. Even these words will be enough to lift their national currencies from their knees. The question is, will they do it? It is important to understand that the dollar will not grow forever either. Given the expected tax hike and tighter monetary policy, the greenback could soon form a top. The material has been provided by InstaForex Company - www.instaforex.com |
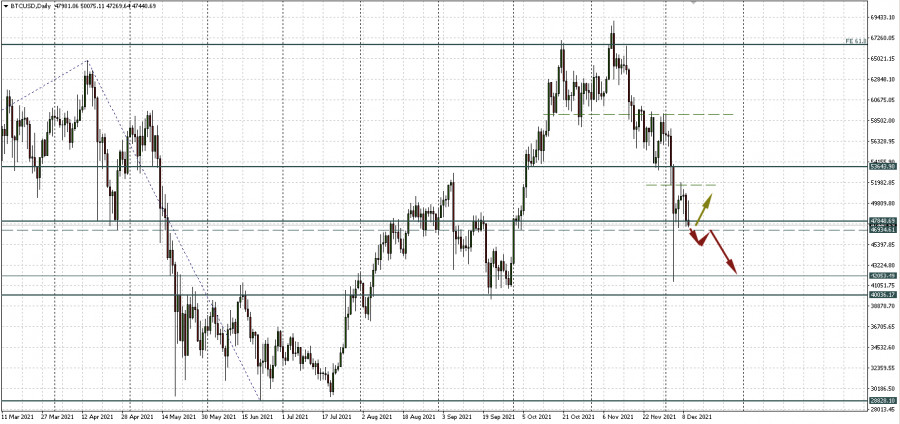
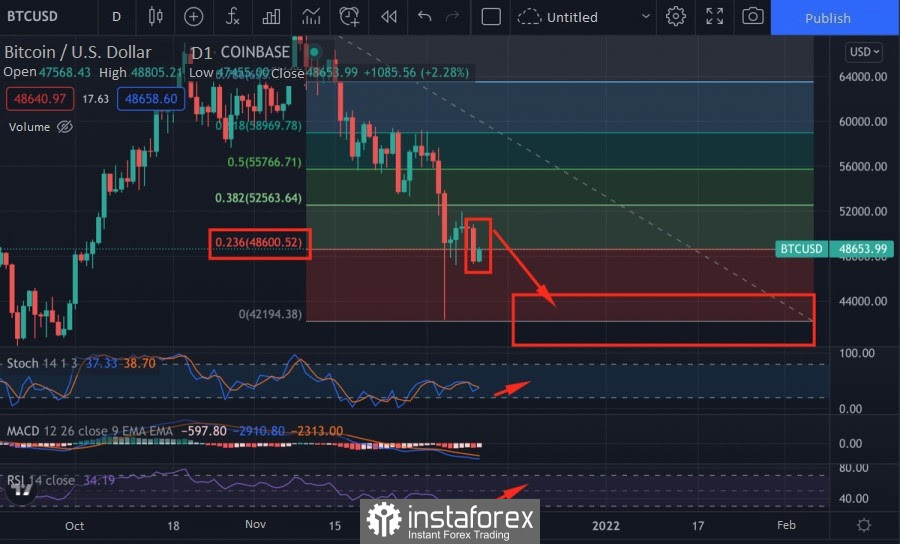
| Bitcoin's $100,000 forecast is not yet canceled says Bloomberg's McGlone Posted: 10 Dec 2021 10:15 AM PST Bitcoin on Thursday still fell to the lower border of the flat with support near $47,000 and local resistance near $52,000. And on Friday, despite all the attempts, it still cannot rise higher. Even the U.S. inflation data, which showed that the CPI rose at the fastest pace in about 40 years, prevented the main cryptocurrency from recovering. Against this background, the expected scenarios for BTCUSD do not change. Now Bitcoin will either turn up in the corridor or break through its lower border. Consolidation below $47,000 will bring it back into the $40,000 - $42,000 area per coin. $100,000 per Bitcoin canceled by the end of the yearThere are about 20 days left until the end of the year. And the likelihood that the $100,000 target will be reached by the end of December is diminishing every day. It will be nice if the main cryptocurrency holds at least 50,000. Against this background, experts who were expecting a new round record high are beginning to abandon their $100,000 forecasts. And some are already looking forward to reaching that target in 2022. In fact, predicting the timing of the forecast on the market is a thankless task. Therefore, there is nothing wrong with a delay. The main thing is to track trends and understand targets. Bloomberg's Mike McGlone shifts his forecastBloomberg Intelligence Senior Commodity Strategist Mike McGlone tweeted that 2022 will be a good year for Bitcoin and gold. He believes that due to rising inflation, both assets will grow, reaching $100,000 and $2,000, respectively. According to McGlone, this rising inflationary pressure will also have an impact on the dynamics of commodity assets and stocks. However, this inflation rate could help lift Bitcoin quotes to new heights. Investors, as we've discussed many times before, will flee traditional assets. "$100,000 for Bitcoin, $50 for oil, $2,000 for gold?" the expert asks. He also noted that he continued that "peaks in commodity prices and declining long-term Treasury yields indicate risks of a resurgence of deflationary forces in 2022." Boring Friday: shifting the focus to the long termThe news background on Friday is meager, there is nothing significant for the cryptocurrency. And although everything is clear in terms of technology and it remains only to wait, it is worth paying attention to long-term factors. For example, consider seven drivers for cryptocurrency growth in 2022.
|
| Posted: 10 Dec 2021 10:12 AM PST
The price of oil on Friday rushed to the most significant weekly increase since the end of August. Finally, the anxiety about oil demand eased slightly. The new version of the Omicron coronavirus no longer seems to be a serious threat to the market. The Brent and WTI indicators have been rising by more than 7% during the current week. Today, futures for Brent crude oil rose by 0.9%, reaching $75.08 per barrel, although, at the end of yesterday's trading session, the quotes of the benchmark brand sank by 1.9%. WTI crude futures rose 1% to $71.68 on Friday. Recall that yesterday's trading day showed a decrease in the cost of oil from West Texas by 2%. At the time of writing the review, WTI oil futures for January delivery were trading at $71.62. Recall that after the Omicron strain was detected on November 25, the oil market experienced a significant decline, but this week helped oil quotes recover almost half of the lost levels. And all thanks to the publication of the results of Pfizer's research, which showed that three doses of their vaccine have every chance to protect against the Omicron variant. A very optimistic forecast did not leave a certain residual risk that it would be advisable to take into account. The recovery of oil prices was also facilitated by a report released by the US Department of Energy, which reported small oil production figures in the United States by the end of 2021 – only 11.18 million barrels per day. Analysts expected that the production level would be at least 11.23 million barrels per day. Despite several positive news for oil quotes, it is worth admitting that, in general, the black gold market remains shaky. For example, strict restrictions in China make it difficult for domestic air transportation in China. Consumer distrust due to repeated outbreaks of the virus exacerbates this situation. In addition, the rating agency Fitch lowered the rating of the largest Chinese companies China Evergrande Group and Kaisa Group since they published information about the default on offshore bonds. As a result, concerns about slowing growth in China's real estate sector have multiplied. Concern has also grown about the growth of the economy of China, which is the world's largest importer of oil. The strengthened US dollar also limits the growth of oil quotes. Oil prices usually tend to decline when the US currency begins to feel more confident. This happens for the reason that oil is becoming more expensive for buyers who own a different currency. Most likely, oil prices will fluctuate in a narrow range in the coming days until significant news appears. The material has been provided by InstaForex Company - www.instaforex.com |
| EUR/USD. Time bomb: US inflation sets a 39-year record Posted: 10 Dec 2021 09:43 AM PST The U.S. inflation did not disappoint, but it did not surprise traders with a breakout growth either. Almost all components of the macroeconomic report came out in accordance with the forecast, so they did not cause much excitement in the market. And yet Friday's release plays a crucial role in determining the future prospects of the greenback. Inflation in the U.S. is still at a high level, and this fact suggests that the Fed will not limit itself to an early tapering of QE. The probability of an interest rate increase within the next year is growing "by leaps and bounds," especially since many representatives of the Fed openly advocate the implementation of this scenario. Some of them also allow the option of a double increase, and with a fairly short interval in order to curb the spike in inflation.
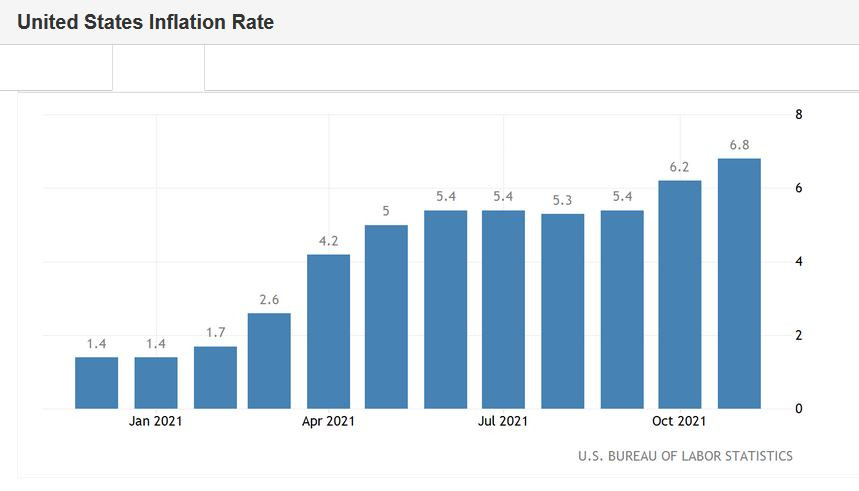
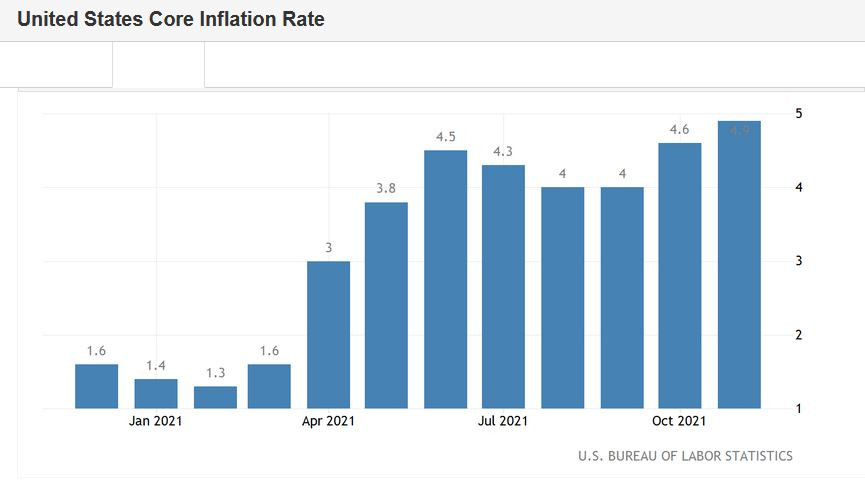
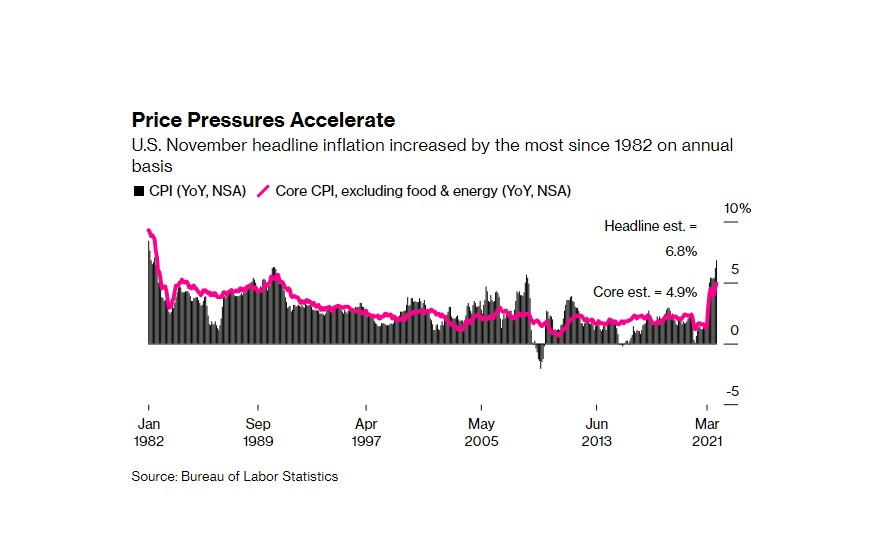
The consumer price index is indeed at the level of multi-year highs. Thus, according to published data, the overall CPI in November accelerated to 6.8% YoY. This is the maximum value of the indicator for the last 39 years. The last time this indicator was at this level was in 1982. On a monthly basis, the index also showed positive dynamics, rising to 0.8% (with a slight decline forecast to 0.7%). The core consumer price index, excluding volatile food and energy prices, similarly remained at a high level: an increase of up to 0.5% MoM, and 4.9% YoY was recorded. This is again a long-term record: the last time the index produced such results was in July 1991. The structure of the released data suggests that energy prices have increased by 33% since November 2020, and by 3.5% over the past month. Over the year, gasoline has risen in price by 58%, groceries by 6%, and used cars and trucks by 31%. According to experts, these components have become the main reasons for high inflation (and not only last month, but also in previous ones). However, November still distinguished itself: the growth rate of food and energy prices (on an annualized basis) became the fastest in the last 13 years. Also, recall that the most preferred inflation indicator by the Federal Reserve - the index of personal consumption expenditures (PCE) – also significantly exceeds the target level of the regulator. It is believed that this indicator is monitored by members of the U.S. regulator "with particular bias." The core PCE index, which does not take into account volatile food and energy prices, rose in October to 4.1% (in annual terms). At the same time, the result of September was revised upwards (from 3.6% to 3.7%). In August, July, and June, the indicator came out at 3.6%. Against the background of such inflationary trends, there is no doubt that the Federal Reserve, at its last meeting this year (the results of which will be announced on December 16), will decide to accelerate the pace of curtailing the stimulus program – from $15 to $30 billion per month. Thus, QE will end its operation in March next year. Obviously, the next step of the Federal Reserve will be to tighten the parameters of monetary policy. Fed Chairman Jerome Powell is in no hurry to talk about the fate of the interest rate at the moment. The relevant conclusions were made by the market, so to speak, "independently." Representatives of the "hawk wing" of the Fed, of course, add fuel to the fire, but still, there is a certain intrigue. Partly for this reason, dollar bulls are in no hurry to "uncork the champagne," creating a premature hype around the U.S. currency. The phlegmatic reaction to Friday's release is another confirmation of that. In addition, the so-called "Friday factor" also played a role: traders take profits by closing short positions. There are also few people willing to go into sales on the eve of the weekend. Therefore, the EUR/USD pair reflexively reacted with a decline to the level of 1.1264, but then returned to the "neutral" territory again, having flown 12 and 13 figures on the border.
And yet, in my opinion, Friday's release has become another argument for further strengthening of the U.S. currency. This is a kind of "time bomb" that will work a little later – but it will definitely work. At the moment, traders are looking back at the ECB, some representatives of which are urging their colleagues to react to the record increase in inflation in the eurozone. A certain informational illusion is being created that the European Central Bank will follow in the footsteps of the Federal Reserve. But I would venture to assume that the EUR/USD bulls will eventually be disappointed by the ECB's "hawkishness," which will only be expressed in the fact that the regulator will stipulate the limits of the increase in the asset purchase program (APP) after the completion of the pandemic emergency purchase program (PEPP). If, in turn, the Fed completes QE in March and announces a rate hike in June-July, then the divergence of the ECB and Fed positions will "sparkle with new colors," strengthening the position of the greenback. Thus, in the long term, short positions on the EUR/USD pair will be in priority, due to the likely strengthening of the U.S. dollar. If we talk about the prospect for the coming days, emotions will come to the fore - emotional trading decisions on the eve of the Fed and ECB meetings. Most likely, the pair will continue to trade in the range of 1.1260-1.1360 (until December 16), starting from the boundaries of the echelon. The material has been provided by InstaForex Company - www.instaforex.com |
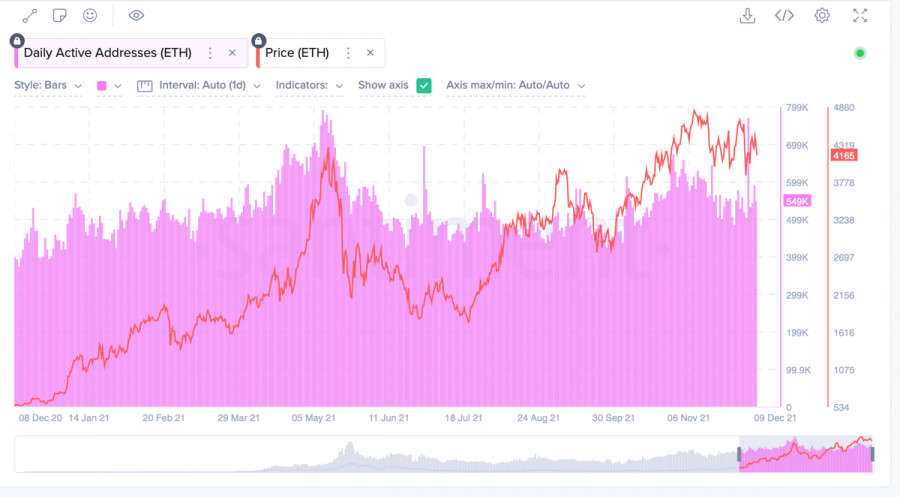
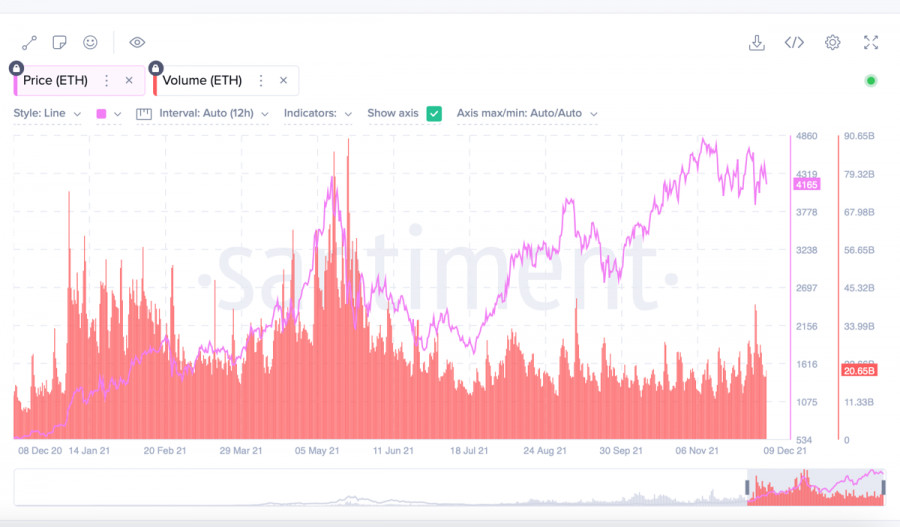
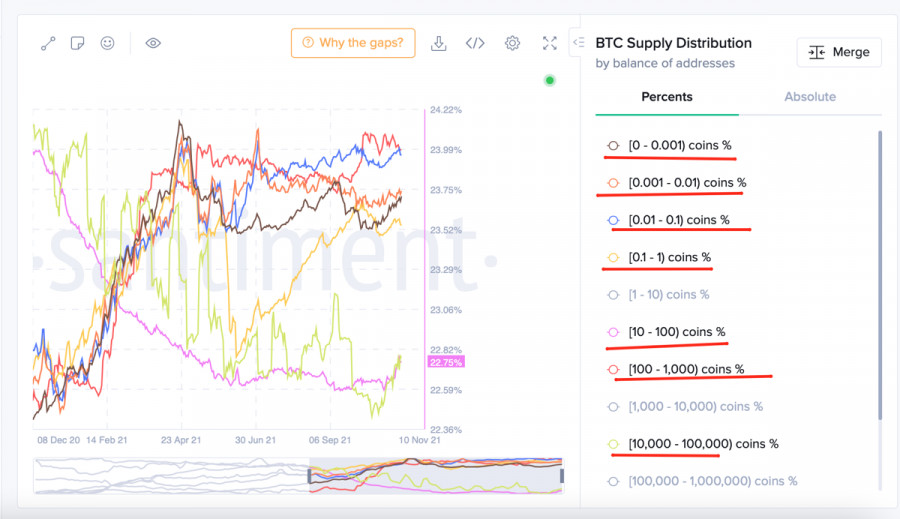
| Ethereum updates amid growing on-chain activity: when will altcoin update its absolute maximum? Posted: 10 Dec 2021 09:04 AM PST Among all the assets from the top 10, Ethereum feels the most confident and continues the recovery period before updating the historical record. Unlike the situation with Bitcoin, Ethereum has many fundamental factors that suggest the beginning of a powerful upward movement to levels above $6k. The main factor of the impending bullish rally of the coin is a significant increase in on-chain indicators. Over the past two weeks, there has been a steady increase in the number of unique addresses with local drawdowns. Transaction volumes also remain at a fairly high level and do not fall during small periods of price reduction. The activation of the altcoin audience has always contributed to the early start of the bull market, and given the confident position of the cryptocurrency, there is no reason to believe that the situation will change in December.
Technical factors significantly contributed to the growth of on-chain activity. Two weeks ago, many crypto analysts called Ethereum "the altcoin for the rich," since the average commission on the coin network reached $64. However, over the past week, this indicator has tripled and continues to decline. This is indirect evidence of the functioning of individual London upgrade protocols and contributes to the growth of the number of unique addresses. Positive dynamics is also visible on the on-chain address balance metric, which confirms the thesis of reducing the exchange balances of ETH coins to a three-year minimum. Also, note that the growth of on-chain activity and the stability of the cryptocurrency was helped by the local update of Arrow Glacier, which delayed the activation of the complexity bomb (the mechanism freezes the network and reduces the reward of miners).
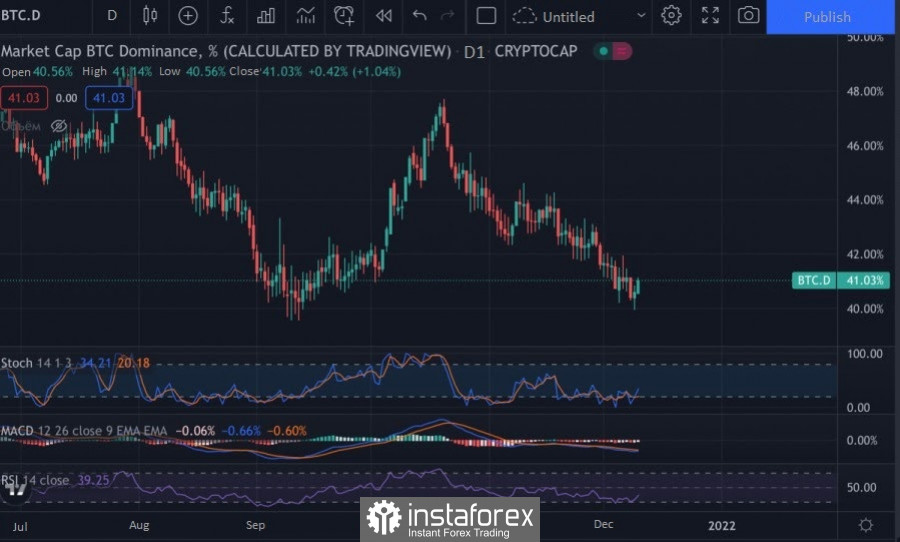
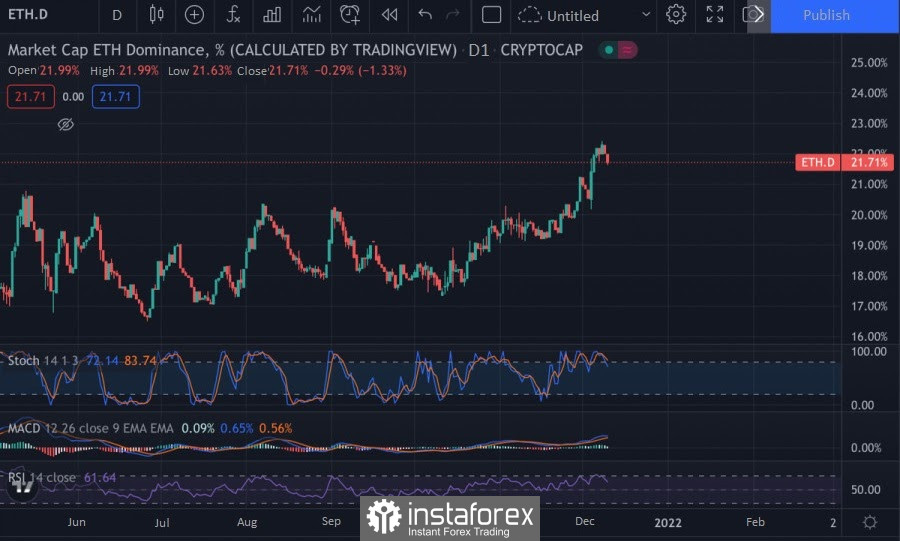
We have considered the key and fundamental factors of a possible bullish rally in the price of Ether. Now we turn to the immediate situation on the market. The main reason for optimism about the main altcoin is the fall of Bitcoin dominance to 40. At the same time, the dominance of ETH has increased to 20.8% over the past three weeks. The combination of these factors allows Ethereum to show growth and not depend on the situation with Bitcoin. And even though BTC is starting to win back positions, Ether has enough time to resume growth and, at least, reach the previous peak in value.
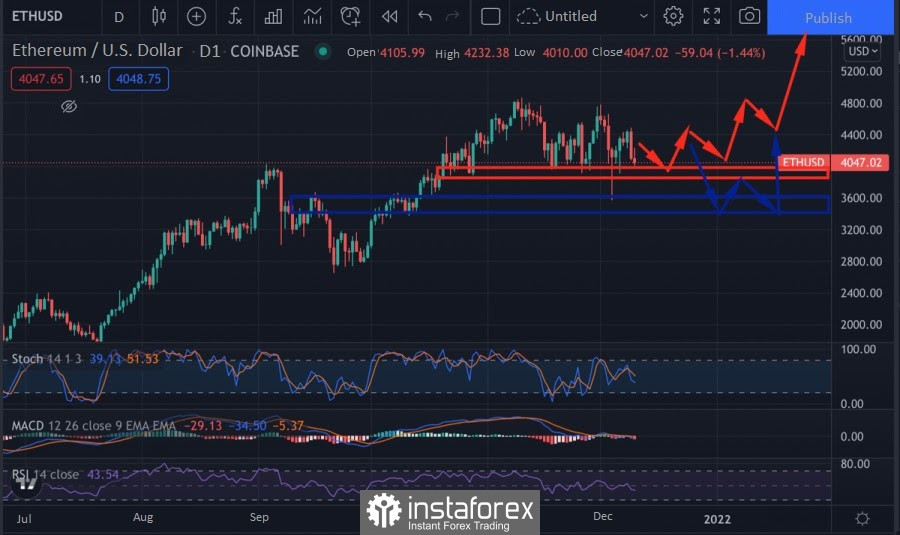
The daily pattern of ETH indicates a local consolidation period with little unrest due to the expiration period and the mental anguish of Bitcoin. However, buyers can be calm for the bullish crypto market, while ETH/USD confidently holds the support area at $4k. If this position is maintained, the coin will continue to fluctuate between the support zone and the absolute maximum line, followed by its bullish breakthrough and movement to the $6k-$6.2k area. At the same time, there is a possibility of a repeated retest of $3.6k, although it is hard to believe in the current market situation. The daily red candle has already formed a small lower wick, which indicates the strength of buyers. With this in mind, a decline below $4k looks unlikely so far.
Despite the positive situation around the main altcoin, technical indicators signal a weakening and lack of upward momentum. The MACD is moving in the red zone, and the stochastic has formed a bearish intersection and is declining in the bullish zone. This is a healthy situation with price stabilization and, taking into account the increase in volatility over the weekend, this trend may last until the end of this week. However, if a positive announcement is fired on the weekend, then the timing of the start of the bull rally of the coin will shift. As of 14:00 UTC, the altcoin will presumably continue to fluctuate around $4k-$4.5k on the upcoming weekend, and next week it may get close to ATH and update it. The material has been provided by InstaForex Company - www.instaforex.com |
| The rise in US prices confirms the expectation of hawkish signals from the Fed Posted: 10 Dec 2021 07:57 AM PST The previous month was a record for retail prices in the United States for almost 40 years. Rapid and persistent inflation undermines employers' salary funds and increases pressure on the Federal Reserve to tighten monetary policy. According to the Ministry of Labor, published on Friday, the consumer price index increased by 6.8% (data for the year starting from November 2020 inclusive). The widely watched inflation indicator has risen 0.8% since October, exceeding economists' forecasts and continuing the trend of significant increases that began earlier this year. The average forecast figures provided for an annual increase of 6.8% and an increase of 0.7% on a monthly basis. The yield on 10-year Treasury bonds declined, futures on the S&P 500 index rose and continue to rise. The dollar fell at the time of the opening of the New York session, as the indicators as a whole turned out to be no worse than expected. But let us recall that these expectations were adjusted to take into account a serious increase in October.
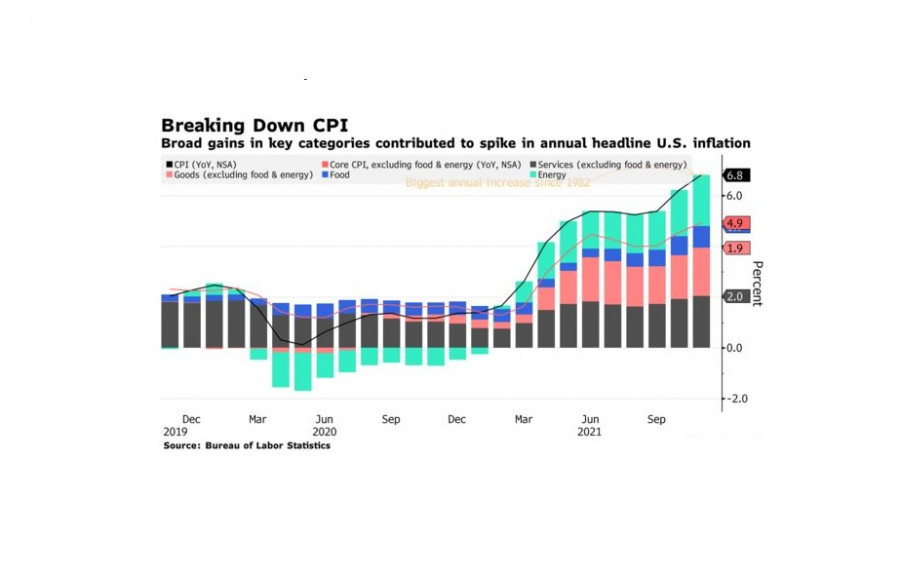
The increase in CPI reflects a significant increase in most categories. Gasoline, housing, food, and cars contributed the most to the growth compared to the previous month. These data lead investors to expect that the Fed will accelerate the winding down of its bond-buying program at the final meeting of the central bank this year next week. Governments in most countries are now under increasing pressure to deal with rising inflation as workers spend more at grocery stores and gas stations. This figure "just puts pressure on the Federal Reserve," Kathy Bostjancic, a chief financial economist at Oxford Economics, said on Bloomberg Television. "This is a very difficult period for them." Inflation "will remain hot and sticky during the first quarter", she believes. A faster rate cut would open up an opportunity for the Fed to start raising the benchmark interest rate. At the same time, investors bet on a sharp increase in Fed rates in 2022, pointing out that Friday's data showed a higher chance of slowing inflation, given that the monthly change was less than in October. Annual CPI growth is expected to be around 7% by 2022. Core inflation Excluding food and energy, base prices increased by 0.5% compared to the previous month. Overall, the core consumer price index rose by 4.9% compared to last year, reaching a new 30-year high. The cost of housing, which is considered the most significant component of the CPI and accounts for about a third of the overall index, increased by 0.5% in November compared to a month earlier. Compared to the same month last year, the 3.8% increase was the largest since 2007. Housing costs are expected to rise next year as rent increases follow property prices, with a slightly delayed effect. Furniture, clothing, and airline tickets also contributed to the rise in inflation. Household consumption increased by 6.4% compared to last year, which is the highest since December 2008. Total spending on food, including away from home, increased by 6.1% compared to a year earlier - the highest since 2008. Gasoline rose by 6.1% compared to the previous month, which corresponds to the volume of growth in October. The rental of basic housing and the equivalent rent of owners increased by 0.4% from October.
As a result of a serious price increase and a tumultuous policy regarding the Ukrainian-Russian conflict, Joe Biden's approval rating fell, which increased political pressure on the administration, forcing the president's entourage to move more actively. And although the White House has taken some steps - for example, creating a task force on the supply chain - inflationary pressures continue to grow. Rapid inflation is also likely to affect the final size and fate of Biden's Build Back Better bill. Next year, supply chain problems will continue to drive up prices in the short term, but economists expect this factor to disappear as Americans move to more normal consumption patterns. However, other factors, such as labor shortages and housing costs, can keep inflation at a high level. According to David McLennan, chief executive officer of Cargill Inc., food prices are also likely to remain high next year. "I thought that inflation in agriculture and food was temporary. Now I feel less because of the ongoing shortage in the labor markets," McLennan said last month in an interview at the Bloomberg New Economy Forum in Singapore. "This is one of the entrances to the supply chain that we are closely monitoring." Wages have also been showing growth in recent months, but lagging behind consumption. The average hourly wage may show a nominal increase, but adjusted for inflation, the real level fell by 1.9% in November compared to a year earlier. This is the biggest rebound in six months. Inflation or stagflation? The growth of a new variant of coronavirus has raised concerns about a double blow to the US economy in the form of slowing growth on the one hand, and still high inflation on the other. While supply chains are collapsing after the collapse, local governments are considering new restrictions, and consumers are assessing not only the health risks in everyday life but also pre-holiday expenses. And yet, so far, economists see the risk of "stagflation" - that toxic mixture of weak growth and strong inflation, which significantly worsens the prospects for recovery - by only half. It is obvious that prices are rising more noticeably in the United States than anywhere else, but the growth rate has also turned out to be more stable than politicians expected. Now it is quite difficult to judge how far this growth is from stagnation, and whether it will continue next year at a rate above average, which can push Americans to look for work for several months. The level of consumption in the United States reached pre-pandemic indicators in the previous reporting periods. Still, some forecasters have lowered their forecasts for U.S. gross domestic product growth. As we know, the forecasts of Goldman Sachs and other banks for the next year have been regularly declining since spring. And there are no grounds for revision for the better yet: data on travel by US airlines, restaurant visits, and credit card expenses so far do not show obvious changes in recent weeks, since the risk of the Covid-19 threat persists. But not everyone thinks so. "We will not see stagflation. We will see an inflationary boom with continued strong growth and price growth rates, which have already prompted the Fed to reorient policy to contain inflation," Glenn Hubbard, chairman of the Economic Council, commented on this. Hubbard served as an advisor to former President George W. Bush and is now a professor of economics at Columbia University. Median forecasts of economists showed that they expect growth in the United States in 2022 at the level of 3.9% (the forecast repeats the November one). Federal Reserve policymakers will release their new forecasts next week at a meeting that is expected to begin with a proposal for tougher measures to ensure that inflation remains under control. These forecasts are likely to describe an economy approaching full employment next year and continuing to grow faster than before the pandemic. The unemployment rate in November at 4.2% is already significantly lower than the level of 4.8% in September and is close to the level of 4%, which is considered sustainable in the long term. Postcovid-economy Policymakers may also start raising rates more quickly and approve plans to end current bond purchases in March, rather than in June 2022, as previously planned. It is still too early to try to understand how the Omicron variant will behave, and how people will tolerate its distribution. If it turns out to be faster, less dangerous to vaccinate, and as deadly as Delta, it could trigger a new wave of restrictions in some countries and plant closures or travel in others, potentially adversely affecting global growth and jobs. "Countries simply cannot repeat the big monetary policy push, the big fiscal policy push that they have been able to make over the past two years. This cannot happen again," Gita Gopinath, chief economist at the International Monetary Fund, said at an event in Geneva on Thursday. If the Omicron option causes a new and serious economic shock, "we will face a real risk of what we have avoided so far, namely stagflation." But so far, markets, analysts, and economic data do not reflect such a worst-case outcome, partly because markets are tired of being afraid of new strains. The latter option was first identified in early November. Since then, the weekly number of travelers allowed to fly to the United States by the Transportation Security Administration has remained about the same or slightly higher compared to 2019, as it was earlier in the fall. According to the OpenTable booking website, the volume of personal bookings in restaurants has also not changed. This indicates that people are striving for greater openness and reduction of quarantine measures, tired of restrictions. A recent study conducted by researchers at the San Francisco Fed noted what has become the main hope of politicians: American businesses and consumers are "used to the coronavirus." The material has been provided by InstaForex Company - www.instaforex.com |
| Elon Musk would like to leave Tesla Posted: 10 Dec 2021 07:57 AM PST The chief executive officer of Tesla Inc once again shocks shareholders and investors. Elon Musk is "thinking" of quitting his job and becoming an "influential person," the richest man in the world according to Forbes tweeted on Thursday. "Thinking about quitting my job and becoming a full-time influencer," Musk said in a tweet, without going into details. It is still unclear whether Musk is serious about being fired, but back in the spring, he complained about social networks that the management takes up a lot of his time, whereas he would like to focus on research. Elon has gained weight noticeably and changed his haircut – any woman will tell you that these are signs that a person is going through hard times. Before that in January, Musk, who is also the founder and CEO of rocket company SpaceX, and also runs startup Neuralink and infrastructure firm The Boring Company, said during a conference call that he expects to be CEO of Tesla for "several years." But it's been a tough year for everyone. For example, last month he asked his Twitter followers if he should sell 10% of his stake in the electric car manufacturer, which most agreed with. Since then, he has sold almost $12 billion worth of shares. Before that, he got rid of all his real estate. Many analysts believe that this is due to the need to cover the costs of taxes. "It would be nice to have a little more free time than just working day and night, from the moment I wake up to when I fall asleep - 7 days a week. Pretty intense." The material has been provided by InstaForex Company - www.instaforex.com |
| Trading signal for Crude Oil (WTI - #CL) on December 10 - 13, 2021: sell below $71,88 (3/8) Posted: 10 Dec 2021 07:42 AM PST
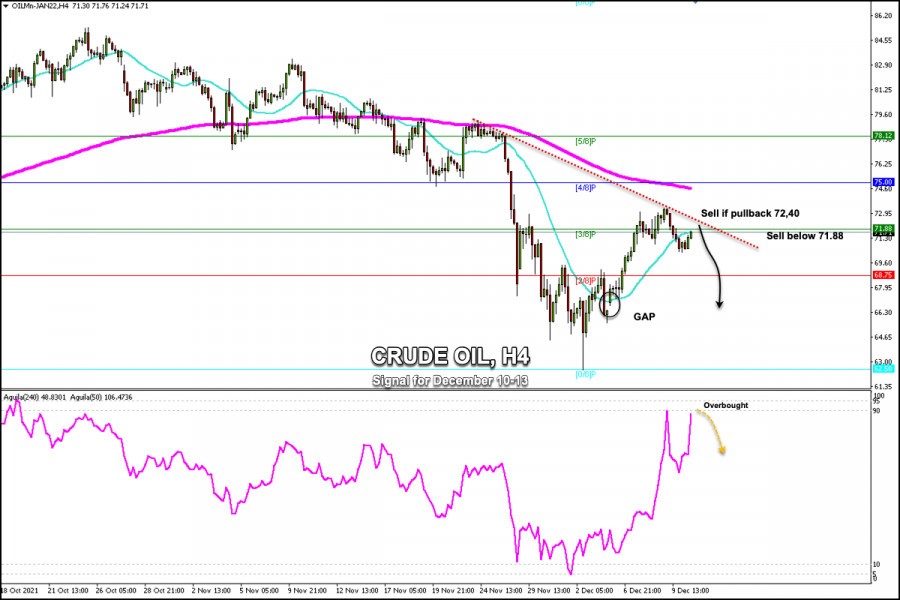
Crude Oil (WTI- #CL) is trading below the 21 SMA located at 71.80 and below the bearish channel formed since November 24 and below 3/8 Murray. Given that there is strong downward pressure around this area where the WTI is trading, it is expected that the next few hours there will be a downward movement to 2/8 Murray located at 68.75 and until it can cover the GAP that it left at 66.39. The medium-term outlook according to the 4-hour chart is still bearish and with a possibility of a fall in the short term to the psychological level of 70.00 and 62.50. Given that the WTI is below the 200 EMA and below the 21 SMA, everything indicates that in the coming days crude oil could continue with the downward movement and could fall to the support of 2/8 Murray at 68.75 and hit the monthly low of 62.50. The eagle indicator is approaching the extremely overbought zone. Crude is likely to make a technical correction below the downtrend channel and we could see a bearish move in the coming days. Our trading plan is to sell below 71.88 with targets at 68.75 and at 66.40 (GAP) the eagle indicator supports our bearish strategy. Support and Resistance Levels for December 10 - 13, 2021 Resistance (3) 75.00 Resistance (2) 74.34 Resistance (1) 72.48 ---------------------------- Support (1) 69.54 Support (2) 68.49 Support (3) 66.60 *********************************************************** A trading tip for CRUDE OIL on December 10 - 13, 2021 Sell below 71.88 (3/8) with take profit at 68.75 (2/8) and 66.40 (GAP), stop loss above 72.40. The material has been provided by InstaForex Company - www.instaforex.com |
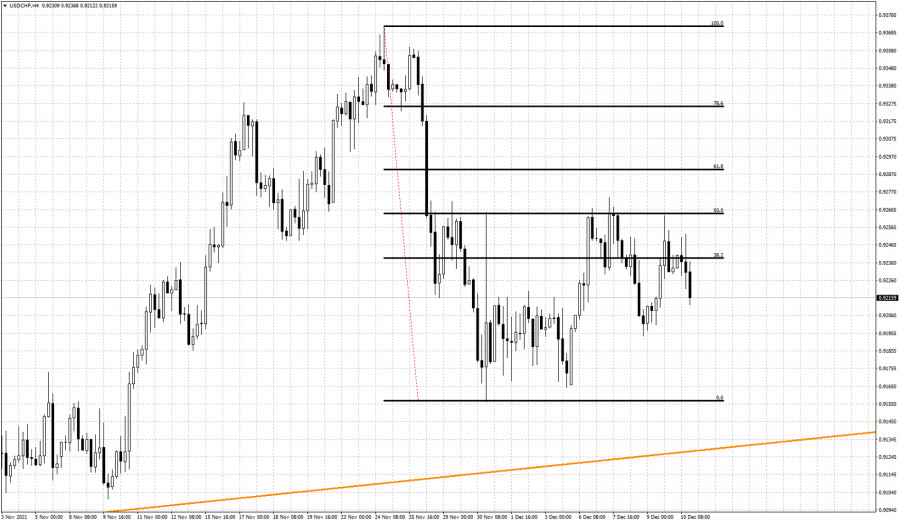
| USDHCF technical analysis for December 10, 2021. Posted: 10 Dec 2021 07:32 AM PST USDCHF made a high at 0.9263 yesterday near the 61.8% Fibonacci retracement. Price made a lower high and got rejected once again at the same Fibonacci resistance area. This is a sign of weakness and more downside to come.
Black lines- Fibonacci retracements USDCHF has made a higher low and is now moving lower towards 0.9216. Support is at recent low at 0.9194 and failure to stay above it, will be a sign of weakness. Such a breakdown will most probably lead to lower lows and lower highs confirming the short-term trend change to bearish. If price starts a sequence of lower lows and lower highs, we should then expect price to challenge the major support trend line at 0.9129. As long as price gets rejected at the 61.8% Fibonacci retracement, we remain bearish for the coming week. The material has been provided by InstaForex Company - www.instaforex.com |
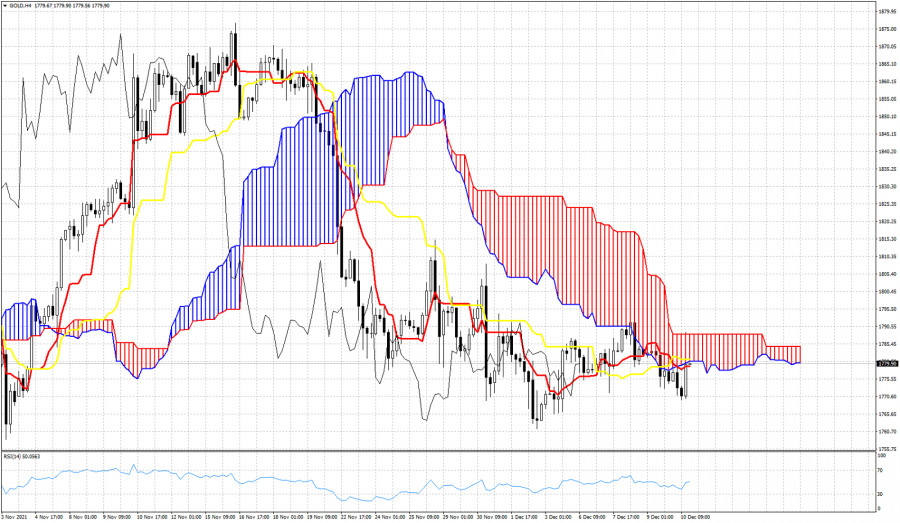
| Ichimoku cloud indicator analysis on Gold for December 10, 2021. Posted: 10 Dec 2021 07:17 AM PST Gold price is still below the Ichimoku cloud. In Ichimoku cloud terms trend is bearish. Price is challenging the lower cloud boundary resistance. It is important for bulls to see price break into and above the 4 hour cloud in order for the short-term trend to change.
|
| Trading plan for EUR/USD on 10 December, 2021 Posted: 10 Dec 2021 07:15 AM PST
The dollar came under selling pressure after the US confirmed annual inflation at 6.8% in November, its highest in almost four decades. EUR/USD battles to recover above the 1.1300 level as government bond yields ticked lower. From a technical perspective, the overnight pullback from weekly lows and acceptance below the 1.1300 mark favours bearish traders. Some follow-through selling below the 1.1260-55 region will reaffirm the negative bias and accelerate the fall towards retesting weekly swing low, around the 1.1230-25 region. This is followed by the YTD low, or levels just below the 1.1200 mark touched on November 25. A convincing break below will set the stage for additional losses and drag the pair to the 1.1145 support area en-route the 1.1100 round-figure mark. On the flip side, momentum back above the 1.1300 mark is likely to confront resistance near mid-1.1300s ahead of the 1.1380-85 area, marking the 38.2% Fibonacci level of the 1.1692-1.1186 downfall. A sustained strength beyond, leading to a subsequent move above the 1.1400 mark could push the pair further towards the 50% Fibo. level, around the 1.1440 region. The material has been provided by InstaForex Company - www.instaforex.com |
| Hot forecast for GBP/USD on 10 December, 2021 Posted: 10 Dec 2021 07:15 AM PST
GBP/USD changed course and trimmed early losses, now trading above 1.3230. Heating US inflation figures hint at steeper Federal Reserve tightening. The pound is struggling with Omicron and Brexit headlines. From a technical perspective, the pair's inability to gain any traction or register any meaningful recovery supports prospects for an extension of the recent bearish trend. That said, RSI (14) on the daily chart is hovering just above the oversold territory and warrants some caution for aggressive bearish traders. Nevertheless, the stage still seems set for a test of the YTD low, around the 1.3160 region touched on Wednesday. The next relevant support is pegged near the 1.3125 region before the pair breaks below the 1.3100 mark and accelerate the decline towards the 1.3050-45 region. On the flip side, the 1.3220-30 region now seems to have emerged as an immediate hurdle. The mentioned barrier coincides with a short-term descending trend-channel support breakpoint, which if cleared could trigger a short-covering move. However, any subsequent move up is likely to face stiff resistance and seen as a selling opportunity near the weekly swing high, just ahead of the 1.3300 mark. A sustained strength beyond should allow the pair to move back towards the 1.3340-50 supply zone en-route the 1.3370 area and the 1.3400 round figure. The material has been provided by InstaForex Company - www.instaforex.com |
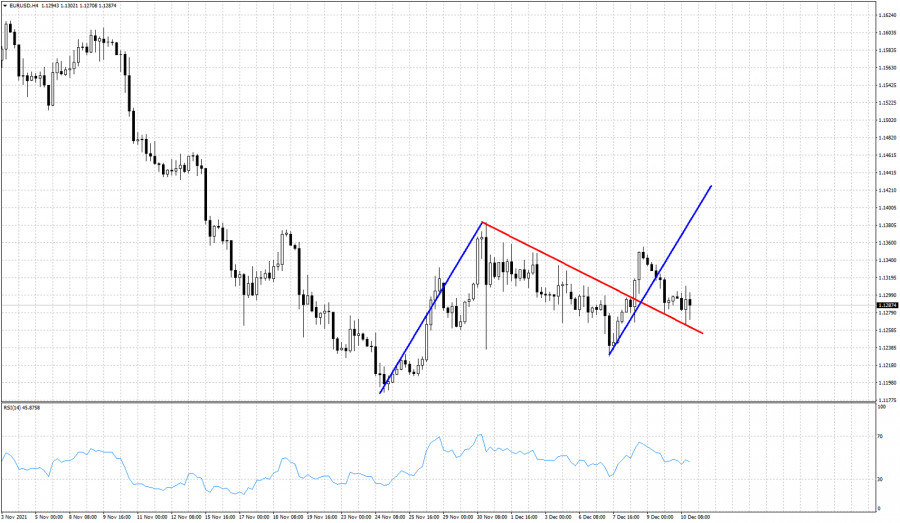
| Technical analysis on EURUSD for December 10, 2021. Posted: 10 Dec 2021 07:13 AM PST EURUSD is trading around 1.1287 after back testing the broken red trend line resistance. Bouncing off the broken resistance trend line will be a bullish sign. As long as price is above 1.1228 I expect EURUSD to continue higher towards our 1.1440 target.
Red line - expected path EURUSD so far has retraced 61.8% of the rise from 1.1228 to 1.1355. There are increased chances of an upward reversal from current levels. Resistance is at 1.1355 and breaking above it will increase the chances of reaching 1.1440 which was our initial target. Bulls do not want to see price fall below 1.1228. This will cancel the bullish short-term scenario. This will open the way for a move to new weekly lows. The material has been provided by InstaForex Company - www.instaforex.com |
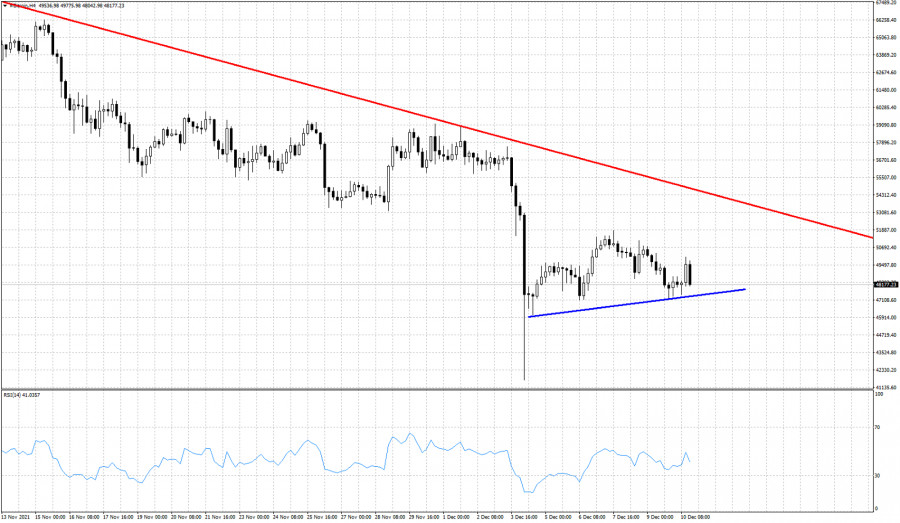
| Weekend sell off for Bitcoin or not? Posted: 10 Dec 2021 07:09 AM PST Last Saturday Bitcoin was under heavy selling pressures as price fell from $53,000 to $41,000. Price bounced towards $47,000 the following day and since then it mostly moves sideways. Price remains in a bearish short-term trend as the market digests the heavy sell off of last week.
Red line - major resistance Support is found at $47,000-$47,300 and resistance at $54,350. As long as price is below $54,350 Bitcoin is vulnerable to more downside. Breaking below $47,000 would most probably lead to a move towards last week's lows. Will we see another sell off this weekend? If support fails to hold then I believe we will see another strong move lower. Bulls have a lot of work to do in order to change trend to bullish. The material has been provided by InstaForex Company - www.instaforex.com |
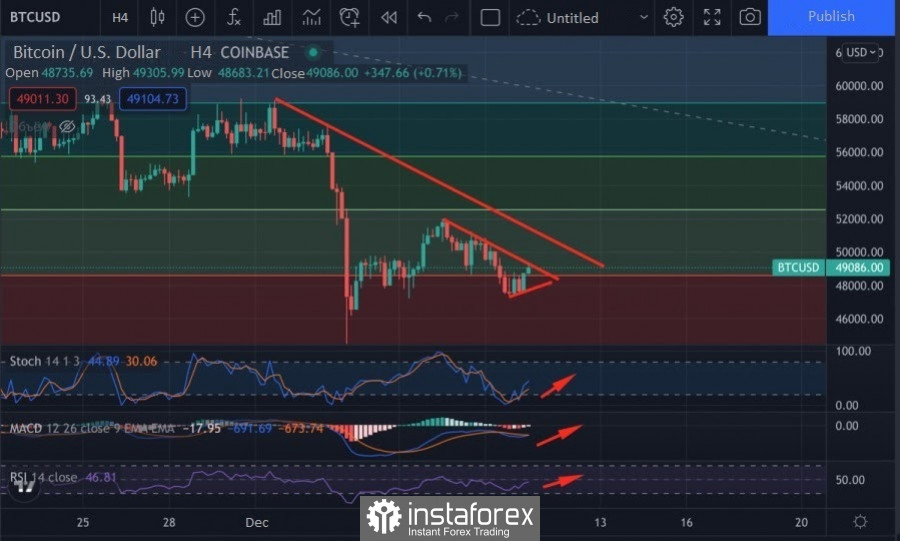
| Increased volatility, whale passivity and engulfing pattern: Bitcoin heads to local bottom Posted: 10 Dec 2021 06:51 AM PST The new trading day on the Bitcoin market follows a bearish scenario. Bulls are losing positions, large investors are showing inertia, and Friday's expiration of $1 billion options leaves no chance for even the most ardent bulls to try to dump the price above $50k. In addition, the situation is complicated by the global technical picture, according to which the first cryptocurrency is heading right now to retest the local bottom set last Saturday. Given the fundamental background around the main digital asset, we should not expect a full-fledged recovery movement to the $50k mark. At the same time, I admit an impulse movement above this threshold, but this may happen due to increased volatility in the market, and therefore it is not worth considering it in the context of the recovery period. As of 11:00 UTC, the cryptocurrency is trading around $48.7k, where the support line and the Fibonacci level of 0.236 passes. Bitcoin exhibits weakness on the daily chart, and therefore I assume a breakdown of this boundary and further movement to the range of $42k-$45k. The main argument in favor of further decline is the pattern of confident "bearish engulfing," which was formed on the daily chart of the cryptocurrency. And despite the sluggish attempts of the bulls to hold the line (the impulse growth of stochastic and the relative strength index), there is no doubt that the price will continue to decline.
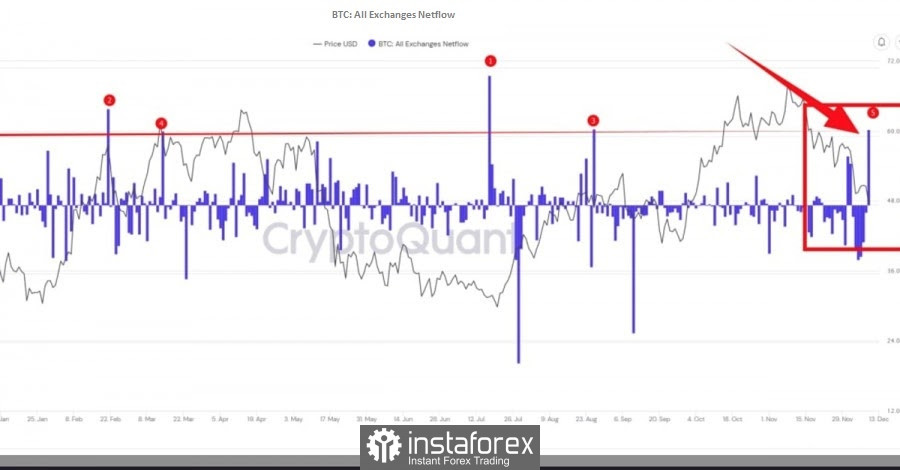
In addition to the technical picture, the activity of large capital indicates a further decline in the price. Institutional investors' passive behavior does not provide the market with the necessary volumes, which allows the price to decline to local lows without significant resistance. Moreover, there is every reason to believe that the "whales" are again preparing to arrange a manipulative dump, since yesterday, December 9, the fifth largest influx of BTC to the exchanges in 2021 was recorded. A similar trend was observed before last week's collapse, when institutional investors transferred more than 18k BTC to platforms within a week. This increases the pressure on the price, which results in continued decline.
The final chord, or rather the nail in the coffin of Bitcoin, is the expiration of options for $1 billion. The process is always accompanied by increased volatility, and therefore the opportunity itself to win back positions and enter the recovery stage can be leveled by a single impulse price drop. With this in mind, I assume that we will fall to the local bottom on the upcoming weekend, after which we should expect a rebound from the $42k-$45k area, and further consolidation above $50k. In the local picture, the cryptocurrency shows clear bullish signals, but the price is stuck between the 0.236 Fibo level, which it successfully overcame, and the downward resistance line of December 3. To break through the resistance area, a powerful impulse is needed, which large investors are able to give, but it is unlikely to expect active actions on the eve of an increase in volatility due to expiration. Despite this, the MACD completes the formation of a bullish intersection and moves to zero. The stochastic and relative strength index is returning to the bullish zone, which indicates the development of a short-term upward momentum. However, the bears are confidently squeezing buyers near the level of downward resistance, which can be seen by the growing upper candlestick. But there is still a chance for Bitcoin to push off from the current positions and try to turn around towards $52k. To do this, the asset needs to gain a foothold above 48.5k in order to make a local trend change within the day. However, as of 11:00 UTC, buyers do not have the necessary volumes, and therefore we are going to retest the local bottom near $42.7k.
|
| Trading signal for EUR/USD on December 10 - 13, 2021: buy above 1.1270 (weekly support) Posted: 10 Dec 2021 06:48 AM PST
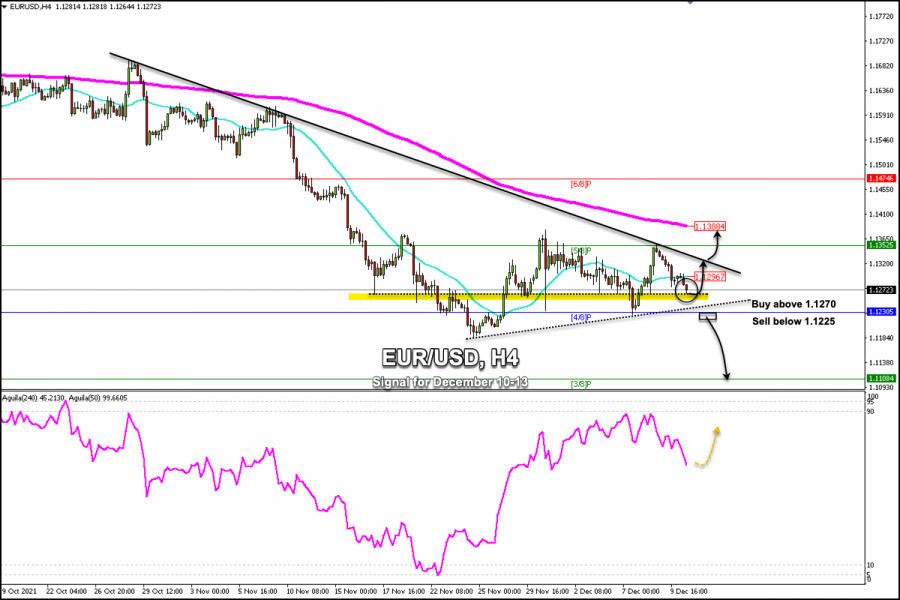
Before the announcement of the inflation data in the United States, EUR/USD is trading below the SMA of 21 located at 1.1296. Right now, the pair is trading at 1.1272, just above key weekly support. If this support is broken, we could expect a rebound in the uptrend channel formed since November 22. On the other hand, a rebound and a consolidation above the weekly support of 1.1270 could be an opportunity to buy EUR/USD as long as the US inflation data is negative for the US dollar. Additionally, a sharp break above the 21-moving average could be an opportunity to buy with target the 200 EMA at 1.1384. The key is to watch that it trades above 1.1296 which will give us the possibility to buy. On the other hand, a break below the support of 4/8 Murray at 1.1230 and below the secondary trend channel could grag down the currency pair that could fall to the support of 3/8 at 1.1084. We will be able to sell if EUR makes a daily close below this key level of 1.1230. The downtrend channel formed since October 22 continues to put pressure on the pair. A sharp break above 1.1320 would give the euro the opportunity to start a new bullish scenario. You can buy if EUR / USD trades above this channel. It could eventually consolidate above the 200 EMA at 1.1384 with a final target of 1.1474. Our forecast in the next few hours for the euro is a consolidation above 1.1296. As long as EUR / USD is trading above this zone, we will have an opportunity to buy with the target at 1.1352 (5/8) and 1.1388 (200 EMA). The market sentiment report for today, December 10, shows that there are 63.92% of operators who are buying the EUR / USD pair. This data provides a bearish sign in the long term. We could expect a recovery to 1.1388 (200 EMA). Then, the price may again resume its downward movement with the target at 1.1108 (3/8). Support and Resistance Levels for December 10 - 13, 2021 Resistance (3) 1.1370 Resistance (2) 1.1329 Resistance (1) 1.1307 ---------------------------- Support (1) 1.1262 Support (2) 1.1230 Support (3) 1.1194 *********************************************************** A trading tip for EUR/USD on December 10 - 13, 2021 Buy above 1.1270 (weekly support) with take profit at 1.1317 (bearish channel), and 1.1388 (200 EMA) stop loss below 1.1235. The material has been provided by InstaForex Company - www.instaforex.com |
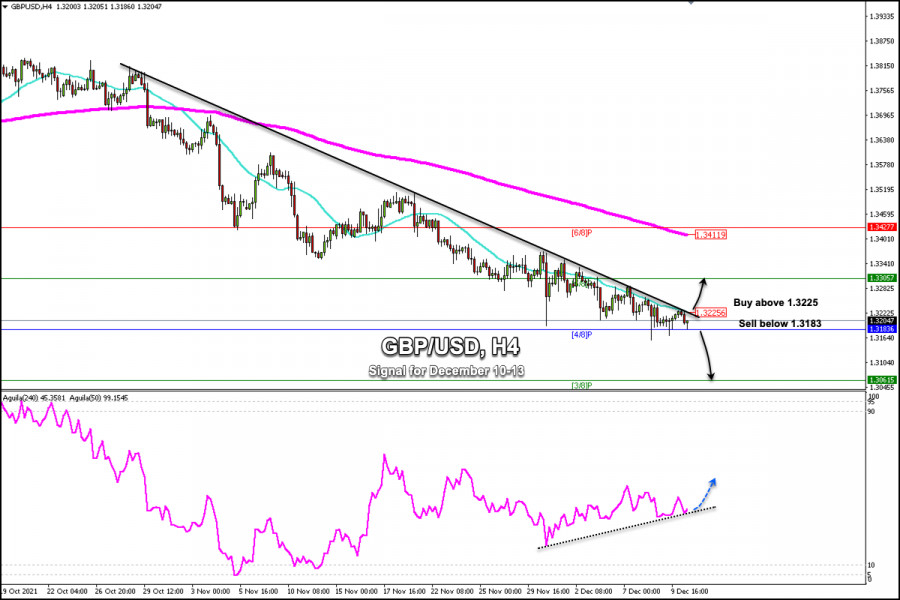
| Posted: 10 Dec 2021 06:11 AM PST
GBP USD is trading below the 21 SMA located at 1.3225. In the European session, the pound fell to the level of 1.3183, just above the key support of 2/8 Murray. In the next few hours, the inflation data for November in the United States will be published and it is likely that there will be strong volatility in all pairs against the dollar. If the inflation data in the United States is favorable for the US dollar, the British pound could break the key support of 1.3185 and continue its fall until the next support located at 1.3061. A reading above 0.7% on month and a 6.8% annual reading are expected which could favor the pound and could break above the 21 SMA (1.3225). According to the 4-hour chart, GBP / USD continues to clearly show a bearish bias. A breakout and consolidation above 1.3225 could favor the British pound and we could see a move towards the zone of resistance 5/8 located at 1.3305. You can buy only if the pair settles above the 21 SMA at 1.3225 and above the bearish channel. Above 1.3250, there will be a clearer buy signal and above 1.3305(5/8) the uptrend will be established. Our forecast for the next few hours for the British pound is a consolidation above 1.3225 (21 SMA). As long as GBP/USD trades above this zone, we will have an opportunity to buy with the target at 1.3305 (5/8) and 1.3411 (200 EMA). If 5/8 is broken, we could buy with targets at 1.3427 (6/8). The market sentiment report for today, December 10, shows that there are 71.68% of operators who are buying the GBP/USD pair. This data provided a bearish sign in the medium term. Since the pair is heavily oversold, a correctional movement to the resistance zone 200 EMA at 1.3411 is expected first. The eagle indicator is showing a bullish bias, moving above the trend channel. Support and Resistance Levels for December 10 - 13, 2021 Resistance (3) 1.3305 Resistance (2) 1.3263 Resistance (1) 1.3237 ---------------------------- Support (1) 1.3183 Support (2) 1.3151 Support (3) 1.3133 *********************************************************** A trading tip for GBP/USD on December 10 - 13, 2021 Buy if breaks above 1.3225 (21 SMA) with take profit at 1.3305 (5/8) and 1.3411 (200 EMA), stop loss below 1.3183. The material has been provided by InstaForex Company - www.instaforex.com |
| Posted: 10 Dec 2021 05:17 AM PST
The EUR/USD pair is trading below 1.1300, consolidating its recent losses after the biggest drop in two weeks seen the day before. Judging by the way the dollar is trading, we can tell that traders are preparing for a faster QE tapering by the Fed, followed by a rise in interest rates. Meanwhile, the euro, which dropped by 0.4% against the dollar on Thursday, looks vulnerable to higher borrowing in the United States, especially if the interest rates hike in the Eurozone are delayed. Societe Generale strategists announced their forecasts for the EUR/USD exchange rate for the first half of 2022. 1. Main scenario: 1.09 (50% probability). This scenario sees the Fed starting to raise rates in mid-2022. The bank is pricing in a cumulative 110 basis point Fed rate hike in 2022-2023 (against +25 basis points from the ECB). It is expected that by the time the US monetary policy tightening begins, markets will be more actively pricing in these expectations, which will cause the EUR/USD pair to fall below 1.1000. 2. Optimistic scenario: 1.15 (25% probability). If the situation in the global economy develops better than forecasted, it may not only lead to an increase in the Fed's policy tightening forecasts, but also fuel expectations that the ECB will also be forced to follow the example of its U.S. counterpart. This reassessment of attitudes toward the ECB could have a major psychological impact on the market. 3. Bearish scenario: 1.06 (25% probability). Only an apocalypse could force the Fed to refrain from tightening monetary policy. In such a scenario, all hopes of a tightening of the ECB monetary policy may also disappear, given that the Eurozone economy lags behind the US. If we add risk aversion to this, we will get a more tangible drawdown of the EUR/USD pair compared to the main scenario. ING experts believe that only hawkish comments by the ECB may tangibly reverse the current situation on the euro in terms of asset purchase timing or economic forecasts. Otherwise, the single currency will continue to face a number of factors that promise weakening at the end of the year. "A move beneath even the 1.1200 lows is entirely possible. One potential counter-argument is the seasonal tendency of the dollar to underperform in December, although that may require much calmer markets to materialise," the experts said. However, the markets hope for absence of turbulence as the uncertainty surrounding the new Omicron variant persists. Bloomberg reported on Thursday, citing research by Japanese scientists that the new strain is 4.2 times more contagious at an early stage than the Delta strain. At any moment, there may be other evidence that Omicron is still much more dangerous than expected. The day before, WHO officials said that another 2-3 weeks would be needed to study the new variant of COVID-19 more thoroughly.
The ongoing uncertainty surrounding Omicron is making investors nervous as they wait for decisions on the monetary policy of the leading central bankers. Next week, the Fed and the ECB will face off when the final regulatory meetings of the year are held. In military terms, it is limited to maneuvers and statements by representatives of the "general staff." At a meeting of the ECB planned on December 16, the committee will discuss buying of bonds even after the anti-crisis PEPP program of €1.85 trillion will end, Reuters reported. It is reported that the details of the scheme have not been fully agreed upon yet. Among the likely options, ECB commitments will not go beyond 2022, which is a key issue for conservatives, or hawks, who fear that inflation may not fall below the 2% target level, as is now expected. Nevertheless, some ECB policymakers want to make it clear that asset purchases will continue at least until the end of 2022 in order to suppress expectations of a rate hike. Meanwhile, the market is waiting for the Fed to announce that it will accelerate the pace of winding down its asset purchase program at the next meeting. The more likely this will happen, the higher the US consumer inflation figure for November will be. "Inflation is going to accelerate," RBC Capital Markets strategists said, adding that the annual pace is going to rise and keep rising to push near 7% early in the new year. "As a result, we think that combination means a hike in March is very possible," they said. "The market is pricing in about a 40% chance of that, but we now think it's a bit higher. It's probably closer to a coin flip now."
Recent comments by Fed Chairman Jerome Powell suggest that the regulator is now focusing on price stability to support sustained activity in the labor market, Morgan Stanley analysts said. They updated their expectations for 2022 and now predict that the Fed will raise rates twice: in September and December. The bank's previous forecast had implied that the Fed would not start raising rates until 2023. Morgan Stanley expects a significant strengthening of the dollar and recommends holding long positions in American currency against the euro. According to experts, the divergence in monetary policy of the Fed and the ECB remains not in favor of the euro, especially after reports showing that the European regulator intends to increase the APP at the end of next week's meeting. Fed's rhetoric is much more aggressive compared to the ECB's one, so the downside risks to the euro are quite high. On Friday, the euro remains under pressure and is holding its positions against the dollar. The 14-day RSI is still below 50, supporting the EUR/USD bears. Strengthening the downward momentum will threaten the support formed by the uptrend line at 1.1240. If the pair closes below this level, it may reach 1.1200 and this year's low at 1.1185. Otherwise, a breakthrough of 1.1300 from below (21 EMA) may allow bulls to test 1.1350 and 1.1400. The material has been provided by InstaForex Company - www.instaforex.com |
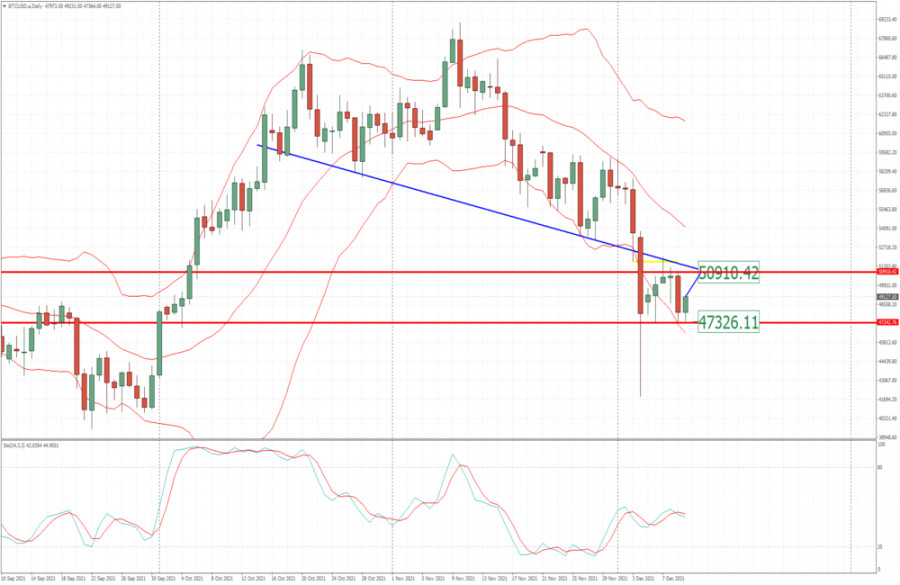
| BTC analysis for December 10,.2021 - Rejection of key support Posted: 10 Dec 2021 05:14 AM PST Technical analysis:
BTC/USD has been trading downside as I expected and the price reached my first downside target at $47,320. Anyway, there is chance for upside rotation due to rejection from support.... Trading recommendation: Watch for buying opportunities due to rejection of key support. Upside target is set at $50,900 Stochastic is showing fresh bear cross but no extreme condition.... Key support is set at the price of $47,325 The material has been provided by InstaForex Company - www.instaforex.com |
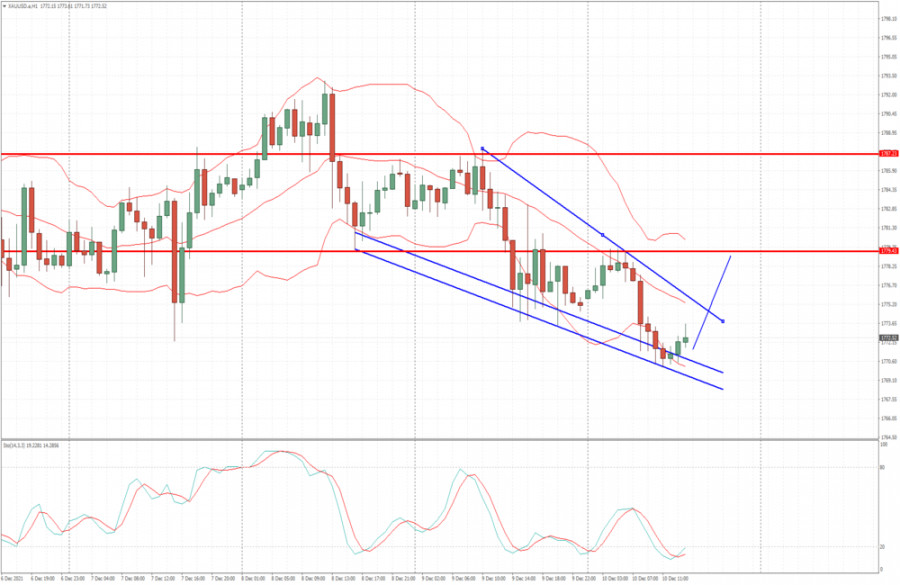
| Analysis of Gold for December 10,.2021 - Falling wedge in play Posted: 10 Dec 2021 05:07 AM PST Technical analysis:
Gold has been trading downside today but there is potential for the rally in the next period due to exhaustion condition intraday. Trading recommendation: Watch for buying opportunities due to possible wedge formation in the background. Upside targets are set at the price of $1,779 and $1,787 Stochastic is showing fresh bull cross and oversold condition, which is another sign and confirmation for the upside continuation. Key support is set at the price of $1,761 The material has been provided by InstaForex Company - www.instaforex.com |
| Video market update for December 10,,2021 Posted: 10 Dec 2021 04:46 AM PST Watch for breakout to the upside on AUD... The material has been provided by InstaForex Company - www.instaforex.com |
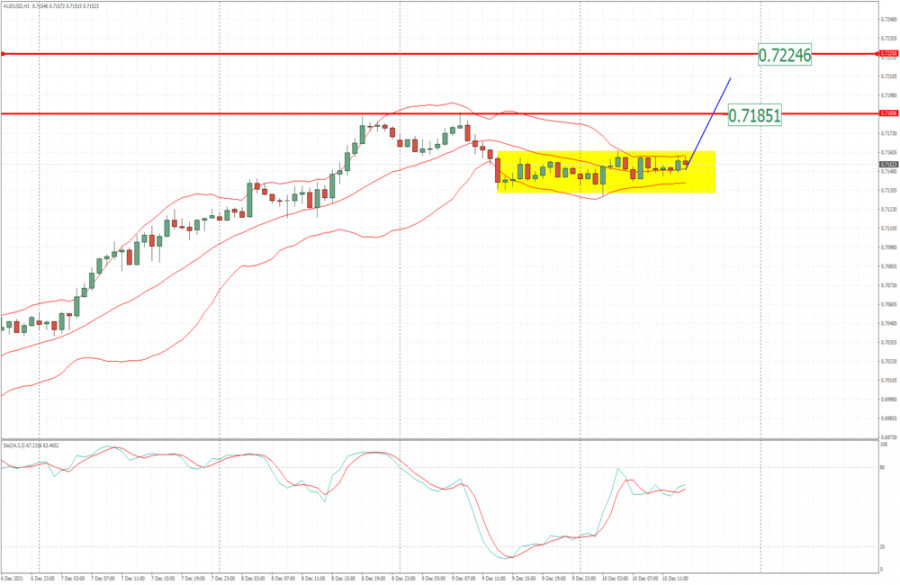
| AUD/USD Update for December 10, 2021 - Watch for the upside continuation Posted: 10 Dec 2021 04:44 AM PST Technical analysis:
AUD/USD has been trading in well defined sideways base but in the short-term upside trend, which is sign that there is potential for the continuation. Trading recommendation: Due to the well defined upside trend, watch for buying opportunities on the upside breakout of the sideways base. Upside targets are set at the price of 0,7185 and 0,7225 Stochastic is showing fresh bull cross, which is another sign and confirmation for the upside continuation. Support level is set at the price of 0,7118 The material has been provided by InstaForex Company - www.instaforex.com |
| Posted: 10 Dec 2021 04:00 AM PST
The ideas for the weakening of the dollar did not work, the US currency index ended the week above 96.00. Buyers are preparing for the Fed's verdict. The technical picture favors the further growth of the greenback and there is still room for maneuver under the 98.00 mark. One of the weakest currencies this week was the British pound. The GBP/USD pair fell sharply after the introduction of new quarantine measures in the UK, which, among other things, provide for the transfer of employees to remote work and the provision of vaccination documents when visiting public places. Weak macro statistics for Britain also did not add a positive to the pound. The deterioration of the epidemic situation will certainly entail a decrease in other indicators, for example, consumer and business activity. In this case, the pound may fall to even lower levels. This is not to mention the consequences of Brexit, which from time to time make themselves felt. Sterling will be vulnerable as long as tensions remain between London and Brussels. This is very noticeable in the EUR/GBP pair, which, by the way, has grown noticeably over the past three weeks. Meanwhile, since the beginning of the year, the quote has been trading in a long-term downward trend. If the downward movement resumes, selling this currency pair from current levels will be a good idea. Today, the economic calendar includes data on UK GDP for October, business activity in the service sector, and the volume of production in the manufacturing sector of the country. Industry plays a big role in the final indicator of GDP, so a high value will be a positive factor for the pound, and vice versa. Friday's weaker data will cause even more pressure on the pound, including in the EUR/GBP pair. The volume of industrial production in October unexpectedly decreased by 0.6%, while analysts announced an increase of 0.1% on a monthly basis. The annual value also went against the forecast. Production expanded by only 1.4%, an increase of 2.2% was expected. The UK economy also grew weaker than expected. The value was 0.1%, which is a sharp slowdown compared to the monthly growth of 0.6% in September. Reuters economists had predicted monthly growth of 0.4%. There is also a noticeable drawdown in annual terms.
"We have always recognized that there may be obstacles on our way to recovery," Finance Minister Rishi Sunak commented on the situation. Indicators of a sluggish economic recovery have become another indication that the Bank of England will not tighten policy at its meeting next week. The sentiment of the pound traders fell, which naturally affected the positioning of the British currency. Based on the failed GDP data, market players made the following conclusion: the rapidly growing inflation rate and Omicron may force the world's fifth largest economy to start shrinking again. Meanwhile, getting the economy out of recession is much more difficult than suppressing rising inflation. The English regulator has already begun to realize this. Perhaps next week investors will hear sharply dovish comments from the Central Bank. Key banking analysts such as Barclays and JPMorgan have gradually begun to push back the forecast of the first rate hike by the Bank of England. Now they have been joined by colleagues from Goldman Sachs. Alternatively, a 15 basis point increase could take place at the February meeting. However, this forecast is more like an excuse and looks unrealistic. Even the most ardent "hawk" in the committee, Michael Saunders, refuses to make predictions and assumptions. First of all, you need to wait for the clarification of the picture on Omicron. However, if the market considers that the increase is still real in February, then the pound is unlikely to be under serious selling pressure. A lot will depend on the rhetoric of the Bank of England. If doubts are expressed, including regarding February, the pound may depreciate more. The target for the GBP/USD pair will be the 1.3000 mark. The material has been provided by InstaForex Company - www.instaforex.com |
| December 10, 2021 : EUR/USD daily technical review and trading opportunities. Posted: 10 Dec 2021 03:47 AM PST
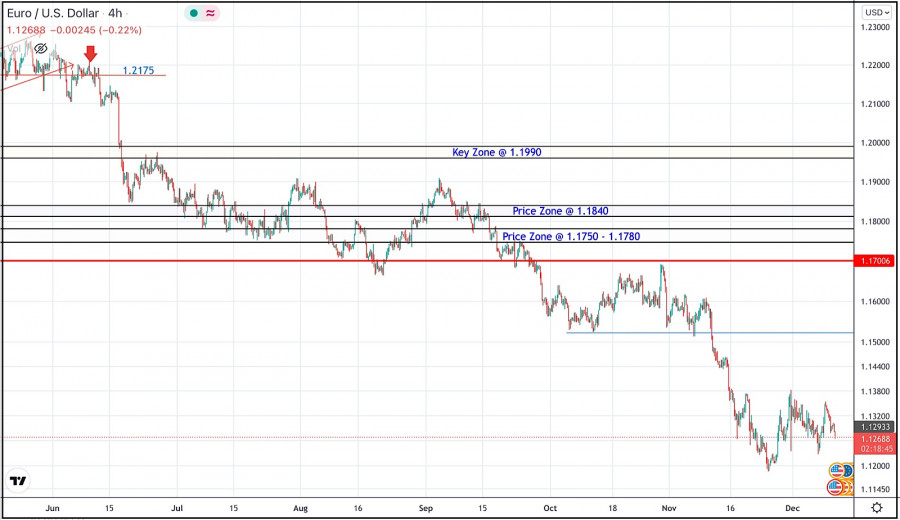
During the past few weeks, the EURUSD pair has been trapped within a consolidation range between the price levels of 1.1700 and 1.1900. In late September, Re-closure below the price level of 1.1700 has initiated another downside movement towards 1.1540 which managed to hold prices for a short period of time before another decline took place towards 1.1200. Currently, the price zone around 1.1500 stands as a prominent supply-zone to be watched for SELLING pressure and a possible SELL Entry upon any upcoming ascending movement. Moreover, it is not advised to add new SELL Entries as the pair already looks oversold. The material has been provided by InstaForex Company - www.instaforex.com |
| December 10, 2021 : EUR/USD Intraday technical analysis and trading plan. Posted: 10 Dec 2021 03:46 AM PST
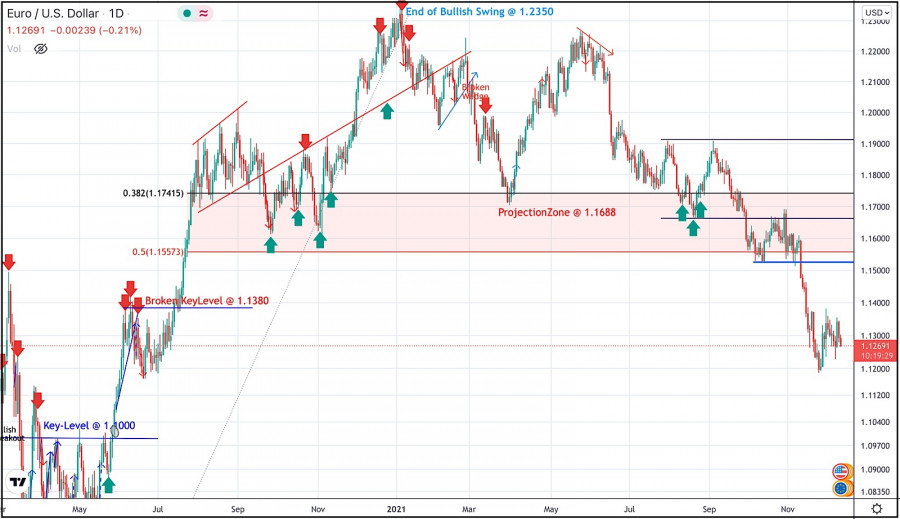
The bullish swing that originated around 1.1650 in August, failed to push higher than the price level of 1.1900. That's why, another bearish pullback towards 1.1650 was executed. However, extensive bearish decline has pushed the EURUSD pair towards 1.1600 and lower levels was reached. Shortly after, significant bullish recovery has originated upon testing the price level of 1.1570. The recent bullish pullback towards 1.1650-1.1680 was expected to offer bearish rejection and a valid SELL Entry. Significant bearish decline brought the EURUSD pair again towards 1.1550 levels which stood as an Intraday Support zone. Hence, sideway movement was demonstrated until quick bearish decline occurred towards 1.1200. Please note that any bullish movement above 1.1500 should be considered as an early exit signal to offset any SELL trades. The price levels around 1.1520 remain a reference zone that needs to be re-visited when the current bearish momentum ceases to exist. The material has been provided by InstaForex Company - www.instaforex.com |


| You are subscribed to email updates from Forex analysis review. To stop receiving these emails, you may unsubscribe now. | Email delivery powered by Google |
| Google, 1600 Amphitheatre Parkway, Mountain View, CA 94043, United States | |


Comments