Forex analysis review
Forex analysis review |
- Mastercard launches solution to enhance Ethereum network
- Bitcoin breaks through support area amid central bank's policy tightening
- EUR/USD analysis on December 17. The week ended without the advantage of the euro currency.
- GBP/USD trading analysis for December 13-17. Fresh COT report (Commitments of Traders). Pound received support from BoE but
- Analysis of the trading week of December 13-17 for the EUR/USD pair. New COT (Commitments of Traders) report.
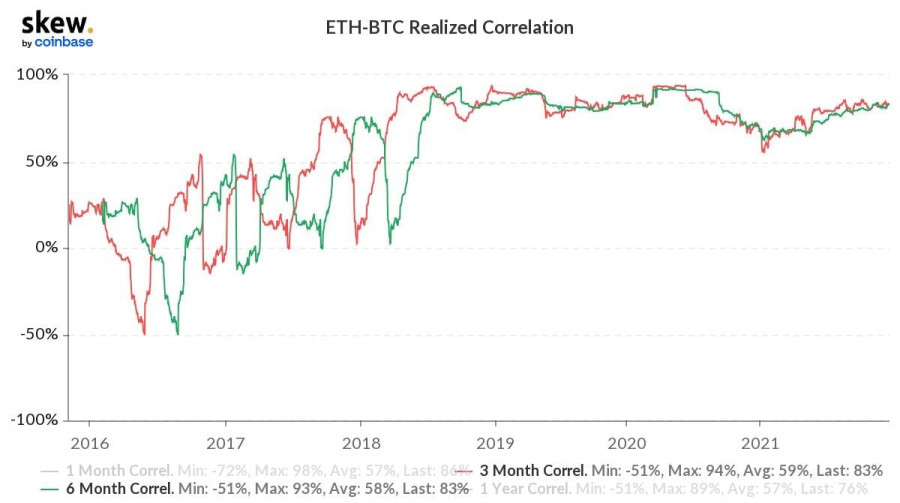
| Mastercard launches solution to enhance Ethereum network Posted: 18 Dec 2021 05:56 AM PST Ethereum continues to be one of the most resilient coins in the current correction. The altcoin has the advantage of a stable audience and gradual profit taking, which cools down demand for the coin and contributes to growth. However, there are also fundamental factors that make the cryptocurrency flexible during market corrections. The launch of the main altcoin network expansion solution was the main news this week. The development and implementation of this solution was done by Mastercard payment system in collaboration with ConsensSys. Thanks to the new algorithms, a significant increase in network transfer capacity, transaction processing speed and fee reduction are expected. Besides, the function of additional data protection by means of building on the basis of zero-disclosure proofs will be implemented. It will be impossible to trace the amount, addresses and other key elements of the transaction. This upgrade brings a lot of positives, but the negatives are worth outlining too. First of all, the scalability of the network will attract new retailers, some of whom will have short-term speculative goals. This will contribute to a decrease in the stability of the asset and increase its volatility. However, this disadvantage is offset by the value of the solution in the long term. Despite the positive news background, etherium is still trading around $3,900. Over the past 24 hours, the asset grew by 3%, but failed to break through the resistance at $4,000. This is primarily due to increased correlation with bitcoin, which has recovered above $47,000, but due to the high level of domination does not give ETH room to move.
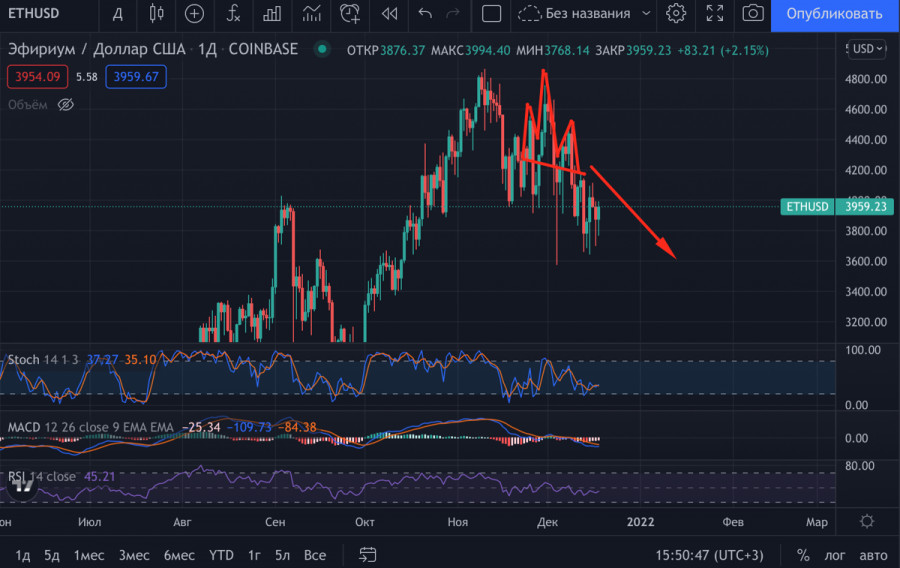
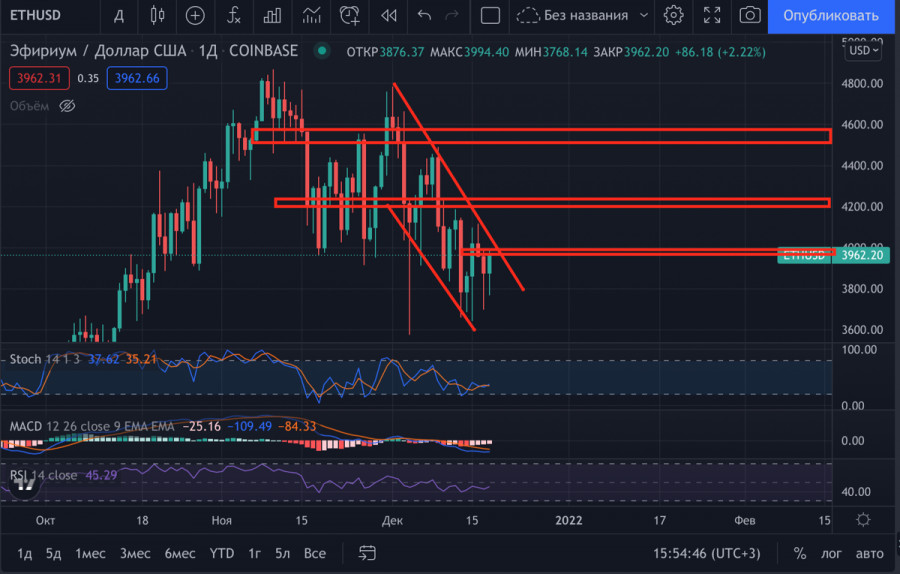
On the daily chart, the decline began after the formation of the head and shoulders pattern, which indicates a reversal of the trend. The potential for downward movement according to the formation passes to the level of $3,400. Further decline is also indicated by the predominance of sellers below $4,000, which can be seen by the daily candlesticks: after the confident formation of a red candlestick, buyers with great difficulty win back positions. At the same time, the cryptocurrency is moving within the local downtrend channel from December 1. ETH's situation is not as critical as BTC's, but the asset needs to fix above $4,000 in the next few days to avoid a deeper correction.
|
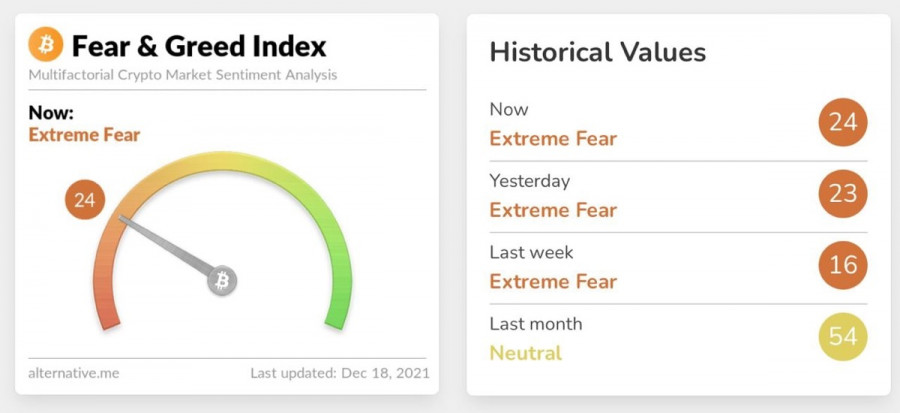
| Bitcoin breaks through support area amid central bank's policy tightening Posted: 18 Dec 2021 04:29 AM PST Bitcoin continues to hover within a wide range of $40,000-$50,000, and gradually decreases to its lower boundary. As of December 17, the cryptocurrency made a bearish breakout of an important support zone in the area of $47,000-$48,000. As of December 18, the asset is trading near $46,800, while testing the support area at $45,700. Bitcoin has maintained its downward trend for the 5th week in a row, and there are no signals that it could make a reversal. Why Bitcoin is weakI would like to highlight two main reasons why the cryptocurrency is having trouble holding key support areas. They are interrelated and are primarily related to the fundamental background of the global economy and the rate of inflation growth. Lack of activity from buyersThe first reason is that the buyers are showing a lack of activity in the market. The scenario resembles the picture of May and July 2021, when bulls also behaved passively and accumulated volumes while the price was testing support zones and declining time after time. At the same time, BTC actively accumulates volumes, which is a sign of a bull market. The Fear and Greed Index is still in the fear zone, so we can't hope to actively buy back the current positions.
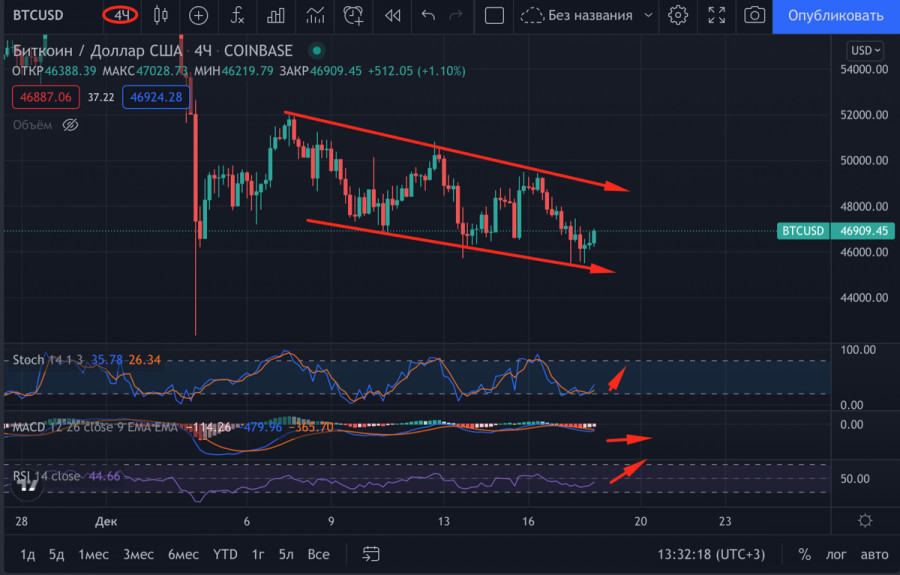
Central Bank policiesThe second reason is the US monetary policy followed by the central banks of developed countries. Due to the worsening rate of inflation of the US dollar, most regulators began to pursue an aggressive policy to curb the depreciation of fiat money. As a result, investors do not consider high-risk assets with increased volatility as an investment. The process of permanent buying and selling of assets should not be confused with the cycle of accumulation, which is now carried out by large investors. With the first option, quotes go up here and now, while the accumulation process involves holding on a long-term basis. Forecast on BTC/USDThe 4-hour chart shows that bitcoin is trading within the local descending channel. After the breakout of $47,000, buyers make an attempt to push the price higher. The Relative Strength Indicator and the stochastic oscillator signaled this. At the same time, the MACD continues a sideways movement with no prerequisites for growth. Therefore, the price's attempt to climb up to $47,000 was unsuccessful and it may hover within the range of $45,000-$47,000. This is also hinted at by the weak buyback, and the weak candlesticks prove this. I assume that the cryptocurrency may start climbing to the $42,000-$45,000 range early next week.
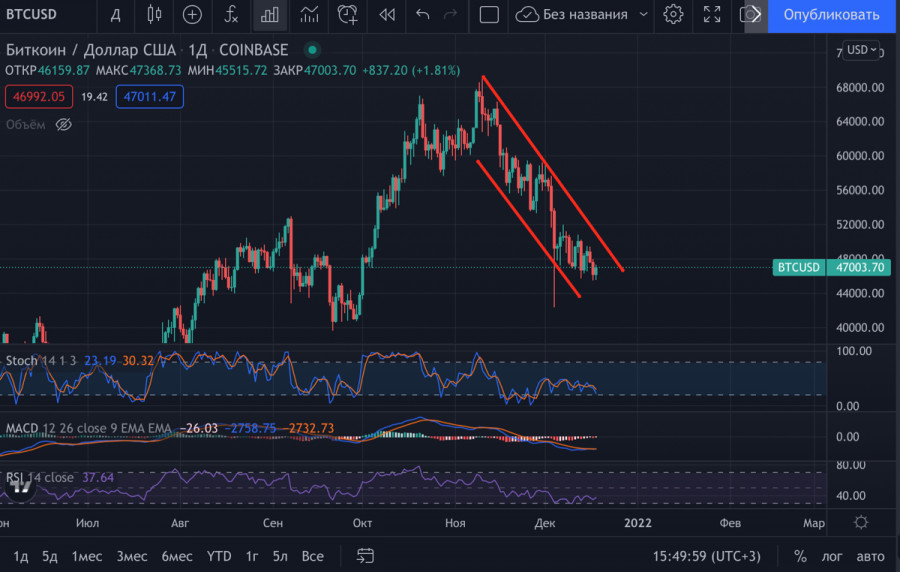
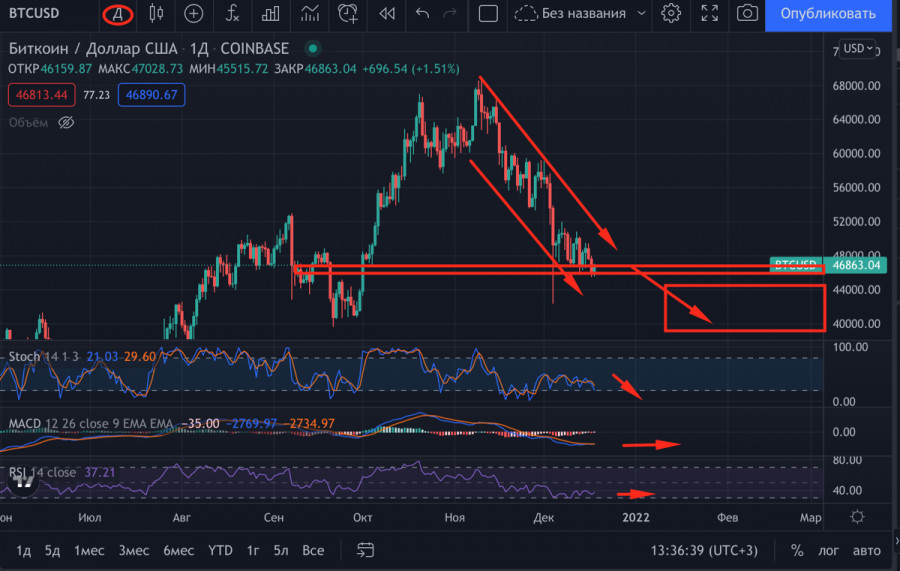
BTC/USD on the daily chartIn general, the situation remains tense as bitcoin continues its downward movement within the downward trading channel from November 9. The trend is still local, but with a retest of $42,000, its potential becomes threatening for the BTC bull market. On the daily chart, technical indicators also show a retest of the $42,000-$45,000 area. The market is waiting for the denouement, where there are two options. In the first, we complete the local downtrend and launch the final fifth wave of growth, or the fall is exacerbated and BTC market risks changing to the bear market.
|
| EUR/USD analysis on December 17. The week ended without the advantage of the euro currency. Posted: 18 Dec 2021 04:17 AM PST
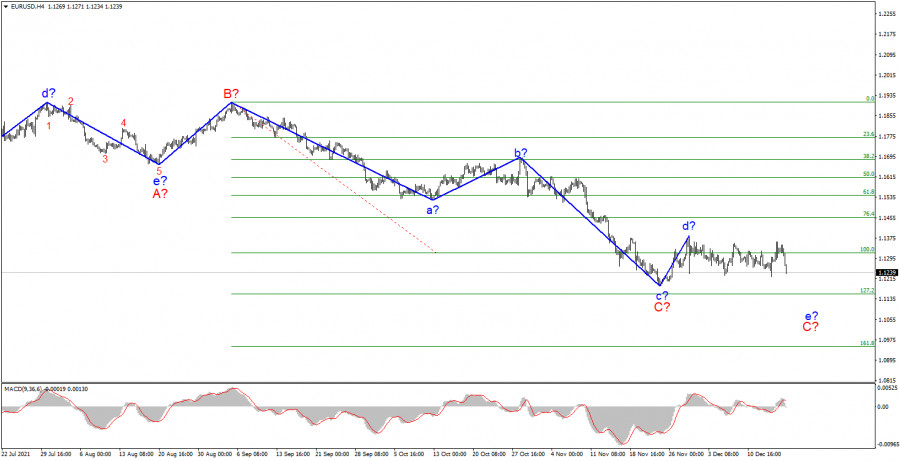
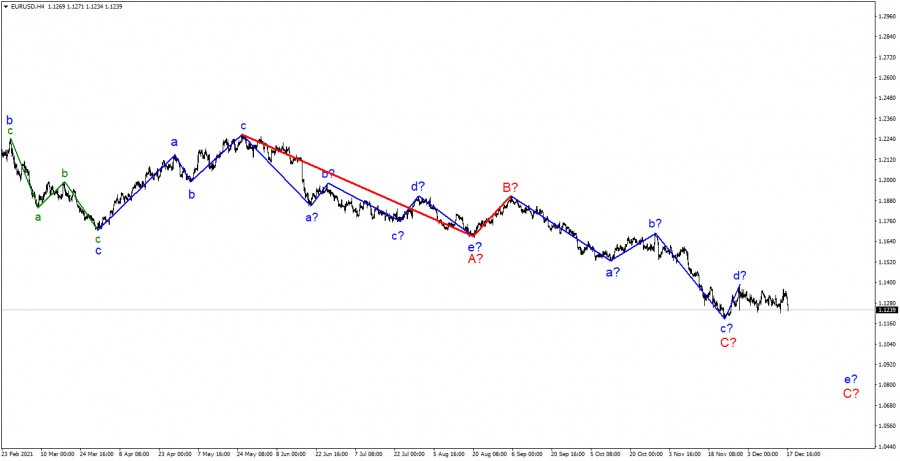
The wave marking of the 4-hour chart for the euro/dollar instrument continues to remain integral and does not require additions. The construction of a descending wave e-C is still questionable, although yesterday's decline in the quotes of the instrument may mean a transition to the construction of this wave. But if this wave does not continue its construction, then wave C will have to be recognized as three-wave and completed. It seems that it should take a five-waveform after all. The wave that originates on November 30 cannot be attributed now either to wave C or to the first wave of a new upward trend segment, if it really is, since neither the peak of wave d-C nor the low of wave c-C have been broken so far. The movement of the instrument is almost horizontal and in the current situation it remains only to wait for the development of the situation. I believe that the euro/dollar and pound/dollar instruments can start building an upward trend section at the same time, but for this you need to determine the wave pattern of the euro currency, since everything looks more or less convincing for the British. The results of the meetings of the central banks did not quite lead to that movement. The news background for the EUR/USD instrument on Wednesday and Thursday was very strong, and on Friday it was practically absent. During the entire last day of the week, only the inflation report in the European Union can be noted. However, it had no effect on the instrument, since the markets were acquainted with its value a couple of weeks ago. The consumer price index rose in Europe to 4.9% in November. There was no more news during the day, so the amplitude of 20 basis points would have looked logical if not for a drop of 100 points in the afternoon. If you look at the entire movement of the instrument during the week, you will not even immediately say that many important events took place during this period. The tool went up by 130 points and down by the same amount, but in general it moved more horizontally. In the picture above, this is perfectly noticeable. And horizontal movement does not make it possible to make an unambiguous conclusion about its belonging to any particular wave and trend area. The Fed and the ECB made important decisions, and the euro currency first received market support, and then the dollar. In general, I want to say that the reaction of the markets to the meetings of central banks turned out to be quite strange and did not clarify anything in the wave markup, but rather confused it even more. Thus, in the current situation, it remains only to wait for developments. The year 2021 is coming to an end and market activity may decline in the next two weeks. Therefore, the wave marking can only become more complicated at this time. General conclusions. Based on the analysis, I conclude that the construction of the descending wave C can be completed. However, the internal wave structure of this wave still allows the construction of another downward, internal wave. Thus, I advise selling the instrument with targets located around the 1.1152 mark, for each MACD signal "down", until a successful attempt to break the peak of wave d.
Senior chart. The wave marking of the higher scale looks quite convincing. The decline in quotes continues and now the downward section of the trend, which originates on May 25, takes the form of a three-wave correction structure A-B-C. Thus, the decline may continue for at least a few more weeks until wave C is fully completed (it should take a five-wave form in this case). The material has been provided by InstaForex Company - www.instaforex.com |
| Posted: 18 Dec 2021 01:06 AM PST GBP/USD analysis on the daily chart
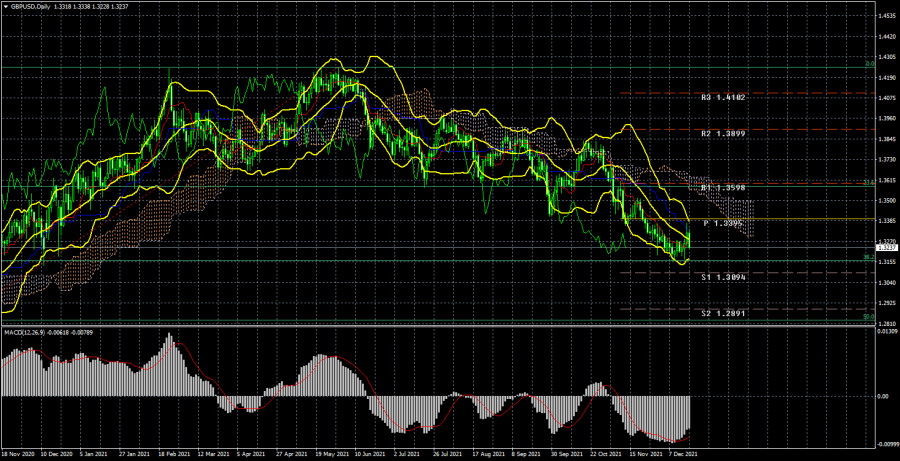
The GBP/USD pair during the current week corrected to the critical line on the daily chart. Thus, the correction was formally started, if not for the fall on Friday. It turns out that the pair performed just a perfect rebound from the Kijun-Sen line and now it can continue the downtrend. Although, the pound has much less reasons to fall than the euro. The Bank of England unexpectedly decided to raise its key rate by 0.15% this week. Thus, the regulator was the first of the three central banks, which increased the rate. From my point of view, this is indeed a hawkish move and the pound sterling was quite reasonably expensive on Thursday. However, the bulls nevertheless couldn't keep the initiative in their hands on Friday, because Fed's decisions also can be called hawkish, and on Wednesday markets didn't consider it necessary to buy the US dollar. Thus, Friday's rise of USD is a repayment of Wednesday's debt. As for the technical picture, during the current week it virtually has not changed. The downtrend is still visible to the naked eye. The pair did not manage to break through the Kijun-sen line even when there were reasons to do so. Thus, the pound also does not show any signals for growth. Though earlier the pair rebounded from the important 38.2% Fibonacci level on the daily chart, so the pair is expected to grow. On the other hand, a breakout of this level may pave the way to 1.2891 and 1.2828 (50.0% Fibonacci). COT report analysis
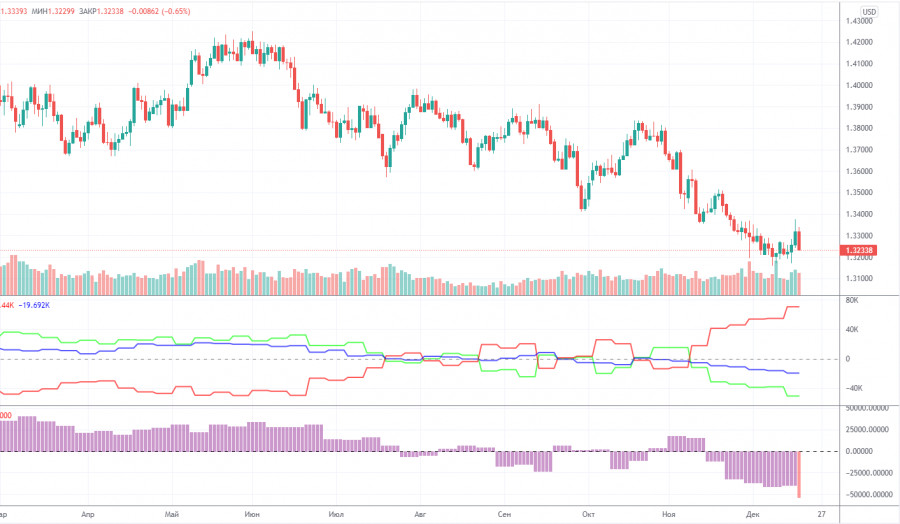
During the last reporting week (December 7 - 13) professional traders' sentiment became more bearish. Professional traders closed 6,700 sell contracts and 20,100 buy contracts during the week. Thus, the net position of Non-commercial traders decreased by 13,400 contracts, which is a lot for the pound. Thus, unlike the euro, the pound, according to the COT reports, continues to fall quite justifiably: the big players continue to sell it off. However, the green and red lines of the first indicator (which mean the net positions of "Non-commercial" and "Commercial" groups) have already moved away from each other. This signals the imminent end of the current trend. However, as in the case with any fundamental assumptions, this hypothesis requires specific technical signals we do not have at the moment. If we do not take into account the increase of the key rate by the Bank of England, then there are no particular fundamental reasons for the growth of the pound at the moment, either. Boris Johnson continues to fall into various scandals, and there are rumors that he may leave his post before the end of the due term. The pandemic in the UK is gaining momentum and the other day an anti-record was set for the daily record-high number of cases. Omicron is also spreading quite rapidly across the country, posing additional risks to the health system and the economy. London, on the other hand, cannot find common ground with Paris and Brussels, which threatens to damage relations with its closest neighbors and lose markets for its products. Unfortunately, there is no positive news yet. Fundamental data analysisThis week the economic data was quite strong in the UK. Unemployment rate declined to 4.2% from 4.3%, wages rose more than expected, claims for unemployment benefits decreased more than expected too, consumer price index grew to 5.1% yoy, retail sales also exceeded market expectations. Only the index of business activity in the service sector did not make traders happy, as it decreased in December, which is not really surprising, as restrictive measures were toughened in the country, and COVID-19 situation does not suggest anything else. Thus, the pound had macroeconomic reasons to grow this week, but as we can see, by the end of the week it fell by 34 points. Thus, the markets still pay more attention to the fundamental background from other countries, which is also quite strong. Market participants still believe that the factor of QE program winding down and increase of rates by the Fed two or three times next year is the most important and significant. Trading plan for December 20 - 24:1) The pound/dollar pair maintains a downtrend. Therefore, buying is still not relevant now. We need to wait for the pair to consolidate above the critical line, and even better - above the Ichimoku cloud. We still believe that the pair may go up by 400-500 pips within the next month, but market participants are not willing to buy the pound yet. 2) Bears continue to hold the pair below the critical line. Support levels of 1.3094 and 1.2891 are the targets for further downtrend now. This week correction to the critical line has taken place, so now nothing prevents the pair from resuming the fall. Especially, taking into account the rebound from the Kijun-sen line. Description of the charts:Price levels of support and resistance (resistance/support), Fibonacci levels - levels, which are the targets for the opening of long or short positions. Traders may place take-profit orders near these levels. Indicators: the Ichimoku cloud (standard settings), Bollinger Bands (standard settings), MACD(5, 34, 5). Indicator 1 on the COT charts - the size of the net position of each category of traders. Indicator 2 on the COT charts - the size of the net position for the "Non-commercial" group. The material has been provided by InstaForex Company - www.instaforex.com |
| Posted: 18 Dec 2021 12:26 AM PST EUR/USD 24-hour TF analysis.
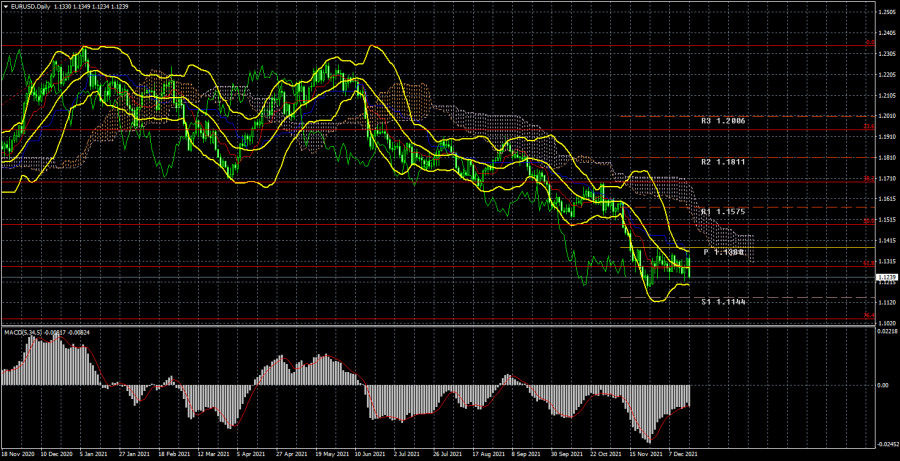
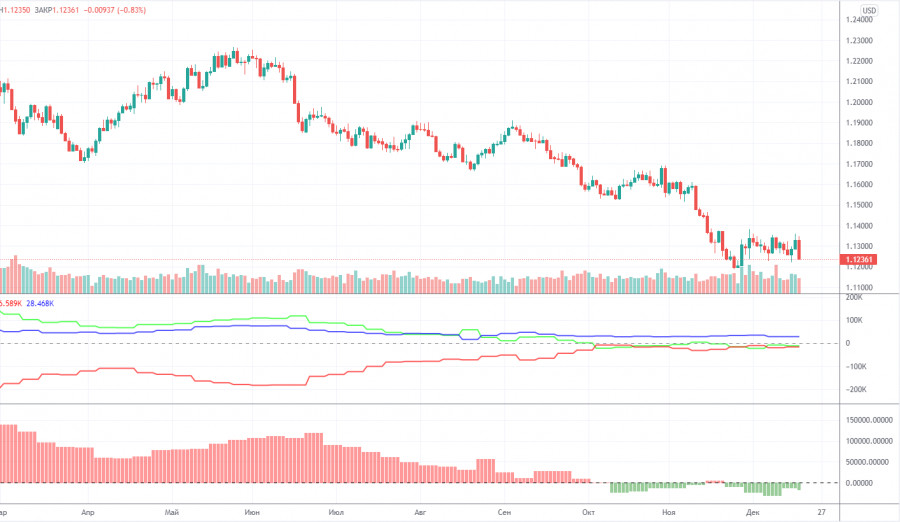
The EUR/USD currency pair has fallen by 75 points during the current week. However, in general, it is visible that the pair has been trading inside a rather narrow side channel for several weeks. The illustration above shows that the quotes are still located near their annual lows, and there are no signs of the end of the downward trend. Thus, after the next trading week, it is impossible to draw any conclusions about the change in the technical picture. The European currency and bulls were probably counting on the meetings of the ECB and the Fed. However, what could be expected from these central banks in terms of supporting the European currency? Even before the announcement of the results, it was clear that the ECB would take a wait-and-see attitude, if not passive. This has been repeated by Christine Lagarde over the past months. The Fed, in turn, was simply obliged to accelerate the pace of asset purchases, which is a "hawkish" decision. However, the ECB also announced that it would curtail its PEPP program in March 2022 (as well as the Fed - QE). Consequently, it can even be concluded that the decisions taken by the two central banks were similar. The only difference not in favor of the euro currency is the expansion of the standard APP incentive program when the emergency PEPP is completed. Thus, we can say that the Fed won, but with a minimum score and due to a penalty kick in the 90th minute. The markets reacted to both meetings with purchases of the pair. However, as it turned out on Friday, the purchases were not strong and short-lived. It was on December 17 that the pair had already collapsed down 100 points as if playing back the results of the Fed and ECB meeting with a delay. Thus, in general, the week ended quite logically. Analysis of the COT report.
During the last reporting week (December 7-13), the mood of non–commercial traders has become a little more "bearish". The "Non-commercial" group of traders now has more short positions than long ones, but this advantage is minimal. The difference is only 18 thousand contracts, which is not so much. During the reporting week, professional traders closed 7.2 thousand buy contracts and 2.8 thousand sell contracts. Thus, the net position of professional players decreased by 4 thousand. However, the main thing to note is that the green and red lines of the first indicator (indicating the change in the net positions of the "Non-commercial" and "Commercial" groups) have been near the zero level for a long time, as well as near each other. In the last few months, when the European currency continued to fall against the dollar, the major players no longer increased their shorts. Thus, the question arises, why did the euro fall at all if market participants did not sell it? Perhaps global factors, such as changes in the balance between the EU and US money supply, are interfering in the exchange rate formation process again. But according to COT reports, we can only conclude that the "bearish" mood is minimal and has not intensified in recent months. Nevertheless, taking into account the fundamental background, the fall in the quotes of the euro currency may continue. And the technical picture does not yet give any reason to assume the completion of the fall of the euro currency. The mood of the major players remains "bearish", but at the same time, the bulls do not seek to change anything. Analysis of fundamental events. As already mentioned, the current week was full of various macroeconomic publications and fundamental events. In addition to the announcement of the results of the ECB and Fed meetings, data on retail sales, industrial production, and business activity in the United States were also published. However, they were naturally in the shadow of two central bank meetings. On Wednesday and Thursday, when the meetings ended, the markets initially bought the euro, which, from our point of view, was not entirely logical. However, a powerful fall in the euro followed on Friday, although no important events were planned for that day. Thus, in the end, everything was put in its place, and the pair may rush down again if the bears have not yet had enough of the sales. As mentioned above, there are no special reasons to assume the completion of the downward trend at this time. Trading plan for the week of December 20-24: 1) In the 24-hour timeframe, the trend remains downward. At the moment, the quotes remain below the Kijun-sen line, and traders continue to show that they are not ready to buy the euro currency. Thus, the downward movement can continue at any time with the targets of the support level of 1.1144 and 1.1038 (76.4% Fibonacci). The fundamental background currently supports the further fall of the euro and the growth of the dollar. The only hope of the euro currency is that all the factors of the dollar's growth have already been worked out by the market. 2) As for purchases of the euro/dollar pair, in the current conditions, they should be considered no earlier than fixing the price above the critical line. And ideally - above the Ichimoku cloud, because the price has already overcome the Kijun-sen several times, but then could not continue moving up. There are no prerequisites for a new uptrend to begin in the near future yet. First of all, technical. Explanations to the illustrations: Price levels of support and resistance (resistance /support), Fibonacci levels - target levels when opening purchases or sales. Take Profit levels can be placed near them. Ichimoku indicators (standard settings), Bollinger Bands (standard settings), MACD (5, 34, 5). Indicator 1 on the COT charts - the net position size of each category of traders. Indicator 2 on the COT charts - the net position size for the "Non-commercial" group. The material has been provided by InstaForex Company - www.instaforex.com |
| You are subscribed to email updates from Forex analysis review. To stop receiving these emails, you may unsubscribe now. | Email delivery powered by Google |
| Google, 1600 Amphitheatre Parkway, Mountain View, CA 94043, United States | |


Comments