Forex analysis review
Forex analysis review |
- Forecast for EUR/USD on December 29, 2021
- Forecast for AUD/USD on December 29, 2021
- Forecast for USD/JPY on December 29, 2021
- US stocks mixed at close of trade; Dow Jones up 0.26%
- Euro: illusory growth or ideal sales conditions. Dollar prepares to rally
- How to trade GBP/USD on December 29? Simple tips for beginners. The pound swayed slightly in the second half of Tuesday
- How to trade EUR/USD on December 29? Simple tips for beginners. An unexpectedly good move in the US session
- Bitcoin, Santa Claus Rally, and the drying up of digital gold from exchanges: all in the best traditions of the bitcoin reputation
- GBP/USD upside clouded, fresh sell-off in play
- USD/CHF new leg higher?
- December 28, 2021 : EUR/USD daily technical review and trading opportunities.
- December 28, 2021 : EUR/USD Intraday technical analysis and trading plan.
- December 28, 2021 : GBP/USD Intraday technical analysis and significant key-levels.
- GBP/USD Wave Analysis on December 28
- EUR/USD Wave Analysis on December 28
- Review of US session on December 28: promising ending of year
- Bitcoin: Current Consolidation is a Speed Bump in a Bull Market
- NZD/USD at crossroads
- USD/CAD drop may end soon
- Technical analysis of EUR/USD for December 28, 2021
- Bitcoin is most profitable financial instrument of 2021: where will the cryptocurrency end this year?
- NFLX weekly analysis.
- XRPUSD short-term technical analysis.
- EURUSD continues to trade sideways.
- Litecoin extends its range, upside invalidated
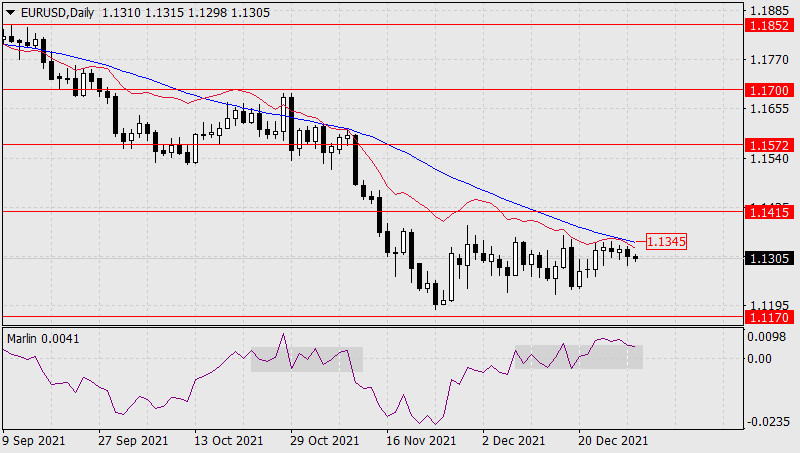
| Forecast for EUR/USD on December 29, 2021 Posted: 28 Dec 2021 07:49 PM PST Over the past day, the price of the single European currency has outlined a tendency to move away from the MACD indicator line on the daily scale chart.
The price does not dare to test the strength of the resistance formed by the merger of two indicator lines - the balance line and the MACD line (1.1345). The signal line of the Marlin Oscillator returns to the range of December 8-21, marked on the oscillator chart with a gray rectangle. The price probably decided to choose the path of less resistance and headed towards the first bearish target of 1.1170. The probability of surpassing the area above the resistance level of 1.1345 has become noticeably lower.
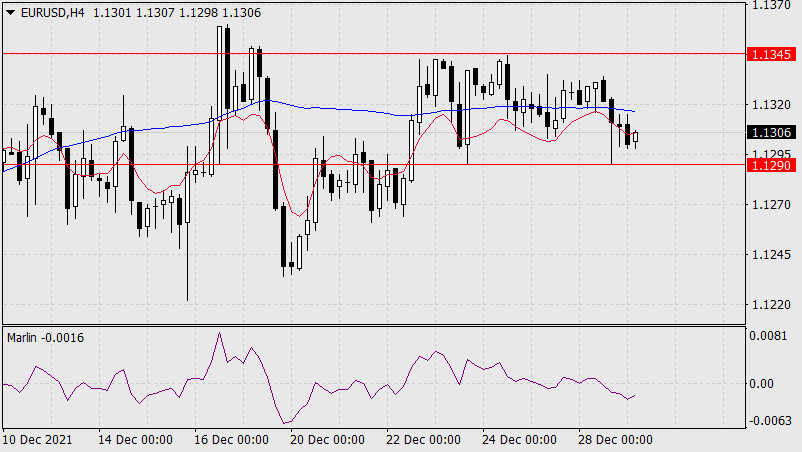
On the four-hour chart, the price returned under the MACD line and managed to settle below it. The price also crossed the balance indicator line. The Marlin Oscillator is in a downward trend zone. The descending scenario becomes the main one. The material has been provided by InstaForex Company - www.instaforex.com |
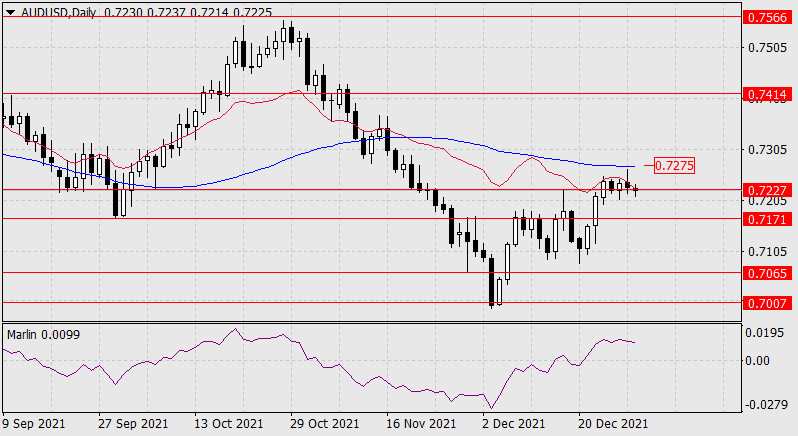
| Forecast for AUD/USD on December 29, 2021 Posted: 28 Dec 2021 07:49 PM PST Yesterday, the Australian dollar attempted to converge with the daily MACD line. The attempt failed and the price quickly returned below the balance indicator line. It ended the day below the balance line, which confirmed our position on the corrective nature of the aussie's entire growth since December 6th. At the moment, the price has gone below the target level 0.7272, closing the day below it will mean settling below the level and its further intention to overcome 0.7171 and head to 0.7065.
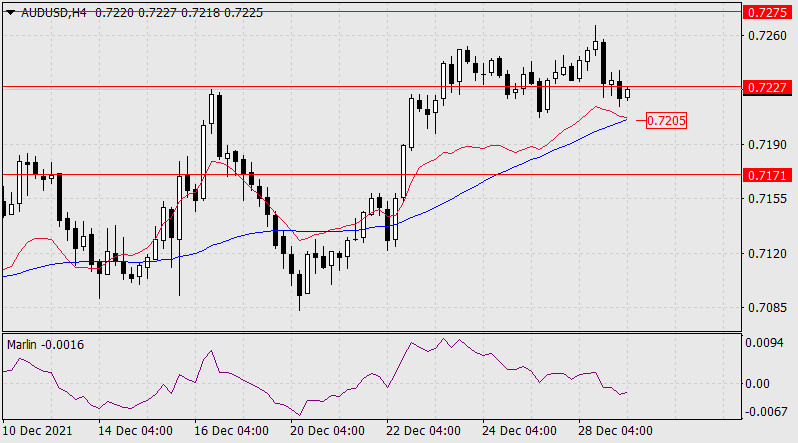
On the four-hour chart, the Marlin Oscillator has entered the negative zone - the territory of the downward trend. Confirmation and reinforcement of this signal will be the price drift under the MACD indicator line, below 0.7205.
|
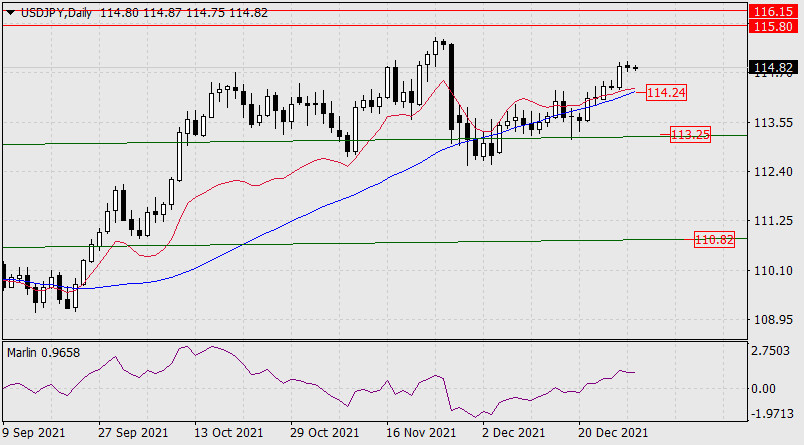
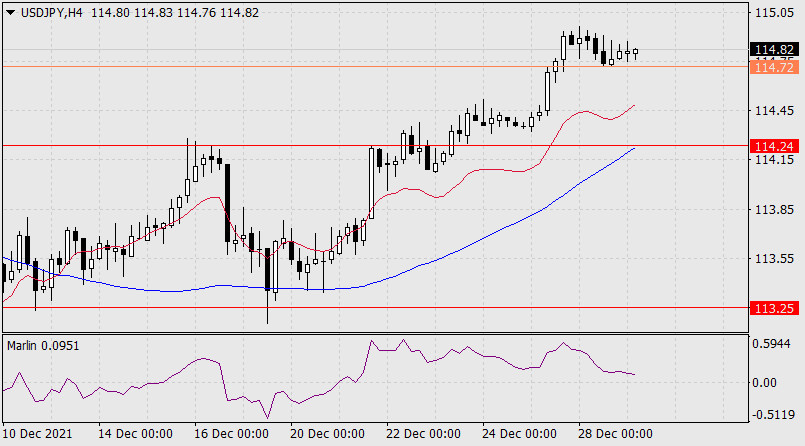
| Forecast for USD/JPY on December 29, 2021 Posted: 28 Dec 2021 07:48 PM PST As a result of yesterday, the USD/JPY pair dropped by 4 points, which can be taken as consolidation after the 50-point growth on Monday. This consolidation also suggests that the price is accumulating potential for further growth. The growth target is the 115.80-116.15 range. Returning under the MACD line (114.24) will reverse the downward trend, its nearest target is 113.25.
On the 4-hour chart, the signal line of the Marlin Oscillator is approaching the zero line, the crossing of which will be an early signal for a reversal. Most likely, this will happen when the price settles below yesterday's low of 114.72, that is, the pair should grow from the current levels in order not to give such an embarrassing signal. However, the correction may develop to the level of 114.24 already noted on the daily chart.
|
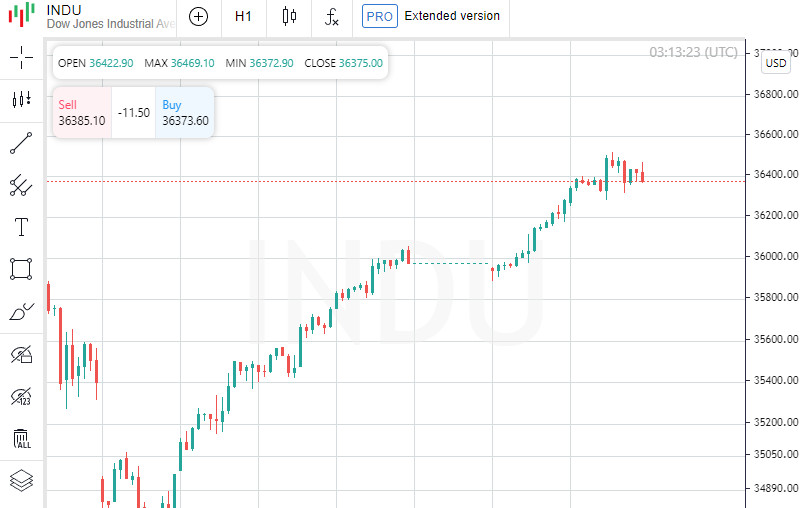
| US stocks mixed at close of trade; Dow Jones up 0.26% Posted: 28 Dec 2021 07:14 PM PST
At the close in New York, the Dow Jones rose 0.26% to a 1-month high, the S&P 500 lost 0.10% and the NASDAQ Composite fell 0.56%. The leaders of growth among the components of the Dow Jones at the end of today's trading were the shares of Walt Disney Company, which rose 2.40 points (1.57%), to close at 155.20. Boeing Co added 1.46 points or 1.46% to end trades at 206.13. Walmart Inc rose 1.44% or 2.02 points to end at 142.78. The biggest losers were Salesforce.com Inc, which fell 1.10% or 2.85 points to end the session at 255.45. Nike Inc is up 0.69% or 1.16 points to end at 166.42, while Apple Inc is down 0.58% or 1.04 points to 179.29. ... The top gainers among the components of the S&P 500 at the end of today's trading were Campbell Soup Company, which rose 2.80% to 43.36, Ball Corporation, which gained 2.59% to close at 94.30, and American Airlines Group shares rose 2.04% to end the session at 18.54. The biggest losers were DexCom Inc, which fell 7.09% to close at 529.50. Etsy Inc shed 3.46% to end the session at 221.73. Penn National Gaming Inc was down 2.89% to 49.34. The leaders of growth among the components of the NASDAQ Composite index at the end of today's trading were shares of Insignia Systems Inc, which rose 64.82% to 19.020, ShiftPixy Inc, which gained 43.09% to close at 1.120, and Pop Culture Group Co Ltd, which were up 35.88% to end the session at 2.31. The biggest losers were Biofrontera Inc, which fell 29.50% to close at 8.10. Powerbridge Technologies Co Ltd shed 25.45% to end the session at 0.6933. Sensus Healthcare Inc was down 22.67% to 6.310. On the New York Stock Exchange, the number of securities that fell (1,725) exceeded the number of those that closed in positive territory (1,531), while the quotations of 136 shares remained practically unchanged. On the NASDAQ stock exchange 2,494 companies fell in price, 1,330 increased, and 182 remained at the level of the previous close. The CBOE Volatility Index, which is based on S&P 500 options trading, fell 0.79% to 17.54, hitting a fresh monthly low. Gold Futures for February delivery was down 0.12% or 2.20 to $ 1.806.60 a troy ounce. Elsewhere in commodities, WTI crude for February delivery rose 0.60%, or 0.45, to $ 76.02 a barrel. Futures contracts for Brent oil for March delivery rose 0.08%, or 0.06, to trade at $ 78.84 a barrel. Meanwhile, on the Forex market, EUR / USD was up 0.04% to hit 1.1313, while USD / JPY was up 0.00% to hit 114.82. The US Dollar Index Futures was up 0.08% at 96.165. The material has been provided by InstaForex Company - www.instaforex.com |
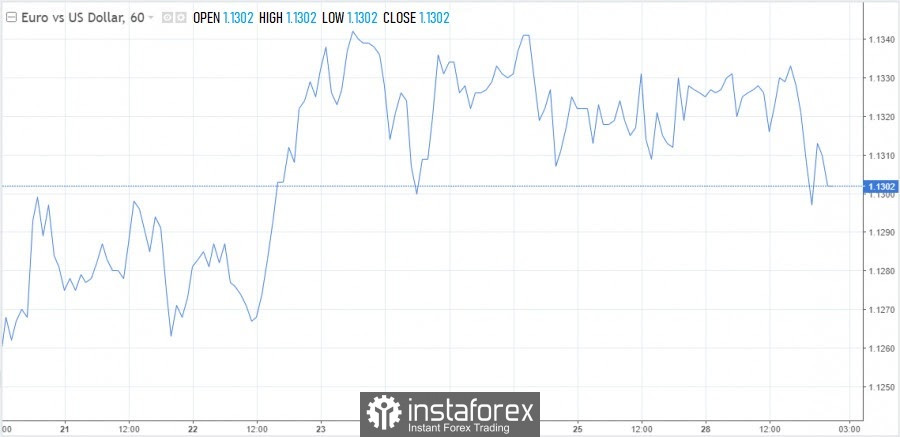
| Euro: illusory growth or ideal sales conditions. Dollar prepares to rally Posted: 28 Dec 2021 01:29 PM PST
The dollar remains under pressure mainly due to the positive mood of stock markets, which increases the demand for high-yielding currencies. There is still nothing interesting happening in the EUR/USD pair, the range of movement has been narrowed in recent sessions. Traders cannot decide on the direction in the conditions of an empty economic calendar and a pre-holiday market. By the end of the week, the borders are expected to expand to 1.1290-1.1360. During the hours of today's US session, it was noticeable that the euro was leaving the so-called comfort zone. Bearish sentiment will increase in the event of a breakdown of 1.1295, and approaching 1.1380 may attract bears. Support levels are marked at 1.1295, 1.1250, 1.1210. Resistances are 1.1345, 1.1380, 1.1425.
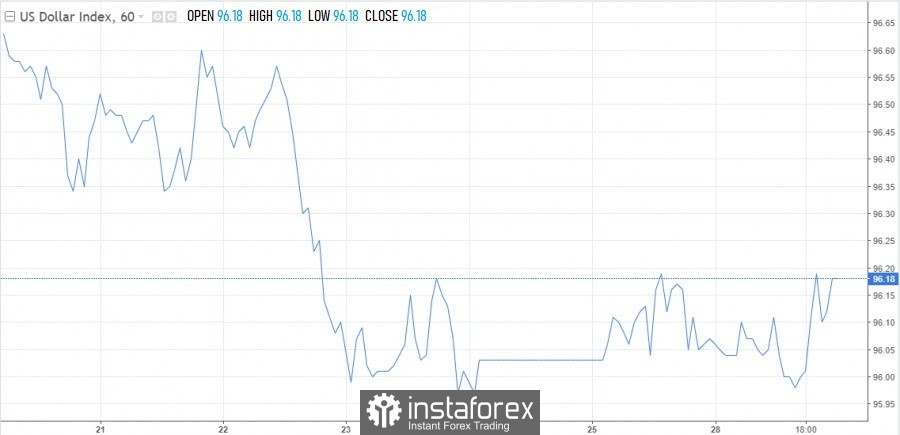
Euro: with an eye on past experience It is quite difficult now to predict the movement of the European currency at the beginning of next year. On the one hand, the euro gave a hint of a possible recovery, on the other hand, it does not have strong fundamental foundations. The euro pulled up following the demand for risk. It is clear that there is a Santa rally and stock markets are growing. However, there is reason to believe that the demand for risk is associated, among other things, with the so-called Omicron optimism. The new strain, despite its high contagiousness, proceeds more easily. A year ago, the euro rose on coronavirus optimism, or rather vaccine optimism. Despite the fact that a new, tougher wave of the pandemic swept the world in November and December, the markets tried to go a few steps ahead, playing off the supposed victory over covid through vaccines. The EUR/USD pair rose from 1.1650 to 1.2350, while the eurozone was plunging into recession at that time due to quarantine measures. Theoretically, the current situation is very similar to past experience. Investors may believe that a new less dangerous strain will displace its more dangerous predecessors, and the pandemic will thus end. As it came, so it went – the problem will go away by itself. As an option, such a scenario can play on the side of the euro, but there are at least two "buts". The dollar has a lot of chances to continue growing in the new year Firstly, it is the Federal Reserve. What if the US central bank decides to raise the rate earlier than the recently predicted deadline, for example, in March or April. A hint in this direction has already been received. A member of the Fed's Board of Governors, Christopher Waller, made it clear yesterday that, given inflation expectations and the state of the labor market, a rate hike would look appropriate immediately after the completion of the asset repurchase process in March. The head of the Federal Reserve Bank of New York, John Williams, gave a similar comment. He did not specify the timing, but said that a rapid reduction in incentives would give the central bank more flexibility to raise rates earlier. This could trigger a new wave of dollar growth in 2022. Secondly, we pay attention to the profitability of treasuries. A decline in the dollar is an increase in yields. Yes, there was an increase last week, but even at the level of 1.5%, they will be considered paradoxically low. On Tuesday, by the way, the yield of "ten-year-olds" decreased and stays near 1.47%. Yields may remain under upward pressure due to the curtailment of incentives and the beginning of an increase in debt placements by the US Treasury after raising the debt limit. There are three auctions this week – on the 27th, 28th and 29th. The Treasury offers historically record volumes of securities to the market: 2-, 5- and 7-year notes, as well as 10-year notes. The total volume of investments at the end of the month will amount to $ 149.96 billion. This will provide short-term support to the dollar, so it is unlikely that the EUR/USD pair will be able to move up out of the range, and not only before the end of the year, but also at the beginning of the next one. As long as the Treasury focuses on bonds, not bills, the dollar should not fall. The dollar index tried to fight back and move further from the 96.00 mark. Given the moderate nature of trading, some exorbitant bounces are not expected now. The bullish character will finally manifest itself and come to the fore at the beginning of next year, then the bulls' potential target will be the 98.00 mark.
|
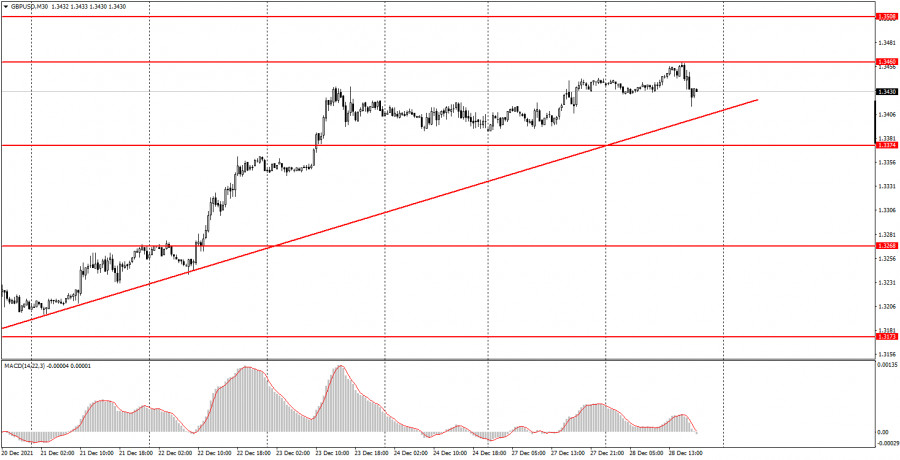
| Posted: 28 Dec 2021 01:29 PM PST Analysis of previous deals: 30M chart of the GBP/USD pair
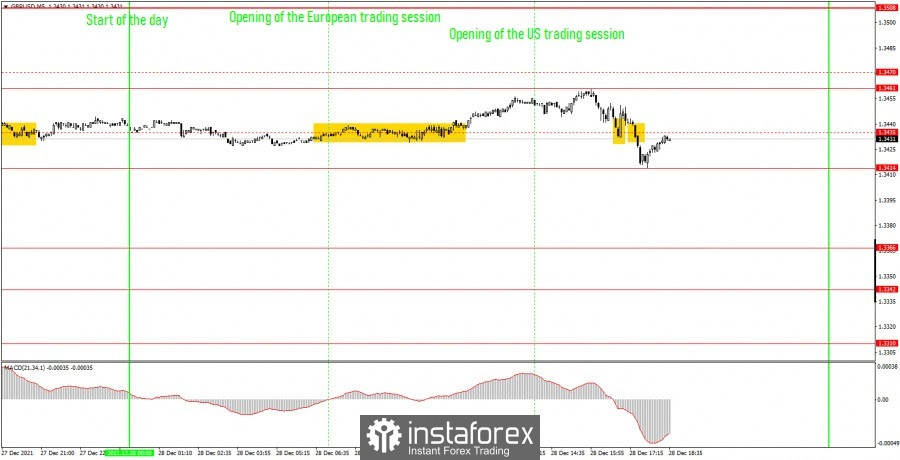
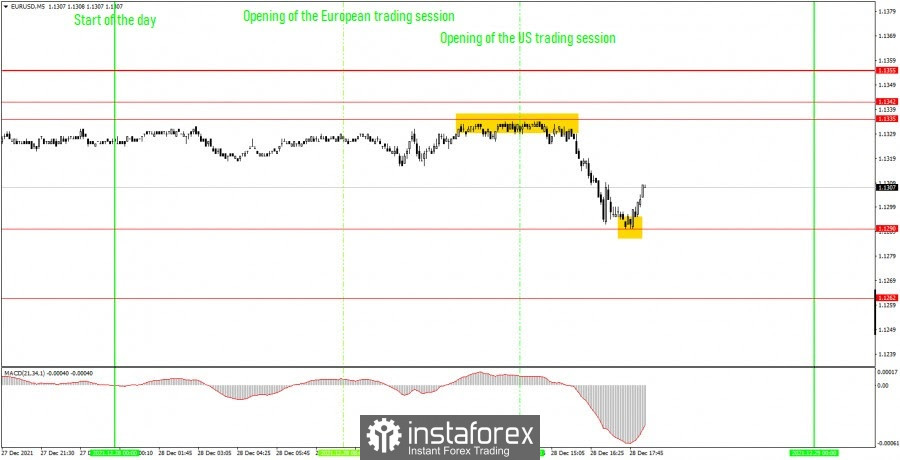
The GBP/USD pair did not trade in the best way on Tuesday, but it should be remembered that the "holidays" are continuing now, so it is hardly worth expecting a strong and trendy movement. The pound/dollar is already overfulfilling the plan. In the last week and a half, an upward trend has formed, which is supported by the trend line. At the moment, it is still relevant. A rebound from it can provoke a resumption of growth in the British currency. At the same time, consolidation below it may signal the completion of the pound's growth and a possible new fall. No important statistics have been released today in either the US or the UK. Volatility during the day was 47 points, which is actually very small. 5M chart of the GBP/USD pair
On the 5-minute timeframe, the movement of the pound/dollar pair on Tuesday was rather strange. At first, the price went up, then fell rather briskly. And these movements are almost impossible to correlate with any events of a fundamental nature. The levels shown in dotted lines in the chart are no longer relevant. Instead of them, levels 1.3414 and 1.3461 have been added. That is, they did not take part in today's trading, as they were formed only today. Thus, all trading signals of the day were formed around the 1.3435 level. Initially, the pair traded along this level for several hours, that is, the buy signal could hardly be called strong and clear, so it could be completely ignored. However, even if novice traders decided to work it out, the deal should have been closed by Stop Loss at breakeven, since the pair could not reach the nearest target level. The next buy signal in the form of a rebound from the level of 1.3435 should have alerted newcomers, since at that moment a candlestick of almost 20 points was formed (about half of the daily volatility). Therefore, long positions should not have been opened here either. The third signal - to sell - should also be ignored, since before that two false signals had already been formed near this level. How to trade on Wednesday: The upward trend continues at the 30-minute TF. Thus, in case of a clear price rebound from the trend line, we recommend opening long positions with 1.3460 as the target. And in case this level is surpassed, keep these deals open at the 5-minute TF. There are a sufficient number of levels on the lower chart, and the level of 1.3414 can still be updated if today's low is below it. In general, tomorrow it is recommended to trade at the levels of 1.3366, 1.3414, 1.3461, 1.3508. The fundamental background and macroeconomic events, it can be considered, will again be absent in both the UK and the US. Thus, novice traders will have nothing to analyze tomorrow. You can, of course, pay attention to the report on unfinished transactions for the sale of housing or on the balance of foreign trade, but the probability of their working out by the market is less than 10%. Based on this, volatility is likely to remain low. Whether the upward trend continues will depend on the behavior of the pair around the trend line. On the chart: Support and Resistance Levels are the Levels that serve as targets when buying or selling the pair. You can place Take Profit near these levels. Red lines are the channels or trend lines that display the current trend and show in which direction it is better to trade now. The MACD indicator consists of a histogram and a signal line. When they cross, this is a signal to enter the market. It is recommended to use this indicator in combination with trend lines (channels and trend lines). Important speeches and reports (always contained in the news calendar) can greatly influence the movement of a currency pair. Therefore, during their exit, it is recommended to trade as carefully as possible or exit the market in order to avoid a sharp price reversal against the previous movement. Beginners on Forex should remember that not every single trade has to be profitable. The development of a clear strategy and money management are the key to success in trading over a long period of time. The material has been provided by InstaForex Company - www.instaforex.com |
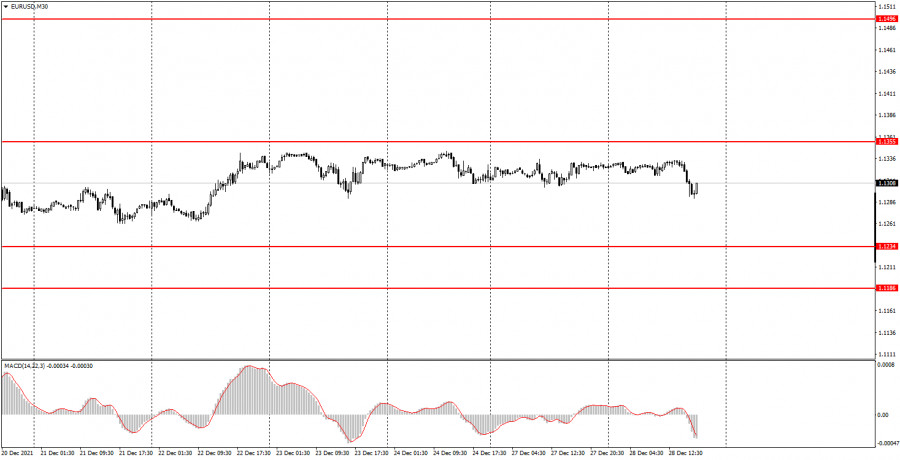
| Posted: 28 Dec 2021 01:29 PM PST Analysis of previous deals: 30M chart of the EUR/USD pair
The EUR/USD pair continued to move inside the horizontal channel on Tuesday, but this should not surprise anyone. Traders now have neither the desire nor the ability to actively move the EUR/USD pair. No macroeconomic reports (at least not important) released on Tuesday. No important messages from the European Union or America either. Thus, even the small surge of activity that occurred in the US session cannot be added to any event. Moreover, it looks "toylike" on the 30-minute TF. Therefore, everything remains the same on the current timeframe. There are no changes and, probably, they could not have been, given the festive status of this week. 5M chart of the EUR/USD pair
On the 5-minute timeframe, very unexpectedly for many, the pair formed two almost perfect trading signals. However, first let's look at the levels. Basically, only one level is new - 1.1335. This level is Monday's high and should have been set this morning, since last night it was still unclear exactly where the peak of the day would be. As a result, the euro/dollar pair bounced from this level with an error of 1 point today. And novice traders could work out this sell signal with short positions, the opening of which was fully justified. As a result, the pair dropped to the level of 1.1290, which was previously on the chart, and just bounced off it perfectly, having already formed a buy signal. At this point, it was necessary to close short positions in the profit of 30 points. They could also close at the minimum Take Profit, which is 30 points. The buy signal could also be worked out, as it was quite strong. However, it was formed quite late, so we would not insist on opening long positions at this moment. However, if the newcomers decided to work it out, they could earn another dozen points of profit. How to trade on Wednesday: An absolutely horizontal trend persists on the 30-minute timeframe. In other words, a flat. Thus, it is still recommended to trade on this TF for a rebound or breakthrough of its upper or lower limit. These are the levels of 1.1234 and 1.1355. However, now the price is exactly between these levels, and it is unlikely that any of them will work out in the near future. Thus, it is better to trade on a 5-minute timeframe now, where there are a little more levels. We remind novice traders that you can start opening deals with the opening of the European trading session. All the most important levels are plotted on the chart and at this time they are: 1.1262, 1.1290, 1.1335-1.1342 and 1.1355. So far, we do not see a reason for the price to go beyond the horizontal channel. We also remind you that for any transaction, Take Profit of 30-40 points and Stop Loss should be set to breakeven after passing 15 points in the right direction. However, the transaction can also be closed manually, if the situation requires it. For example, if an important report is going to be published or it is nearing evening, then it is preferable to close all transactions and leave the market. On the chart: Support and Resistance Levels are the Levels that serve as targets when buying or selling the pair. You can place Take Profit near these levels. Red lines are the channels or trend lines that display the current trend and show in which direction it is better to trade now. The MACD indicator (14,22,3) consists of a histogram and a signal line. When they cross, this is a signal to enter the market. It is recommended to use this indicator in combination with trend lines (channels and trend lines). Important speeches and reports (always contained in the news calendar) can greatly influence the movement of a currency pair. Therefore, during their exit, it is recommended to trade as carefully as possible or exit the market in order to avoid a sharp price reversal against the previous movement. Beginners on Forex should remember that not every single trade has to be profitable. The development of a clear strategy and money management are the key to success in trading over a long period of time. The material has been provided by InstaForex Company - www.instaforex.com |
| Posted: 28 Dec 2021 01:29 PM PST
There are only 1.3 million bitcoins left on crypto exchanges before the New Year. Cryptorank conducted a complex ornate analysis, where it was shown that on the eve of the New Year, only 6 percent of the total circulation of bitcoins remained on crypto exchanges. In total, there are currently 18.9 million coins in active circulation. On the eve of the New Year, bitcoin is running out of crypto exchanges. Until now, this has not been observed on such a scale. Many analysts are sure that there is nothing terrible or foreshadowing trouble in this. This phenomenon is always observed after halving, which was observed in 2020. Most of the bitcoins are on the US majority crypto exchange coinbase. However, in December, a significant decrease in the dominance of bitcoin wallets on coinbase can be observed. There were twice as many on the coinbase crypto exchange than on all other well-known crypto exchanges. However, over the year, dominance decreased from 50 to 40.6%. This report by Cryptorank followed a galaxy of positive price indicators that could provoke further growth of bitcoin at the beginning of the first quarter of 2022. Illiquid bitcoins are reduced in circulation and freeze for the winter. The total supply that circulates in bitcoins is moving from a liquid state to an illiquid one, now equal to 100,000 Satoshi per month. The lion's share of bitcoin is now stored in cold storage, and the exchange offer is significantly reduced. December figures show that there are fewer and fewer bitcoins on exchanges. Investors are massively withdrawing their digital gold from giant crypto exchanges. Only some companies, as well as a small number of speculators and investors, continue to store bitcoin on exchanges. It may follow from this that the illiquid amount of bitcoins may be even lower. The creator of Binance, Changpeng Zhao, aka CZ, for example, warmly welcomes the practice of such asset redistribution. Those 6% of bitcoins that are on exchanges are out of circulation, they can be a catalyst for illiquid supply. In the market, due to the New Year holidays, you can observe an increased pre-New Year mood, inspiration. This picture can be called the Santa Claus Rally, where exactly at this period of time there are most transactions in bitcoin and other alts. However, bitcoin has sunk to $48,900 today, and so far nothing foreshadows that bitcoin will leave the $50,000 zone and close this year on a positive note. The material has been provided by InstaForex Company - www.instaforex.com |
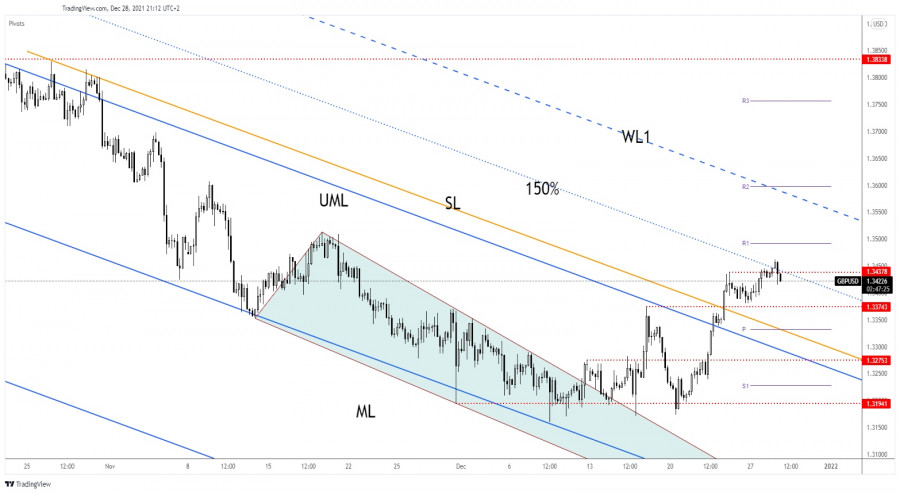
| GBP/USD upside clouded, fresh sell-off in play Posted: 28 Dec 2021 12:55 PM PST The GBP/USD pair plunged in the last hours. It was traded at 1.3422 level at the time of writing below 1.3461 today's high and above 1.3414 today's low. In the short term, the pressure is high as the Dollar Index tries to come back higher. Today, the UK banks were closed in observance of Boxing Day. Fundamentally, the USD received a helping hand from the US data earlier today. The HPI registered a 1.1% growth versus an expected increase of 0.9%, while the Richmond Manufacturing Index was reported at 16 points above 11 points expected. GBP/USD false breakout
GBP/USD failed to stay above 1.3437 and the 150% Fibonacci line which is a signal that the upside movement could be over. Closing below 1.3414 today's low may signal a potential deeper drop towards the 1.3374 static support. As you already know from my previous analysis, GBP/USD could extend its upwards movement if it makes a valid breakout above 1.3437 and above the 150% line. At the time of writing, the breakout above these obstacles seemed invalidated. GBP/USD predictionIn the short term, we cannot exclude a temporary decline. Still, if the rate comes back and stabilizes above 1.3437 and above the 150% Fibonacci line, GBP/USD may resume its upwards movement towards 1.35 psychological level and up to the warning line (WL1). In my opinion, as long as it's traded above 1.3374, GBP/USD could still resume its growth as the bias remains bullish in the short term. The material has been provided by InstaForex Company - www.instaforex.com |
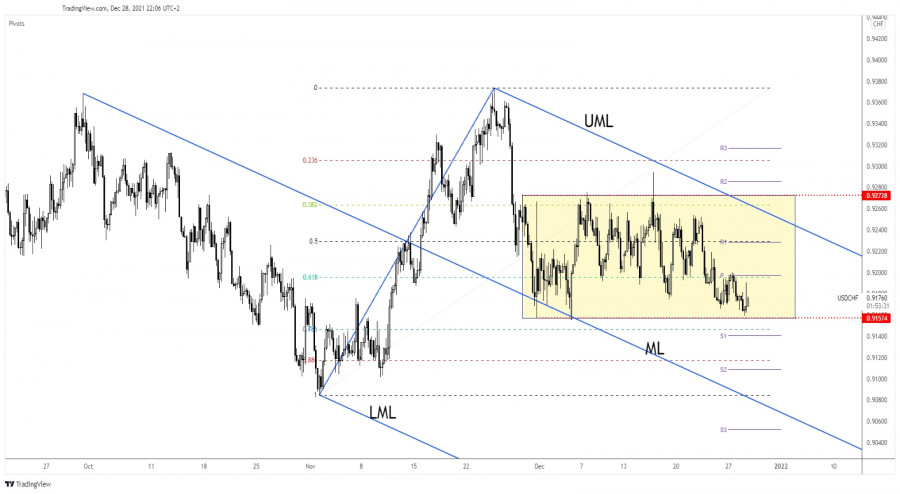
| Posted: 28 Dec 2021 12:54 PM PST The USD/CHF pair dropped but it's still trapped within a range pattern. It was located at 0.9175 level at the time of writing. In the short term, the pressure is still high as the Dollar Index seems undecided. DXY rebounded in the last hours, that's why USD/CHF recovered a little. The HPI and the Richmond Manufacturing Index came in better than expected today helping the USD to recover. Tomorrow, the US Pending Home Sales is expected to report a 0.6% growth, the Prelim Wholesale Inventories may raise by 1.5%, while the Goods Trade Balance is likely to drop from -82.9B to -89.0B. USD needs strong support from the US economy to be able to dominate the currency market. USD/CHF stands above 0.9157 support
USD/CHF dropped after its failure to reach and retest the level of 0.9272 or to approach the upper median line (UML). DXY's downside movement after being rejected at the level of 96.64 forced the USD to depreciate. Technically, the pair stands above the 0.9157 support. The range pattern between 0.9157 and 0.9272 levels remains intact. A bullish pattern here or a false breakdown with great separation may announce a new bullish momentum. USD/CHF predictionA valid breakdown below 0.9157 and escaping from the range pattern may signal a potential deeper drop. On the contrary, staying above 0.9157 and registering a false breakdown with great separation or a bullish engulfing may announce potential growth. Actually, I believe that coming back and stabilizing above the weekly pivot point (0.9197) may activate further growth. Also, a further sideways movement towards the upper median line (UML) is favored if the pair stays above 0.9157. The material has been provided by InstaForex Company - www.instaforex.com |
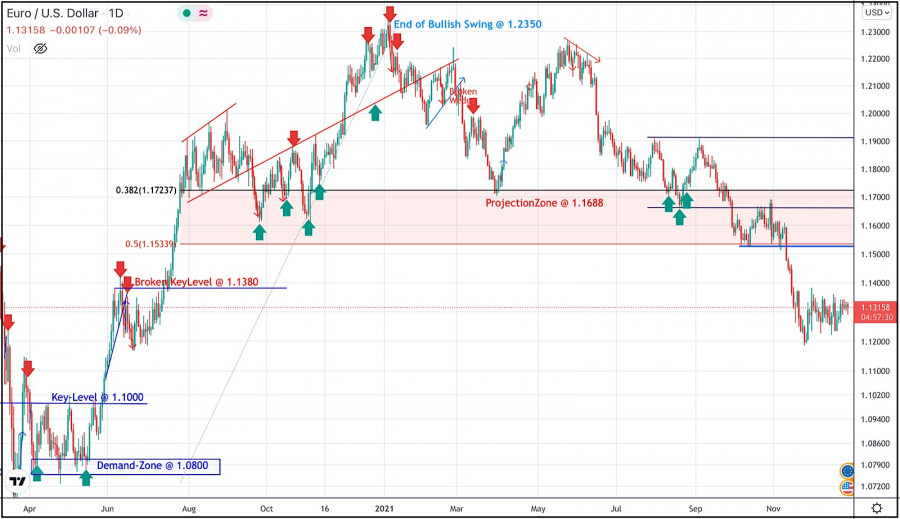
| December 28, 2021 : EUR/USD daily technical review and trading opportunities. Posted: 28 Dec 2021 09:19 AM PST
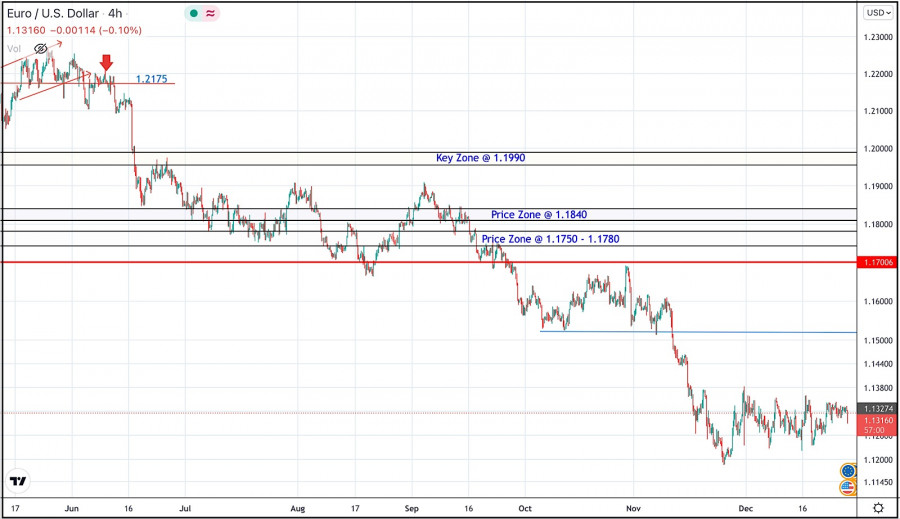
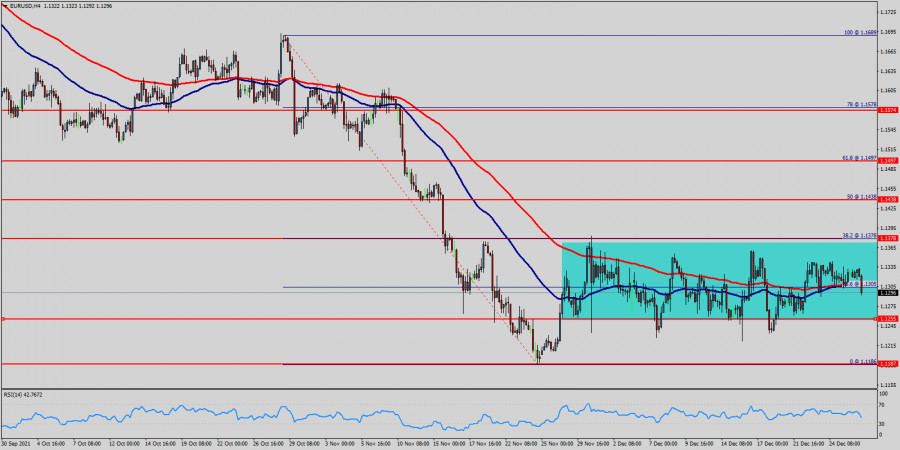
During the past few weeks, the EURUSD pair has been trapped within a consolidation range between the price levels of 1.1700 and 1.1900. In late September, Re-closure below the price level of 1.1700 has initiated another downside movement towards 1.1540. Price levels around 1.1700 managed to hold prices for a short period of time before another price decline towards 1.1200. Currently, the price zone around 1.1500 stands as a prominent supply-zone to be watched for SELLING pressure and a possible SELL Entry upon any upcoming ascending movement. Moreover, it is not advised to add new SELL Entries as the pair already looks oversold. The material has been provided by InstaForex Company - www.instaforex.com |
| December 28, 2021 : EUR/USD Intraday technical analysis and trading plan. Posted: 28 Dec 2021 09:19 AM PST
The bullish swing that originated around 1.1650 in August, failed to push higher than the price level of 1.1900. That's why, another bearish pullback towards 1.1650 was executed. However, extensive bearish decline has pushed the EURUSD pair towards 1.1600 and lower levels was reached. Shortly after, significant bullish recovery has originated upon testing the price level of 1.1570. The recent bullish pullback towards 1.1650-1.1680 was expected to offer bearish rejection and a valid SELL Entry. Significant bearish decline brought the EURUSD pair again towards 1.1550 levels which stood as an Intraday Support zone. Hence, sideway movement was demonstrated until quick bearish decline occurred towards 1.1200. Please note that any bullish movement above 1.1500 should be considered as an early exit signal to offset any SELL trades. The price levels around 1.1520 remain a reference zone that needs to be re-visited when the current bearish momentum ceases to dominate. The material has been provided by InstaForex Company - www.instaforex.com |
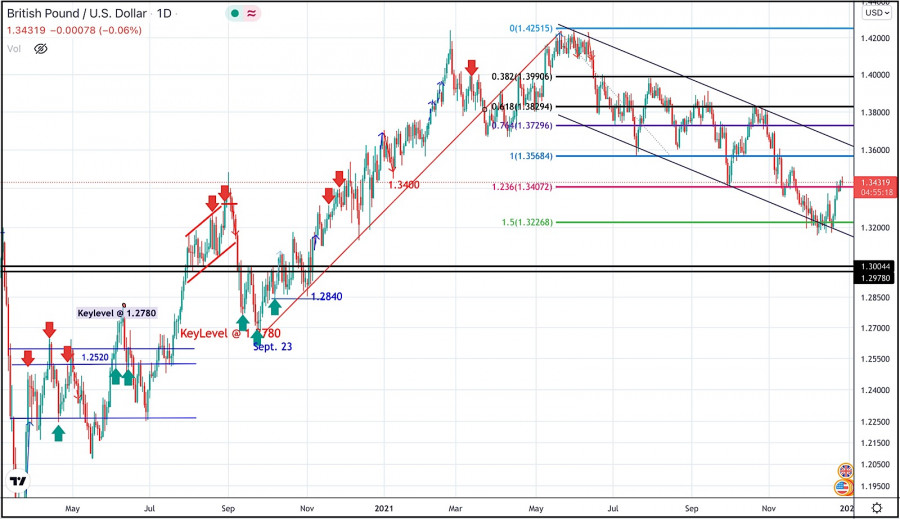
| December 28, 2021 : GBP/USD Intraday technical analysis and significant key-levels. Posted: 28 Dec 2021 09:18 AM PST
The GBPUSD pair has been moving sideways with some bearish tendency while bearish breakout below 1.3600 was needed to enhance further bearish decline. Bearish breakout below 1.3700 enabled quick bearish decline to occur towards 1.3400 which corresponded to 123% Fibonacci Level of the most recent bearish movement. This was a good entry level for a corrective bullish pullback towards 1.3650 and 1.3720 which was temporarily bypassed. Shortly after, the pair was testing the resistance zone around 1.3830 where bearish pressure originiated into the market. Currently, the intermediate-term outlook remains bearish as long as the pair maintains its movement within the depicted channel below 1.3400. More bearish extension took place towards 1.3220 where the lower limit of the current movement channel came to meet with Fibonacci level. Conservative traders should have taken BUY trades around 1.3200 price levels as suggested in previous articles. Current BUYERS are looking towards 1.3570 and 1.3600 as the next target levels to have some profits off the trade. Moreover, the price level of 1.3570 stands as a key-resistance to be watched for bearish reversal if some bearish signs existed upon testing. The material has been provided by InstaForex Company - www.instaforex.com |
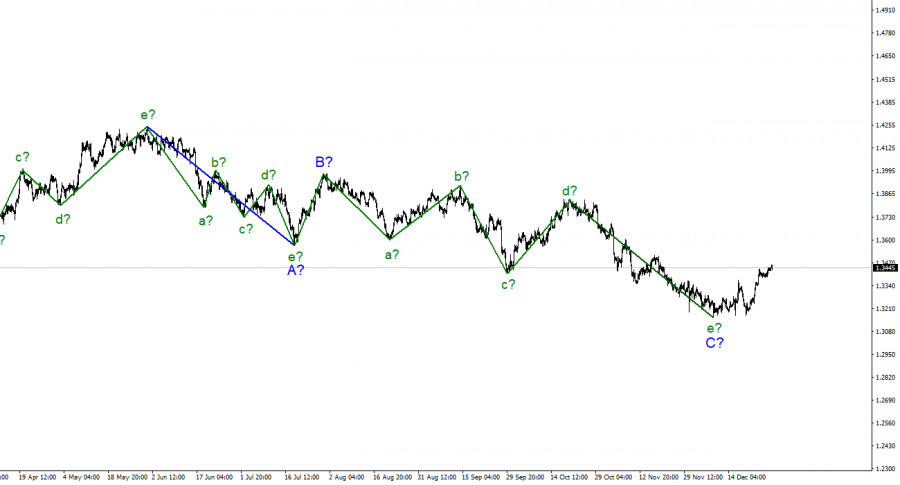
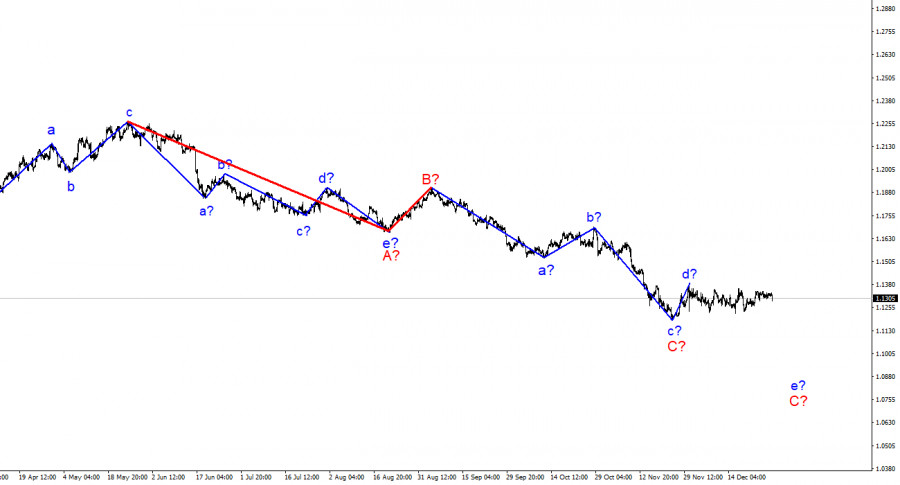
| GBP/USD Wave Analysis on December 28 Posted: 28 Dec 2021 09:05 AM PST
The wave pattern for the Pound/Dollar instrument continues to look quite convincing. The increase in quotes in recent weeks suggests the construction of wave D. However, the current increase in quotes can also be interpreted as the first wave of a new upward trend segment. A three-wave structure is already visible inside this wave. If it is still wave D, then this "fairy tale" may end for the British pound. If not, then the increase of the instrument will resume with targets located around 36th and 38th figures. An unsuccessful attempt to break through the 50.0% Fibonacci level, however, indicates that the markets are not ready for further purchases. That is, it is likely that the construction of the proposed wave D is completed. If so, then now the construction of a new downward wave E can begin with targets located much lower than the low wave C. That is, much lower than the 31st figure. Britain is not going to impose restrictions until the New YearThe exchange rate of the Pound/Dollar instrument moved rather weakly on Tuesday and then began to decline, which currently amounts to 40 basis points. This decrease is not yet able to have an impact on the wave pattern. It is also quite difficult for me to link the rise of the dollar to the news background. It is unlikely that the markets decided to react to the housing price index or the Richmond manufacturing index in the United States. At the same time, the UK announced that quarantine would not be introduced until the New Year. Health Secretary Sajid Javid said that the government is closely monitoring the dynamics of Omicron and it has not changed over the Christmas period. Javid noted that people still need to remain vigilant and cautious, and also did not rule out that restrictions will be introduced in January. This issue will be resolved based on the statistics of Omicron cases. If it worsens, the government may decide to impose quarantine restrictions. How tough they will be is not yet reported. Javid also called on Britain to celebrate the New Year in the fresh air, that is, on the street. And if they want to gather at home, then provide air circulation on the premises. General conclusions The wave pattern of the Pound/Dollar instrument looks quite convincing now. The supposed wave C completed its construction, but wave D could also complete its construction. Thus, now I would advise selling the instrument with targets located near the calculated marks of 1.3272 and 1.3043, which corresponds to 61.8% and 76.4% by Fibonacci levels, for each MACD signal "down" in the expectation of building a wave E. A successful attempt to break through the 50.0% level will indicate the readiness for further purchases of the British pound. |
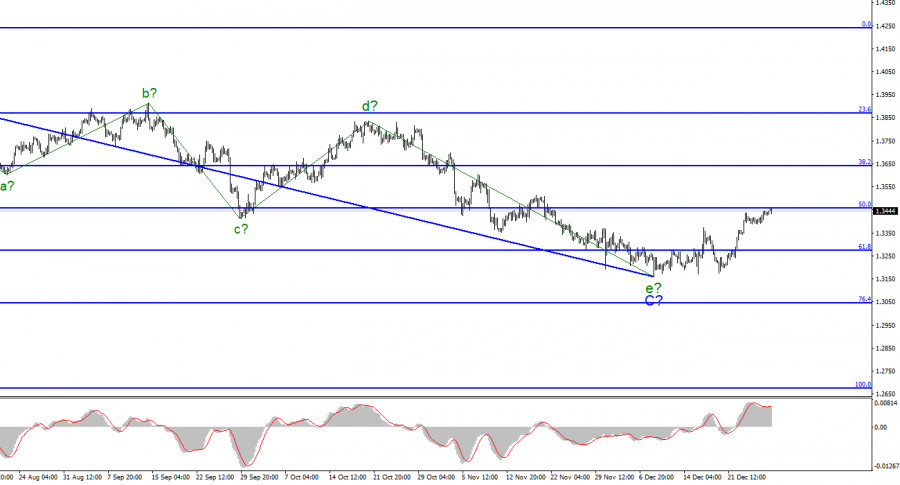
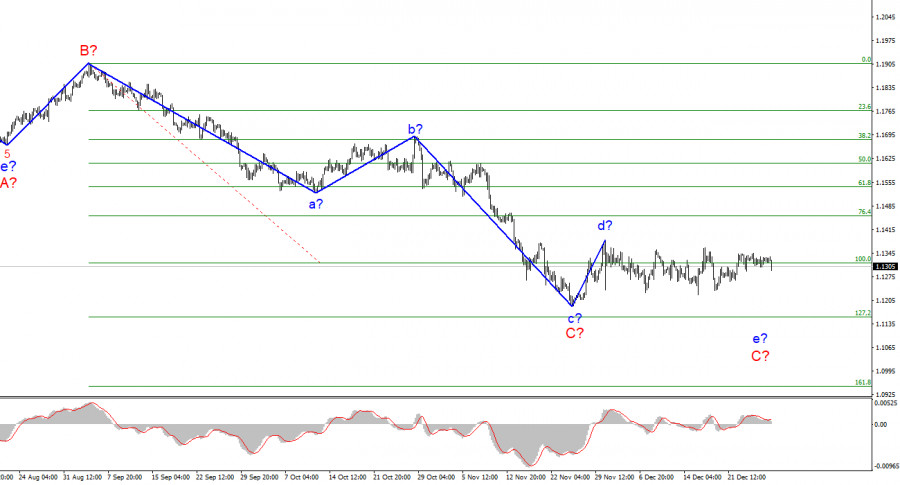
| EUR/USD Wave Analysis on December 28 Posted: 28 Dec 2021 08:43 AM PST
The wave pattern of the H4 chart for the Euro/Dollar instrument continues to remain integral and does not require additions. The construction of a downward wave e in C is still questionable since the current wave takes a very extended horizontal form. If the downward wave does not continue its construction, then wave C will have to be recognized as three-wave and completed, although I believe that it should still take a five-wave form. The wave that originates on November 30 still cannot be attributed to either wave C or the first wave of a new upward trend segment, if it really is, since neither the peak of wave d in C nor the low of wave c in C has been broken over the past few weeks. In the current situation, we can only wait for the situation to develop. Given that the holidays have already begun, the current wave may take on an even longer form. And now it makes no sense to understand its internal waves, since this structure can turn out to be almost any length. New Year's week continuesThere was no news background for the EUR/USD instrument on Tuesday, as well as on Friday and Monday, and for most of last week. For several weeks in a row, the market can be said to be resting, although the reasons for this have appeared only recently. Today, the market activity increased slightly, and the U.S. currency rose by 40 basis points. Although I cannot say that reports from the U.S. are involved in this movement. The housing price index and the Richmond Fed manufacturing index are all that came out in the U.S. today. Both of these indicators turned out to be slightly higher than market expectations, but still, these reports are not so important as to cause a movement of 40 points, at a time when the market has been resting for several weeks in a row. It is possible that the U.S. statistics influenced the demand for the dollar, but this may be a coincidence. This movement did not affect the wave pattern of the pair in any way. Meanwhile, the EU reports that over 78% of its adult population has already been vaccinated against coronavirus in 2021. This was stated by European Commission President Ursula von der Leyen. General conclusions Based on the analysis, I conclude that the construction of the downward wave C can be completed. However, the internal wave structure of this wave still allows the construction of another downward internal wave. Thus, I advise selling the instrument with targets located around the 1.1152 mark, for each downward signal from the MACD, until a successful attempt to break the peak of wave d occurs. New sales should not be opened on each signal. It is better to place a restrictive order above the peak of wave d once. |
| Review of US session on December 28: promising ending of year Posted: 28 Dec 2021 08:04 AM PST European and Asian stock indices rose slightly on Tuesday. The S&P 500 hit a record high: markets supported the optimistic outlook. Review of US session on December 28: promicing ending of yearEurope and Asia ended the trading day with gains due profitable Monday on Wall Street. The news that the UK and France decided to suspend the imposition of new restrictions due to COVID-19 until the end of the year also had its impact. Nearly all assets, from oil to stocks, are near or above recent highs, having cut losses since November, when the COVID-19 Omicron variant forced investors to rush for safety. As the worst fears about the impact of the new variant subsided and markets accepted the latest restrictions, investors returned to risky trading areas. The MSCI World Stock Index went up 0.2% by 11:42 GMT, and the S&P 500 continued to rise, adding 1.78% (about 82 points) since the New York Stock Exchange opened at 3:30 pm GMT. The Dow Jones is also giving strong performance, having risen by 1.60% since the start of the session. US index futures went up 0.2-0.4% at the premarket and continue to rise, except for the S&P 500. Europe's STOXX 600 stock index increased by 0.5% to its highest level since November 19, while Japan's Nikkei rose by 1.4% to a one-month high and the broadest index of Asia-Pacific stocks outside Japan added 0.5%. Analyst Charalambos Pissouros said that the latest recovery in risky assets had been activated in the previous week by new reports. He added that they confirmed the Omicron coronavirus variant caused fewer hospitalizations and deaths. The London Stock Exchange was closed for the holiday, reducing activity in the region's stock markets. China reported 209 new confirmed coronavirus cases on December 27, compared with 200 cases a day earlier, mostly in northwestern Shaanxi province. Xian, the provincial capital, is in lockdown. The British government stated the UK Parliament was not planning to tighten COVID-19 measures until the end of 2021, while the French government declared it would tighten the regime, although it would not impose a curfew on New Year's Eve and schools would reopen as had planned in early January. Notably, the MSCI World Stock Index went up more than 17% this year. Besides, in 2022 investors are wary of the risks posed by rising price pressures, slowing corporate earnings growth and the likelihood of a US rate hike cycle. The same situation concerns the S&P 500. Thus, S&P 500 futures dropped by 1.49% since the start of trading, indicating that investors are not interested in taking long positions. This is probably a consequence of their fairly serious volatility, which makes players cautious. Analyst Arne Petimezas said that money supply growth would slow down in 2022, though the market strongly doubted that the ECB and the Fed were really willing to tighten financial conditions. He added that the market faced a choice between curbing inflation or continuing this process. Notably, the day before the S&P added 1.4% and ended Monday at a record high as strong retail sales underscored US economic strength, the Dow Jones rose by 1% and the Nasdaq 100 gained 1.6%. Oil continued to rise despite Omicron's rapid spread, supported by supply disruptions and expectations of a drop in US inventories last week. Brent crude oil grew by 1.5% to $79.75 a barrel, but it is trading near $74 as of 3:30 pm GMT. Meanwhile, the safe-haven yen fell to a one-month low of 114.94 per dollar and was the last small change of the day. The US dollar, also being a safe haven, fluctuated in an acceptable range due to the encouraging retail sales report. The dollar index, which measures the currency against six major currencies, was just below parity at 96.02. The pound rose by 0.1% to a new five-week high. The euro little changed, and the risk-sensitive Australian dollar gained 0.2%. Bitcoin fell below $50,000 by 3%. In debt markets, US 10-year Treasury bond yields remained below Thursday's high of just above 1.5%. German 10-year bond yields, the benchmark for the eurozone, added 2 basis points to -0.226%. Spot gold rose by 0.3% to its record high in one month at $1,816.60 an ounce due to a weaker US dollar. The material has been provided by InstaForex Company - www.instaforex.com |
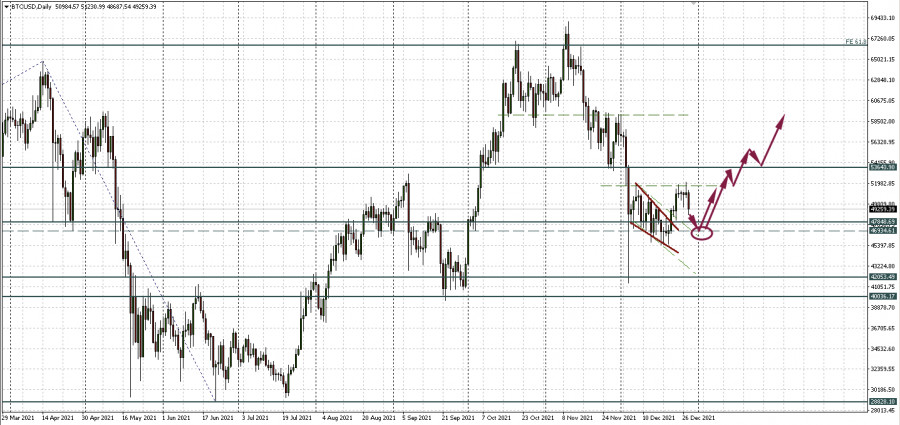
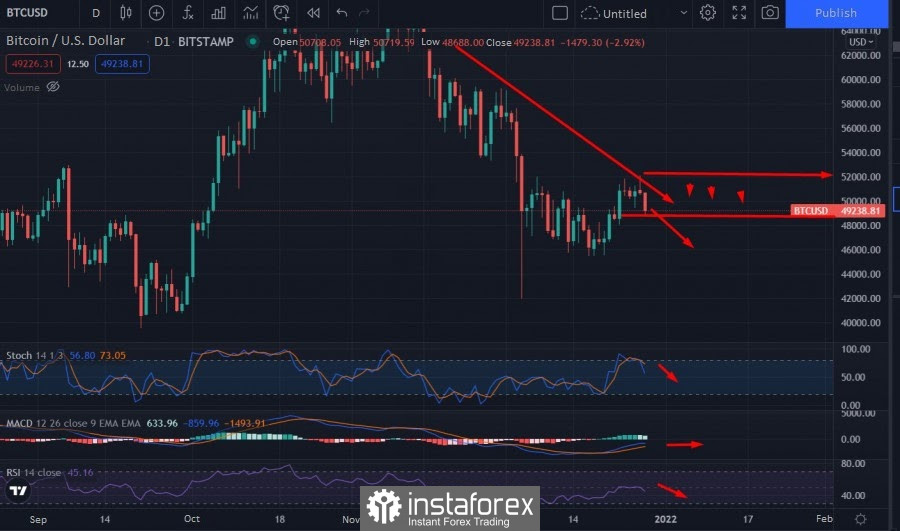
| Bitcoin: Current Consolidation is a Speed Bump in a Bull Market Posted: 28 Dec 2021 07:49 AM PST Bitcoin confirmed the level of 51,697.58 as resistance (green horizontal dotted line) after it worked well out of the descending channel last week. But the main cryptocurrency failed to take this border. After a technical consolidation, the price dropped. Now BTCUSD has a prospect to continue moving sideways. The boundaries of the corridor will be the resistance of 51,697.58 (upper green dotted line) and the support of 46,934.61, which resisted during the decline of the past two weeks. Technically, the price is halfway to this border, there is still a margin for reduction. The second scenario is consolidation in a narrower range if the decline stops near the current values. A local mirror level is visible in the area of $49,000 per coin. Let's keep that in mind so as not to strip the chart. Consolidation is a speed bump in a bull marketThe current sideways trend is boring at times, but globally, crypto traders are no stranger to such a picture. During this year, we have seen such sideways more than once. Meanwhile, seasoned trader and analyst Tone Vays believes that the current consolidation is just noise followed by a breakout. It is logical. He stressed in his strategy session that the main cryptocurrency remains optimistic after recovering from the crash in May. "This is just a speed bump in the bull market. We had a 50% speed bump right there (May 2021)... And now, we just had about a 38% speed bump," Vays' statement in the current market situation. Vays predicted that Bitcoin would need to overcome resistance near $60,000 to trigger a massive rally above $100,000. And locally, he claims that if the next candle breaks $51,750, he would re-invest in the market. So where can you buy Bitcoin?As you can see, the level marked by Vays almost coincides with our resistance at 51,697.58 (upper green dotted line). And so far, not only has it not been broken, but the price has bounced down from it. Given the current technical picture, a good entry point can be formed upon reaching support at 46,934.61 and turning upwards from it. Here you can buy with a target at the upper border of the sideways trend. The second scenario is to buy on consolidation above 51,697.58, when it occurs. But here the power reserve to the next strong level of 53,643.90 is locally small. Although for a short-term transaction, this is not a big deal. I would speak about a breakout only after Bitcoin consolidates above the level of 53,643.90. Then you can expect $60,000 per coin.
|
| Posted: 28 Dec 2021 07:46 AM PST
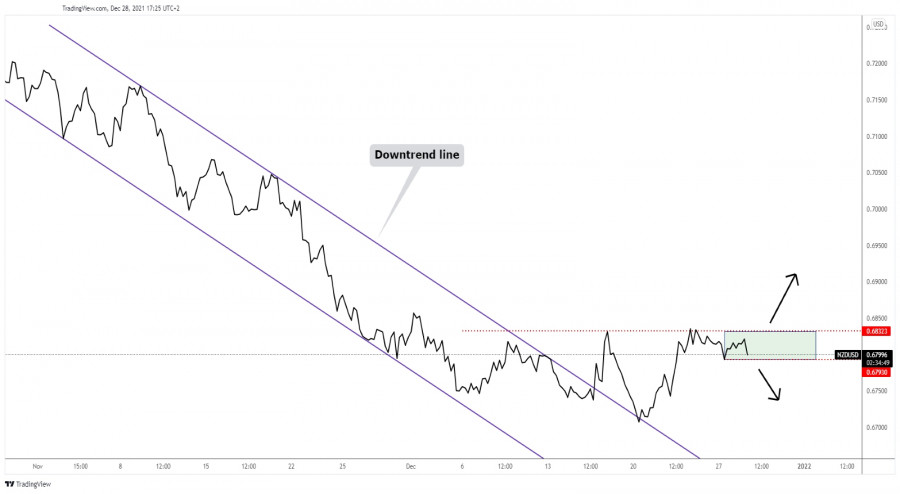
NZD/USD upside seems limitedThe NZD/USD pair failed to reach and the 0.6832 static resistance, the upside obstacle. You already know from my previous analysis that the currency pair could develop a larger upwards movement if it jumps and stabilizes above 0.6832. The immediate low of 0.6793 represents a downside obstacle. Dropping and staying below this level may announce a deeper drop and invalidate the upwards scenario. NZD/USD trading conclusonStaying above 0.6793 and jumping above 0.6832 could validate an upside continuation and could bring new buying opportunities. The material has been provided by InstaForex Company - www.instaforex.com |
| Posted: 28 Dec 2021 07:45 AM PST
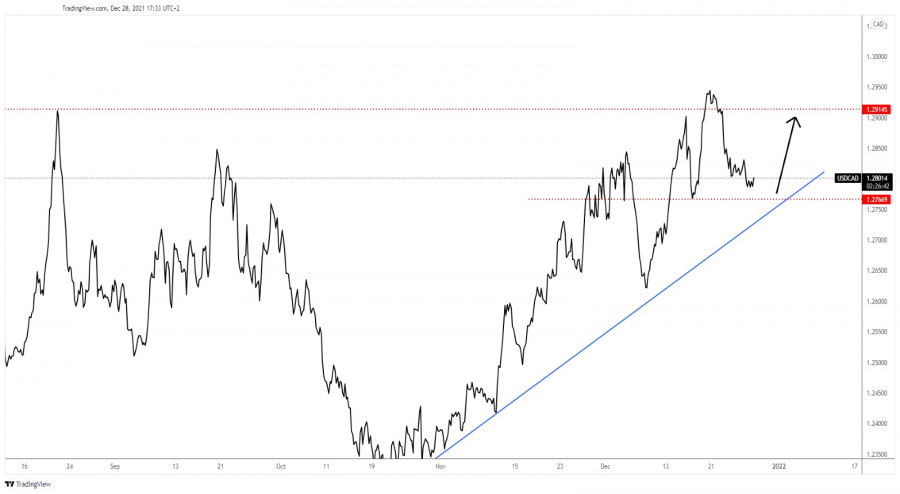
USD/CAD uptrend is still intactThe USD/CAD pair dropped after failing to stabilize above 1.2914 former high. A temporary decline was natural after its amazing upwards movement. The uptrend is still unharmed as the pair is traded far above the uptrend line. The former low of 1.2766 represents a potential downside obstacle. As long as it stays above this level and above the uptrend line, USD/CAD could start increasing again. Testing and retesting these levels could bring new buying opportunities with a good risk-to-reward ratio. An eventual Stop Loss order could be hidden below these obstacles. A larger downside movement could be activated only by the USD/CAD's drop below the uptrend line. USD/CAD trading conclusionAfter its amazing fall, USD/CAD could start increasing again. Still, maybe we should wait for the rate to reach and retest the level of 1.2766 and the uptrend line to confirm them as downside obstacles. The material has been provided by InstaForex Company - www.instaforex.com |
| Technical analysis of EUR/USD for December 28, 2021 Posted: 28 Dec 2021 07:38 AM PST
The EUR/USD pair fell from the level of 1.1378 to bottom at 1.1255 last week. Today, the EUR/USD pair has faced strong support at the level of 1.2255. Currently price sets at 1.1292. So, the strong support has been already faced at the level of 1.1255 and the pair is likely to try to approach it in order to test it again and form a double bottom. Hence, the EUR/USD pair is continuing to trade in a bullish trend from the new support level of 1.1255; to form a bullish channel. According to the previous events, we expect the pair to move between 1.1255 and 1.1438. Also, it should be noted major resistance is seen at 1.1438, while immediate resistance is found at 1.1378. Then, we may anticipate potential testing of 1.1438 to take place soon. Moreover, if the pair succeeds in passing through the level of 1.1300, the market will indicate a bullish opportunity above the level of 1.1300. A breakout of that target will move the pair further upwards to 1.1378. Buy orders are recommended above the area of 1.1300 with the first target at the level of 1.1378; and continue towards 1.1438. On the other hand, if the EUR/USD pair fails to break out through the resistance level of 1.1255; the market will decline further to the level of 1.1187.(daily support 2). The material has been provided by InstaForex Company - www.instaforex.com |
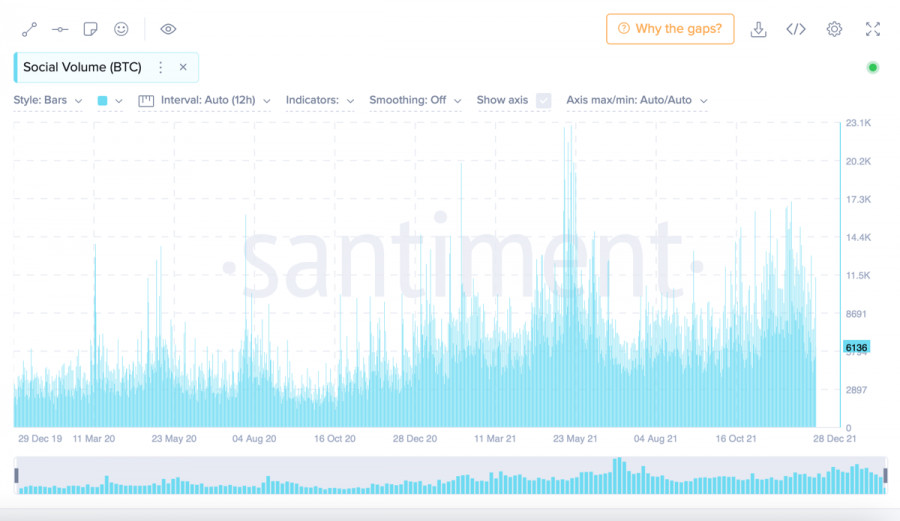
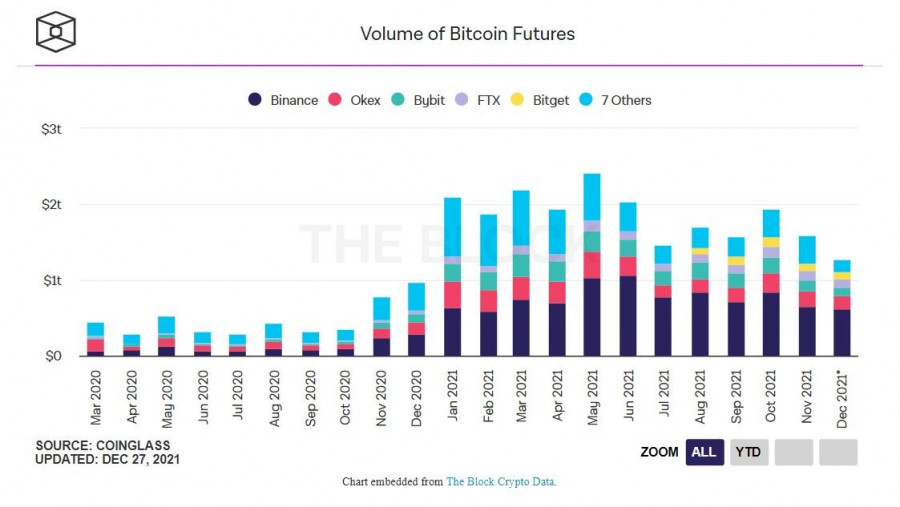
| Posted: 28 Dec 2021 07:34 AM PST Bitcoin continued to develop as a class asset in 2021, simultaneously performing its usual functions of protecting against inflation. Most of the bullish rally of cryptocurrencies throughout the year was associated with risk hedging. But in the final quarter of 2021, this trend began to fade due to the curtailment of the incentive program and a prolonged correction of the asset. Despite this, Bitcoin remains in demand, and the growth of correlation with the S&P 500 index indirectly indicates the role of the cryptocurrency in the future. In 2021, the digital asset played the role of a financial instrument that brings a solid profit. This opinion was expressed by experts of the audit and consulting company FinExpertiza. According to the research work, Bitcoin showed the highest profitability for the year even after paying all taxes. The real estate market came in second place, and American and Russian securities came in third and fourth. These are far from all the records that Bitcoin has updated in the course of 2021. According to analytics company Visibrain, users posted a record of 100 million tweets mentioning the first cryptocurrency. For comparison, this is 350% more than in 2020, which speaks of the growing popularity of Bitcoin and the entire cryptocurrency industry among ordinary people. The launch of the BTC ETF set a new record for Bitcoin futures trading volumes, which increased by 338%. There is also an increase in the options market, where the growth was 443%.
All these factors indicate that the number of references to the "death of Bitcoin" will fall, and the distribution and use of the coin will only grow. But it's not worth waiting for a full-fledged bull rally in 2021. The cryptocurrency is within the narrow range of $49.6k-$52k and is unlikely to be able to go beyond it upwards. Apparently, the recent surge in activity has not turned into a full-fledged upward movement. This was predictable since the market is busy with acquisitions, and before the active phase on the eve of the new year, and the largest expiration in the history of more than $5 billion. Therefore, an upward movement in 2021 is excluded due to the passivity of the market, profit-taking, and the fulfillment of term obligations on options on December 31.
At the same time, there is still a chance to plunge headlong into the $42k-$45k area again. Bitcoin has made a false upward spurt and is gradually rolling back into the usual oscillation zone. In the near future, I expect the price to decline below $49.6k, where an important support zone passes. The asset has already touched the $48.7k mark, but buyers held their positions and pushed the price. Despite this, low trading volumes and an unbreakable resistance zone near $52k bury the remaining hopes of the market to reach at least $60k by the end of 2021. The material has been provided by InstaForex Company - www.instaforex.com |
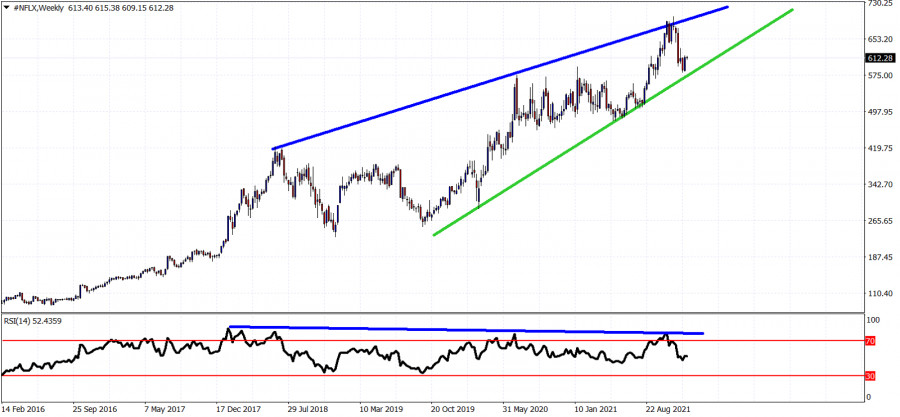
| Posted: 28 Dec 2021 07:19 AM PST NFLX remains in a bullish trend as long as price is trading above $580. Price remains in a bullish trend making higher highs and higher lows, however traders need also to protect their gains because the upward sloping wedge pattern combined with a bearish divergence, is a bearish sign.
Green line - support So far price has provided us with warning signs that the weekly up trend is weakening. This does not rule out a strong upward move toward $700. In fact this is the primary scenario expected to happen as long as price is above $580. Failure to hold above this level, will turn us bearish. The material has been provided by InstaForex Company - www.instaforex.com |
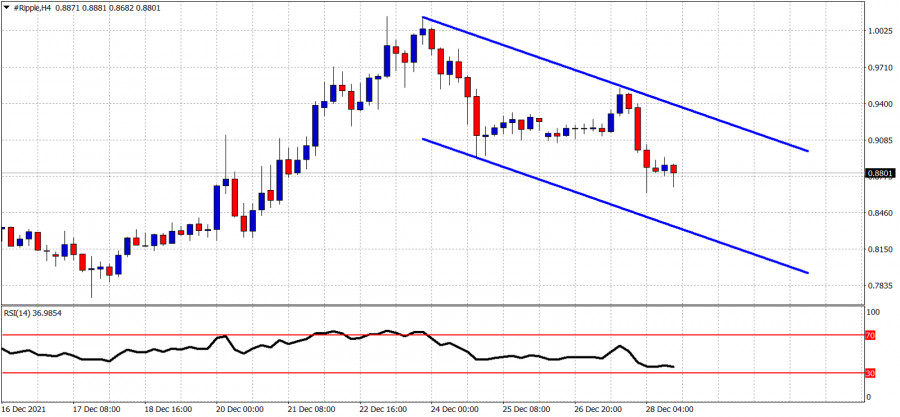
| XRPUSD short-term technical analysis. Posted: 28 Dec 2021 07:16 AM PST XRPUSD made a lower high and a lower low creating a short-term bearish channel. XRPUSD is now below $0,90 and is vulnerable to a move towards $0.83.
XRPUSD has formed a bearish channel and price is making lower lows and lower highs. There is downside potential for a move close to the lower channel boundary. This scenario is cancelled if price breaks above the recent high of $0.9533. If this happens, then we should expect XRPUSD to push even higher, above $1.01. Until then price is vulnerable to more downside. The material has been provided by InstaForex Company - www.instaforex.com |
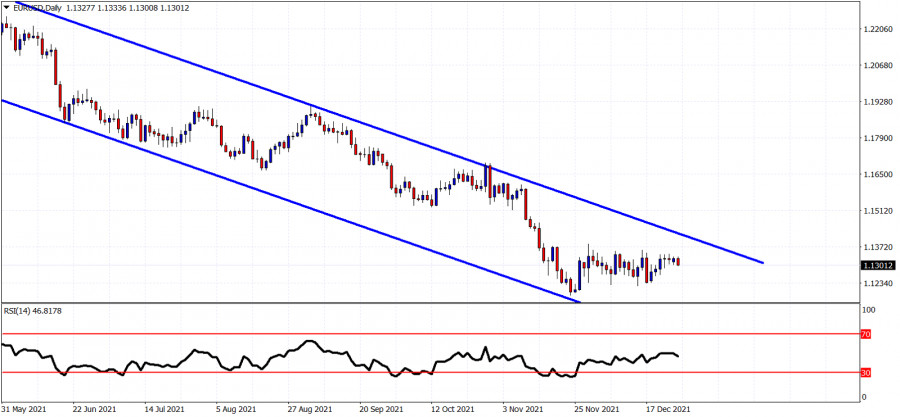
| EURUSD continues to trade sideways. Posted: 28 Dec 2021 07:12 AM PST EURUSD remains inside the medium-term bearish trend from the 1.2265 highs. The 1.12-1.13 area was our expected target and possible turnaround level because here we also find the long-term 61.8% Fibonacci retracement of the entire rise from 1.0635 to 1.2350.
Because of the short-term bullish divergence signals, when price was around 1.12-1.1250 we turned bullish and said that the downside was limited and price should bounce higher towards 1.1350-1.1450. Price made a shallow bounce towards 1.1370 and for the last few weeks it mostly moves sideways. This is not a good sign for bulls. This price action increases the chances of seeing a new lower low below 1.12. Key resistance remains at 1.1370 and next at 1.1425. At current levels I prefer to be neutral EURUSD. The material has been provided by InstaForex Company - www.instaforex.com |
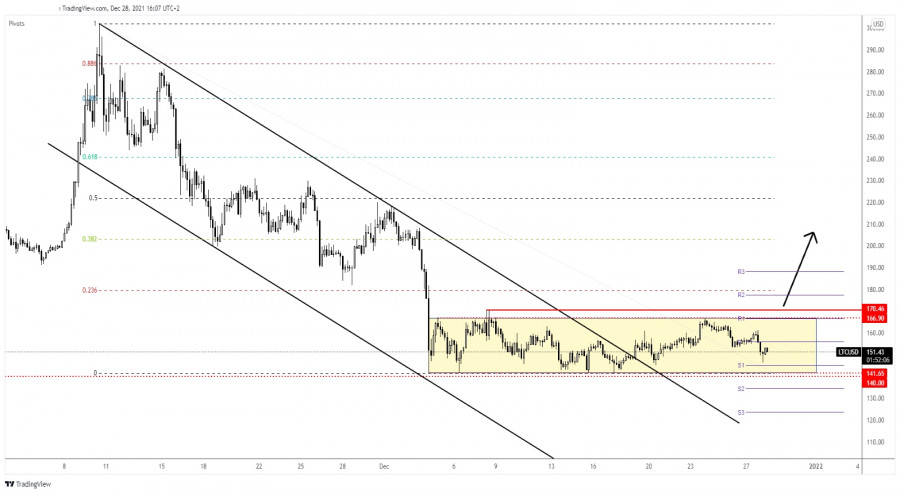
| Litecoin extends its range, upside invalidated Posted: 28 Dec 2021 07:10 AM PST Litecoin continues to move sideways after failing to activate an upside reversal. Bitcoin's drop forced the LTC/USD to slip lower as well. In the short term, it could stay within the current range pattern. We'll have a great trading opportunity after the rate escapes from this pattern. At the time of writing, the pair was traded at 151.80, far below 166.82 Friday's high. It has dropped by 12.13% from Friday's high to 146.58 today's low. LTC/USD 166.90 resistance continues to hold
Litecoin escaped from a major down channel pattern, but it has failed to make a valid breakout above 166.90 and to confirm a bullish reversal. The psychological levels of 141.65 and 140.00 are seen as downside targets and obstacles. As long as it stays above the immediate support levels, Litecoin could still give birth to a new leg higher. The current drop could represent only a continuation pattern. LTC/USD could only test and retest the downside obstacles before starting to grow again. LTC/USD predictionA bullish pattern around the 141.65 - 140.00 area or a false breakdown with great separation below this area may announce a new bullish momentum. Still, only a valid breakout above the 166.90 resistance could activate an upside reversal. The material has been provided by InstaForex Company - www.instaforex.com |


| You are subscribed to email updates from Forex analysis review. To stop receiving these emails, you may unsubscribe now. | Email delivery powered by Google |
| Google, 1600 Amphitheatre Parkway, Mountain View, CA 94043, United States | |


Comments