Forex analysis review
Forex analysis review |
| Posted: 11 Dec 2021 05:08 AM PST EUR/USD analysis on the daily chart
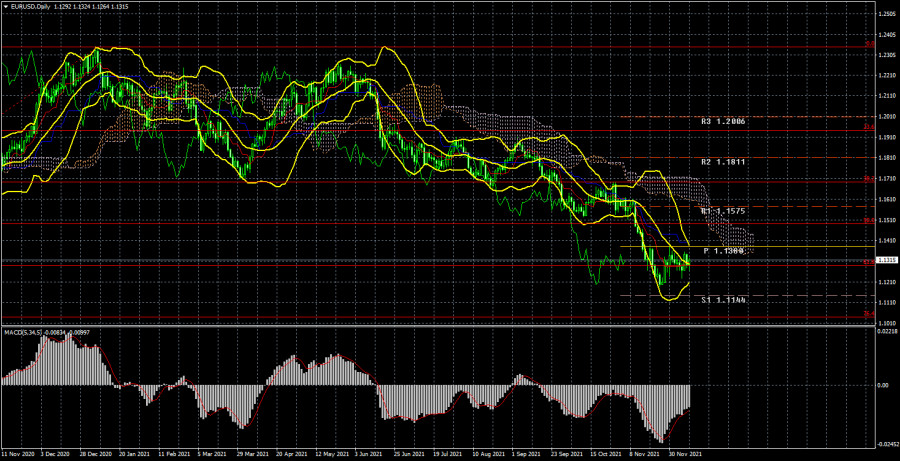
The EUR/USD pair has grown by 10 pips this week. During the week, the pair showed mostly good performance, but it was not triggered by macroeconomic or fundamental data. Only on Friday could we say that markets reacted to the inflation report. All other days there were no important data or releases. Anyway, the pair was up by 60 pips on Tuesday and by 70 pips on Wednesday. However, such growth was just a correction. If we look at the long-term chart (see above), it shows that the pair has been declining for some time. Therefore, a slight upward correction may work in the pair's favor. Moreover, the current uptrend can hardly be called a correction because it is very weak. That's why the pair's rise in the middle of the week by 130 pips looked very good on the 1-hour chart, but on the daily chart, it was not so obvious. Although we have been waiting for the end of the downtrend for a long time, the euro/dollar is still falling. During the last couple of weeks, the pair has been making desperate correction attempts, but so far it has not even managed to reach the breakout line. Thus, at the moment it is difficult to conclude that the downtrend is over. Most likely, the decline of the euro may continue. At least, most factors are in favor of it now and market expectations continue to make an impact. The Fed is still on the path of monetary tightening, while the ECB is not. Already next week, the Fed may announce a new reduction of the QE program, more than a month earlier. Nothing of the kind is expected from the ECB. COT report analysis
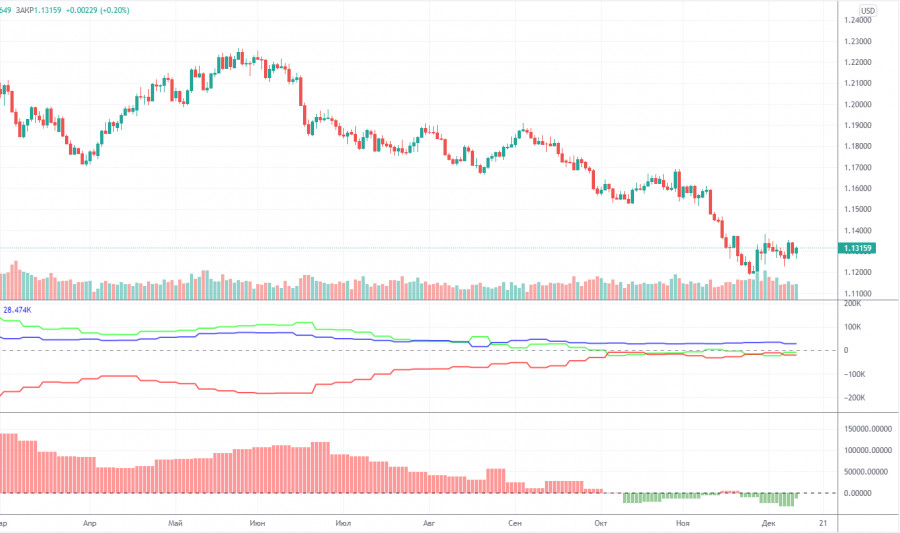
During the previous reporting week (November 30-December 6), the sentiment of non-commercial traders became less bearish. What does that mean? It means that the Non-commercial traders' group now has more short positions open than long ones, but during the last week, the number of sell contracts decreased by 15,000, while the number of long ones increased by 2,000. Thus, the net position of the professional players grew by 17,000, so the bearish sentiment has become less strong. The point is (and it's perfectly visible in the picture above) that the green and red lines (net positions of non-commercial and commercial traders) in recent months are tightly stuck near the zero level. This means that now the sentiment of both groups of traders is as neutral as possible. Nevertheless, all this time the euro continues to fall, which already looks like a discrepancy between the actions of big market players and the trend of the euro. So far, it can be called a fluke, but the bearish sentiment has not been getting any stronger in recent weeks and months on the euro. Therefore, it can hardly be said that the big players are still getting rid of the euro. From this point of view, it looks like the downtrend is about to end, but we have to wait for strong technical signals to open long positions. Fundamental data analysisThis week was as boring as possible. There were almost no important macroeconomic data and fundamental releases. The head of ECB Christine Lagarde spoke twice, but there was not even any information about it in the media. In other words, Lagarde's speeches were of little informative character. Markets never reacted to them. Among the EU statistics, we can single out the GDP report which was close to its previous estimate and therefore did not trigger any reaction in the markets. Thus, the most important and interesting report was the US inflation report on Friday. After its release, the euro grew by 40 pips, though it should have been otherwise, as the CPI is still growing in the US and shows 6.8% yearly. Every new acceleration in inflation means that the Fed may tighten monetary policy at the next meeting. Trading plan for December 13-17:1) On the daily chart, the pair continues the downtrend. At the moment, the quotes remain below the Kijun-Sen line and the market players continue to show that they are not ready to buy the euro. Thus, downside movement can resume any time with the support target levels of 1.1144 and 1.1038 (76.4% Fibonacci). The fundamental background currently supports a further decline of the euro and the growth of USD, but we also believe that all factors have already impacted the market, so we assume that the downtrend may end. 2) As for long positions on the euro/dollar, they should not be considered before the price fixes above the critical line or above the Ichimoku cloud because the price has already overcome the Kijun-sen line several times, but then it could not continue the uptrend. There are no technical prerequisites for a new uptrend shortly. Description of the charts:Price levels of support and resistance (resistance/support), Fibonacci levels - levels, which are targets for the opening of long or short positions. The take-profit order can be placed near them. Ichimoku cloud (standard settings), Bollinger Bands (standard settings), MACD (5, 34, 5). Indicator 1 on the COT charts - the size of the net position of each category of traders. Indicator 2 on the COT charts - the size of the net position for the "Non-commercial" group. The material has been provided by InstaForex Company - www.instaforex.com |
| You are subscribed to email updates from Forex analysis review. To stop receiving these emails, you may unsubscribe now. | Email delivery powered by Google |
| Google, 1600 Amphitheatre Parkway, Mountain View, CA 94043, United States | |


Comments