Forex analysis review
Forex analysis review |
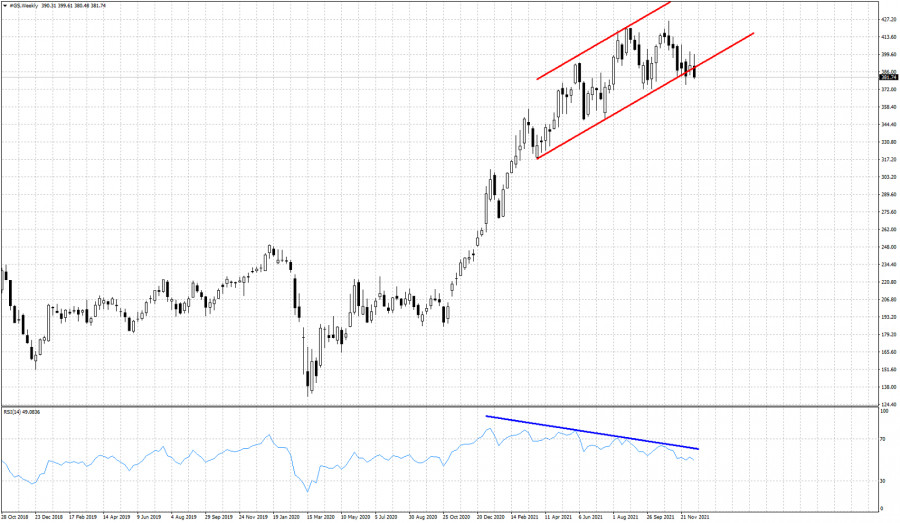
- GS stock price remains vulnerable to more downside.
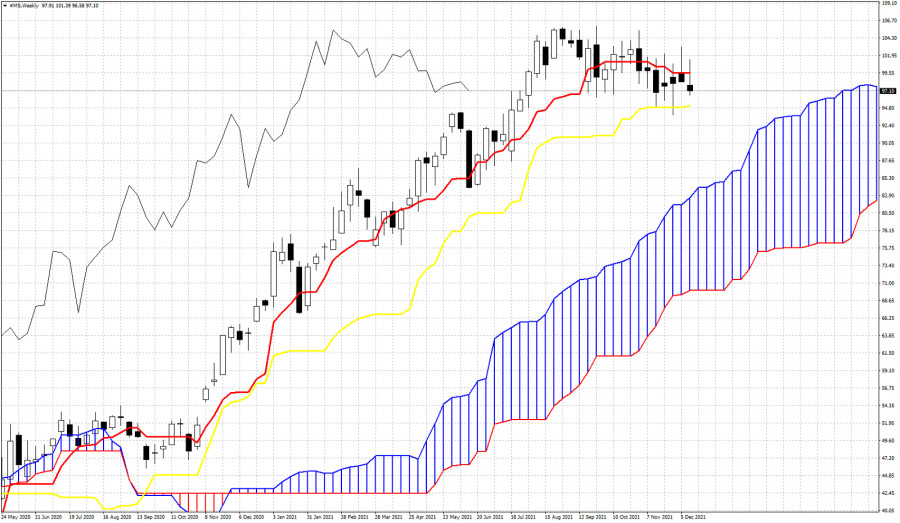
- Weekly Ichimoku cloud indicator for Morgan Stanley's stock price.
- Is the holiday rally over?
| GS stock price remains vulnerable to more downside. Posted: 17 Dec 2021 02:14 PM PST GS stock price ended the week near its lowest levels. With price just above the $380 level, this weekly candle has exited the bullish channel price was in for the last 8 months. Weekly trend is technically still bullish but as we identified when price was trading around $410, the bearish RSI divergence suggests that a corrective pull back is justified as we mentioned before in previous posts.
Blue line- bearish divergence Recent low and key horizontal support is found at $372. Breaking below this level will be the confirmation for the start of the pull back. The RSI bearish divergence was just a warning. Our pull back target is currently around the $290-$310 area. GS stock price is vulnerable to a move lower because we believe the upside potential is very limited. The material has been provided by InstaForex Company - www.instaforex.com |
| Weekly Ichimoku cloud indicator for Morgan Stanley's stock price. Posted: 17 Dec 2021 02:06 PM PST The Morgan Stanley stock price ended the week near its lowest levels after testing the $101 price level, but with no success in staying above it. From previous posts in previous weeks we had warned bulls that a downward reversal is imminent and we prefer to be neutral if not bearish.
|
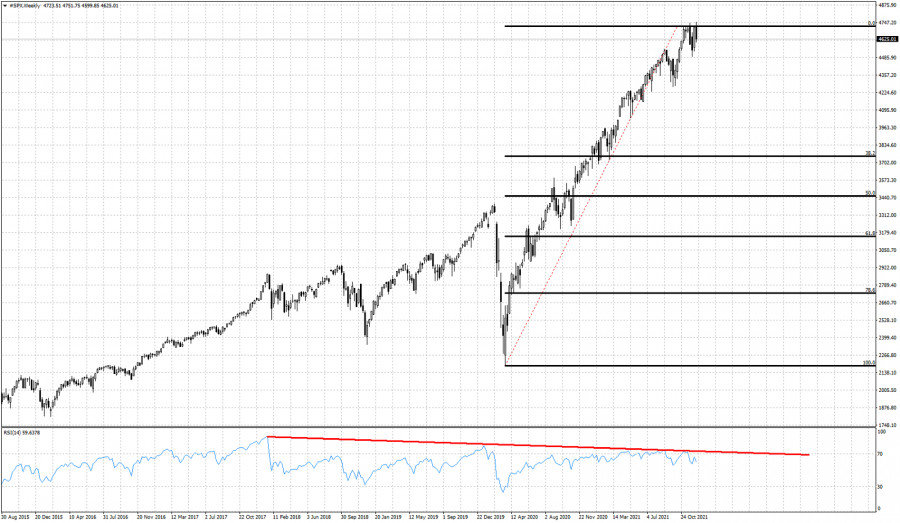
| Posted: 17 Dec 2021 02:01 PM PST One thing is for sure. The next few weeks will have increased volatility and big price swings. The more time it takes for a considerable correction to happen in SPX, the more likely it becomes. With price still technically in a weekly up trend, we check the odds of a correction happening over the coming weeks.
Black lines- Fibonacci retracements SPX continues to make higher highs and higher lows. Trend remains bullish. However as the bearish divergence warns us, a pull back is justified from current levels. Our most probable target would be around 3750. Yes the market justifies an almost 1000 point drop and we would still be above the pre Covid top in 2020. First key support is found at recent lows at 4490 area. Breaking below this level will be the first sign of a major pull back starting. Until then we only have warnings. No reversal confirmation yet. The material has been provided by InstaForex Company - www.instaforex.com |
| You are subscribed to email updates from Forex analysis review. To stop receiving these emails, you may unsubscribe now. | Email delivery powered by Google |
| Google, 1600 Amphitheatre Parkway, Mountain View, CA 94043, United States | |


Comments