Forex analysis review
Forex analysis review |
- Has the train left to buy Solana or will consumerism never win?
- Record shortage of goods in the US worries economists
- Gold ignored the US positive data
- USD/CHF validated its breakout from a major range
- Ethereum approaches a buying zone
- USD/JPY targeting 115.45
- Results and Outlook of the Crypto Market; Forecast for Bitcoin
- Bitcoin market under "extreme fear"
- GBP/USD Wave Analysis on December 30: British pound continues to build an upward wave
- EUR/USD Wave Analysis on December 30: Euro attempts to clarify the wave pattern
- EUR/USD: Revaluation of Omicron will revive the plan for the fall of the euro
- The end of the year turns out to be a bad one for Tesla
- Trading signals for GBP/USD on December 30 - 31, 2021: buy in case of rebound off 1.3427 (6/8)
- December 30, 2021 : EUR/USD daily technical review and trading opportunities.
- December 30, 2021 : EUR/USD Intraday technical analysis and trading plan.
- December 30, 2021 : GBP/USD Intraday technical analysis and significant key-levels.
- Stock America showed mainly growth
- Technical Analysis of GBP/USD for December 30, 2021
- Trading signals for EUR/USD on December 30 - 31, 2021: buy above 1.1352 (21 SMA)
- EUR/USD analysis for December 30, 2021 - Potential for downside rotation
- Analysis of Gold for December 30,.2021 - Potential for upside continuation
- BTC analysis for December 30,.2021 - Key pivot level at $48.065
- Technical Analysis of EUR/USD for December 30, 2021
- Video market update for December 30,,2021
- EUR/USD on December 30
| Has the train left to buy Solana or will consumerism never win? Posted: 30 Dec 2021 01:56 PM PST
Solana is one of the most varnished pieces on the altcoin market for investors. The innovative project has been in existence for 4 years, and its popularity is increasing by leaps and bounds every year. At the moment, altcoin is the fifth largest by capitalization in the world with more than $58 billion behind it. Such a sharp jump can both stop experienced investors, since stagnation in the crypto market is very frequent, and you will not enter the same river twice. Solana has shown significant growth. The year started with a milestone of $1.50, after which a jump of more than 12,000 percent was shown. It may also encourage investors to invest their hard-earned money in Solana, waiting for the next breakthrough and showing at least 10x. What growth opportunities does Solana have? Solana is a full-fledged cryptographic package. It has its own blockchain, where various applications are created, and also has its own Solana currency. Solana is also the largest platform for NFT. Investors can speculate about cryptocurrencies, give them away for staking, or just store them. Solana is much more diverse than many other altcoins. The cryptocurrency can process up to 50,000 transactions per second, which is why many investors choose Solana, as it is ultra-fast, energy efficient and transactions within the network are very cheap. Due to the fact that Solana uses transaction history verification in its blockchain, and also makes transaction labels that are processed, this serves as a catalyst that validators are much more efficient and faster at sorting information blocks. Solana is a green cryptocurrency that is safe for the environment. Transactions consume incredibly minuscule energy consumption. The cryptocurrency has more than 350 projects on the blockchain. Solana has more than 350 different projects on its platform. It can be gambling, financial applications, and so on. Of course, Solana lags behind in quantity when compared with Ethereum, but due to its advantages, developers can choose it rather than Ethereum. Solana is one of the leaders in the NFT segment. The cryptocurrency has become the 3rd blockchain in terms of NFT sales. The blockchain platform sells various ownership rights to various musical collectibles, art objects, as well as various other tokens. It's never too late to buy Solana. In the next ten years, the cryptocurrency will only develop and expand. Also, the "ethereum killer" will attract more and more new investors to its ranks due to high transaction speeds, as well as low cost. The material has been provided by InstaForex Company - www.instaforex.com |
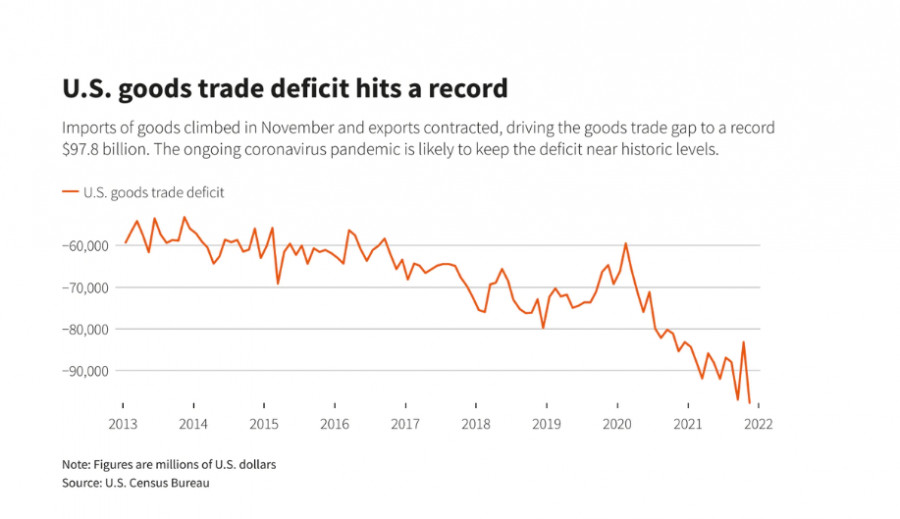
| Record shortage of goods in the US worries economists Posted: 30 Dec 2021 01:56 PM PST The shortage of goods in the United States in November rose sharply to the highest in the country's history, despite the fact that imports of consumer goods reached a record level ahead of the second consecutive COVID holiday shopping season. The decline also took place in the field of industrial goods, while exports declined after a historic profit a month earlier. Record shortage of goods in the US worries economists According to economists, the deficit in trade in goods, which was reported on Wednesday by the Ministry of Commerce, is likely to remain historically high as long as the coronavirus pandemic continues. The appearance of a rapidly spreading variant of COVID-19 from Omicron, which this week led to a record patient load in the United States and the world, may further aggravate the situation in the near future if it entails a reduction in spending by American consumers on services and a recovery in demand for imported goods.
According to the Census Bureau, last month the trade deficit increased by 17.5% to $97.8 billion from $83.2 billion in October. That exceeds the previous record deficit, set in September at $97 billion, and may dampen optimism that trade can finally add to U.S. economic growth this quarter for the first time in more than a year. Imports grew by 4.7%, primarily industrial supplies, increasing by $5.7 billion to $63.2 billion, followed by an increase in imports of consumer goods by $2.9 billion to almost $67 billion, as retailers rushed to fill store shelves in the run-up to Christmas. Both segments showed records. "The appearance of the Omicron option may further boost demand for imported goods if activity in the service sector is limited" in the first quarter of 2022, Nancy Vanden-Houten, a leading economist at Oxford Economics, wrote after the report on Wednesday. Exports of goods, meanwhile, decreased by 2.1% against the background of a general decline, excluding an increase in food exports by 4.3%. The drop was caused by a reduction in industrial supplies by $1.4 billion and capital goods by $1.3 billion. According to Vanden-Houten, the global surge in coronavirus cases to record numbers in recent days - including a record number of cases in the US - could affect global demand in the coming months, risking an even bigger trade gap. The so-called Advance Indicators report also showed that wholesale inventories rose 1.2% last month, while retail inventories increased 2.0%. Retail inventories excluding cars, which are taken into account when calculating gross domestic product, increased by 1.3% to $465.2 billion, which is the latest in a series of record values. The economy grew at an annualized rate of 2.3% in the third quarter, down from a year earlier, but activity rebounded in the fourth quarter, and economists agree that eventually the growth rate will be between 6% and 7% in the last three months of 2021. Trade held back gross domestic product growth for five consecutive quarters, while inventories boosted output in the third quarter. Earlier this month, the Commerce Department reported a sharp reduction in the overall trade deficit, including services, for October, which gave rise to some optimism that trade could contribute to an increase in production in the last quarter of the year. A sharp reversal to a record deficit in goods trade in November may prompt a rethink of this issue. Economists at Action Economics have lowered their estimate of fourth-quarter GDP growth to 6.5% from 7.0%, with exports now being subtracted from growth rather than added to it as previously expected. Meanwhile, economists at JPMorgan and Goldman Sachs did not change their estimates at 7%. In addition, Omicron also carries the risk of deterioration in the housing market. Data on pending home sales released today showed an unexpected drop in November. In November, contracts for the purchase of houses previously owned by the United States unexpectedly fell, as limited housing stock and high prices reduced activity, and an increase in the number of new cases of coronavirus poses a risk to the housing market, which will begin in 2022. Although this data largely preceded the rise in popularity of Omicron in the United States, a very contagious new option could further limit home sales in the near future, according to the National Association of Realtors. NAR reported that its pending home sales index, based on signed contracts, fell 2.2% last month to 122.4. Pending home sales were lower in all four regions. Economists have predicted that contracts, which usually become final sales in a month or two, will grow by 0.5% in November. "There were no planned home sales this time, which I would put down to the low supply of housing, but also to the fact that buyers were hesitant about housing prices," said Lawrence Yun, chief economist at NAR. Looking ahead, Yun said that Omicron poses a danger to the housing market, as buyers and sellers remain on the sidelines, and the construction of houses is postponed. In the short term, this will support traders' optimism, but economists are concerned about the threat of stagflation - a combination of rising prices and high demand. Of course, the demand is partly provoked by the pre-holiday fuss, and January will be much calmer. However, demand will still remain high, which may further spur prices and increase inflationary pressure. The material has been provided by InstaForex Company - www.instaforex.com |
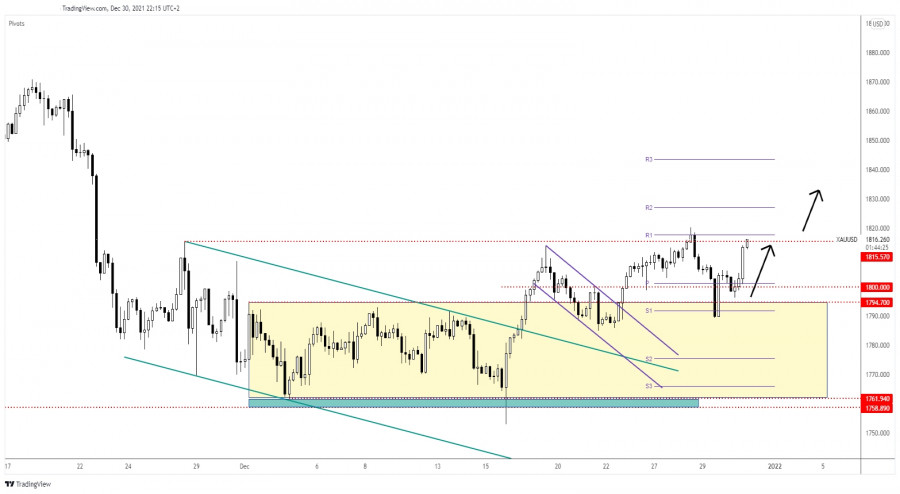
| Gold ignored the US positive data Posted: 30 Dec 2021 01:34 PM PST Gold rallied after failing to stabilize under the 1,800 psychological level. It was traded at the 1,815.76 level at the time of writing, challenging the 1,815.57 static resistance. The yellow metal edged higher as the Dollar Index dropped. DXY's further drop could help the XAU/USD buyers to push the rate higher. Today, the US reported better than expected data, but the USD failed to dominate the currency market. In my opinion, the Dollar Index was too overbought to be able to climb higher. The Unemployment Claims dropped unexpectedly lower from 206K to 198K, below 205K expected, while the Chicago PMI increased from 61.8 points to 63.1 points, exceeding the 61.9 points expected. XAU/USD strong rally
Gold dropped in the short term after failing to take out the 1,815.57 resistance in the previous attempt. If you remember, I've told you in my previous analysis that the downside movement could be only a temporary one. I've also mentioned that a bullish pattern printed on 1,794.70 could signal that the downside movement is over and that the XAU/USD could develop a new leg higher. Gold predictionGold registered a false breakdown below 1,794.70 and under the 1,800 psychological level announcing that the correction ended. Yesterday's bullish engulfing signaled a new swing higher. Now, it's traded in the resistance zone. Making a valid breakout above the 1,815.57 could signal an upside continuation and could bring new long opportunities. A bullish closure above 1,820.30 could validate further growth. The material has been provided by InstaForex Company - www.instaforex.com |
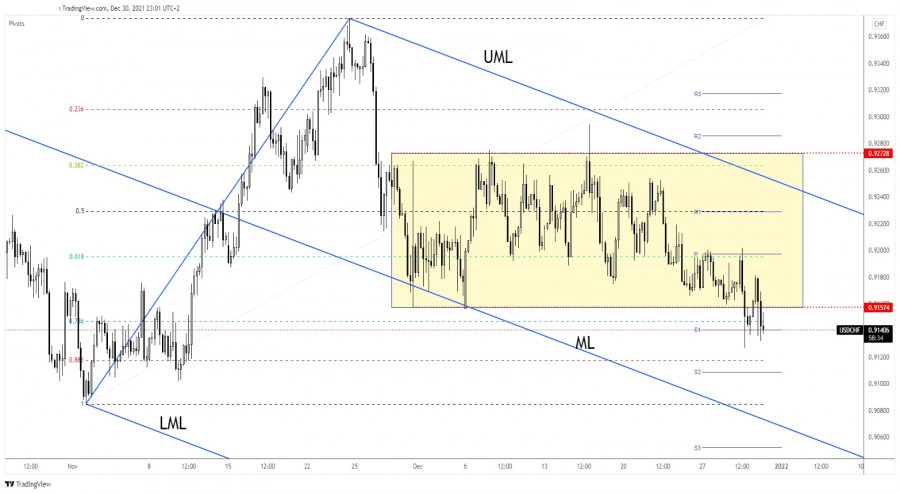
| USD/CHF validated its breakout from a major range Posted: 30 Dec 2021 01:32 PM PST The USD/CHF pair extended its downside movement and now it has escaped from a major range pattern. The downside breakout could announce a potential deeper drop. Surprisingly or not, USD resumed its depreciation even if the US reported better than expected data. The Unemployment Claims and the Chicago PMI beat expectations, but the US dollar resumed its sell-off. The Dollar Index's deeper drop could force the pair to approach and reach new lows. We have a strong positive correlation between these two. Fundamentally, CHF received a helping hand from the Switzerland KOF Economic Barometer which was reported at 107.0 above 106.2 expected. USD/CHF dragged lower by the Dollar Index
USD/CHF was trapped between 0.9272 and 0.9157 levels. As you can see on the H4 chart, the pair registered a valid breakdown from this pattern signaling more declines. Its failure to close above the 61.8% retracement level and above the weekly pivot point (0.9197) signaled an imminent downside breakout. Now, it challenges the weekly S1 (0.9140) static support. Closing and staying below it could announce a potential deeper drop towards 0.9108 weekly S2. Technically, after its failure to approach and reach the descending pitchfork's upper median line (UML), the USD/CHF could be attracted by the median line (ML). USD/CHF predictionDropping and closing below the range support of 0.9157 activated potential deeper drop. The weekly S2 and the median line (ML) could be used as potential downside targets and obstacles if the USD/CHF extends its downside movement. When the price escapes from a range pattern, it could resume its movement in the breakout direction. The material has been provided by InstaForex Company - www.instaforex.com |
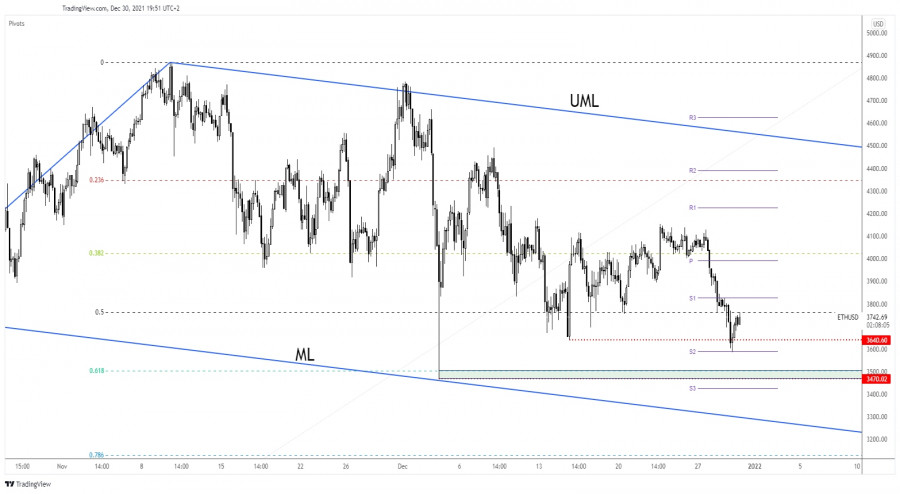
| Ethereum approaches a buying zone Posted: 30 Dec 2021 12:08 PM PST Ethereum plunged in the last days reaching the 3,585 level today. At the time of writing, it was traded at 3,742.64. It has rebounded also because the price of Bitcoin tries to recover after its massive drop. ETH/USD dropped by 13.17% from Monday's high of 4,128.82 to 3,585 today's low. In the last 24 hours, ETH/USD is down by 0.79% and by 8.20% in the last 7 days. In the short term, the pressure remains high but the corrective phase could be over soon, that's why I'd rather look for new long opportunities. ETH/USD seems undecided
Ethereum plunged after failing to stabilize above the 38.2% retracement level. Now, it has rebounded trying to retest the 50% retracement level. The lower low of 3,470.02 stands as a major downside obstacle. Technically, the crypto failed to reach the median line (ML) of the Descending Pitchfork in the previous attempts signaling that sellers are exhausted somewhere around the 50% retracement level. ETH/USD outlookTechnically, its failure to approach the median line (ML) may announce a potential leg higher also if the price stays above the 61.8% retracement level and above the 3,470.02. ETH/USD registered only a false breakdown below 3,640.60 after finding support on the weekly S1 (3,590.95). As long as it stays under the 50% (3,762.79) retracement level, ETH/USD could drop towards the 3,470.02 critical support. A bullish pattern above 3,640.60 or on the 3,470.02 support levels could bring new long opportunities. The material has been provided by InstaForex Company - www.instaforex.com |
| Posted: 30 Dec 2021 12:01 PM PST
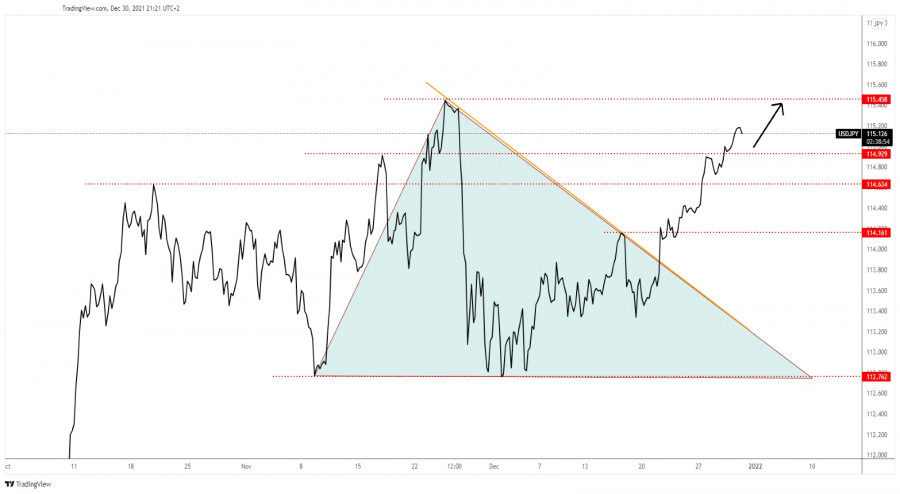
USD/JPY minor dropThe USD/JPY pair increased to as high as 115.19 today. At the time of writing, it was trading at 115.12 above 114.92 broken upside obstacle. As you already know from my previous analysis, USD/JPY was expected to climb higher if it jumped and stabilized above 114.63 high. As you can see, the currency pair passed also above 114.92 high which represented a static upside obstacle. As long as it stays above this level, USD/JPY could resume its upwards movement, the 115.45 higher high is seen as a major upside target. USD/JPY trading conclusionUSD/JPY could extend its upside movement as long as it stays above 114.92. This level represented an upside obstacle which turned into a downside obstacle. A minor retreat could help the buyers to catch a new upside momentum towards 115.45. An upside continuation could be invalidated if the rate drops and stabilizes below 114.92. The material has been provided by InstaForex Company - www.instaforex.com |
| Results and Outlook of the Crypto Market; Forecast for Bitcoin Posted: 30 Dec 2021 11:35 AM PST The cryptocurrency market has been developing rapidly this year. Thus, it will be very interesting to look at the future prospects of the crypto markets, given that the current year has become an epoch-making one for them, without exaggeration, and since all markets are interconnected and cannot develop in isolation, then inter-market technical analysis, as they say, rules, and in this context, we will consider the dynamics of Bitcoin in the future for the next one to three months. But first, let's talk about what events became milestones for the cryptocurrency market in the outgoing year, and the main ones were:
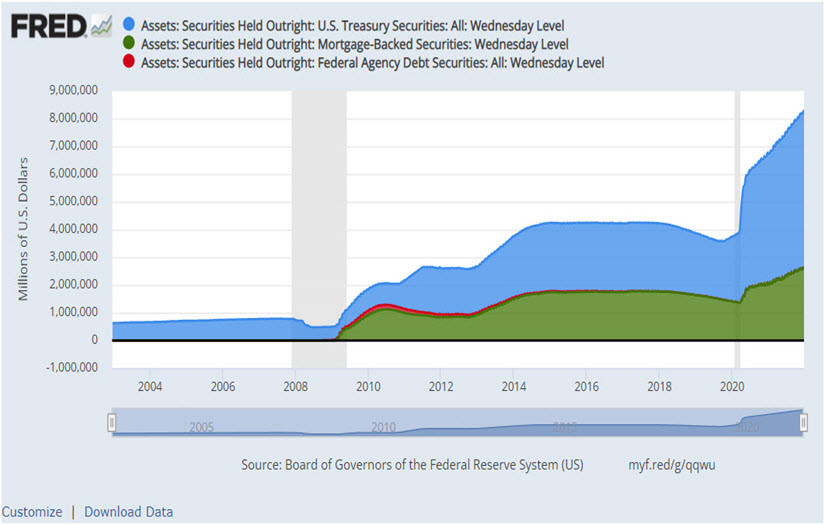
Moreover, the restrictions imposed by China are indicative for investors. First, they give us a clear understanding of how the central banks will act in the event that trading and mining of cryptocurrencies will pose a threat to the national currency and the economy. Second, the exponential growth of the cryptocurrency market after China made the decision to ban it confirms the hypothesis that the fate of this segment, like any other financial instrument, is decided in the United States. The analysis of these events gives us an understanding of how cryptocurrencies will behave in 2022, comparing their dynamics with the dynamics of dollar liquidity in the system, because so far cryptocurrencies are not an independent segment of the economy and depend on how much fiat money is in circulation, as well as the possibility of exchanging cryptocurrency for dollars, euros, pounds etc. In this regard, the policy of key Central Banks is decisive not only for traditional markets, but also, despite decentralization, is of crucial importance for the cryptocurrency exchange rate. As you know, in December 2021, the U.S. Federal Reserve decided to accelerate the completion of the quantitative easing program in 2022, postponing its end from July to March. In addition, as the "dot charts" published following the FOMC meeting show, next year the Committee may raise the rate three times, and this should lead to a decrease in the amount of money in the system. There is no bigger secret that the rise of crypto markets has been driven by cheap liquidity pumped into the system in 2020-2021. Earlier, the Fed has conducted three quantitative easing programs, each of which led to the growth of the cryptocurrency market (Figure 1). I think that each of us is able to understand this causal relationship.
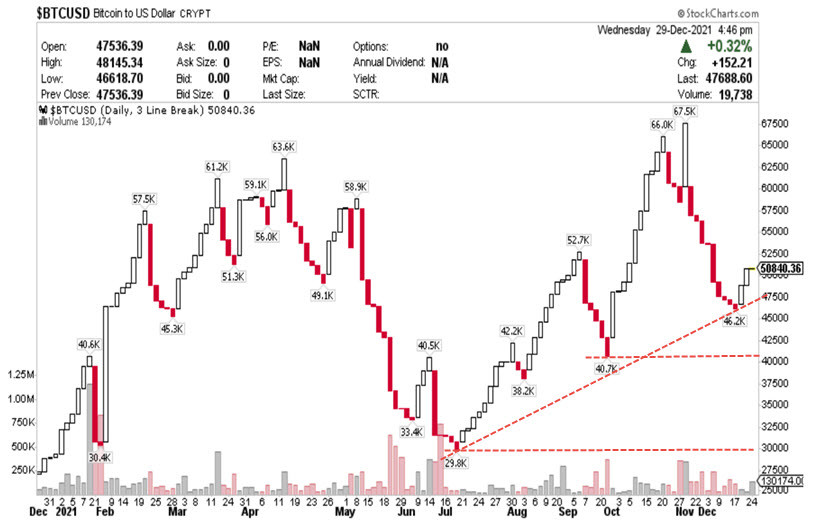
Figure 1: Assets on the balance sheet of the U.S. Federal Reserve and 4 stimulus programs 2009-2021 If we assume that the dynamics of the Fed's balance sheet will develop as it did from 2016 to 2019, when the asset level was at a constant value and even decreased, then this will give an understanding that the bitcoin exchange rate next year will at best remain in the range of $30,000-$60,000, and at worst everything can be, and the scenario of a decline to the level of $20,000 is not the worst option. These are, of course, fantasies on the topic, but for investors who are planning to buy bitcoin now, "while it is selling cheap," it would be nice to try on just such a negative scenario for your deposit. Naturally, buying for 30 and selling for 60 is a great option, but buying for 45 and selling for 20, I think, will not be liked by anyone. In the context of the development of this forecast, let's look at the short-term prospects of BTCUSD using technical analysis. As follows from the dynamics of the rate during the daytime, at the moment bitcoin remains in an upward trend, while the strength and length of the correction to this trend allow us to consider scenarios for a further continuation of the decline. In this case, the most negative scenario will be that the corrective decline will develop further, and the price will drop below $40,000 (Fig. 2). In this case, the trend of the daytime will change its direction from an increase to a decrease, which in the future will most likely lead to the fact that the BTCUSD rate will fall to the level of $30,000.
Fig. 2: Chart of the BTCUSD rate in 3 Line Break format At the moment, bitcoin traders may consider buying as their priority, but do it exactly until the level of $46,200 is overcome from top to bottom. At the same time, overcoming the level of $46,200 will require them to take a pause in opening long positions and follow the further development of the situation, since in this case there is a high probability that the BTCUSD rate will drop to the level of $40,000, and this level is a local pivot point of the daytime and separates the upward trend from the downward trend. There is a long-term positive trend in the cryptocurrency market now, but January is a bad month for all markets. According to statistics, over the past 20 years, in 55% of cases, January on stock exchanges closed with a decrease to the opening, which means that investors are rejecting risks, which directly has a negative impact on cryptocurrencies. Therefore, when deciding to trade on New Year's holidays, be extremely careful and follow the rules of money management. The material has been provided by InstaForex Company - www.instaforex.com |
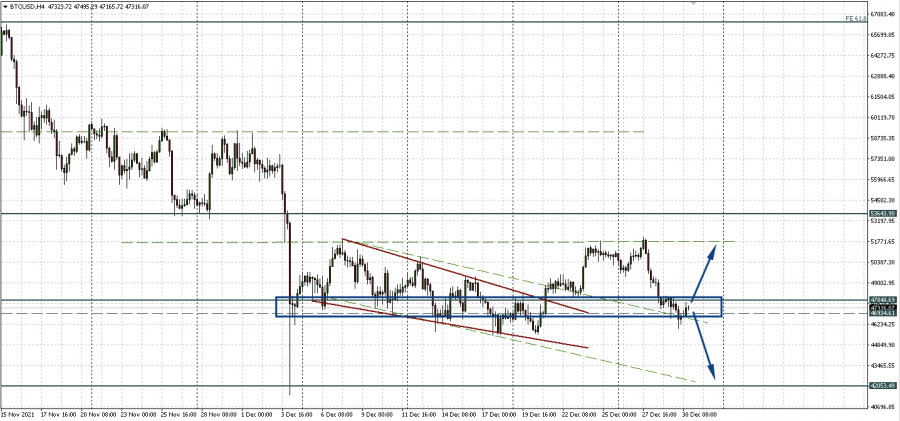
| Bitcoin market under "extreme fear" Posted: 30 Dec 2021 09:21 AM PST Bitcoin managed to hold above the support level of 46,934.61, confirming it with a false breakdown. In the last days of the outgoing year, Michael Saylor of Microstrategy bought the bottom, adding 1,914 coins to the company's balance at an average price of $49,229 per bitcoin for a total of $94.2 million. The level of fear is off scaleThe Crypto Fear & Greed Index on Thursday shows that the market is experiencing "extreme fear" despite the fact that the main cryptocurrency has turned around locally. According to the Crypto Fear & Greed Index, on December 30, traders' emotions are the most frightening in the 10 days since Bitcoin dropped to nearly $45,500. The index is currently at 22, reflecting "extreme fear." Bitcoin's recent drop from $52,000 has taken its toll on the index, with the valuation falling deeper than Wednesday's fear position by 27. The Crypto Fear and Greed Index takes into account market sentiment, which refers to the emotional behavior of traders and investors in relation to a particular asset. Local forecast for BTCUSDThe current situation looks good from a technical point of view. The rebound of the Bitcoin price up from the support of 46,934.61 creates prerequisites for growth in the sideways to the level of 51,697.58 (upper green dotted line). Only the 47,848.69 horizontal is confusing, which the price has now rested on. If this level is confirmed as resistance, quotes may reverse. Therefore, we keep the 46,934.61 - 47,848.69 zone in focus. Consolidation below may be a signal for a deeper correction to $42,000, and its confirmation as support opens the way to $51,000. But this is in the regular market, for now, it is worth making allowances for limited liquidity and a thin market. But when big capital returns after the holidays, analysts expect the main cryptocurrency to grow in the first half of 2022.
|
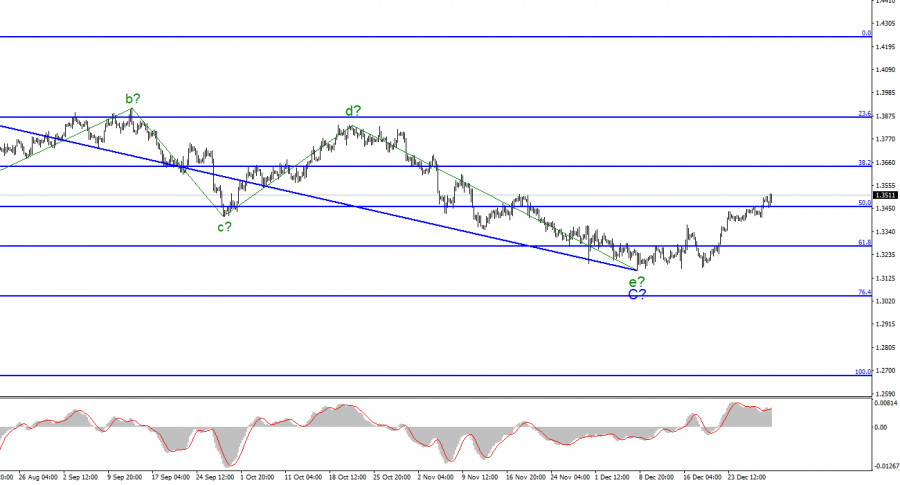
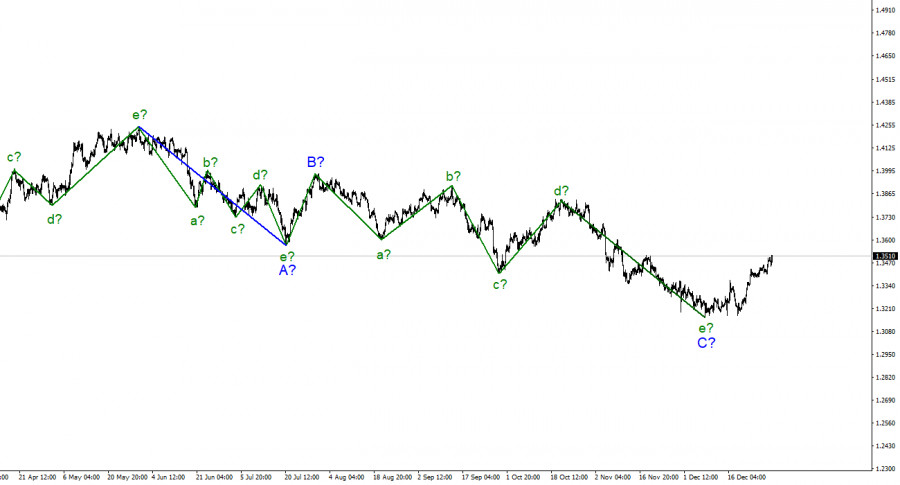
| GBP/USD Wave Analysis on December 30: British pound continues to build an upward wave Posted: 30 Dec 2021 09:06 AM PST
The wave pattern for the Pound/Dollar instrument continues to look quite convincing. The increase in quotes in recent weeks suggests the construction of wave D. However, the current increase in quotes can also be interpreted as the first wave of a new upward trend segment. A three-wave structure is visible inside this wave. If it is still wave D, then this "fairy tale" can end very quickly for the pound. If not, then the increase of the instrument will continue with the targets located around the 36th and 38th figures. The second attempt to break the 50.0% Fibonacci level was successful, which indicates the readiness of the markets for further purchases. Now I conclude that the construction of an upward wave continues. COVID-19 cases continue to rise in the U.K.The exchange rate of the Pound/Dollar instrument moved with average strength on Thursday. The instrument dropped by 50 basis points, and then rose by 65, which was not bad at all, plus the construction of an upward wave continues. It is hard to say that the rise of the British pound is due to the news background. There were no interesting events in the U.K. or the U.S. today. And there haven't been any for quite some time. Thus, the British pound continues to rise only on the desire of the market to buy it. If the market had now paid attention to the growing number of Omicron cases in the U.K., it is unlikely that the purchases of the pound would have continued. At the same time, it is still too early to conclude that the construction of a downward trend section has been completed. After the completion of wave D, the decline in quotes may resume, and at the moment, we are faced with the need to build a corrective wave that has no news basis. General conclusions The wave pattern of the Pound/Dollar instrument looks quite convincing now. The supposed wave C has completed its construction, and wave D may be nearing this moment. Thus, now it is possible to consider selling the instrument with targets located near the calculated marks of 1.3272 and 1.3043, which corresponds to 61.8% and 76.4% by Fibonacci levels, for each downward signal from the MACD, counting on the construction of wave E. However, it is also advisable to wait for either a successful attempt to break through the 1.3454 mark, which corresponds to 50.0% Fibonacci level, or an unsuccessful 1.3642 mark, which equates to 38.2% Fibonacci level. |
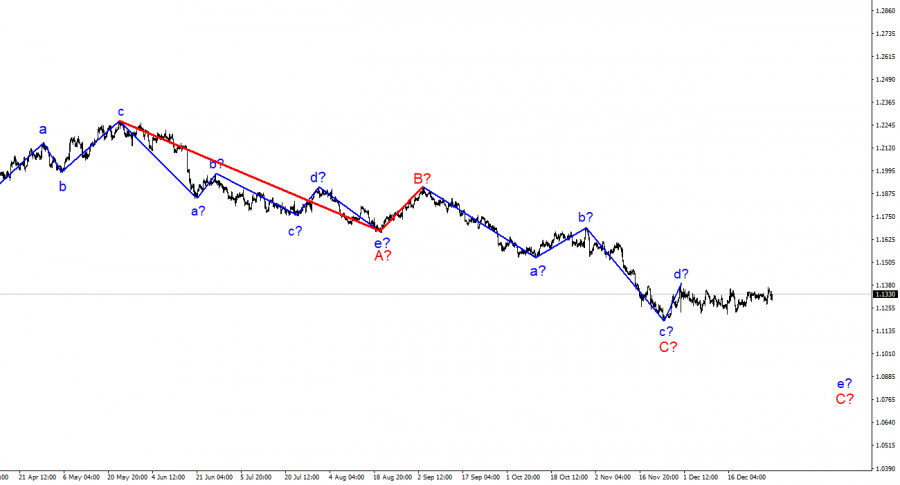
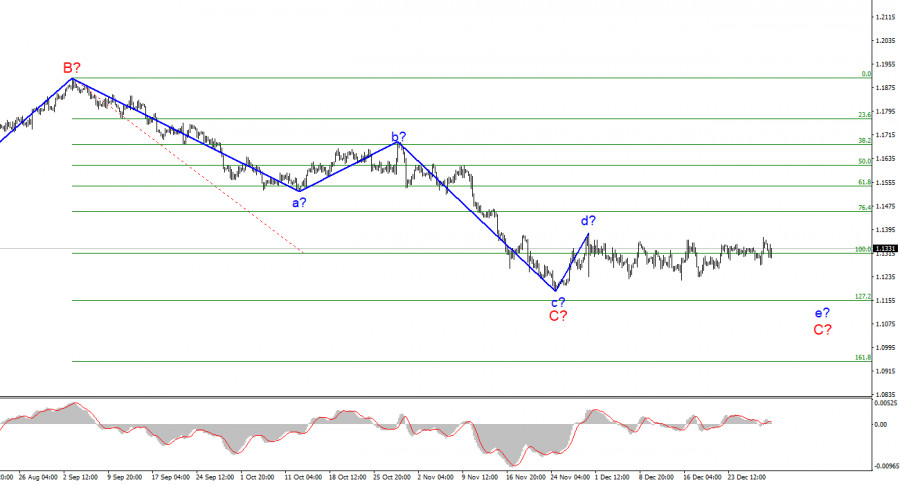
| EUR/USD Wave Analysis on December 30: Euro attempts to clarify the wave pattern Posted: 30 Dec 2021 08:44 AM PST
The wave pattern of the 4-hour chart for the Euro/Dollar instrument continues to remain integral and does not require additions. The construction of a downward wave e in C is still questionable since the current wave takes a very extended, horizontal form. If the downward wave does not continue its construction, then wave C will have to be recognized as three-wave and completed, although I believe that it should still take a five-wave form. The wave that originates on November 30 still cannot be attributed to either wave C or the first wave of a new upward trend segment, if it really is, since neither the peak of wave d in C nor the low of wave c in C has been broken over the past few weeks. In the current situation, we can only wait for the situation to develop. Given that the holidays have already begun and are continuing, the internal wave structure of the last wave may take on an even more extended form. And now it makes no sense to understand its internal ones, since this structure can turn out to be almost any length. New Year's Week continuesThere was again little news background for the EUR/USD instrument on Thursday. European Union was completely empty, while the U.S. released its report on jobless claims for the week. According to the report, this week's claims amounted to 198,000, while continuing claims dropped to 1.7 million. Note that the second indicator is often called the indicator of real unemployment. In any case, unemployment in the U.S. continues to decrease, which is very good for their economy. The Chicago PMI index was also released today. It rose to 63.1 points in December, which is also good for the U.S. currency. The amplitude of the instrument was more than 30 points, and the dollar went in high demand. However, all this happens inside the same horizontal movement in which the instrument has been for more than a month. Thus, if the markets took into account today's statistics from the U.S., then no special changes have happened anyway. It is unlikely that anything will happen tomorrow, although I note that the amplitude remains quite high. Especially for holidays. General conclusions Based on the analysis, I conclude that the construction of the downward wave C can be completed. However, the internal wave structure of this wave still allows the construction of another downward, internal wave. Thus, I advise selling the instrument with targets located around the 1.1152 mark, for each downward signal from the MACD, until a successful attempt to break the peak of wave d occurs. A restrictive order can be placed above the peak of wave d. |
| EUR/USD: Revaluation of Omicron will revive the plan for the fall of the euro Posted: 30 Dec 2021 08:24 AM PST
Volatility has increased in the currency markets in the last days of the year. Thin trading conditions continue to increase the risks of sudden uncontrolled movements, so traders will closely monitor technical levels. The EUR/USD pair hinted at bullish momentum, but it was lost after the monthly maximum tested the day before in the area of 1.1370. Buyers have no facts, looking at which you can confidently push the euro up. On the contrary, both pictures, both fundamental and technical, speak in favor of a further decline in the single currency. First of all, these are different monetary plans of the Fed and the ECB. The day before, a member of the ECB's Governing Council suggested that inflation in the eurozone would remain above the target level in the new year, while another representative of the regulator hastened to assure that the Central Bank would not reduce incentives and prepare for a rate hike. Christine Lagarde made it clear at the December meeting that there was no need to increase the rate. First, the Central Bank will curtail the program and only then will think about whether there is a need to raise rates. Both the previously outlined prospects and the new comments of ECB members restrain and will restrain attempts to strengthen the euro. While the EUR/USD pair is trading below 1.1400, the risks of entering a downward trajectory are very high, analysts say. The road to the top is closed, all attempts to break through above will be immediately stopped.
Earlier, there were suggestions that the growth of the euro was fueled by optimistic sentiment in the markets, which in turn were supported by positive news about Omicron. Now there is a different reaction: a surge in the number of infected causes alertness and the veil of Omicron optimism gradually subsides. The data of the last two days showed that the new strain is not so harmless and may well force countries to introduce lockdowns, although many are now opposed. In France, Italy, the USA, there is a huge surge in the number of infected. Investors may not have suspected that the number of infected people would turn into the so-called quality, but this is already happening. Moreover, now is only the beginning of a new wave that is gaining momentum. If you look at the indicators for the total number of hospitalized, weekly hospitalizations, and weekly cases of admission to intensive care wards, you can see that the situation is rapidly deteriorating. The introduction of quarantine will be inevitable when the number of hospitalized people approaches critical levels. The situation in France, Italy, Spain, and the USA is the worst right now. Moreover, in the States, the workload of hospitals is approaching the levels of the summer wave. In such circumstances, it would be logical to expect a decrease in risk appetite in the markets in the coming days. At the very beginning of the year, a revaluation may take place, and not for the better for the same euro, which is already under strong pressure. Significant support is marked at 1.1300. If the closing price is below this level, the probability of further drawdown in the area of 1.1270 will increase. The resistance is located at 1.1340 and 1.1360. On the eve of the euro, it was possible to look beyond its limits, although not for long. This underscores the importance of this resistance. The material has been provided by InstaForex Company - www.instaforex.com |
| The end of the year turns out to be a bad one for Tesla Posted: 30 Dec 2021 08:17 AM PST The US highway traffic safety regulator has released information that Tesla Inc will recall more than 475,000 of its Model 3 and Model S electric vehicles. The company intends to make such a move due to problems with the rear-view camera and trunk, which increase the risk of a collision. The end of the year turns out to be a bad one for Tesla
The American electric car manufacturer is recalling 356,309 2017-2020 Model 3 cars to solve problems with the rear-view camera and 119,009 Model S cars due to problems with the front hood, the National Highway Traffic Safety Administration (NHTSA) reported. The total number of recalled vehicles is approaching half a million vehicles put on the market by the company last year. According to the management, in Model 3 sedans, "the wiring harness of the rear-view camera may be damaged when opening and closing the trunk lid, which prevents the display of the image from the rear-view camera." In Model S cars, in turn, problems with the front hood latch can lead to the trunk opening "without warning and make it difficult for the driver to see, increasing the risk of an accident." According to NHTSA, Tesla has no data on any accidents, injuries, or deaths related to problems with its Model 3 and Model S cars. Now the department is investigating Tesla on other issues, in particular, in connection with the controversial decision of the automaker to allow games to be played on the screens of cars while they are in motion. At the moment, Tesla has already agreed to ban the playback of video games on vehicle screens while cars are moving, according to NHTSA. In August, NHTSA opened an official safety check of the Tesla Inc Autopilot driver assistance system after a series of accidents involving Tesla models and emergency vehicles. Under pressure from NHTSA in February, Tesla agreed to recall 135,000 vehicles with touchscreens that could fail and increase the risk of an accident. Tesla shares fell 1.1% in premarket trading on Thursday. The material has been provided by InstaForex Company - www.instaforex.com |
| Trading signals for GBP/USD on December 30 - 31, 2021: buy in case of rebound off 1.3427 (6/8) Posted: 30 Dec 2021 07:34 AM PST
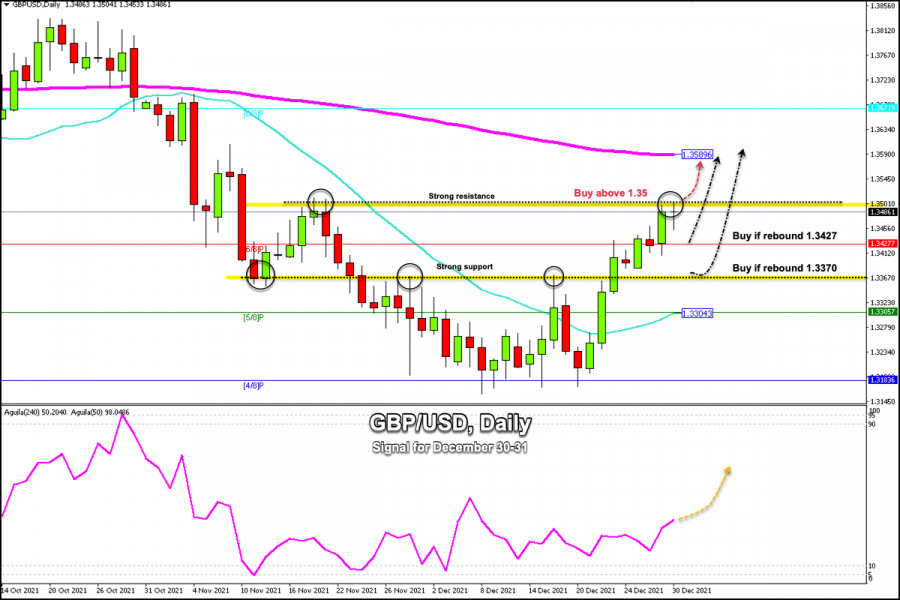
The British pound has reached a key resistance and a psychological level around 1.3500. The GBP/USD pair was last trading around this price level on November 18. As the 1.35 level represents a strong resistance for the British pound, it is expected that below this zone there will be a technical correction towards 6/8 Murray around 1.3427. On the contrary, if the pound closes daily above 1.3500, it is more likely that in the next few days it can reach the EMA 200 located at 1.3590. On the daily chart, the zone near 1.3370 can be seen as strong support and the 1.35 zone as a strong resistance for the British pound. In view of the low trading volume of the market, a technical correction towards the support at 1.3370 is likely. We can sell and buy within these ranges of prices between 1.3500 – 1.3370 until the market defines its next move. Since the British pound reached the support level of 1.3183 (4/8), there has been a strong bullish movement for eight days. It is now approaching the key level of EMA 200 located at 1.3590. If in the next few hours the pound breaks the area of 1.35 and consolidates above this level, it is likely that it can test the strength of this moving average. If it surpasses this level, it is likely to reach 8/8 of Murray around 1.3671. The Eagle indicator is giving a positive signal and any technical correction is likely to be an opportunity to buy as long as it remains above the 21 SMA located at 1.3304. Our trading plan is to keep an eye on the key level of 1.35 if it manages to break this zone, we can buy with targets at the 200 EMA at 1.3590. On the other hand, a technical bounce in the zone of 1.3427 will be a new opportunity to buy the British pound. Support and Resistance Levels for December 30 - 31, 2021 Resistance (3) 1.3596 Resistance (2) 1.3555 Resistance (1) 1.3521 ---------------------------- Support (1) 1.3464 Support (2) 1.3427 Support (3) 1.3373 *********************************************************** A trading tip for GBP/USD on December 30 - 31, 2021 Buy in case of a rebound off at 1.3427 (6/8) with take profit at 1.35 and 1.3589 (200 EMA), stop loss below 1.3390. The material has been provided by InstaForex Company - www.instaforex.com |
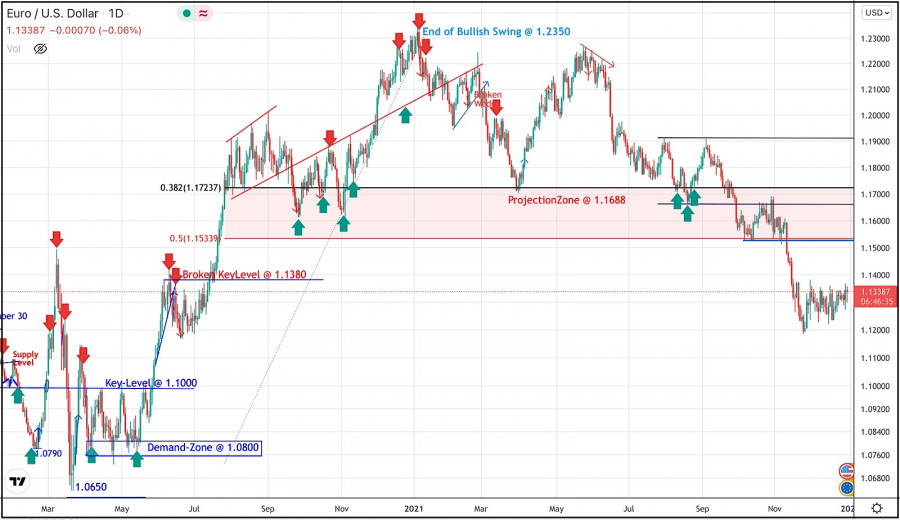
| December 30, 2021 : EUR/USD daily technical review and trading opportunities. Posted: 30 Dec 2021 07:24 AM PST
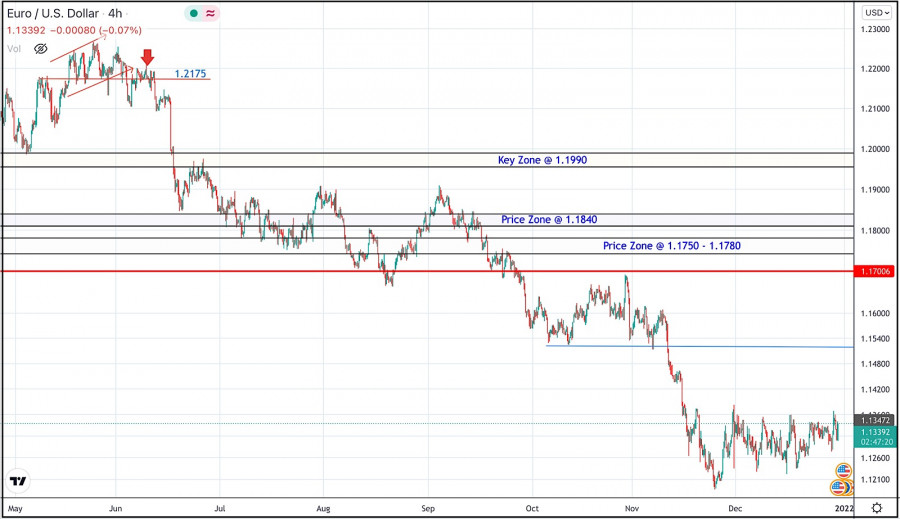
During the past few weeks, the EURUSD pair has been trapped within a consolidation range between the price levels of 1.1700 and 1.1900. In late September, Re-closure below the price level of 1.1700 has initiated another downside movement towards 1.1540. Price levels around 1.1700 managed to hold prices for a short period of time before another price decline towards 1.1200. Currently, the price zone around 1.1500 stands as a prominent supply-zone to be watched for SELLING pressure and a possible SELL Entry upon any upcoming ascending movement. Moreover, it is not advised to add new SELL Entries as the pair already looks oversold. The material has been provided by InstaForex Company - www.instaforex.com |
| December 30, 2021 : EUR/USD Intraday technical analysis and trading plan. Posted: 30 Dec 2021 07:19 AM PST
The bullish swing that originated around 1.1650 in August, failed to push higher than the price level of 1.1900. That's why, another bearish pullback towards 1.1650 was executed. However, extensive bearish decline has pushed the EURUSD pair towards 1.1600 and lower levels was reached. Shortly after, significant bullish recovery has originated upon testing the price level of 1.1570. The recent bullish pullback towards 1.1650-1.1680 was expected to offer bearish rejection and a valid SELL Entry. Significant bearish decline brought the EURUSD pair again towards 1.1550 levels which stood as an Intraday Support zone. Hence, sideway movement was demonstrated until quick bearish decline occurred towards 1.1200. Please note that any bullish movement above 1.1500 should be considered as an early exit signal to offset any SELL trades. The price levels around 1.1520 remain a reference zone that needs to be re-visited when the current bearish momentum ceases to dominate. The material has been provided by InstaForex Company - www.instaforex.com |
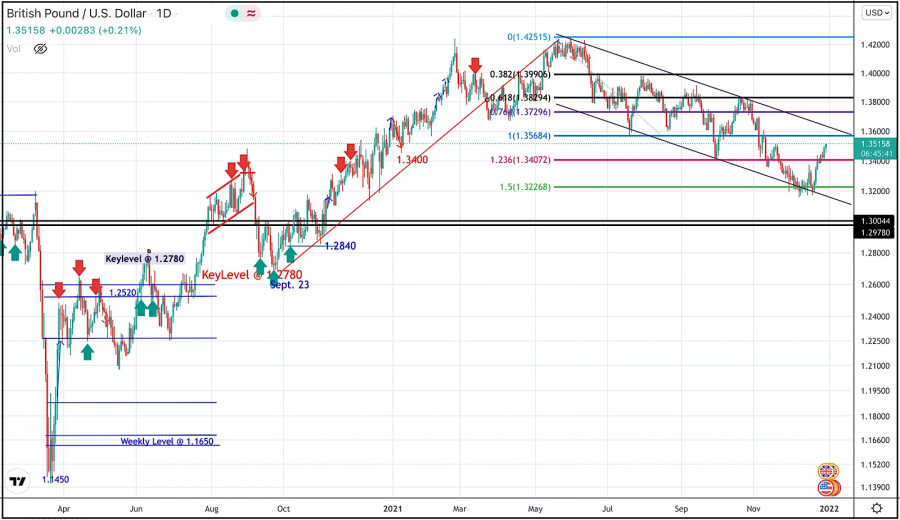
| December 30, 2021 : GBP/USD Intraday technical analysis and significant key-levels. Posted: 30 Dec 2021 07:18 AM PST
The GBPUSD pair has been moving sideways with some bearish tendency while bearish breakout below 1.3600 was needed to enhance further bearish decline. Bearish breakout below 1.3700 enabled quick bearish decline to occur towards 1.3400 which corresponded to 123% Fibonacci Level of the most recent bearish movement. This was a good entry level for a corrective bullish pullback towards 1.3650 and 1.3720 which was temporarily bypassed. Shortly after, the pair was testing the resistance zone around 1.3830 where bearish pressure originiated into the market. More bearish extension took place towards 1.3220 where the lower limit of the current movement channel came to meet with Fibonacci level. Conservative traders should have taken BUY trades around 1.3200 price levels as suggested in previous articles. Current BUYERS are looking towards 1.3570 and 1.3600 as the next target levels to have some profits off the trade. Moreover, the price level of 1.3570 stands as a key-resistance to be watched for bearish reversal if some bearish signs existed upon testing. The short-term outlook remains bullish as long as the pair maintains its movement within the depicted channel above 1.3400. The material has been provided by InstaForex Company - www.instaforex.com |
| Stock America showed mainly growth Posted: 30 Dec 2021 06:59 AM PST
Stock America showed mostly growth, except for the NASDAQ indicator, which showed a slight decrease of 0.1%, while the broad S&P 500 added 0.14%, and the industrial Dow Jones - 0.25%. Although the S&P 500 and Dow Jones showed a slight increase, this did not prevent them from reaching new highs of 4,793.06 and 36,488.63 points, respectively. Investors continue to monitor the situation with a new type of coronavirus. According to experts, omicron is a more contagious form than the previous varieties, but easier in terms of the course of the disease. This gives traders confidence that it will not be necessary to introduce more stringent restrictive measures that can affect both the movement of people and business activity in countries. According to statistics, the foreign trade deficit in the United States increased by 17.5% last month, to a maximum level of 97.8 billion dollars. It should be noted that the October figure was $83.2 billion. At the same time, in November, exports decreased by 2.1% and reached $ 154.7 billion, while imports, on the contrary, increased by 4.7% and reached $ 252.4 billion. Another indicator - the indicator of unfinished real estate transactions - decreased by 2.2% in the previous month after an increase of 7.5% a month earlier. At the same time, according to analysts, this indicator should have grown by 0.5%. Compared to the same period last year, the drop was 2.7%. Since the founder of Tesla Inc. Elon Musk once again made a sale of securities of his company for $ 1 billion, the company's stock prices fell by 0.2%. In total, Musk sold 10% of the shares of Tesla at his disposal. Recall that earlier he conducted a survey on social networks, in which he consulted with followers about whether he should sell 10% of his shares, and the results of the vote showed that more than 80% voted "yes". Victoria's Secret & Co.'s stock prices rose by 12.2% due to an optimistic forecast regarding the company's revenue and revenues for the fourth quarter, as well as the planned purchase of shares totaling $ 250 million. As a result of the cancellation and postponement of several thousand flights, the paper of air carriers lost in price. Thus, the value of the securities of American Airlines Group Inc. decreased by 2.6%, United Airlines Holdings Inc. - by 1.9%, Delta Air Lines Inc. - by 1.2%. Alaska Air Group Inc.'s stock prices fell 1.4% after reporting a 20% decrease in the number of flights from Seattle due to worsening weather conditions, as well as a shortage of staff. After the scandal caused by the accusation of Medallion Financial Corp. and its director Andrew Murstein's involvement in fraudulent schemes aimed at increasing the price of the company's shares, the stock prices fell sharply in price by (21%). The material has been provided by InstaForex Company - www.instaforex.com |
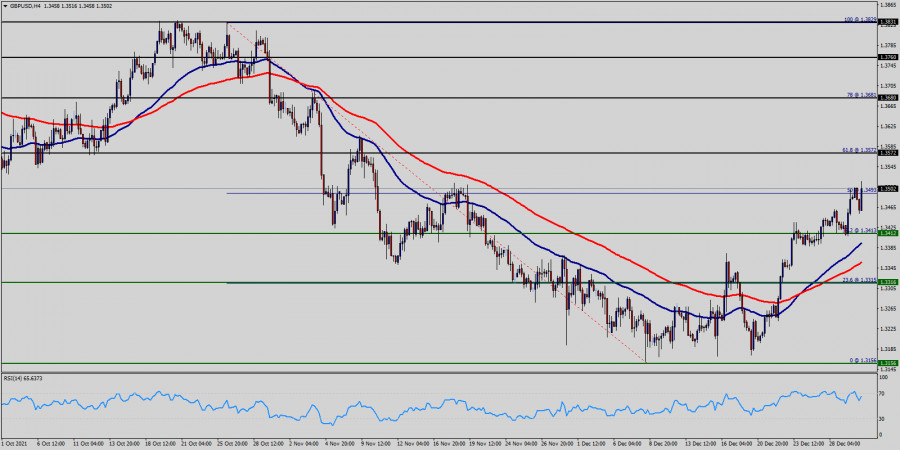
| Technical Analysis of GBP/USD for December 30, 2021 Posted: 30 Dec 2021 05:54 AM PST
GBP/USD : We expect to see a strong reaction off this level to push price down towards 1.3572 (61.8% Fibonacci retracement, horizontal swing low support). Price is testing major resistance at 1.3572. RSI (14) sees a bearish exit of our ascending support-turned-resistance line signalling that we'll likely be seeing some bearish momentum from here. Price is testing major resistance at 1.3572 (Fibonacci retracement, bearish bar harmonic formation) and we expect to see a strong reaction off this level to push price down towards 1.3500 before 1.3412 support (Fibonacci retracement, horizontal swing low support). The pair is trading below its pivot point. It is likely to trade in a lower range as long as it remains below the pivot point. Short positions are recommended with the first target at 1.3412. A break of that target will move the pair further downwards to 1.3412. The bias remains bearish in nearest term testing 1.3412 – 1.3316. Immediate resistance is seen around 1.3525. Briefly, if the pair fails to pass through the level of 1.3525, the market will indicate a bearish opportunity below the strong resistance level of 1.3572. In this regard, sell deals are recommended lower than the 1.3572 level with the first target at 1.3412. It is possible that the pair will turn downwards continuing the development of the bearish trend to the level 1.3316. However, stop loss has always been in consideration thus it will be useful to set it above the last double top at the level of 1.3603 (notice that the major resistance today has set at 1.3572). The material has been provided by InstaForex Company - www.instaforex.com |
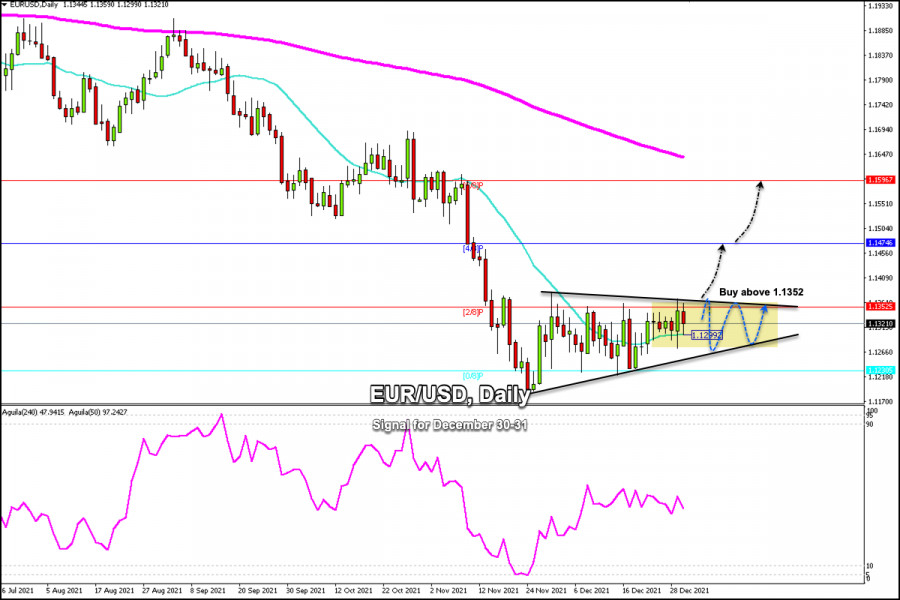
| Trading signals for EUR/USD on December 30 - 31, 2021: buy above 1.1352 (21 SMA) Posted: 30 Dec 2021 05:44 AM PST
The euro is consolidating above the 21 SMA located at 1.1299 and below the strong resistance of 2/8 Murray located at 1.1352. Since November 24, it has been forming the Ascending Wedge technical pattern. The pair movement is likely to continue within this pattern in the coming days, due to the low volume of the market. According to the daily graph, a positive bias is observed for the euro-dollar. As long as it remains above 1.1300 and continues to trade within the technical Wedge pattern, we could expect the euro to make a sharp break above 1.1352. A sharp break and consolidation in daily charts above the resistance of 2/8 Murray located at 1.1352 will be a confirmation of the signal for a new bullish wave in the euro in the short term. If the euro consolidates above 1.1350 in the next few days, the first target will be the zone of 4/8 Murray located at 1.1474 and then it could reach 6/8 Murray and the level of 200 EMA located at 1.1650. Conversely, if the euro fails to consolidate above 2/8 Murray and above 1.1360, there is likely to be a technical correction targeting the bottom or bullish line of the Wedge pattern. Support and Resistance Levels for December 30 - 31, 2021 Resistance (3) 1.1413 Resistance (2) 1.1384 Resistance (1) 1.1357 ---------------------------- Support (1) 1.1288 Support (2) 1.1248 Support (3) 1.1230 *********************************************************** A trading tip for EUR/USD on December 30 - 31, 2021 Buy above 1.1352 (2/8) with take profit at 1.1474 and 1.1596 (6/8), stop loss below 1.1320. The material has been provided by InstaForex Company - www.instaforex.com |
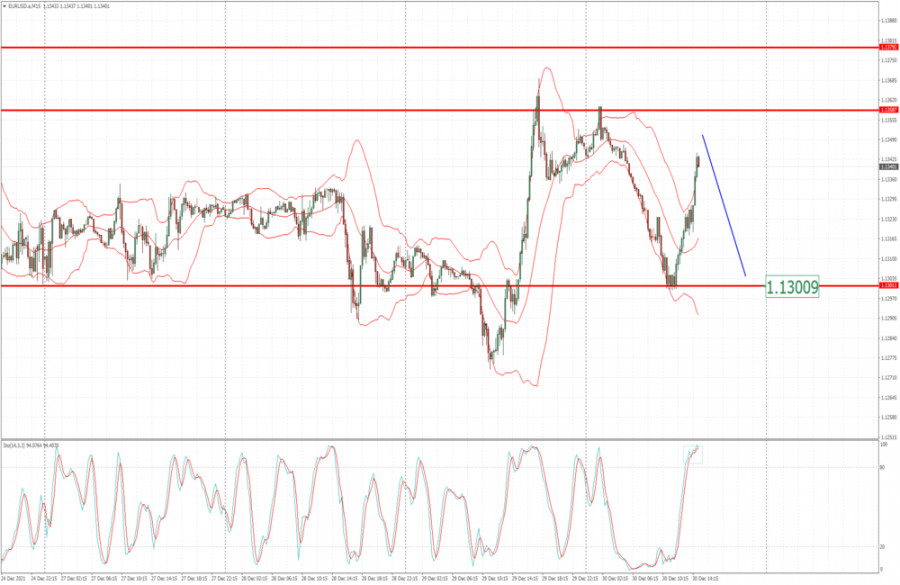
| EUR/USD analysis for December 30, 2021 - Potential for downside rotation Posted: 30 Dec 2021 05:18 AM PST Technical analysis:
EUR/USD has been trading flat today at the price of 1,1330 but there is potential for the downside rotation towards 1,1300. Trading recommendation: EUR/USD is still trading in the big sideways regime on thee higher time-frame but there is potential for the downside rotation on intraday prospective. Watch for selling opportunities on the rallies with the downside objective at 1,1300 ad 1,1285. Stochastic is showing extreme overbought condition, which is sign for potential downside rotation. Key support is set at the price of $1,790 The material has been provided by InstaForex Company - www.instaforex.com |
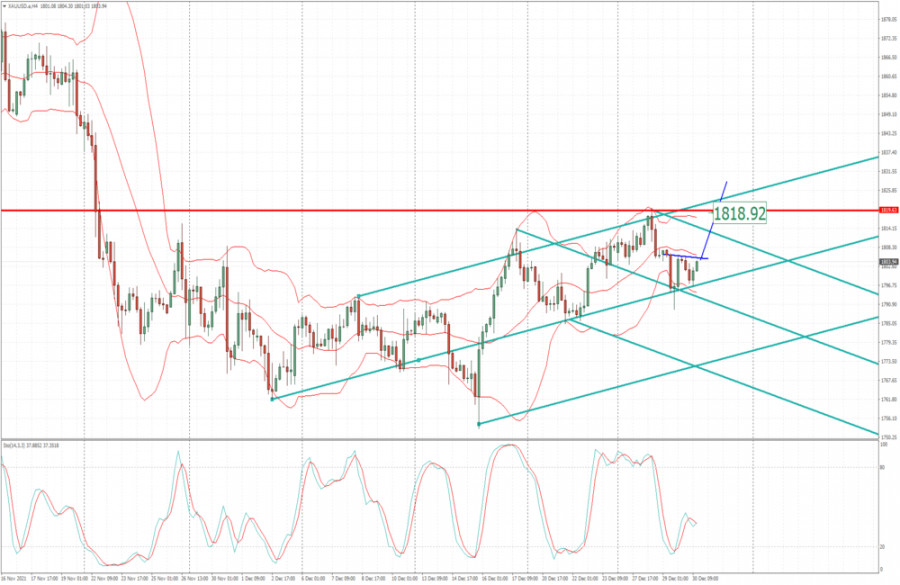
| Analysis of Gold for December 30,.2021 - Potential for upside continuation Posted: 30 Dec 2021 04:53 AM PST Technical analysis:
Gold has been trading sideways at the price of $1,804 but I see potential for the upside rotation due to support on the test. Trading recommendation: Due to potential double bottom and rejection of the Pitchfork trend lines, I see fuhrer upside rotation. Watch for buying opportunities with the upside objective at $1,818 Stochastic is showing another fresh bull cross, which is good sign for further upside continuation. Key support is set at the price of $1,790 The material has been provided by InstaForex Company - www.instaforex.com |
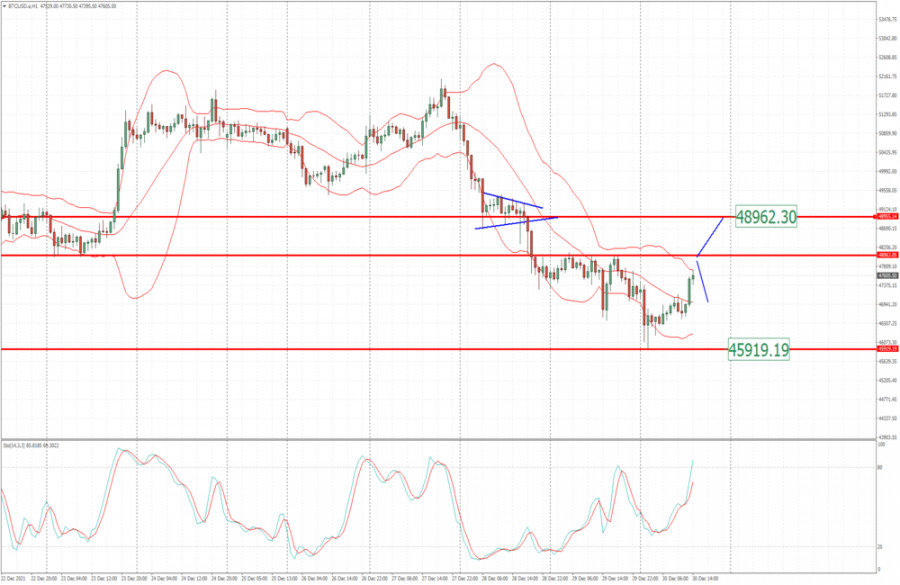
| BTC analysis for December 30,.2021 - Key pivot level at $48.065 Posted: 30 Dec 2021 04:46 AM PST Technical analysis:
BTC has been trading upside today but there is important resistance at the price of $48,063. Trading recommendation: Watch carefully price action around key pivot level at $48,063 to confirm further direction. Upside breakout with good momentum can confirm further test of $48,960 Rejection of the key pivot at $48,063 can confirm downside rotation towards $45,920 Stochastic is showing bull condition but with fast line on the overbought condition. The material has been provided by InstaForex Company - www.instaforex.com |
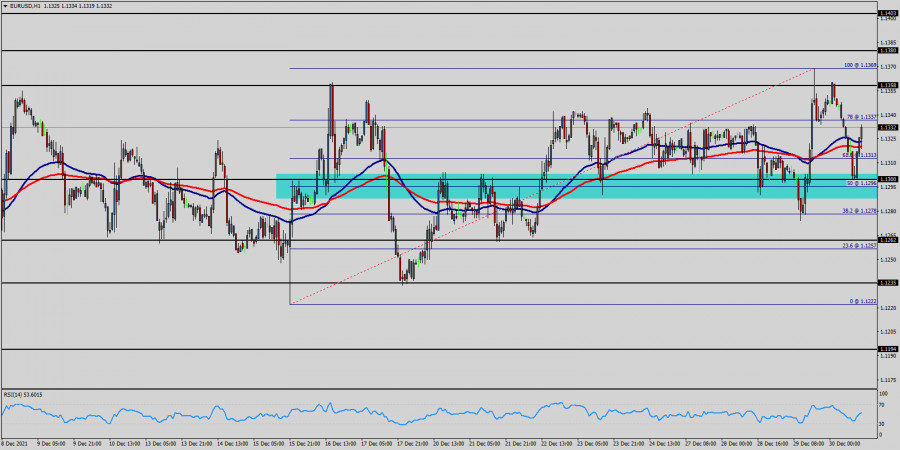
| Technical Analysis of EUR/USD for December 30, 2021 Posted: 30 Dec 2021 04:45 AM PST
The EUR/USD pair dropped sharply from the level of 1.1370 towards 1.1300. Now, the price is set at 1.1337. On the H1 chart, the resistance is seen at the levels of 1.1380 and 1.1403. Volatility is very low for that the EUR/USD pair is still expected to be moving between 1.1280 and 1.1403 in coming hours. In the short term, we expect the EUR/USD pair to continue to trade in a bullish trend from the new support level of 1.1280 to form a bullish channel. Also, it should be noted that major resistance is seen at 1.1403, while immediate resistance is found at 1.1380. According to the previous events, the pair is likely to move from 1.1280 towards 1.1380 and 1.1403 as targets. However, if the pair fails to pass through the level of 1.1403, the market will indicate a bearish opportunity below the level of 1.1403. So, the market will decline further to 1.1300 in order to return to the support (2). Moreover, a breakout of that target will move the pair further downwards to 1.1222 (last bearish wave). The material has been provided by InstaForex Company - www.instaforex.com |
| Video market update for December 30,,2021 Posted: 30 Dec 2021 04:36 AM PST Potential for the breakouts.... The material has been provided by InstaForex Company - www.instaforex.com |
| Posted: 30 Dec 2021 03:54 AM PST
On the 4-hour chart, the pair rose to the upper boundary of the half-side and half-down corridor. Thus, the reversal in favor of the greenback was made. A new downside movement towards the corrective level of 161.8% (1.1148), which is located at the same place as the lower boundary of the corridor, started. A consolidation above the corridor did not happen, so bullish traders are retreating from the market again. There are no emerging divergences in any of the indicators today. News calendar for US and EU: US - Number of initial jobless claims (13-30 UTC). On Thursday, there will be no important economic events in the US and EU. One report in the US is unlikely to affect the mood of traders. I believe that the information backdrop today will have no effect on the mood of the traders. EUR/USD outlook and tips for traders: There was a pullback from 1.1357, so we should have used this sell signal to open a position. Target is 1.1250 on the hourly chart. I recommend buying the pair on a signal of the rebound from 1.1250 or lower border of the sideways corridor on the hour chart, as well as on a signal of closing above the corridor. In the first case the target will be 1.1357, in the second case the target will be 1.1450. The material has been provided by InstaForex Company - www.instaforex.com |


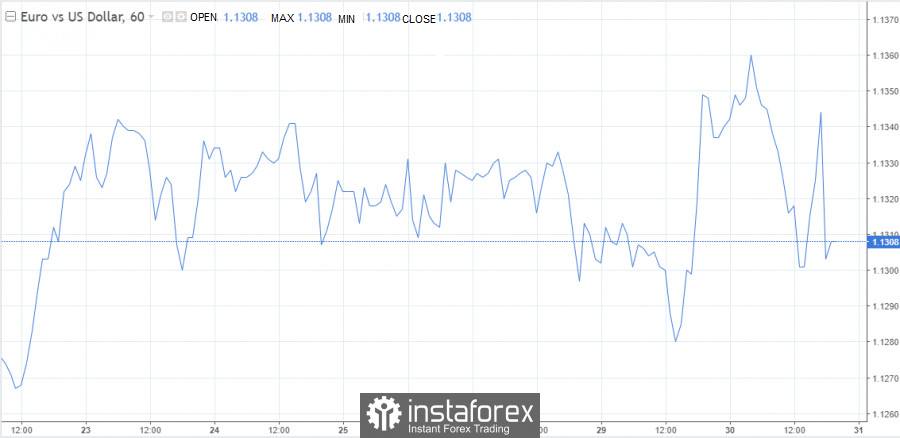

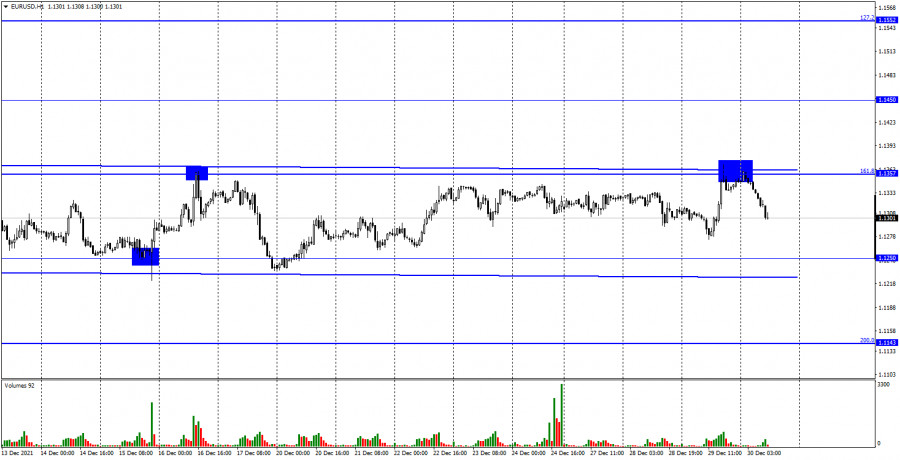 On Wednesday, the EUR/USD pair turned in favour of the European currency and rose strongly towards the retracement level of 161.8% (1.1357) as well as towards the upper boundary of the sideways corridor, which still characterises the current mood of traders as neutral. The pair's rebound from both the level and the boundary has already favoured the American currency and the drop towards 1.1250 has begun. However, all these movements are still taking place within the sideways corridor. Thus, the general chart pattern has not changed for more than a month. Trading volumes remain very low, but the pair is moving very fast. This is probably due to the small number of traders remaining in the market. It takes much less effort from bulls or bears to make the pair move now. The information background remains the same at the moment. Yesterday there were no important economic reports, no important events, no statements, and no speeches.
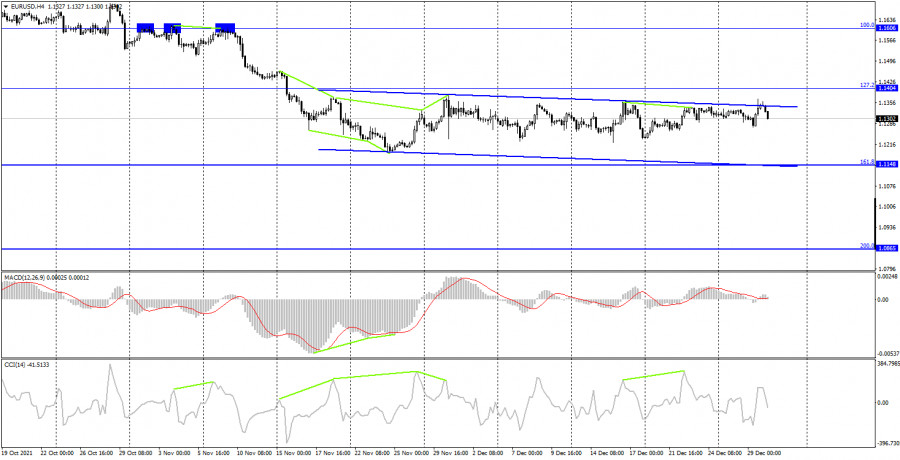
| You are subscribed to email updates from Forex analysis review. To stop receiving these emails, you may unsubscribe now. | Email delivery powered by Google |
| Google, 1600 Amphitheatre Parkway, Mountain View, CA 94043, United States | |


Comments