Forex analysis review
Forex analysis review |
- Litecoin narrow range ready to explode
- EUR/USD upside invalidated, larger drop favored
- Gold retreats ahead of another rally
- USD/JPY trapped within triangle pattern
- Bitcoin: $55,000 replaces $100,000 year-end forecast
- Bitcoin faces hard time to stay afloat: the Fed takes a hawkish position and catches up with horror on investors
- AUD/USD: Markets ignored positive Australian employment report
- December 17, 2021 : EUR/USD daily technical review and trading opportunities.
- December 17, 2021 : EUR/USD Intraday technical analysis and trading plan.
- December 17, 2021 : GBP/USD Intraday technical analysis and significant key-levels.
- The biggest cryptocurrency scams in 2021
- The largest Chinese developer Evergrande has been assigned a default rating
- Analysis of Gold for December 17,.2021 - Potential for bigger drop
- EUR/USD analysis for December 17, 2021 - Rejection of key resistance
- Video market update for December 17,,2021
- EURUSD technical view.
- Gold is trading above $1,800
- Technical Analysis of GBP/USD for December 17, 2021
- Ethereum gets rejected at resistance.
- BTC analysis for December 17,.2021 - Potential for another drop
- Asian stock markets trade lower following central banks decisions
- Technical Analysis of EUR/USD for December 17, 2021
- GBP/USD: plan for the US session on December 17 (analysis of morning deals). The pressure on the pound returned after an
- EUR/USD: plan for the US session on December 17 (analysis of morning deals). Euro buyers defended 1.1321, but more activity
- Forecast for GBP/USD on December 17 (COT report). The Bank of England discouraged traders
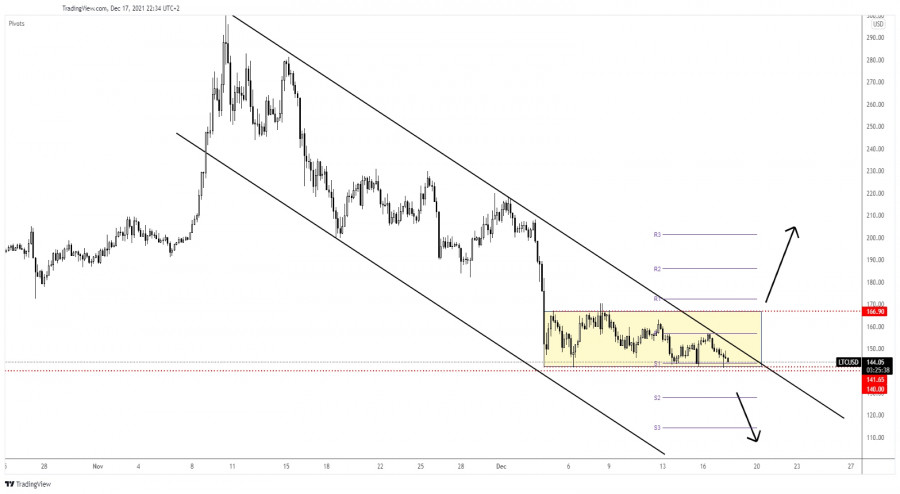
| Litecoin narrow range ready to explode Posted: 17 Dec 2021 01:09 PM PST The Litecoin is trapped within a narrow range, but the formation could be complete soon. The crypto cannot move sideways infinitely, a valid breakout could bring new opportunities. LTC/USD is traded at 144.36 above 141.27 today's low. As you already know, Bitcoin moves somehow sideways as well. A strong move in BTC/USD also may help Litecoin to develop a strong movement. The bias is bearish, so a further drop is in cards. LTC/USD long or short
LTC/USD stands above 141.65 - 140.00 support zone and below the downtrend line. A valid breakdown below the support area could signal more declines, while a valid breakout above the downtrend line may announce a potential leg higher, a bullish reversal. The pressure is high as long as the rate is traded below the downtrend line. It has failed to come back higher towards the 166.90 static resistance. Technically, a larger upwards movement will be announced by a valid breakout above 166.90. LTC/USD forecastStaying below the downtrend line and dropping below 140.00 psychological level could open the door for a larger drop and could bring new selling opportunities. Staying above 140.00 followed by a valid breakout above the downtrend line may signal potential growth at least towards 166.90. The material has been provided by InstaForex Company - www.instaforex.com |
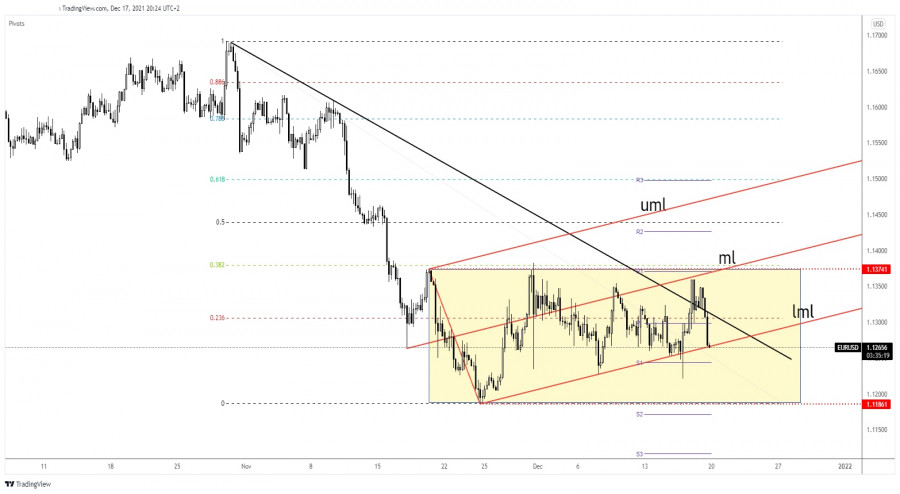
| EUR/USD upside invalidated, larger drop favored Posted: 17 Dec 2021 12:31 PM PST The EUR/USD pair was plunging at the time of writing as the Dollar Index has managed to rebound. The price invalidated a potential bullish reversal, so a deeper drop is in cards again. As you already know from my previous analysis, the US Dollar remains strong despite a temporary depreciation. The DXY was too overbought to be able to climb higher after the FOMC, that's why we have a short-term retreat. Fundamentally, the Eurozone Final CPI was reported at 4.9% matching expectations, while the Final Core CPI rose by 2.6% as expected. Unfortunately for the Euro, the German IFO Business Climate dropped from 96.6 to 94.7 far below 95.3 estimates, while the German PPI registered only a 0.8% growth versus 1.4% expected. EUR/USD false breakouts
EUR/USD failed to stabilize above the downtrend line invalidating a potential leg higher and a reversal. Now, it challenges the Ascending Pitchfork's lower median line (lml) which stands as a dynamic support. Closing and stabilizing under this line may activate a deeper drop towards 1.1186. As you can see the pair is still trapped between 1.1374 and 1.1186 levels. After failing to reach the 1.1374, the EUR/USD pair could come back down towards the range's support. EUR/USD outlookIts false breakouts above the downtrend line and the aggressive sell-off through the 1.1300 psychological level signaled strong sellers and more declines. Actually, the aggressive drop below 1.13 and under 23.6% was seen also as a short opportunity. After the current drop, the EUR/USD could come back to test and retest the broken levels before resuming its downtrend. A larger downside movement will be activated by a valid breakdown below 1.1186. The material has been provided by InstaForex Company - www.instaforex.com |
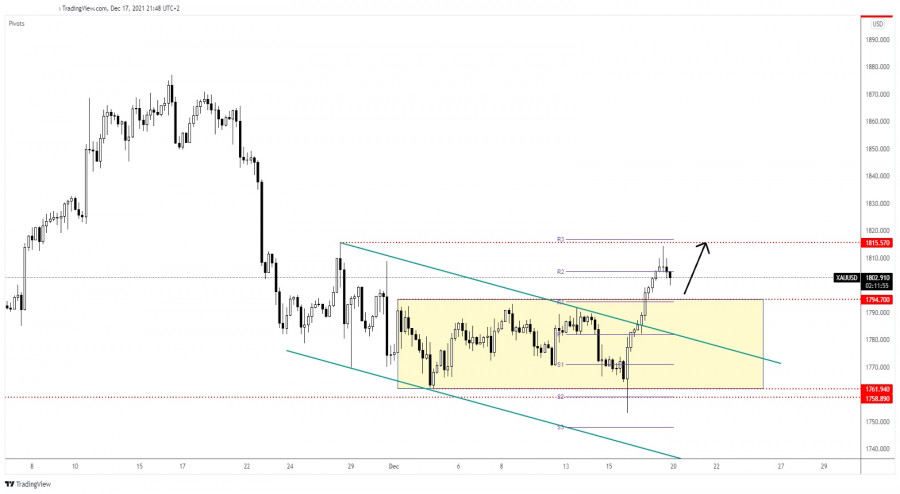
| Gold retreats ahead of another rally Posted: 17 Dec 2021 12:30 PM PST The price of gold was falling at the time of writing after showing overbought signs. A minor decline was expected after its amazing rally. The yellow metal comes back down trying to accumulate more bullish energy to attract more buyers before resuming its growth. In the short term, it could only test and retest the immediate support levels before jumping higher. XAU/USD is traded at 1,802.91 below 1,814.30 today's high. The price registered a 3.49% growth from 1,753.07 Wednesday's low to 1,814.30 today's high. Fundamentally, Gold remains strong after higher inflation reported by the US and by the UK during the week. XAU/USD is used as a hedge for inflation, so the bias remains bullish. XAU/USD natural decline
As you can see on the h4 chart, Gold registered an amazing rally and it has escaped from the range pattern between 1,761.94 and 1,794.70 levels after registering a false breakdown with great separation on Wednesday. Now, it has failed to reach the 1,815.57 static resistance signaling exhausted buyers. It's traded below the weekly R2 (1,805.04). Staying below it could signal a potential drop towards the 1,794.70 static support (resistance turned into support). Gold predictionThe current drop could help the buyers to catch a new upside movement. When the current drop ends, we'll have a new long opportunity. Technically, the retreat could be over around 1,794.70. A minor consolidation above this level or only false breakdowns below it could announce a new leg higher. The material has been provided by InstaForex Company - www.instaforex.com |
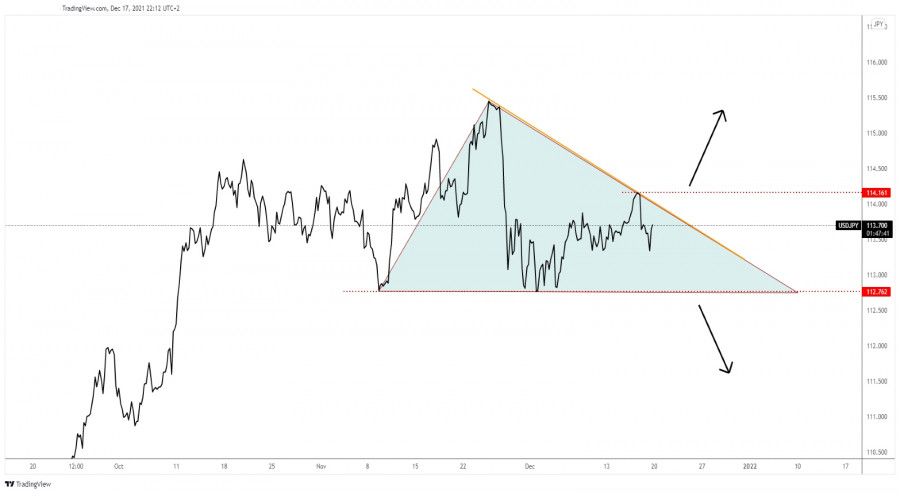
| USD/JPY trapped within triangle pattern Posted: 17 Dec 2021 12:27 PM PST
USD/JPY seems undecidedThe USD/JPY pair moves somehow sideways in the short term. The price action developed a triangle chart formation. Escaping from this pattern could bring new trading opportunities and a clear direction. In the short term, as long as it stays below the downtrend line, under the triangle's upside line, USD/JPY could come back down towards 112.76. USD/JPY trading conclusionThe currency pair could extend its uptrend and climb towards new highs if it jumps above the downtrend line and above 114.16 former high. On the other hand, staying below the downtrend line and dropping below the 112.76 downside obstacle could announce a larger downside movement. The material has been provided by InstaForex Company - www.instaforex.com |
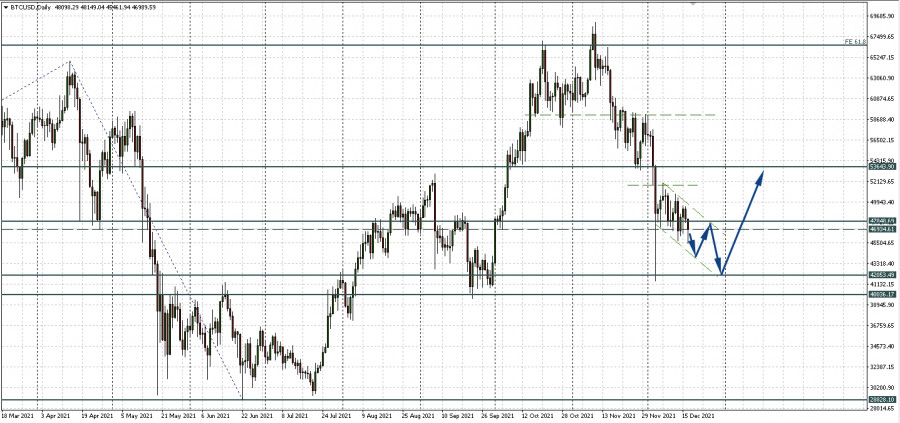
| Bitcoin: $55,000 replaces $100,000 year-end forecast Posted: 17 Dec 2021 11:30 AM PST Bitcoin has been trading in a local downtrend all week, more like consolidation. As a result, we see a return to testing the strength of the support zone 46,934.61 - 47,848.69 with the prospect of its breakdown. But we have already discussed this scenario. The key boundary for BTCUSD now remains the zone of $40,000 - $42,000 per coin. Over the past five days, there have been no strong drivers on the market that could set a clear direction for the main cryptocurrency. The situation is very uncertain and, to some extent, morally exhausting for those who expect clarity from the market. On the other hand, crypto traders are no strangers to it. Bitcoin often gets stuck in consolidation ranges. Their formation indicates either the wait-and-see attitude of large players, or that someone is gaining positions. Waiting for the Christmas rallyMeanwhile, the crypto community is dominated by discussion of two main topics: unfulfilled forecasts for Bitcoin's growth to $100,000 by the end of the year and signs of a bullish reversal. Many opinion leaders now believe that the reversal is about to come. For example, Alex Kruger, an economist and crypto trader, predicts that Bitcoin and Ether may still grow by the end of the year. This will take place during the traditional Christmas rally. However, instead of 100,000, we are expecting a $55,000 Bitcoin rally. From a technical point of view, the more likely target, in this case, would be 53,000 per bitcoin, since there is a strong mirror level. To consolidate above it, a strong impulse is needed, and if this happens, the path to $58,000 will already be open for BTCUSD. But there are obstacles in the way to Bitcoin's growth. Now the market, according to Kruger, needs to remember the tightening of the Fed's monetary policy. For cryptocurrencies, the rise in borrowing costs can be a headwind, and further upward movement can be difficult. Although in the long term, the Fed may even help the market. Traders accumulate Bitcoin, as evidenced by the concentration of TetherMeanwhile, on-chain data aggregator Santiment tweeted that the purchasing power of traders on exchanges surged to a six-month high. They attribute this to the growing concentration of USDT, suggesting that Bitcoin accumulation may be occurring in this way. According to the Santiment analytical team, the concentration of Tether stablecoins on centralized cryptocurrency trading platforms has reached a six-month high. That's 22.5%, or $ 8.99 billion, when converted to fiat money. At the same time, it became known, according to the analytical firm Glassnode, that the number of Bitcoins sent by miners to exchanges has dropped sharply. The Miners to Exchange Flow Index (seven-day MA) hit a five-year low at 2.655 BTC. Additional data from Santiment recently showed that bitcoin whales accumulate the main cryptocurrency in their accounts. The company's analysts believe that this is a good sign, which may indicate an upcoming rise in the price of BTC.
|
| Posted: 17 Dec 2021 11:13 AM PST
It seems that all the illusory and exorbitant forecasts of many analysts and crypto enthusiasts are not destined to come true. Bitcoin will not be able to overcome the $100,000 level by the end of this year. Now digital gold is associated with panic and fear among investors, and there are many speculators on the market. It is very difficult for Bitcoin to hold the $47,000 milestone, and the Fed is increasingly pumping horror into the crypto market and the main cryptocurrency. The Fed will pay special attention to inflation, the crypto market, interest rates, as well as reducing asset purchases. Analysts are confident that the Fed will be very tough on investors and will take an uncompromising hawkish position. Adhering to hawkish views, the Fed will increasingly raise interest rates and spoil the life of cryptocurrency owners. There is uncertainty and panic in the market right now. Bitcoin continues to fall and has already lost more than $20,000 from its historic high in November. The Fed's tough stance and bear market can lead to disastrous consequences for Bitcoin, and then the entire altcoin market. However, many analysts are confident that Bitcoin will survive this. Trader and analyst Rekt Capital believe that Bitcoin will pull through. It has already fallen by 40% before and even with a bull market, and now 38% will not become something supernatural for digital gold. If Bitcoin is trading above $42,000, then we can still talk about a favorable environment for it. The altcoin market is declining even more than Bitcoin. Well-known crypto analyst Michael van de Poppe believes that the market is getting rid of unnecessary elements. Speculators sell their crypto assets for quick profit due to the fear of an even greater fall, but they are not prudent and do not rely on the future. The material has been provided by InstaForex Company - www.instaforex.com |
| AUD/USD: Markets ignored positive Australian employment report Posted: 17 Dec 2021 10:49 AM PST All components of the Australian employment data turned out to be better than expected, despite the negative impact of the "coronavirus factor." AUD/USD traders reacted to the publication accordingly, updating the three-week high and testing the 72nd figure. But once at 0.7225, buyers moderated their ardor and recorded a profit, after which the pair rolled back, "driven" by dollar bulls. All this suggests that the aussie is still moving in the wake of the U.S. currency: the uncorrelation of the positions of the RBA and the Fed is playing on the side of the AUD/USD bears, while the macroeconomic successes of the Australian economy provide only temporary support for the aussie. As soon as the pair updates local highs, it attracts sellers who promptly extinguish the upside prospects. Such trends will be observed until the greenback weakens throughout the market – a large-scale growth of AUD/USD is possible only due to a large-scale devaluation of the U.S. dollar. But, taking into account the results of the last meeting of the Federal Reserve, the greenback will at least stay afloat in the foreseeable future.
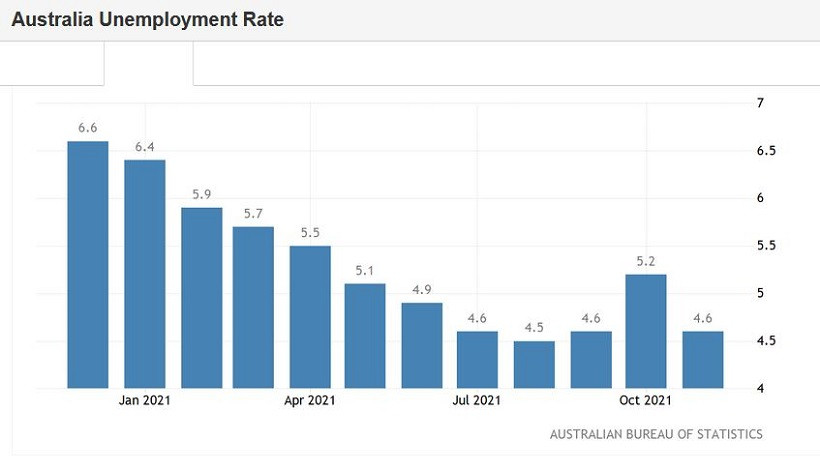
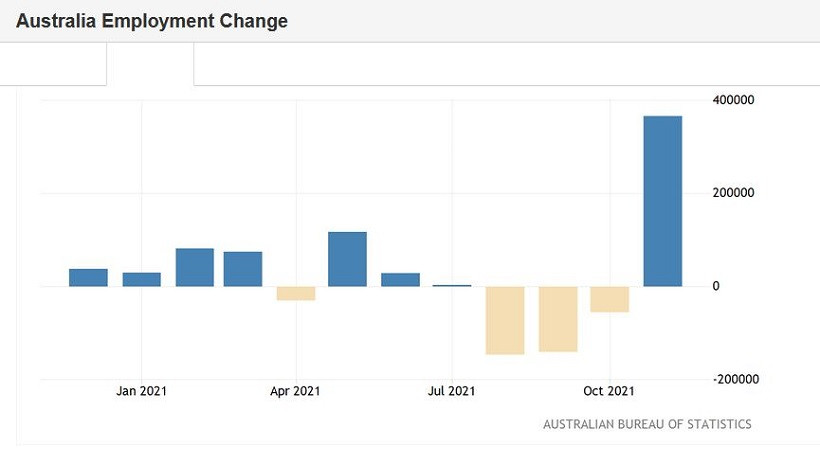
The November figures of the employment data reflected the recovery of the Australian labor market, leveling the concerns of Reserve Bank members that were voiced at the last meeting. Despite a protracted series of lockdowns, the country's economy withstood the blow and once again demonstrated stress resistance. The report released this week bears witness to this. The unemployment rate in Australia fell sharply in November – from 5.2% to 4.6%, although, according to preliminary forecasts, it was supposed to reach 5.0%. This indicator returned to the lows of the current year after the October surge to 5.2%. The unemployment rate was below the five percent level in June-September, and before that - more than two years ago, at the beginning of 2019, that is, long before the events of last year. In the run-up to the pandemic, this indicator has been fluctuating in the range of 5.0%-5.4% for many months. In other words, unemployment has returned to pre-crisis levels, and significantly ahead of schedule. Recall that the forecasts of the RBA announced at the February meeting of the Reserve Bank expected unemployment rate this year in the region of "6 percent," whereas, in their opinion, this indicator was supposed to return to the pre-crisis range of 5%-5.5% only in 2022. As you can see, the indicator decreased, firstly, at a faster pace relative to the initial forecasts, and secondly, it broke through the lower limit of the specified range, updating the two-year lows. It is also necessary to note the positive dynamics of the increase in the number of employed in November. The overall indicator also turned out to be better than forecasts, reaching 366,000 (with a forecast of growth of 200,000). This is a record growth rate for the entire history of observations. There is another "highlight" of this component. The structure of this indicator suggests that the overall growth was due to both partial and full employment (ratio 128,000/238,000). At the same time, it is known that full-time positions, as a rule, offer a higher level of wages and a higher level of social security compared to temporary part-time jobs. Therefore, the current dynamics in this regard is extremely positive. In other words, the report on the labor market turned out to be strong in all indicators: it reflected not only a jump in employment growth, but also a sharp decrease in unemployment, and against the background of an increase in the share of the working-age population (the indicator rose to 66.1%, this is the best result since June). Against the background of such positive data, the upside impulse of AUD/USD looked quite logical and reasonable. But despite such a strong report, the Australian could not stay within the 72nd figure. As soon as the U.S. dollar index woke up from suspended animation and crept up, aussie followed the greenback. Australian employment report immediately faded into the background.
This dynamics is explained by the continuing divergence of the position of the RBA and the Fed. Immediately after the release of data on the growth of the labor market in Australia, the head of the Reserve Bank, Philip Lowe, made his comments. On the one hand, he noted the success of the Australian economy, but on the other hand, he voiced quite "dovish" remarks. Lowe categorically ruled out the option of raising the rate within the next year. According to him, the Central Bank will not tighten monetary policy until actual inflation "settles steadily in the target range of 2-3%." According to the forecasts of the RBA, this will happen approximately in 2023. In other words, Lowe leveled the significance of the key data: firstly, he ruled out a rate hike within the next year, and secondly, he brought inflation to the fore, which demonstrates a fairly modest growth. While the Fed, let me remind you, not only announced the early curtailment of QE but also allowed the option of a triple rate hike (according to the Fed's point forecast). Summarizing all of the above, it should be noted that such a relatively weak market reaction to such a "chic" macroeconomic release speaks volumes. First of all, that the aussie will move in the wake of the U.S. currency in the foreseeable future. Given the hawkish attitude of the Federal Reserve and the opposite attitude of the RBA, it can be assumed that the downside trend of AUD/USD has not yet exhausted itself. Therefore, corrective spikes in the pair can be used to open short positions. At the moment, aussie is testing the support level of 0.7140 – this is the average line of the Bollinger Bands, coinciding with the Tenkan-sen line on the daily chart. It is advisable to go into sales after the bears overcome this price barrier and gain a foothold under it. The target of the downside movement is the 0.7040 mark – this is the lower line of the Bollinger Bands indicator on the same timeframe. The material has been provided by InstaForex Company - www.instaforex.com |
| December 17, 2021 : EUR/USD daily technical review and trading opportunities. Posted: 17 Dec 2021 07:20 AM PST
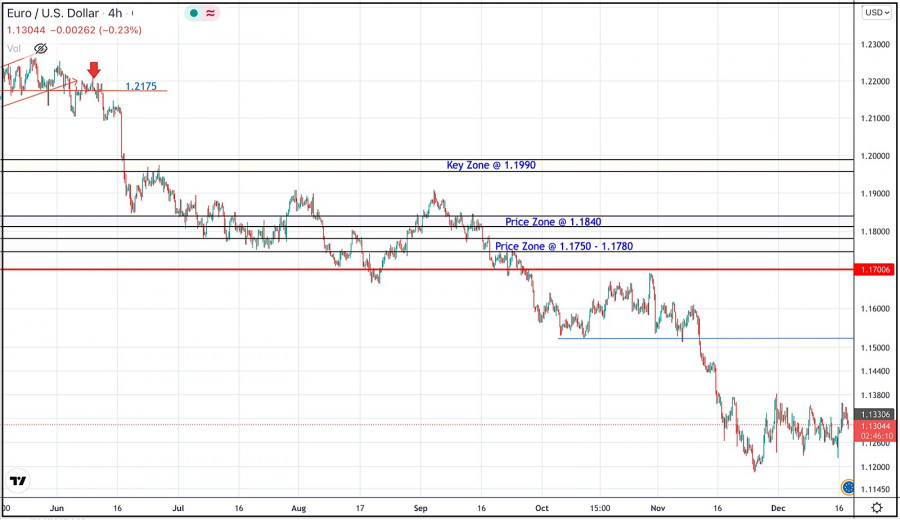
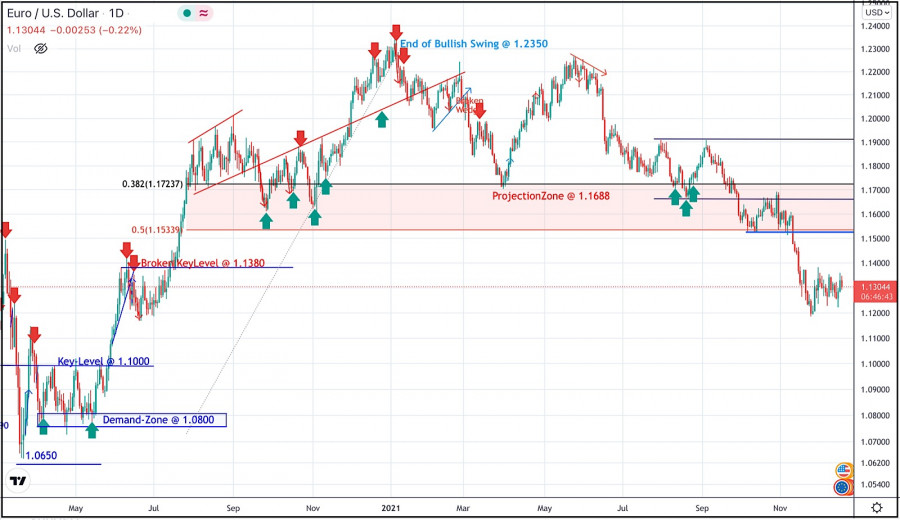
During the past few weeks, the EURUSD pair has been trapped within a consolidation range between the price levels of 1.1700 and 1.1900. In late September, Re-closure below the price level of 1.1700 has initiated another downside movement towards 1.1540 which managed to hold prices for a short period of time before another decline took place towards 1.1200. Currently, the price zone around 1.1500 stands as a prominent supply-zone to be watched for SELLING pressure and a possible SELL Entry upon any upcoming ascending movement. Moreover, it is not advised to add new SELL Entries as the pair already looks oversold. The material has been provided by InstaForex Company - www.instaforex.com |
| December 17, 2021 : EUR/USD Intraday technical analysis and trading plan. Posted: 17 Dec 2021 07:19 AM PST
The bullish swing that originated around 1.1650 in August, failed to push higher than the price level of 1.1900. That's why, another bearish pullback towards 1.1650 was executed. However, extensive bearish decline has pushed the EURUSD pair towards 1.1600 and lower levels was reached. Shortly after, significant bullish recovery has originated upon testing the price level of 1.1570. The recent bullish pullback towards 1.1650-1.1680 was expected to offer bearish rejection and a valid SELL Entry. Significant bearish decline brought the EURUSD pair again towards 1.1550 levels which stood as an Intraday Support zone. Hence, sideway movement was demonstrated until quick bearish decline occurred towards 1.1200. Please note that any bullish movement above 1.1500 should be considered as an early exit signal to offset any SELL trades. The price levels around 1.1520 remain a reference zone that needs to be re-visited when the current bearish momentum ceases to exist. The material has been provided by InstaForex Company - www.instaforex.com |
| December 17, 2021 : GBP/USD Intraday technical analysis and significant key-levels. Posted: 17 Dec 2021 07:18 AM PST
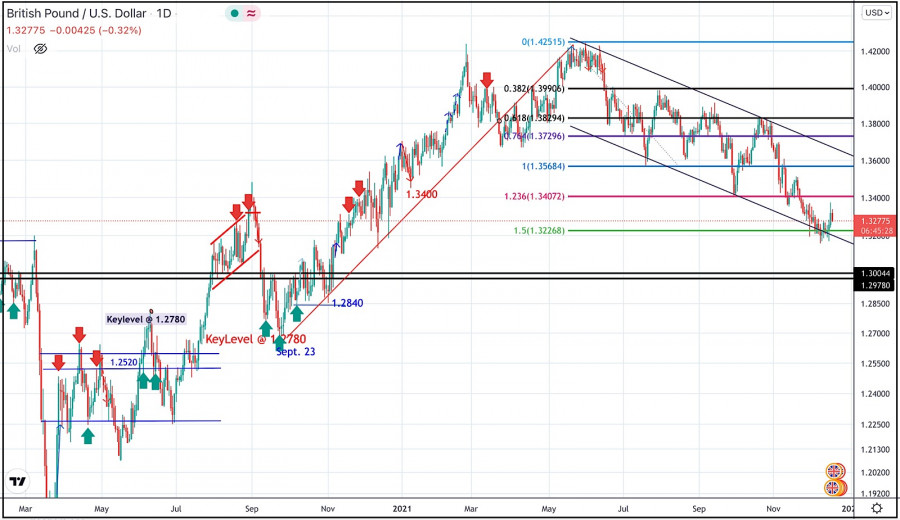
The GBPUSD pair has been moving sideways with some bearish tendency while bearish breakout below 1.3600 was needed to enhance further bearish decline. Bearish breakout below 1.3680 enabled further bearish decline towards 1.3400 which corresponded to 123% Fibonacci Level of the most recent bearish movement. This was a good entry level for a corrective bullish pullback towards 1.3650 and 1.3720 which was temporarily bypassed. Shortly after, the pair was testing the resistance zone around 1.3830 where bearish pressure originiated into the market. Currently, the intermediate-term outlook remains bearish as long as the pair maintains its movement within the depicted channel below 1.3400. More bearish extension was expected towards 1.3220 where the lower limit of the current movement channel came to meet with Fibonacci level. However, Conservative traders should be looking for BUY trades around these price levels after significant bullish recovery has originated around 1.3220. On the other hand, the price level of 1.3570 stands as a key-resistance to be watched either for bearish reversal or a continuation pattern upon any upcoming visit. The material has been provided by InstaForex Company - www.instaforex.com |
| The biggest cryptocurrency scams in 2021 Posted: 17 Dec 2021 07:17 AM PST Ether fell slightly after a good strengthening this Wednesday. Bitcoin remains trading in one place, testing the strength of the 46,900 level and the nerves of investors. Before talking about the technical picture, I would like to say a few words about cryptocurrency scams. DeFi has become a key scam area this year.
According to data from Chainalysis, crypto investors lost more than $2.8 billion in 2021 due to cryptocurrency scams. This year, scammers accounted for 37% of the total illicit proceeds from crypto scams exceeding $7.7 billion. For example, in 2020 this amount was at the level of $5 billion. The largest fraudulent scheme was the Turkish crypto exchange Thodex, accounting for most of the lost funds. The founders disappeared with the sum of $2 billion. In April 2021, this exchange ceased to function. This was followed by dogecoin AnubisDAO with $58 million, and the Uranium Finance exchange with $50 million also evaporated. Smaller companies Meerkat Finance, Evolved Apes, and Polybutterfly also took their rightful place in this list. Thodex was the only centralized exchange, while all the others belonged to the category of decentralized finance (DeFi). DeFi projects are based on smart contracts that are offered to users as financial services, such as trading, lending, or borrowing. Apparently, it's not for nothing that Senator Elizabeth Warren talked a lot about the risks associated with DeFi during her speech on Thursday. Let me remind you that, in her opinion, decentralized finance is the most dangerous part of the cryptocurrency world. It is there that a huge number of scammers are now concentrated, who are trying to attract large investors and traders to themselves. Brazil Passes New Cryptocurrency Bill The new cryptocurrency bill has been approved by the Brazilian Chamber of Deputies and is currently awaiting consideration by the Senate for approval. If the project is approved, a central body will be created to regulate all brokerage activities in the field of cryptocurrencies - allegedly the Central Bank of Brazil - where responsibility for crimes related to cryptocurrencies will also be established. The bill is intended to clarify the regulation of cryptocurrencies in the country. The draft, designated as Bill 2303/15 and proposed by Deputy Aureo Ribeiro, establishes definitions for exchanges and digital currencies. Supervision will be carried out by the central bank and this applies to all transactions related to cryptocurrency. The new law does not clearly distinguish cryptocurrencies by name, but instead uses the term "digital currencies." However, the draft clarifies that it does not affect the national digital currency, which is backed by real money. A digital currency is defined as a "value" that can be used electronically for payments or for investment purposes. As for the fines The text includes specific penalties for crimes related to cryptocurrency, and establishes a new fine for exchanges or market participants who illegally manage cryptocurrency portfolios from third parties. This crime is classified as embezzlement and is punishable by imprisonment for a term of four to eight years and a fine. As for the technical picture of Bitcoin
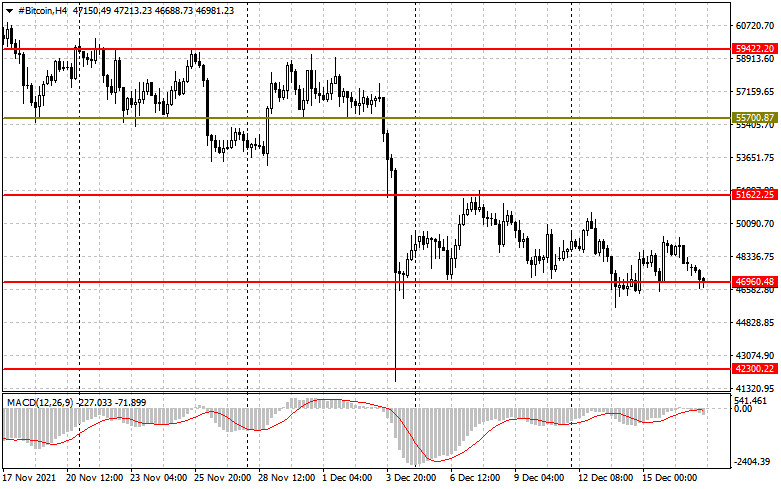
Trading remains in a fairly clear side channel, where I recommend taking action. The main task of buyers now is to grow to the level of $51,660 and its breakthrough, going beyond which will provide a good recovery to the area of $55,730, and there it is just around the corner to $59,400, which will put a fatal point to the fall of the cryptocurrency on December 3. It will be possible to talk about the return of pressure on BTC after its breakthrough of the $46,900 level, which will open the way for $42,300. However, active purchases around $46,900 and its retention will attract new investors to the market – a bullish signal for Bitcoin. As for the technical picture of Ether
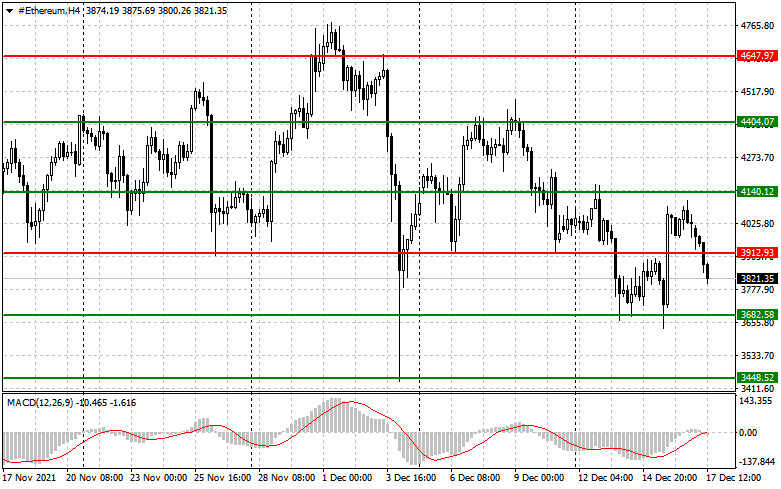
The growth of Ether quickly fizzled out, even falling short of the resistance of $4,140, which buyers had been counting on. Now the trade has moved below the $3,912 level, which creates certain problems for further upward correction. If the bulls fail to regain control of this level in the near future, it is possible that ETH will return to the support area of $3,680. In this case, the key task of the bulls will be to protect this particular range, since a breakthrough of this level is a very bad call for buyers at the end of this year. If buyers cope with the task and return the Ether above $3,912, then a new support will be formed in the area of $3,830, which will allow us to count on another attempt to grow above $4,140. A break in this range will open a direct road to the highs: $4,404 and $4,647. The material has been provided by InstaForex Company - www.instaforex.com |
| The largest Chinese developer Evergrande has been assigned a default rating Posted: 17 Dec 2021 07:04 AM PST The crisis in the real estate market of China continues to gain momentum. After the shares and bonds of the Chinese developer, Shimao Group fell sharply on Tuesday due to news of restructuring and overestimation of assets being sold, a new blow. Today, China Evergrande Group, the largest housing developer in the industry, was officially declared a default by the credit rating agency S&P Global. The announcement was published on Friday immediately after it became known that the overgrown firm missed a bond payment earlier this month. It has begun: the largest Chinese developer Evergrande has been assigned a default rating
"According to our estimates, China Evergrande Group and its offshore financial division Tianji Holding Ltd. They were unable to pay coupon payments on their issued senior bonds in US dollars," S&P said in a statement. S&P representatives add that Evergrande's management asked to raise the ratings after publication and designate their position as a "selective default" (a term that rating firms use to describe a missed payment on a bond, but not necessarily for all of its bonds). At the same time, the rating representatives note that "Evergrande, Tianji, or the trustee did not make any statements or confirmations to us about the status of coupon payments." Thus, the desire to revise the ratings is not based on anything. Now this news falls on the general background as unsuccessfully as possible. Even this spring, in the wake of the rise of the markets, China could afford even very large bankruptcies. But in the case of Archegos and other bankrupt investors who went down the drain a year earlier, this happened inside the financial sector, with little impact on the real economy. The bankruptcy of a developer who insures against risks with real estate - the most stable asset of all time, is a completely different conversation. People who invested in apartments will not receive them now. Builders will be out of work. Loans to banks will not be paid, and someone else will not get their loan. In 2008, the crisis began with the fact that housing prices began to fall, forcing banks to demand additional collateral from developers. A rollback of only 1-2% of the cost was enough to bankrupt the largest US mortgage company Lehman Brothers. We all know what it led to. Now the markets are more than calm. The hype in the real estate market pushes prices up due to the opportunity to hedge the risks of inflation by buying real estate. Therefore, it may seem insignificant to analysts to lose one, albeit a large, industry player. But let me remind you that last time the US government lowered interest rates to support the economy, and thereby saved the situation. Alas, this method has exhausted itself this year. The increase in the national debt cannot continue indefinitely. However, this time the scenario may be completely different. Bankruptcy against the background of inflation and production downtime due to coronavirus, only one large developer risks launching a cascade of bankruptcies, because the risk increases that people will stop paying for mortgages due to financial circumstances complicated by rising prices and downtime. Now it is difficult to assess how high the probability of a critical accumulation of a mass of outstanding loans is in the PRC, where such issues can be resolved quite harshly, and the debts of parents are usually inherited by children. However, now an outbreak of coronavirus is raging in the largest manufacturing province, which the authorities are not yet able to suppress following the Covid Zero policy. Many enterprises have been quarantined, and it is unlikely that workers are paid for downtime. In addition, taking into account the news from the Shimao Group, it can be assumed that turbulence is occurring in the Chinese real estate sector, which is not visible under the surface of the political sea. As a result, the population of China is getting poorer with each outbreak of the virus, just like the population of any other country where the epidemic is raging. The inability to pay interest on loans can undermine not only mortgage lending, but also financial stability in general. We should never forget about this factor. The Great Depression also began with a series of minor bankruptcies. The combination of inflation and a pandemic can play the worst joke on us in the last hundred years. However, the developer still has the opportunity to repay the obligations, probably with the help of government subsidies. In the meantime, this news will seriously undermine Asian indices in the next session, forcing investors to doubt the yuan as a safe-haven. The material has been provided by InstaForex Company - www.instaforex.com |
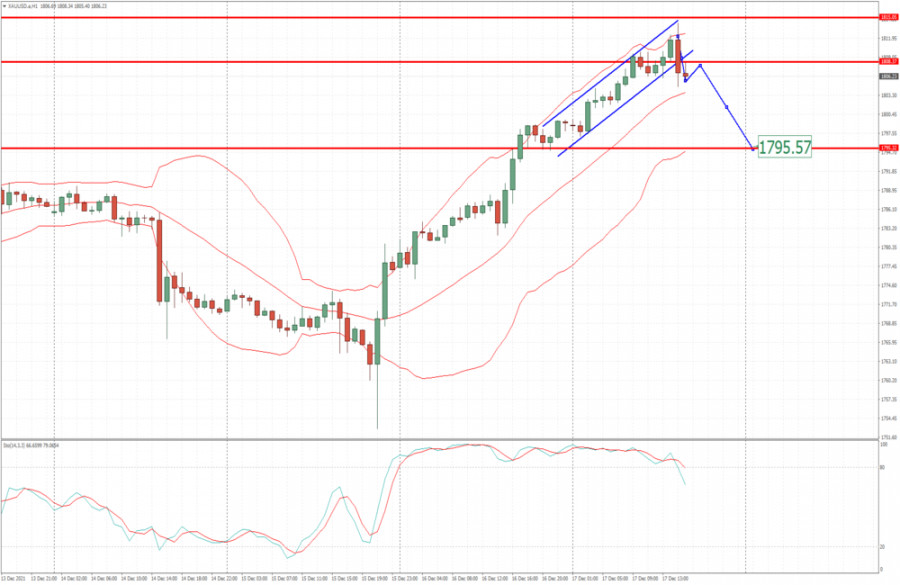
| Analysis of Gold for December 17,.2021 - Potential for bigger drop Posted: 17 Dec 2021 06:21 AM PST Technical analysis:
Gold has been trading downside in last few hours and I see potential for bigger drop due to breakout of rising channel. Trading recommendation: Due to overbought condition and breakout of the rising channel, I see potential for drop. Watch for selling opportunities on intraday rally with the downside objective at the price of $1,795 Stochastic oscillator is showing overbought condition and potential for the downside movement. Key resistance is set at the price $1,815 The material has been provided by InstaForex Company - www.instaforex.com |
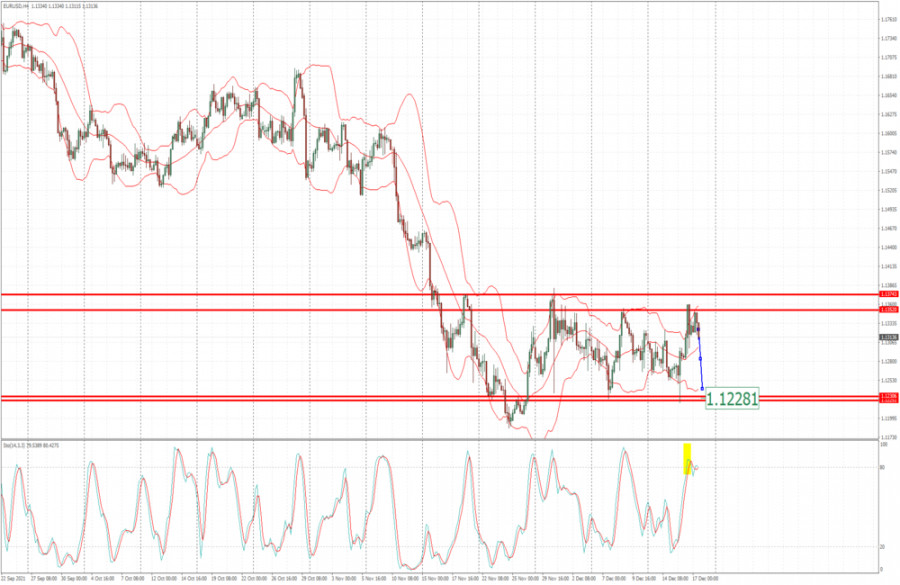
| EUR/USD analysis for December 17, 2021 - Rejection of key resistance Posted: 17 Dec 2021 06:11 AM PST Technical analysis:
Gold has been trading upside but I see potential for the downside movement due to overbought condition and potential for the downside breakout. Trading recommendation: Due to overbought condition and downside breakout of the rising channel, there is potential for the downside movement. Watch for selling opportunities on the rallies with potential for test of $1,795 Stochastic oscillator is showing overbought condition and potential for the downside movement. Key resistance is set at the price of $1,815 The material has been provided by InstaForex Company - www.instaforex.com |
| Video market update for December 17,,2021 Posted: 17 Dec 2021 05:49 AM PST Potential for drop on Gold The material has been provided by InstaForex Company - www.instaforex.com |
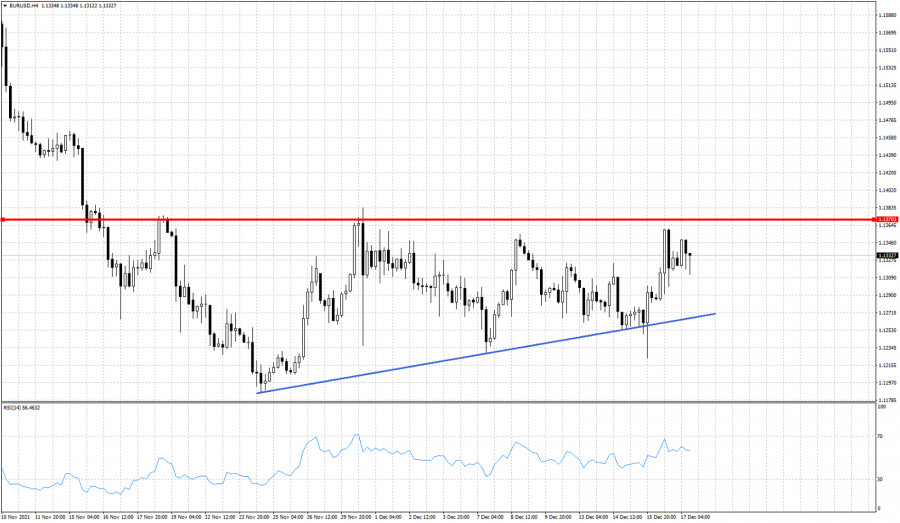
| Posted: 17 Dec 2021 05:26 AM PST EURUSD continues to trade above 1.13 but bulls have not managed yet to show an important sign of strength. During this week volatility rose due to the FOMC. Price tested the key support trend line and bulls managed to defend it. However in order for price to continue higher bulls need to show signs of strength.
Blue line- trend line support EURUSD bulls need to push price above the red horizontal resistance in order to provide a bullish signal. Price in Ichimoku cloud terms has already provided such a bullish signal, but bulls need to continue to support the trend. Failure to break above 1.1370 could lead to another pull back towards 1.1250. We continue to prefer to be neutral if not bullish at current levels, looking for a move at least towards the 1.1415 area. The material has been provided by InstaForex Company - www.instaforex.com |
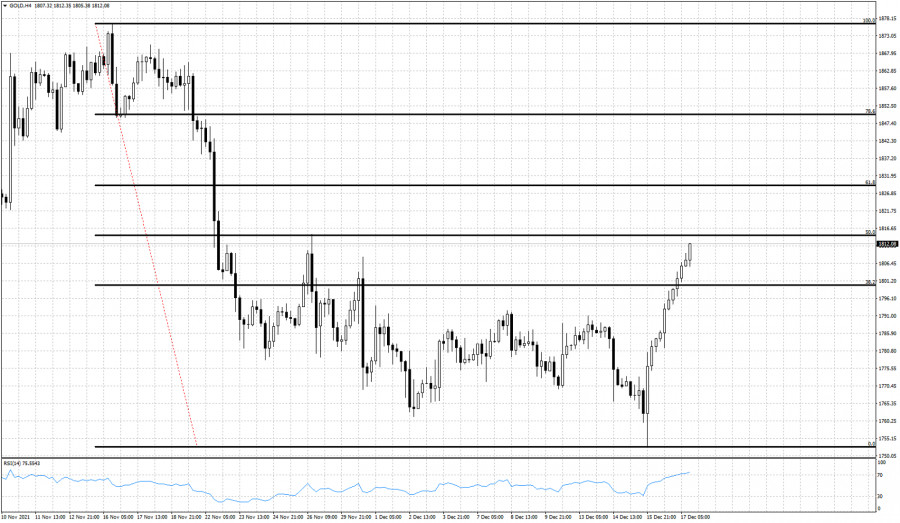
| Posted: 17 Dec 2021 05:23 AM PST In previous posts we warned Gold bears that price had all the technical justifications for a reversal and we also added the bullish signal by the Ichimoku cloud indicator. Gold price is now trading around $1,810 having retraced nearly 50% of the decline from $1,876.
Gold price easily broke above the 38% Fibonacci retracement. Short-term trend is bullish as price is making a sharp move higher with no looking back. Next important resistance level is at the 61.8% retracement level at $1,829. Since Gold price has not made any pull back since the $1,752 low from December 15th, I would not be surprised to see Gold pull back and test the 38% retracement from above.
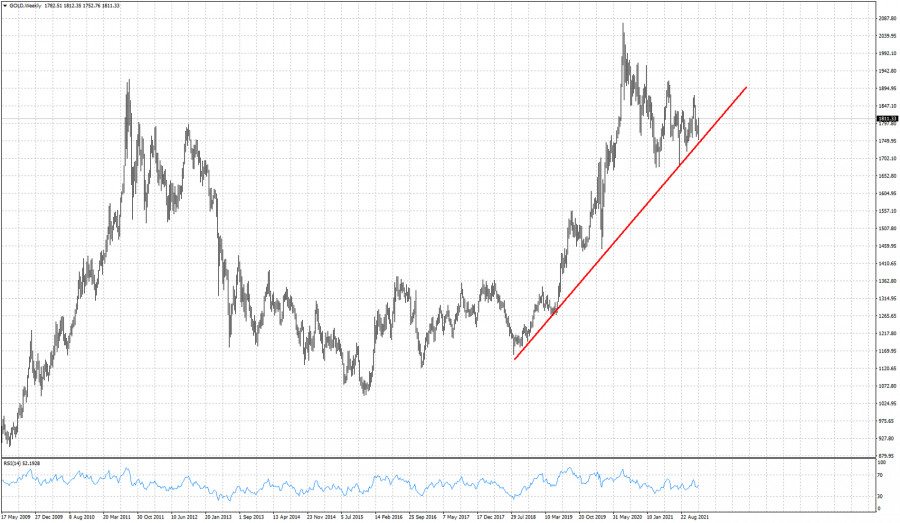
On a weekly basis Gold price continues to respect the red upward sloping trend line. Price nearly touched the trend line this week. Bouncing off the trend line is a bullish sign. This increases the importance of the recent low at $1,750 area. Any break below this level will be an important bearish signal that could lead price towards $1,400-$1,500. The material has been provided by InstaForex Company - www.instaforex.com |
| Technical Analysis of GBP/USD for December 17, 2021 Posted: 17 Dec 2021 05:20 AM PST
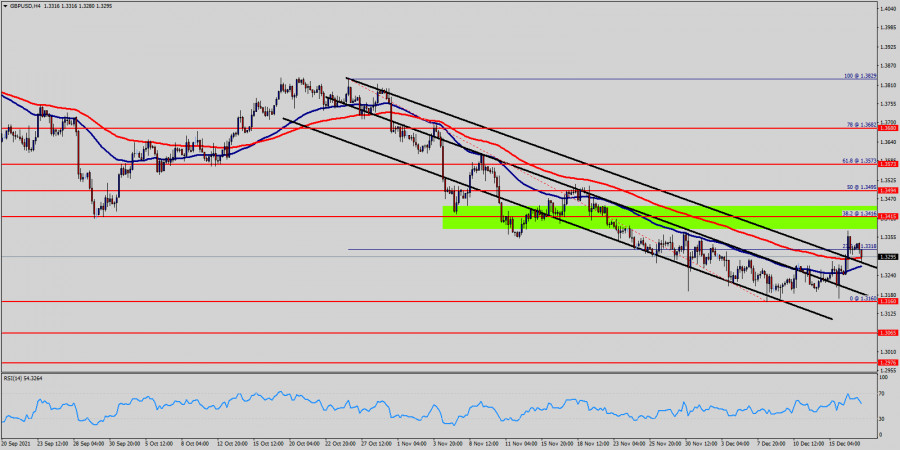
The GBP/USD pair continues to move upwards from the level of 1.3160. According to the previous events, the GBP/USD pair is still moving between the levels of 1.3160 and 1.3415; for that we expect a range of 255 pips (1.3415 - 1.3160). On the four-hour chart, immediate resistance is seen at 1.3573 (R3), which coincides with a ratio of 61.8% Fibonacci retracement. Currently, the price is moving in a bullish channel. This is confirmed by the RSI indicator signaling that we are still in a bullish trending market. The price is still above the moving average (100) and (50), Therefore, if the trend is able to break out through the first resistance level of 1.3303, we should see the pair climbing towards the daily resistance at 1.3415 and then towards 1.3573 to test it. It would also be wise to consider where to place stop loss; this should be set below the second support of 1.3065. Signal : Buy above the spot of 1.3300 with the targets 1.3415 and 1.3573. On the other hand, the daily strong support is seen at 1.3160. If the GBP/USD pair is able to break out the level of 1.3112 , the market will decline further to 1.3065. The material has been provided by InstaForex Company - www.instaforex.com |
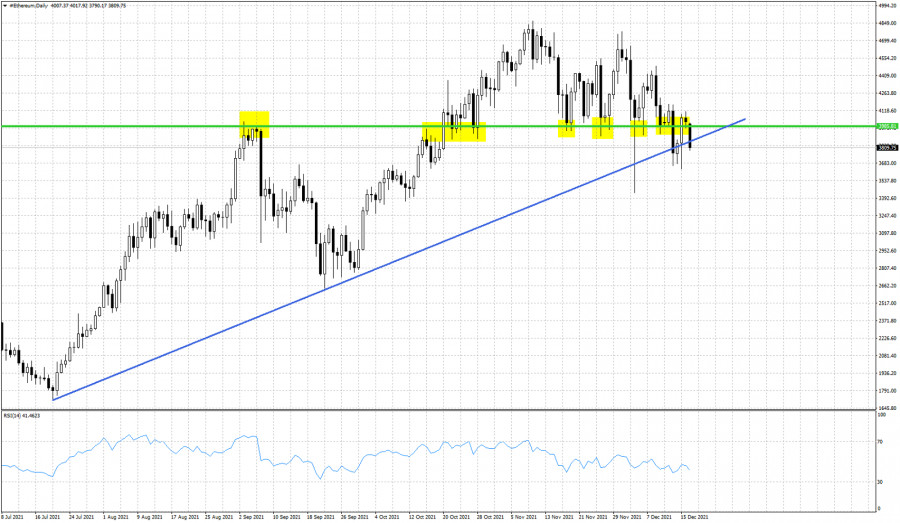
| Ethereum gets rejected at resistance. Posted: 17 Dec 2021 05:17 AM PST Ethereum broke below key horizontal support and trend line support this week. Price bounced and back tested the horizontal support which is now resistance. Price is getting rejected and turning lower again. Ethereum looks vulnerable to the downside.
Blue line- support (broken) Yellow rectangles- attempts on horizontal support Ethereum is making lower lows and lower highs. Short-term is bearish and there is a danger of a bigger correction/pull back lower as long as price is below $4,108-$3,985. Price got rejected at the back test of the horizontal resistance (previous support). Now price is breaking again below the blue upward sloping trend line. Failure to hold above recent lows at $3,635 will be an added bearish signal. The material has been provided by InstaForex Company - www.instaforex.com |
| BTC analysis for December 17,.2021 - Potential for another drop Posted: 17 Dec 2021 05:14 AM PST Technical analysis:
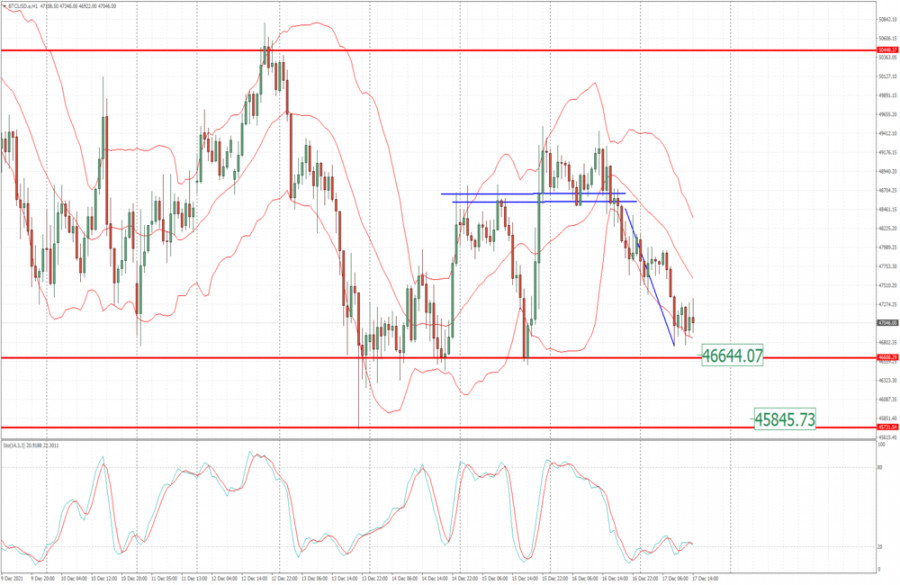
BTC has been trading downwards as I expected. The price is near the my main downside objective at the price of $46,645 Trading recommendation: Due to downside momentum and consolidation near the support, there is chance for the downside movement. Watch for selling opportunities with the downside objectives at $46,645 and $45,845 Stochastic oscillator is showing oversold condition but with fresh bear cross. Key resistance is set at the price of $49,500 The material has been provided by InstaForex Company - www.instaforex.com |
| Asian stock markets trade lower following central banks decisions Posted: 17 Dec 2021 05:10 AM PST
On Friday, Asian stock markets were mostly trading lower. Thus, the Chinese Shanghai Composite Index and Shenzhen Composite lost 0.9% and 1.13%, respectively, while the Hong Kong Hang Seng Index declined by 1.29%. South Korea stock indices were down by 0.2%, Japan's Nikkei 225 dropped by 1.7%, while Australia's indices were up by 0.16%. The main factor that forms the market sentiment is the meetings of major central banks, such as the Fed, the Bank of England, and the Bank of Japan, that took place this week. Thus, the US regulator decided to keep the interest rate at 0–0.25% and to cut the $30 billion asset purchase program. A rate hike is expected as early as next year. The UK central bank, on the other hand, decided to raise the interest rate from 0.1% to 0.25%, contrary to analysts' forecasts who assumed that the rate would remain unchanged. At the same time, the ECB left the interest rate unchanged. The Japanese central bank set the rate at -0.1%. The regulator also announced its plans to reduce the volume of asset purchases to 5 trillion yen (equal to $43.97 billion). In general, according to the bank's officials, the economic situation in Japan has improved. The central bank also announced the extension of the support program for small businesses launched during the spread of the new COVID-19 variant. Investors also keep an eye on escalating tensions between China and the United States. A recent incident related to the violation of human rights in one of China's provinces encouraged the US to impose sanctions on 34 Chinese entities and blacklist them. This situation has become an additional risk factor for the stock markets. On the Japanese stock exchange, shares of the following companies fell in price: Toyota Motor Corp. (by 1.3%), Asia Fast Retailing Co. (by 1.1%), SoftBank Group Corp. (by 2.1%), and Rakuten Group Inc. (by 1.9%). According to fresh data, China's GDP growth stood at 2.2% last year instead of the 2.3% announced earlier. Such sectors as the hotel business and real estate were revised downwards by 3.7 points and 1.6 points respectively. On the Hong Kong stock exchange, the following securities posted losses: JD.com Inc. (by 3.8%), Meituan (by 5.6%), Alibaba Group Holding Ltd. (by 4%), as well as BYD Co. Ltd. (by 3.9%). Samsung Electronics Co. fell by 0.5%, while LG Corp. increased by 1.1%. Securities of Kia Corp. lost 1%, while Hyundai Motor Co. Ltd. added 0.5%. Amid rising Australian indices, the value of securities of Fortescue Metal Group increased by 0.9%, BHP Group, Ltd. - by 0.3%, and Evolution Mining Ltd. - by 4.2%. The material has been provided by InstaForex Company - www.instaforex.com |
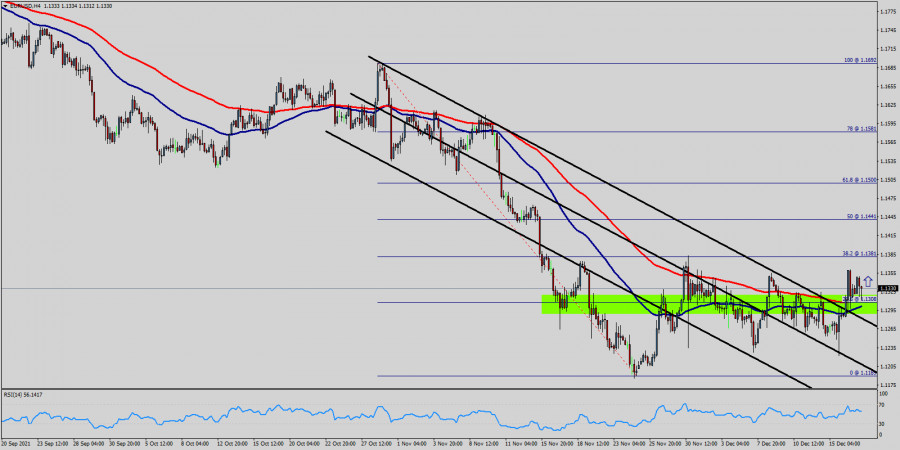
| Technical Analysis of EUR/USD for December 17, 2021 Posted: 17 Dec 2021 05:07 AM PST
Overview : The EUR/USD pair set above strong support at the level of 1.1308, which coincides with the 23.6% Fibonacci retracement level. This support has been rejected for four times confirming uptrend veracity. Hence, major support is seen at the level of 1.1308 because the trend is still showing strength above it. Accordingly, the pair is still in the uptrend from the area of 1.1308 and 1.1441. The EUR/USD pair is trading in a bullish trend from the last support line of 1.1308 towards the first resistance level at 1.1381 in order to test it. This is confirmed by the RSI indicator signaling that we are still in the bullish trending market. Now, the pair is likely to begin an ascending movement to the point of 1.1441 and further to the level of 1.1500. The level of 1.1500 will act as second resistance and the double top is already set at the point of 1.1581. At the same time, if a breakout happens at the support levels of 1.1245 and 1.1189, then this scenario may be invalidated. But in overall, we still prefer the bullish scenario. The material has been provided by InstaForex Company - www.instaforex.com |
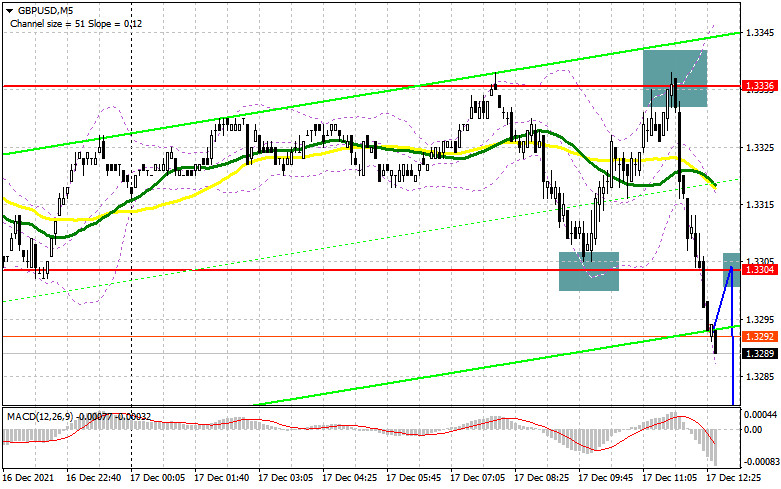
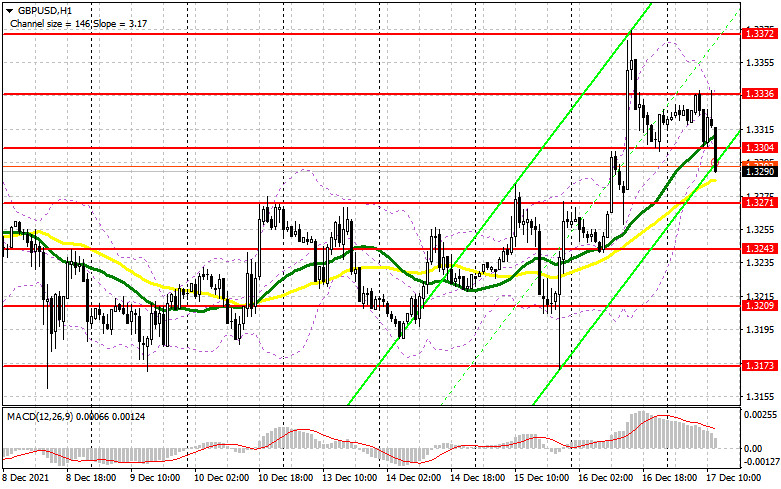
| Posted: 17 Dec 2021 03:19 AM PST To open long positions on GBP/USD, you need: In my morning forecast, I paid attention to the level of 1.3304 and 1.3336 and recommended them to make decisions on entering the market. Let's take a look at the 5-minute chart and figure out the entry point. The decline of the pound in the first half of the day and the formation of a false breakdown around 1.3304 led to a signal to open long positions in continuation of yesterday's bullish trend. It is worth noting that it did not reach the point test of 1.3304, however, given yesterday's momentum, it was safe to enter the market. Then there was an increase of 30 points, where the bulls rested at 1.3336 – and unfortunately, they could not cope with it. A detailed description of the points in the course in the material: The Bank of England raises interest rates. The results of the ECB meeting. The formation of a false breakdown at 1.3336 forced us to close long positions and turn over, as a sell signal for the pound was formed. At the time of writing, the bears have already dumped the pair below 1.3304, and we have passed almost 50 points from the entry point. An additional sell signal will now be formed only in the case of a reverse test of the 1.3304 level, but we will talk about this below. And what were the entry points for the euro this morning?
The release of important fundamental data is not scheduled for the American session, so it is possible that after the breakout of 1.3304, buyers of the pound may fall in. Only a return to this level with a reverse test from top to bottom forms the first entry point into long positions, counting on the repeated growth of the pound in the resistance area of 1.3336. A breakout and a test of 1.3336 will be an equally important task, as going beyond this range will allow the bulls to strengthen their positions to update weekly highs. The top-down test of 1.3336 will give an additional entry point for the purchase of GBP/USD with the prospect of strengthening to 1.3372. A breakdown of this range will also open up an opportunity to update the maximum of 1.3407, where I recommend fixing the profits. The resistance of 1.3446 remains a longer-range target. In the scenario of a further decline in the pound during the US session and an unsuccessful attempt to return to 1.3304, buyers will have problems. However, they should not be called very serious. It is best to focus on purchases when forming a false breakdown in the area of the next support of 1.3271. You can buy GBP/USD immediately for a rebound at the minimum of 1.3243, or even lower - from 1.3209, counting on a correction of 20-25 points within a day. To open short positions on GBP/USD, you need: The bears coped with their task perfectly and managed to defend the resistance of 1.3336, forming an excellent entry point there. Now their target is the 1.3304 level. Only a reverse test from the bottom up of this range will give a good entry point for the sale of the pound with a promising further correction of the pair to the area of 1.3271. The minimums will be a more distant target: 1.3243 and 1.3209, the update of which will put an end to yesterday's bull market after the Bank of England's decision to raise rates. If the pair grows during the American session of regaining control over 1.3304, it is best to postpone selling until the resistance is updated again at 1.3336. The formation of a false breakdown there, by analogy with the entry point that I discussed above, will lead to an excellent signal to open short positions. In the absence of bull activity there, I recommend postponing sales to a larger resistance of 1.3372. I also advise you to open short positions there only in case of a false breakdown. It is possible to sell GBP/USD immediately for a rebound only from the maximum of 1.3407, or even higher - around 1.3446, counting on the pair's rebound down by 20-25 points inside the day.
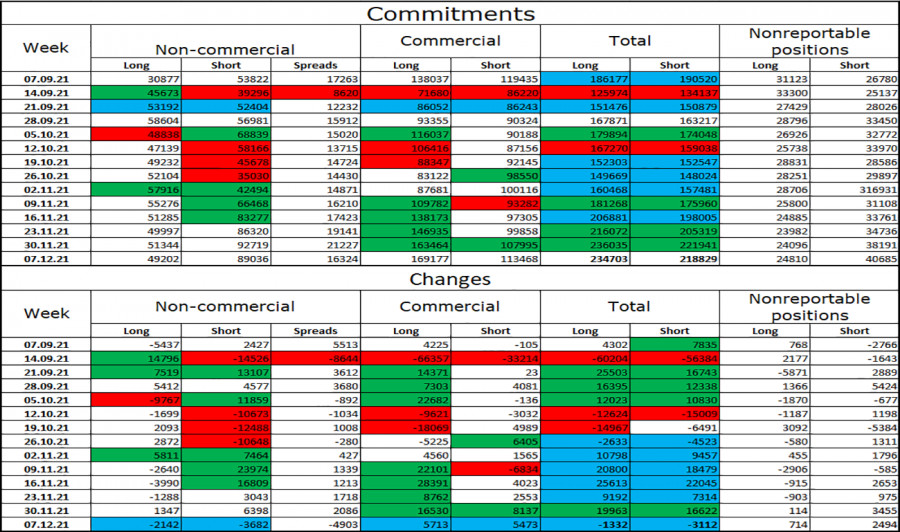
In the COT reports (Commitment of Traders) for December 7, a reduction in both short and long positions was recorded. Given the almost equal reduction of positions, this did not lead to serious changes in the negative delta. Poor data on the UK economy, which came out at the end of last week, clearly soured the mood of buyers of risky assets, counting on an upward correction of the pair before the meeting of the Bank of England. This week, the governor of the central bank, Andrew Bailey, will talk about his position on further monetary policy. If it continues to be dovish, most likely, the pressure on the pound will only grow, since representatives of the Federal Reserve System, on the contrary, are going to curtail stimulus measures, which should support the US dollar. High inflation remains the main reason why the Bank of England may change its mind about maintaining stimulus measures, but uncertainty will remain until the publication of the results of the meeting on December 16. An equally serious problem for the UK is a new strain of the omicron coronavirus, which can lead to another lockdown and the closure of the country for quarantine. So far, the authorities have to closely monitor the development of the situation with the new strain, which negatively affects the economy at the end of this year. The COT report for December 7 indicated that long non-commercial positions fell from the level of 52,099 to the level of 48,950, while short non-commercial positions fell from the level of 90,998 to the level of 87,227. This led to the preservation of the negative non-commercial net position almost unchanged: -38,277 versus -38,899 a week earlier. The weekly closing price sank slightly from 1.3314 to 1.3262. Signals of indicators: Moving averages Trading is conducted around 30 and 50 daily moving averages, which indicates an attempt by bears to return to the market. Note: The period and prices of moving averages are considered by the author on the hourly chart H1 and differ from the general definition of the classic daily moving averages on the daily chart D1. Bollinger Bands In the case of growth, the upper limit of the indicator around 1.3336 will act as resistance. Description of indicators
|
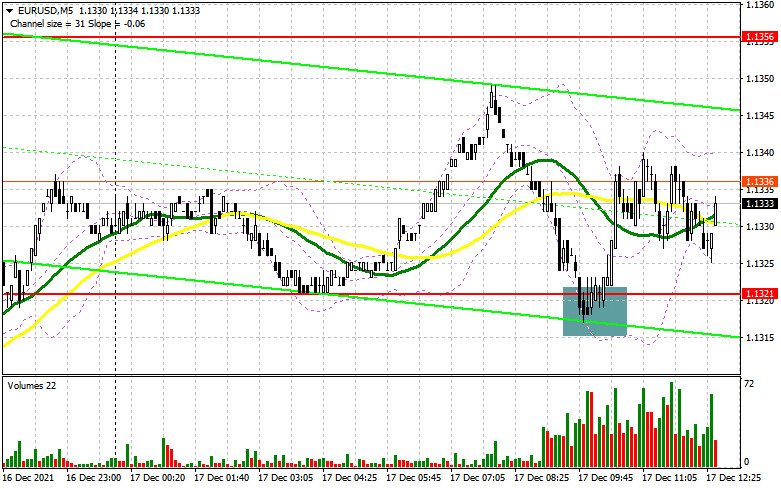
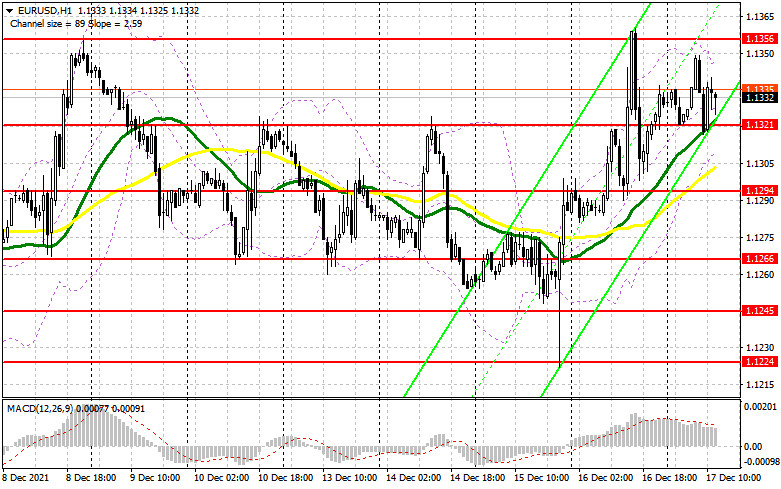
| Posted: 17 Dec 2021 03:19 AM PST To open long positions on EURUSD, you need: In my morning forecast, I paid attention to the level of 1.1321 and advised making decisions on entering the market. Let's look at the 5-minute chart and figure out what happened. The decline in the German IFO indices and the lack of inflation growth in the eurozone in November this year did not allow the European currency to continue its bullish momentum in the first half of the day, which was observed yesterday. However, with all this, the bulls managed to protect the support of 1.1321. The formation of a false breakdown there led to a good signal to open long positions. At the time of writing, the pair went up 20 points and that was the end of it. We need more activity. Until the time when trading will be conducted above 1.3121, we can count on the continuation of the euro growth. From a technical point of view, nothing has changed, as well as in the strategy itself for the second half of the day. And what were the entry points for the pound this morning?
The release of important fundamental data is not scheduled for the American session, so trading will remain within the morning side channel, but buyers need to be aggressive. The 1.1321 level will not survive another test, so the whole emphasis is on it. Only the formation of a false breakdown in the area of 1.1321, by analogy with the morning entry point, will lead to the formation of a new signal to buy the euro. An equally important task will be to return to the rather important resistance of 1.1356, which has not yet been managed to get beyond. The test of this level from top to bottom forms an additional entry point into euro purchases with the prospect of building a new upward trend and updating the upper boundary of the wider 1.1381 side-channel formed on November 30. Its breakdown can seriously affect the EUR/USD downward trend, so be very careful at this level. A breakout and a top-down test of 1.1381 will open up the possibility of a major increase in the area of the highs: 1.1415 and 1.1442. A more distant target will be the 1.1480 level. If the pair declines during the American session and there is no bull activity at 1.1321, and there are moving averages playing on their side, it is best to postpone purchases to larger support of 1.1294. I advise buying EUR/USD immediately for a rebound from the minimum of 1.1266, or even lower - around 1.1245 with the aim of an upward correction of 20-25 points within a day. To open short positions on EURUSD, you need: The main task of the bears for the second half of the day remains the protection of the 1.1356 level. Only the formation of a false breakdown there will lead to the first entry point into short positions against yesterday's bull market, counting on the return of pressure on the pair and a decline to the area of intermediate support 1.1321, which has already been tested today. A breakthrough of this level and moving averages that pass below, as well as a reverse test from the bottom up of 1.1321, will give a signal to open short positions with the prospect of a decline to the area of 1.1294. A more distant target will be the 1.1266 level, where I recommend fixing the profits. In the case of the growth of the euro and the absence of bear activity at 1.1356, it is best not to rush with sales. The optimal scenario will be short positions when forming a false breakout in the area of 1.1381 – the last hope of the bears to keep the trend under their control. It is possible to sell EUR/USD immediately on a rebound from the highs: 1.1415 and 1.1442 with the aim of a downward correction of 15-20 points.
The COT report (Commitment of Traders) for December 7 recorded a decrease in short positions and a slight increase in long ones, which led to a decrease in the negative value of the delta. Many traders were preparing for the meetings of central banks that will be held this week. Very serious changes are expected in the monetary policy of the Federal Reserve System, as well as the European Central Bank. The inflation data force the management to act more aggressively, but which way it will choose is a rather difficult question. Last week there were several speeches by the Chairman of the Federal Reserve System Jerome Powell, who in his comments spoke enough about the expected changes in monetary policy towards its tightening. The omicron coronavirus strain also prevents Europeans and Americans from sleeping peacefully, which constrains demand for risky assets in the face of uncertainty about the future policy of the European Central Bank. The latest November COT report indicated that long non-profit positions rose from the level of 191,048 to the level of 194,869, while short non-profit positions fell from the level of 214,288 to the level of 203,168. This suggests that traders preferred to fix part of the profit before important events in the conditions of the formed side channel. At the end of the week, the total non-commercial net position decreased its negative value from -23,240 to -8,299. The weekly closing price, on the contrary, did not change due to the side channel - 1.1283 against 1.1292. Signals of indicators: Moving averages Trading is conducted above 30 and 50 daily moving averages, which indicates the preservation of bullish sentiment. Note: The period and prices of moving averages are considered by the author on the hourly chart H1 and differ from the general definition of the classic daily moving averages on the daily chart D1. Bollinger Bands If the euro falls, the lower limit of the indicator around 1.1310 will provide support. A break of the upper limit in the 1.1340 area will lead to a new wave of growth of the pair. Description of indicators
|
| Forecast for GBP/USD on December 17 (COT report). The Bank of England discouraged traders Posted: 17 Dec 2021 03:19 AM PST GBP/USD – 1H.
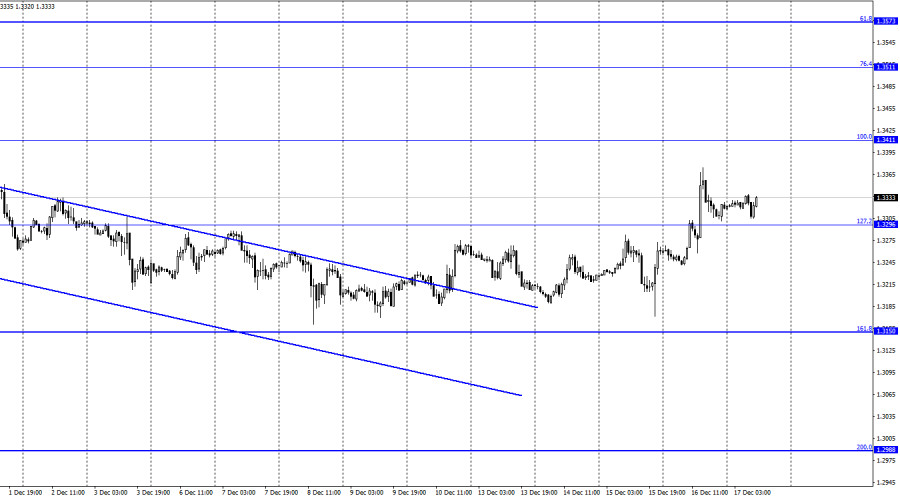
According to the hourly chart, the GBP/USD pair resumed the growth process on Thursday, secured above the corrective level of 127.2% (1.3296), and is currently trying to continue growing again in the direction of the Fibo level of 100.0% (1.3411). Fixing the pair's exchange rate below the level of 1.3296 will work in favor of the US currency and the beginning of a fall in the direction of the corrective level of 161.8% (1.3150). The background information of yesterday was extensive, but the main event was the meeting of the Bank of England and its results. Let me remind you that a month earlier, two members of the Bank of England voted for a rate hike, which came as a surprise to traders. Therefore, at the December meeting, it was possible to expect an increase in the number of functionaries who would vote for a rate increase. However, hardly anyone expected that the decision on the increase would be made almost unanimously, 8 against 1, and the rate would be raised in December! However, it happened, which provided significant support to bull traders. In the late afternoon, the quotes of the British rolled back slightly down, but at the moment the "bullish" mood remains, since the level of 1.3296 has been overcome, and the pair have left the downward trend corridor. Therefore, I believe that further growth of the British pound is quite possible, although, as in the case of the euro, the dollar should also have shown growth over the past two days. Today, a report on the change in retail trade volume in November was released in the UK, and it turned out to be much better than traders' expectations. The pound, thanks to this report, received a little more support. However, if a new trend begins at this time, then the Briton is only at the very beginning of its way up. Bull traders will need to prove next week that the pair's growth was not a coincidence. Otherwise, the dollar may "remember" that the Fed meeting was in its favor and resume growth, and the pair may fall. Let me remind you that the information background from the UK continues to be not the most cheerful and optimistic, and traders pay attention not only to the actions of the central bank once every six weeks. GBP/USD – 4H.
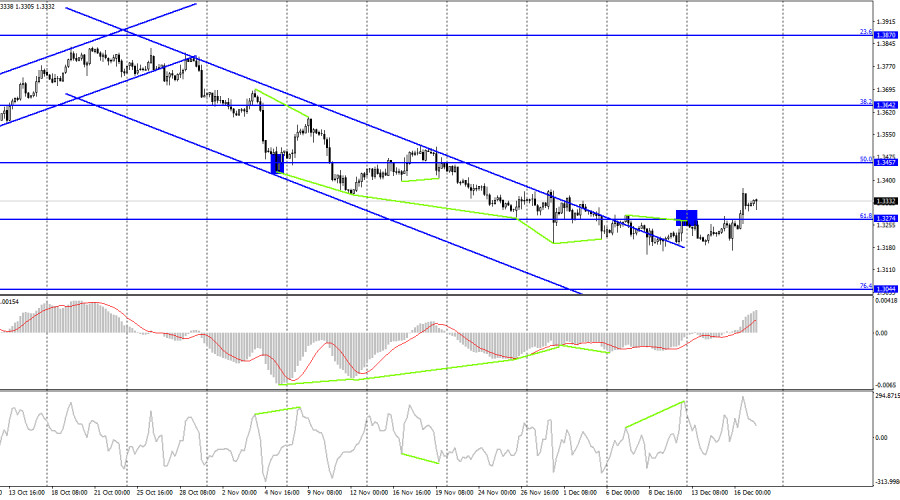
On the 4-hour chart, the pair has secured above the corrective level of 61.8% (1.3274). The growth process can be continued in the direction of the next corrective level of 50.0% (1.3457). Emerging divergences are not observed in any indicator today. Closing quotes below the level of 61.8% will work in favor of the US dollar and a new fall in the direction of the Fibo level of 76.4% (1.3044). News calendar for the USA and the UK: UK - change in retail trade volume with and without fuel costs (07:00 UTC). On Friday, all the planned reports were already released in the UK, and in the USA today the calendar of economic events is empty. Thus, during the rest of the day, the influence of the information background on the mood of traders will be absent. COT (Commitments of Traders) report:
The latest COT report from December 7 on the British showed that the mood of the major players has not changed much. The trend of strengthening the "bearish" mood has been observed for five weeks in a row and now it persists. In the reporting week, speculators closed 2,142 long contracts and 3,682 short contracts. However, the total number of short contracts in the "Non-commercial" category of traders is now almost twice as high as the number of long contracts. Thus, based on the results of the next week and the next COT report, I cannot conclude that the situation for the Briton has improved at least a little. It can continue the process of falling. GBP/USD forecast and recommendations to traders: I recommend buying the pound if the 4-hour chart closes above the level of 1.3274 with targets of 1.3296 and 1.3411. Now, these deals can be kept open. I do not recommend new sales of the pair yet. Terms: "Non-commercial" - major market players: banks, hedge funds, investment funds, private, large investors. "Commercial" - commercial enterprises, firms, banks, corporations, companies that buy foreign currency not to make speculative profits, but to ensure current activities or export-import operations. "Non-reportable positions" - small traders who do not have a significant impact on the price. The material has been provided by InstaForex Company - www.instaforex.com |
| You are subscribed to email updates from Forex analysis review. To stop receiving these emails, you may unsubscribe now. | Email delivery powered by Google |
| Google, 1600 Amphitheatre Parkway, Mountain View, CA 94043, United States | |





Comments