Forex analysis review
Forex analysis review |
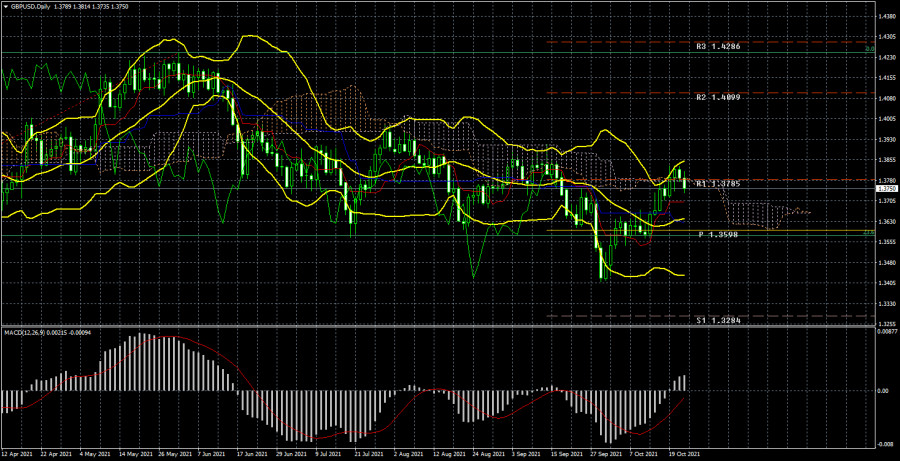
| Posted: 23 Oct 2021 02:30 AM PDT Analysis of GBP/USD 24-hour TF.
The GBP/USD currency pair continues to trade as confusing as possible. A vivid example of this was last week when the quotes reached the Senkou Span B line, from which they had previously bounced twice and overcame it. However, on Thursday and Friday, they fell back below it. As a result, it is completely unclear what it was. Either the price broke through this line and will now continue to move up after a slight pullback down, or it was a false breakdown, and now the pair will begin a new round of downward movement. We also draw the attention of traders to the overall technical picture. Although the downward trend seems to continue, corrections within its framework are quite deep and frequent. It cannot be concluded that there is now a classic downward trend. But over the past six months, the pound/dollar has managed with great difficulty to work out the 23.6% Fibonacci level, built along with the entire upward trend over the past year and a half. Recall that the euro has adjusted by almost 50% over the same time. And this is although the pound has much more reasons for falling than the euro. Everything is relatively calm in the European Union now. But in the UK, there are a lot of such topics that should put pressure on the pound. Even if fundamental global factors are in the first place now, such as the injection of huge sums into the economy by central banks, it is reasonable to assume that the euro and the pound would have to move about the same. But the pound has grown by 2,700 points over the past year and a half, and the euro by 1,800. The pound has adjusted by about 30% and the euro - by almost 50%. The pound is moving more or less actively, and the euro is at minimal volatility. Thus, now the movements of both pairs cannot be called clear and predictable. But this applies to the pound to a greater extent. Analysis of the COT report.
During the last reporting week (October 18-22), the mood of professional traders again became less "bearish." The situation with COT reports is even more ambiguous now than with the technical picture. And if we compare the COT reports on the euro and the pound, the situation becomes even more strange. Both indicators in the illustration above show no clear, accurate, and understandable mood among the major players right now. Therefore, it is simply not possible to make any forecasts based on COT reports now. In principle, the illustration above clearly shows the entire movement of the pair over the past year. It's quite difficult to call it a trend or even a trend. In the last couple of months, the mood of the major players has constantly been changing. The green and red lines of the first indicator (the net positions of the "Commercial" and "Non-commercial" groups of traders) constantly change the direction of movement. It means that the two largest groups of traders are constantly increasing and reducing net positions. During the reporting week, professional traders opened 2,000 buy contracts and closed 12.5 thousand sell contracts. Thus, their net position increased by 10.5 thousand contracts. It corresponds to what has been happening with the pound in recent weeks (it is growing). However, it is not possible to make a longer-term forecast since the net position may fall by the end of next week. We also pay attention to the fact that the green and red lines of the first indicator are not moving towards each other now and are not moving away from each other. Therefore, it is also impossible to talk about any trend now. Analysis of fundamental events. There were again quite a few important fundamental and macroeconomic events in the UK this week. In principle, we can single out a report on British inflation, which unexpectedly for many fell from 3.2% to 3.1% y/y. However, such a weak decline hardly indicates a general slowdown. In America, a decrease in inflation was recorded, after which it began to accelerate again. Also, the Chairman of the Bank of England, Andrew Bailey, did not give any new information to traders. In general, all the heads of central banks repeat the same theses from speech to speech. That's what Jerome Powell did on Friday. Therefore, there is no new information on monetary policy and quantitative stimulus programs at this time either. Consequently, the local fundamental background is now as neutral as possible. Business activity in the manufacturing and services sectors increased in October, but retail sales fell in September. It became known on Friday. Trading plan for the week of October 25 - 29: 1) The pound/dollar pair has returned to the Ichimoku cloud again. If it manages to gain a foothold above it again, then the trend may change to an upward one, and in this case, we advise buying the pair since the probability of forming a new upward trend will increase significantly. The first target will be the resistance level of 1.4099. So far, it cannot be said that the price has overcome the Ichimoku cloud. 2) Bears can still return to the market, as there was no clear overcoming of the Ichimoku cloud. However, the critical line has been overcome, so we do not recommend selling the pound at this time. If there is a rebound from the Senkou Span B line, and the price is fixed below the Kijun-sen line, we recommend selling the pair again with a target of 1.3400. Explanations to the illustrations: Price levels of support and resistance (resistance /support), Fibonacci levels - target levels when opening purchases or sales. Take Profit levels can be placed near them. Ichimoku indicators(standard settings), Bollinger Bands(standard settings), MACD(5, 34, 5). Indicator 1 on the COT charts - the net position size of each category of traders. Indicator 2 on the COT charts - the net position size for the "Non-commercial" group. The material has been provided by InstaForex Company - www.instaforex.com |
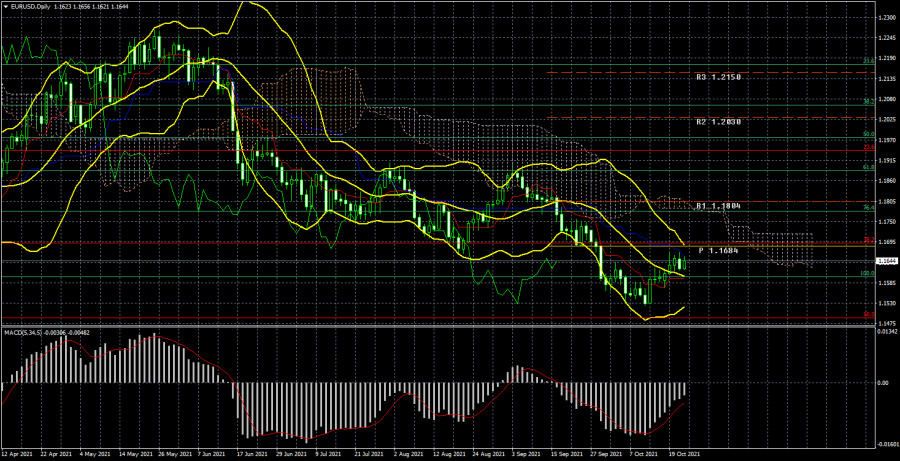
| Posted: 23 Oct 2021 02:30 AM PDT EUR/USD 24-hour TF analysis.
The EUR/USD currency pair continued to adjust against the short-term downward trend during the current week as a whole. However, we remind you that the movement seen in the illustration above is only a correction against a much more powerful upward trend that has been forming in the last year and a half. The illustration above also clearly shows that the quotes could not reach the Fibonacci level of 50.0% and slightly adjusted upwards, having worked out the critical line. Thus, at this time, the downward trend is completely preserved. We would also like to note that the downward movement may well continue. Recall that the exchange rate of any currency depends not on the "foundation," "macroeconomics," or "technology," but on the actions of market participants. Moreover, they also include central banks, which are the largest participants and can directly influence monetary policy and the volume of the money supply. And the volume of money supply cannot but be reflected in the exchange rate of a particular currency. Therefore, we still believe that the fall of the US currency would be more logical at this time. However, major market participants do not report on their actions and may have their strategy for operations in the foreign exchange market. For example, non-commercial. Therefore, at the moment, there are no signals to buy. Moreover, a rebound from the critical Kijun-sen line will already be a sell signal and a signal to continue moving south. Analysis of the COT report.
During the last reporting week (October 18-22), the mood of non-commercial traders changed in a bullish direction. During the reporting week, 8.5 thousand contracts for purchase and 16 thousand contracts for sale were closed. Thus, the net position of the Non-Profit Traders group, which is the most important group, increased by 7.5 thousand. And here it's time to talk about the "disease of the British pound." Recall that the net position of professional players in the pound has been jumping up and down in the last few months. And this suggests that there is no single mood and there is no clear trend. We are seeing the same thing now for the euro currency. It is eloquently signaled by the second indicator, which shows an increase in the net position, then its decrease. Consequently, at this time, the major players do not understand what they should do next with the euro. Also, the illustration above shows that the pair's rate has gone only 100 points below the previous local minimum. Therefore, at this time, the whole technical picture of the long-term plan still looks like a standard three-wave correction. Thus, from our point of view, the formation of a new upward trend in the near future is still very likely, given the attempts with which the European currency has been falling in the last 8-9 months. But at the same time, we remind you that while there are no buy signals, you should not rush into the market with purchases. Any fundamental hypothesis requires specific technical confirmations. If there are none, then you should not make appropriate trading decisions. Analysis of fundamental events. There were few macroeconomic and fundamental events this week. There were practically none at all. We can only highlight the report on industrial production in the United States, which unexpectedly for many declined by 1.3% in September, and the report on European inflation, which remained unchanged at 3.4% in September. Also, on Friday, business activity indices in the United States and the European Union were published. However, there were no major changes here either. Business activity in the manufacturing sector of the EU decreased slightly, in the service sector - decreased slightly. Business activity in the US manufacturing sector declined slightly, while for the services sector it increased slightly. It is not surprising, given that the "coronavirus" epidemic is not receding either in the European Union or in the States. Thus, there was no reaction to all of the above macroeconomic events. The pair continued to move with the low volatility in recent months and shows its complete disinterest in more active movements. Trading plan for the week of October 25 - 29: 1) On the 24-hour timeframe, the upward trend has not changed since bulls can still overcome the important lines of the Ichimoku indicator. The pair is being adjusted, and its further movement will depend on overcoming or overcoming the Kijun-sen line. Thus, new sales of the European currency will be possible if the price bounces off the critical line. The nearest target is a strong and important 50.0% Fibonacci level of 1.1490. 2) As for purchases of the euro/dollar pair, they should be considered no earlier than fixing the price above the critical line in the current conditions. And ideally, above the Ichimoku cloud, because the price has already overcome Kijun-sen several times, but then "stumbled" about Senkou Span B. There are few prerequisites for a new upward trend to begin in the near future, although the general fundamental background still indicates a very likely fall in the dollar. Explanations to the illustrations: Price levels of support and resistance (resistance /support), Fibonacci levels - target levels when opening purchases or sales. Take Profit levels can be placed near them. Ichimoku indicators(standard settings), Bollinger Bands(standard settings), MACD(5, 34, 5). Indicator 1 on the COT charts - the net position size of each category of traders. Indicator 2 on the COT charts - the net position size for the "Non-commercial" group. The material has been provided by InstaForex Company - www.instaforex.com |
| You are subscribed to email updates from Forex analysis review. To stop receiving these emails, you may unsubscribe now. | Email delivery powered by Google |
| Google, 1600 Amphitheatre Parkway, Mountain View, CA 94043, United States | |


Comments