Forex analysis review
Forex analysis review |
- Gold upside invalidated, door open for more declines
- USD/CAD down channel seen as reversal pattern
- GBP/USD dropped as expected
- Video market update for October 29,2021
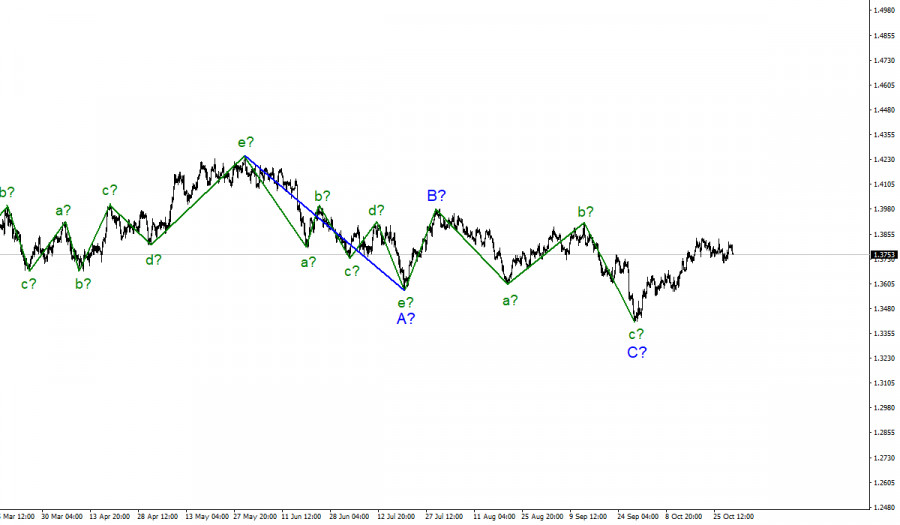
- Wave analysis of GBP/USD for October 29: Pound loses ground after temporary market optimism
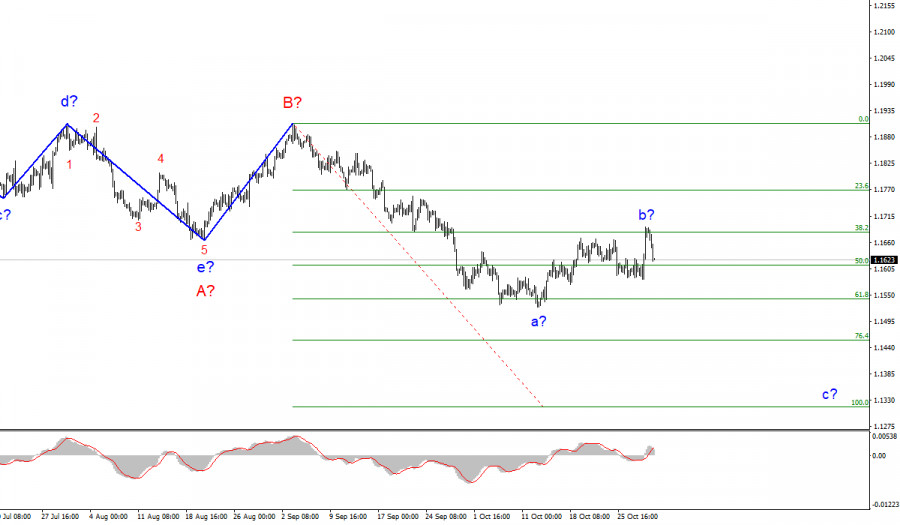
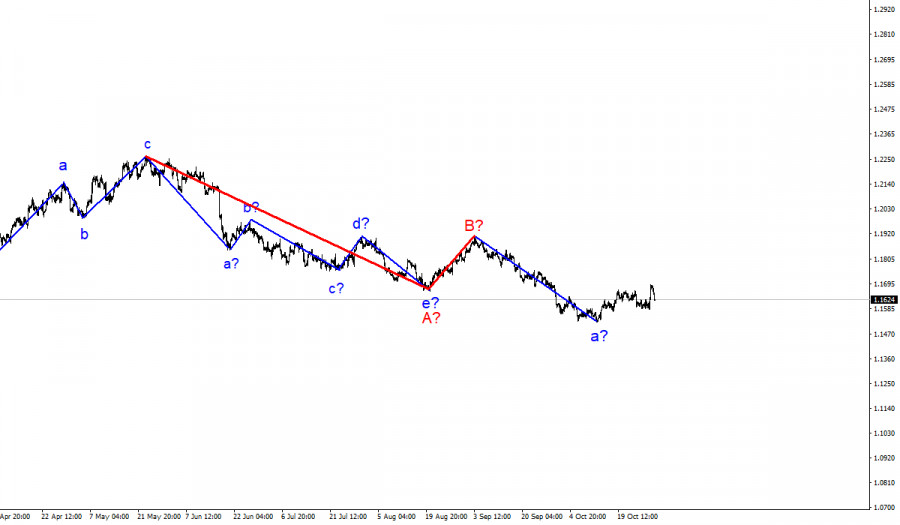
- Wave analysis of EUR/USD for October 29: Inflation continues to rise in the eurozone
- Key factors to help you succeed in your crypto market investment
- EUR/USD: The spinelessness of Euro, growing PCE and the "Taiwan question": dollar gets back on the horse
- EUR/USD: Dollar repelled euro's attack without any problems
- Bitcoin outflows from exchanges slowed down; Cryptocurrency appeal has fallen
- Ethereum sets new historic record; what do the ETH/USD technical indicators say about the future price movement?
- Bitcoin ready to jump higher
- Trading signal for BITCOIN on October 29 - November 01, 2021: sell below 60,500 (SMA 21)
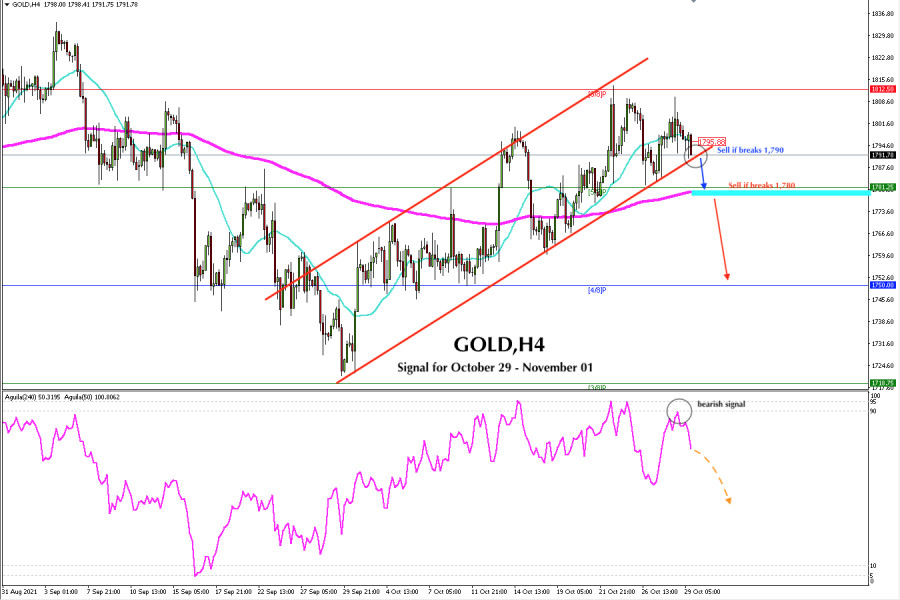
- Trading signal for GOLD (XAU/USD) on October 29 - November 01, 2021: sell if breaks $1,790 (uptrend channel)
- October 29, 2021 : EUR/USD daily technical review and trading opportunities.
- October 29, 2021 : EUR/USD Intraday technical analysis and trading plan.
- October 29, 2021 : GBP/USD Intraday technical analysis and significant key-levels.
- European indices decrease on Friday
- Trading signal for GBP/USD on October 29 - November 01, 2021: sell below 1,3793 (5/8)
- Oil closes week's trading at $83
- BTC analysis for October 29,.2021 - Symmetrical triangle in play, watch for the breakout
- EUR/USD analysis for October 29, 2021 - Buying climax in the background and potential drop towards 1.1625
- Analysis of Gold for October 29 - Potential for the drop towards $1.782
- GBP/USD: the plan for the American session on October 29 (analysis of morning deals). An excellent signal to buy the pound
- EUR/USD: the plan for the American session on October 29 (analysis of morning deals). There were no people willing to buy
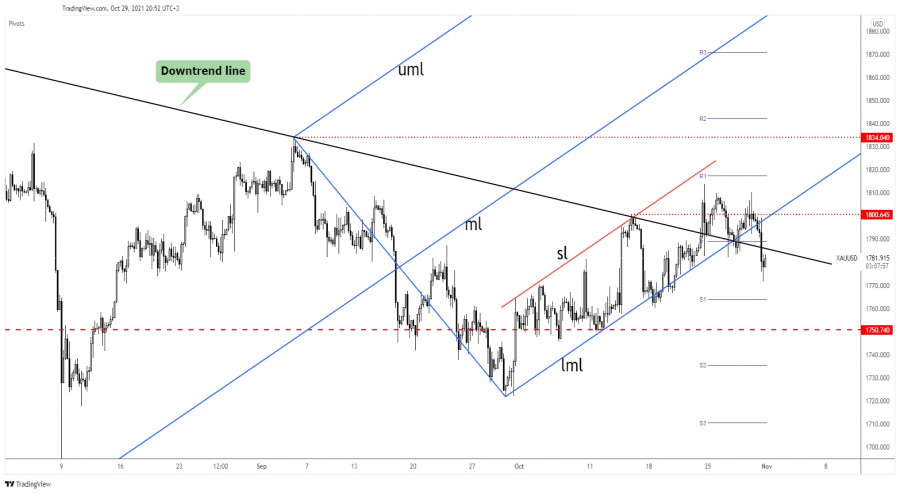
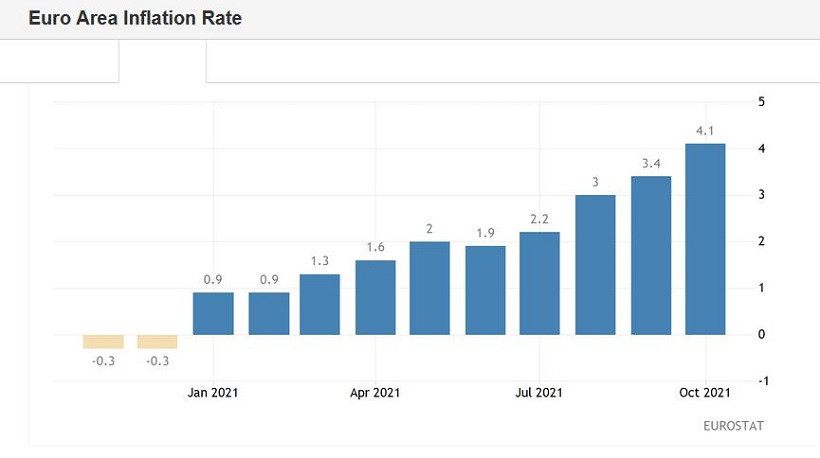
| Gold upside invalidated, door open for more declines Posted: 29 Oct 2021 12:35 PM PDT Gold was trading at 1,781.67 at the moment of writing after dropping to as low as 1,771.98. Unfortunately, the precious metal failed to stabilize above the downtrend line, so the bias is bearish at the moment as the Dollar Index has registered an amazing rally. Surprisingly or not, higher inflation reported by the eurozone failed to boost Gold. The CPI Flash Estimate reported a 4.1% growth versus 3.7% expected, while the Core CPI Flash Estimate increased by 2.1% compared to 1.9% estimates. This was bad for the euro so it has dropped versus its rivals. On the other hand, the Dollar Index rallied after the Eurozone data publication. DXY's rally pushed Gold down. GOLD turned to the downside
The price of Gold failed to stabilize above 1,800.64 static resistance and above 1,800 psychological level. Also, it has failed to approach and reach 1,813.84 former high signaling strong selling pressure. As you can see on the H4 chart, XAU/USD dropped far below the downtrend line and most important, far below the Ascending Pitchfork's lower median line (lml) which represented strong dynamic support. Gold predictionMaking a new lower low, its bearish closure below 1,782.88 signaled a potential deeper drop. Still, we cannot rule out a temporary rebound in the short term. XAU/USD could come back to test and retest the broken levels before dropping deeper. Staying below 1,782.88 and under the downtrend line could bring us new short opportunities. The material has been provided by InstaForex Company - www.instaforex.com |
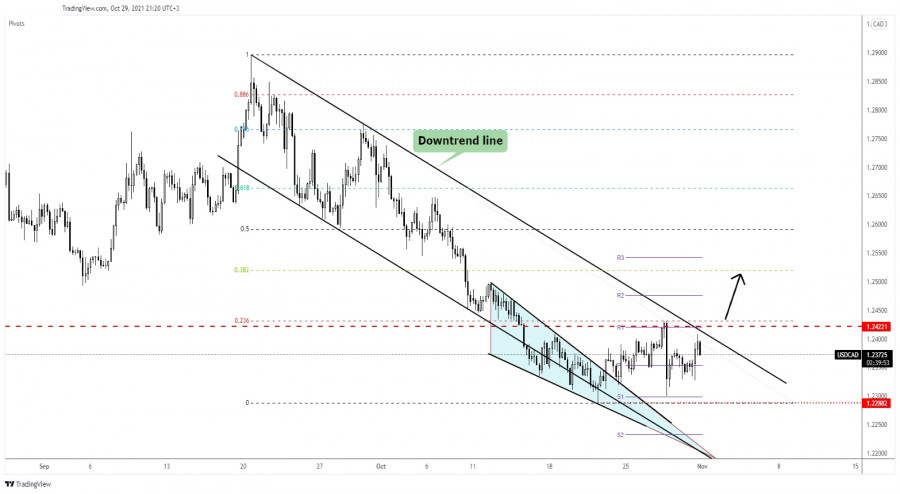
| USD/CAD down channel seen as reversal pattern Posted: 29 Oct 2021 12:34 PM PDT The USD/CAD pair moves somehow sideways in the short term and it continues to be undecided. The price has decreased a little in the short term only because the DXY has slipped lower from 94.30 today's high. Despite the current retreat, the upside pressure remains high after the Canadian GDP registered 0.4% growth versus a 0.7% increase expected. On the other hand, the US data have come in mixed. The greenback was supported by the Chicago PMI which was reported at 68.4 points above 63.6 points expected, the Revised UoM Consumer Sentiment inched up unexpectedly from 71.4 to 71.7 points, while the Employment Cost Index registered a 1.3% growth versus 1.9% expected. Furthermore, the Core PCE Price Index and the Personal Spending have come in line with expectations. USD/CAD range
USD/CAD failed once again to reach the downtrend line and now is traded at the 1.2374 level. It moves sideways between 1.2422 and 1.2288 levels. As you can see, the pair dropped within a down-channel pattern. In the short term, the price was somehow expected to grow after failing to stabilize under the channel's downside line and after escaping from the Falling Wedge pattern. On Wednesday, after the BOC, USD/CAD plunged from right above 1.2422 resistance. Now, it is back below the downtrend line. Its failure to reach this dynamic resistance signals some pressure. USD/CAD predictionUSD/CAD is somehow expected to reach the downtrend line. As long as it stays near the downtrend line, an upside breakout is imminent. Making a valid breakout above the downtrend line could announce a potential upside reversal. Actually, a new higher high, jumping and closing above the 23.6% retracement level could activate a strong leg higher and could bring us fresh long opportunities. The material has been provided by InstaForex Company - www.instaforex.com |
| Posted: 29 Oct 2021 12:33 PM PDT
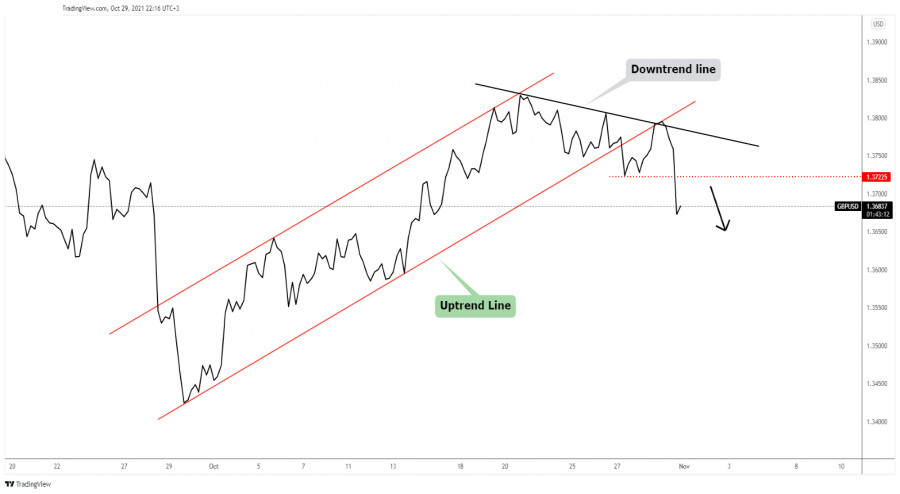
GBP/USD deeper drop in viewThe GBP/USD pair registered a strong drop after retesting the uptrend line and the downtrend line. In my previous analysis, I've told you that the pair could develop a larger drop if it declined below the 1.3722 level. Also, I've said that GBP/USD could come back to test and retest the uptrend line before dropping deeper. Failing to stabilize above the downtrend line signaled that it could still develop a larger downside movement. GBP/USD forecastIts aggressive drop below 1.3722 former low (downside obstacle) was seen as a selling opportunity. In the short term, the GBP/USD could try to increase a little after the current sell-off. A minor rebound towards 1.3722 could bring new selling opportunities. As long as it stays below 1.3722, GBP/USD could extend its drop towards the next major downside target represented by the 1.3600 psychological level. The material has been provided by InstaForex Company - www.instaforex.com |
| Video market update for October 29,2021 Posted: 29 Oct 2021 11:40 AM PDT Dollar strength expected... The material has been provided by InstaForex Company - www.instaforex.com |
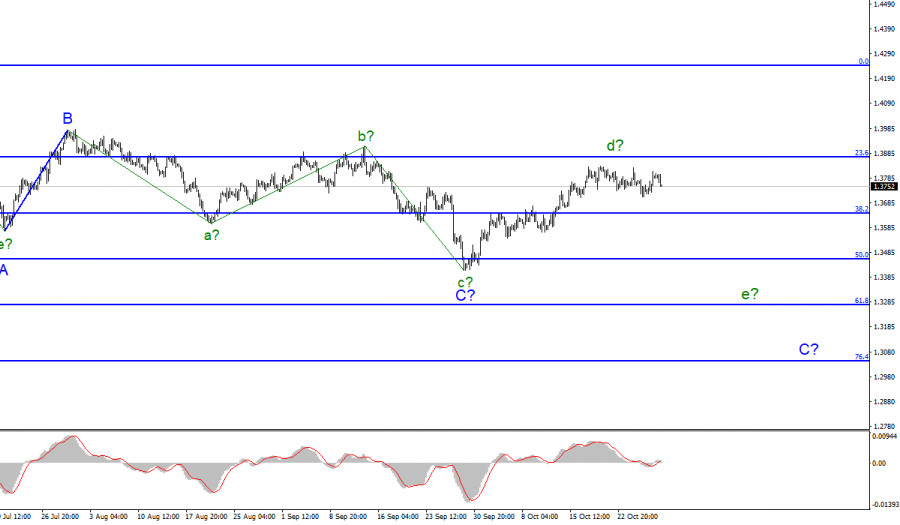
| Wave analysis of GBP/USD for October 29: Pound loses ground after temporary market optimism Posted: 29 Oct 2021 11:29 AM PDT |
| Wave analysis of EUR/USD for October 29: Inflation continues to rise in the eurozone Posted: 29 Oct 2021 11:16 AM PDT |
| Key factors to help you succeed in your crypto market investment Posted: 29 Oct 2021 10:53 AM PDT
As you might expect, many investors are looking for this very gold vein, which will bring them significant capital premiums in the long term. The cryptocurrency market is very unstable and volatile, it is very difficult to catch and find the very cryptocurrency that can shoot out after a certain period of time, based not on hype, but on fundamental data and demand for cryptocurrency. Now that we are in a bull market, many people reproach themselves for not buying this or that cryptocurrency earlier at lower prices. There are 5 key factors that you need to pay attention to so that in the future when buying a cryptocurrency, there are no difficult processes. You need to determine the ideal distribution of crypto assetsIn his book, The Psychology of Money, Morgan Housel has always emphasized the ultimate importance of the game or process you choose. Investors can buy certain crypto assets, but each of them has different investment goals. Some people want to multiply their capital, while others want to do day trading in order to get a quick profit, you need to know what you want to get from the investment. It will help you think more rationally. Decide which crypto assets you really needAfter defining your main goals, you need to understand how much money you can invest in a crypto asset. For example, older people are not willing to take risks, and they can benefit from high-interest rates for stablecoins and stakes in a transparent manner. Bitcoin is the main and most interesting asset for aspiring institutions. Ethereum, on the other hand, provides tremendous innovation opportunities and limitless growth potential. Various altcoins such as Paragon, Solana, Polkadot can offer great potential gains, but also huge associated risks. Find an opportunity for yourself to buy a small portion of the cryptocurrencyDo not chase after large volumes at once. First, you will need to buy a small amount of one or another cryptocurrency. So you will become more familiar with the fundamental basics of cryptocurrency, the ecosystem, its capitalization, daily turnover, and so on. You should spend the money that you are ready to lose for a long timeIf you want to invest without huge risks, you should use the average dollar value of the position, and instead of calculating the ups and downs of cryptocurrency and going all-in, you should allocate some of your income to cryptocurrency and buy with the money that you are ready to lose. If the cryptocurrency shoots, then you will receive dividends, but if it falls, then it will not be a big blow for you. Be ready for saleEvery big sell-off and liquidation of assets is followed by a bullish rally. This month is a good example of this. Bitcoin is up over $20,000 in a month. Many cryptocurrencies are subject to speculation and depend on many different factors, both on the crypto market and beyond. A verified cold mind and patience will always come in handy for any investor. Institutional investors can buy cryptocurrency with the money that they are willing to lose, as well as place a limit order on various exchanges so as not to lose a lot of money. The last year has really become a landmark for various altcoins. Many altcoins that are built on the Ethereum blockchain have huge growth potential. In decades from now, the cryptocurrency world may indeed change the lives of many ordinary citizens. The main mistakes of the crypto market are panic, as well as the short-term focus of investors, who, in any panic, begin to lose their composure and begin to massively sell off their assets. The material has been provided by InstaForex Company - www.instaforex.com |
| Posted: 29 Oct 2021 10:30 AM PDT The blitzkrieg of buyers of the EUR/USD pair failed. After the bulls failed to enter the area of the 17th figure (without even testing the 1.1700 mark), the bears seized the initiative and won back all the positions lost Thursday. The behavior of traders looks quite logical. The upside impulse began to fade immediately after crossing the resistance level of 1.1680 (the upper line of the Bollinger Bands indicator on D1), after which the "domino effect" worked. Market participants did not risk leaving longs ahead of the weekend, especially against the background of such unstable corrective growth. As a result, the pair turned 180 degrees and returned to the previous price range of 1.1580-1.1650.
The fact that the pair was declining on Friday against the background of a record increase in inflation in the eurozone looks very indicative. The published data turned out to be in the "green zone," reflecting the increasing price pressure. Thus, the overall consumer price index jumped to 4.1% in annual terms. This is the maximum value for the last 13 years. Prices for energy, services, food, alcohol, and tobacco rose the most. Among the reasons for such dynamics are the consequences of the energy crisis, increased tax burden, and supply disruptions, which only increase price pressure. The core index, excluding food and fuel prices, was also in the green zone, rising to 2.1% (experts expected to see this component at the level of September, that is, at around 1.9%). The European economy also pleased, which grew by 3.7% (YoY) in the second quarter. In general, Friday's data showed that the CPI at the moment is more than twice the target two percent indicator of the European Central Bank. And apparently, in the coming months, inflation will continue to grow. It would seem that this is a reinforced concrete reason for strengthening the euro. After all, inflation indicators continue to grow contrary to the opposite forecasts of ECB representatives, who at the beginning of the summer assured traders that the growth is temporary, and by the end of the year the CPI will bite its nose, turning downside. But no! The euro completely ignored Friday's data releases and dutifully followed the US currency, which is regaining its position throughout the market. This suggests that Christine Lagarde was able to reason with traders, convincing them that the European Central Bank prefers price stability rather than inflationary growth in the short term. She acknowledged that the period of high inflation in the eurozone will remain "longer than expected," but at the same time, the head of the ECB eloquently made it clear that the regulator will continue to hold the line by implementing an accommodative policy. Thus, she refuted rumors that the European Central Bank may raise the rate next year. That is why Europe's data on Friday has remained on the back of the attention of EUR/USD traders. Of course, if such a rate of inflation growth in the eurozone continues next year, it will be more and more difficult for the participants of the market to ignore this fact (in fact, as well as the European Central Bank). But the situation on Friday is different: after Thursday's "verbal pumping" by Lagarde, the euro turned out to be an outsider, and not only paired with the dollar (look at the dynamics of such crosses like EUR/GBP, EUR/CHF and even EUR/JPY).
But if the situation with the euro is more or less clear, then the current growth of the dollar (so rapid) looks quite surprising. All too quickly, traders brushed aside yesterday's release, which reflected the slowdown in the US economy in the third quarter. The 2% result was weaker than even the weak forecasts (2.6%). Why did the greenback come to his senses literally in a day, having regained lost positions in almost all pairs? In my opinion, there are several fundamental reasons. First, many experts, long before yesterday's release, predicted a temporary decline in the US economy in the third quarter, focusing on the word "temporary". In their opinion, in the fourth quarter of this year, as well as in the first two quarters of next year, the economic recovery should accelerate. Seems to be, But if the situation with the euro is more or less clear, then the current growth of the dollar (so rapid) looks quite surprising. Traders quickly shrugged off Thursday's data, which reflected a slowdown in the growth of the American economy in the third quarter. The two percent result was weaker than even weak forecasts (2.6%). Why did the greenback recover in just a day, regaining lost positions in almost all pairs? In my opinion, there are several fundamental reasons. Firstly, many experts predicted a temporary recession of the US economy in the 3rd quarter long before Thursday's release, while focusing on the word "temporary." In their opinion, the economic recovery should accelerate in the fourth quarter of this year, as well as in the first two quarters of next year. Apparently, traders for the most part also think that "the glass is half empty," and not vice versa. Secondly, the US published the index of personal consumption expenditures (PCE). It is believed that this indicator is monitored very carefully by members of the American regulator. The core PCE index, which does not take into account volatile food and energy prices, rose by 3.7% in September (in annual terms), remaining at the same level as it was released in August, July, and June. Experts predicted growth to 3.7%, but in this case, the "red zone" did not spoil the overall impression of the release. The growth of anti-risk sentiment in the market also contributed to the strengthening of the greenback. Note that exactly a week ago, US President Joe Biden unexpectedly announced that the United States would defend Taiwan in the event of an attack by China. This week, the key figures of the presidential administration did not develop the bellicose rhetoric of their "boss" - on the contrary, the tone of their statements was diplomatic. However, on Friday, the situation has escalated again: Taiwan President Tsai Ing-wen confirmed the presence of the US military on the island. It should be noted here that China considers Taiwan part of its territory, so such a statement may increase tensions between the United States and China. But, a little later, Taiwan's Defense minister clarified that Tsai Ing-wen did not mean the permanent basing of American forces on the island – allegedly it was about military instructors. But nevertheless, the "Taiwan issue" was again on the agenda, thereby increasing the interest of traders in the dollar as a protective asset.
|
| EUR/USD: Dollar repelled euro's attack without any problems Posted: 29 Oct 2021 08:56 AM PDT Markets did not believe Christine Lagarde that amid rising global risk appetite and falling energy prices, the EURUSD rally to its highest levels since late September. Nevertheless, the saturated and potentially "bullish" calendar for the US dollar in the first week of November cooled the ardor of buyers of the main currency pair. Obviously, the head of the ECB wanted to buy time, announcing that decisions on quantitative easing programs will be made in December, high inflation is temporary, albeit longer-lasting than previously thought, and markets are wrong about expectations of a rate hike by the central bank in 2022. All this did not make much of an impression on the investors, as Lagarde was already expected to have "dovish" rhetoric. As a result, the principle "sell the rumor, buy the fact" worked, thanks to which the pair jumped to the top of the 16th figure. It was supported by the next record highs of the S&P 500 and the fall in gas and coal prices. The energy crisis has put pressure on the eurozone economy, and the sooner it ends, the better the euro will feel. At the same time, Christine Lagarde's inability to rein in financial markets is clearly not enough for EURUSD to rise above the base of the 17th figure. The pair needs fresh drivers, and most of the trump cards are still in the hands of the "bears." In the week of November 5, the Fed and the US employment report for October can lend a helping hand to them. Currently, the Fed is expected to announce the end of its $120 billion quantitative easing program from December. The volume of purchases of treasury bonds will be reduced by $10 billion, mortgage - by $5 billion per month. A more aggressive shift is fraught with the strengthening of the US dollar. Why doesn't the Fed follow the path of the Bank of Canada and announce that it does not need QE in the face of a full economic recovery? All this is out of the realm of fantasy, but one should not rule out a more serious reduction in asset purchases than the markets expect. Dynamics of purchases of assets in the framework of the American QE
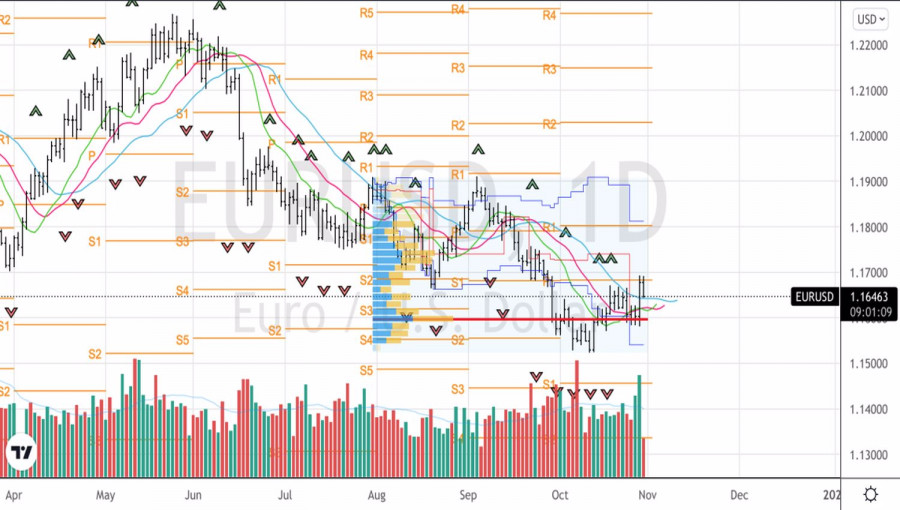
The data on the US labor market for October can provide no less support to the "bears" on EURUSD. Bloomberg experts predict an acceleration in employment growth from 194,000 to 385,000, which will increase the chances of an earlier increase in the federal funds rate than is currently expected. CME derivatives signal the first act of monetary restriction by the Fed at the end of the second quarter, the second at the end of 2022. If these dates are shifted to an earlier period, the US dollar will only benefit from this. The potentially bearish calendar of the first week of November has already provided a shoulder to the EURUSD sellers. Their opponents failed to gain a foothold above the important level of 1.168, which is a sign of their weakness. Technically, a drop in quotes below the dynamic supports in the form of moving averages and fair value at 1.1595 will create prerequisites for the retracement of the downward trend for EURUSD, in the direction of at least 1.145. The recommendation is to sell. EURUSD, Daily chart
|
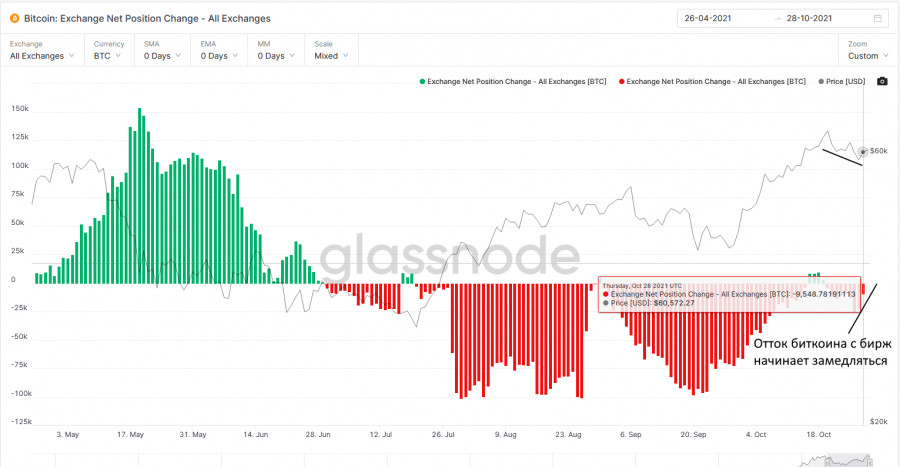
| Bitcoin outflows from exchanges slowed down; Cryptocurrency appeal has fallen Posted: 29 Oct 2021 08:56 AM PDT The fact that Bitcoin remains in a sideways channel makes it less attractive. This is evidenced by several indicators that are convenient to use in trading to determine the further direction of movement of the cryptocurrency. Throughout this week, we observed a gradual outflow of bitcoin from key trading floors, which indicated that bullish sentiment remained after a slight correction of the world's first cryptocurrency from its historic highs. Exchange Net Position Change - All Exchanges chart
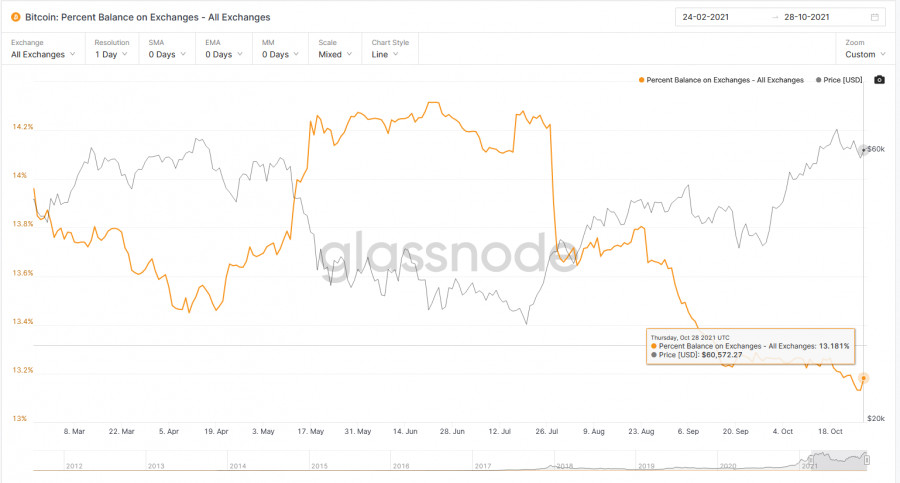
However, by the end of the week, after Bitcoin failed to continue its growth, the outflow of funds slowed down. Of course, this does not yet testify in favor of a market reversal and the formation of a bearish trend, however, it clearly indicates a slight increase in unrest among traders. Until this indicator remains in the negative zone, there is no reason to panic, but do not be surprised if we see another major downward correction in BTC over the weekend. Another indication that the outflow of funds on global markets is ending is the data from Percent Balance on Exchanges. In the chart below, you can clearly see how a gradual reversal began after the decline to the 13.131% level, which so far indicates a slowdown in the outflow.
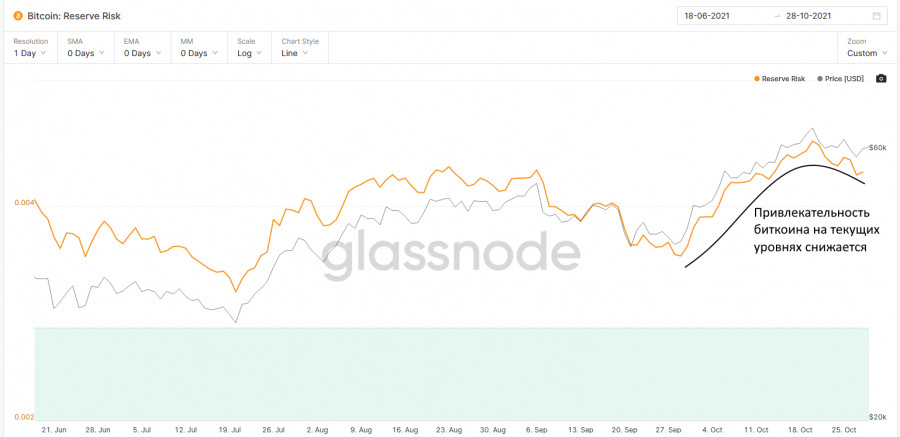
Well, the most interesting indicators are the Reserve Risk data: after the growth throughout the month, which testified to the attractiveness of bitcoin on the part of traders, a downward correction has been observed since October 20. The fact that Bitcoin does not react in any way indicates a rather delicate situation. Therefore, you can expect anything from this weekend. Speculators need to keep their fingers on the pulse.
As for the technical picture of Bitcoin The head-and-shoulders model survived and so far the lower limit of $59,400 has coped with the task. The nearest support level has now shifted to $58,200. Only a breakthrough of this area can lead to a larger downward correction of the trading instrument to the $54,444 area, and then to the $50,900 low, but even in this case, nothing bad will happen with the upward trend. At the moment, the 200-day moving average is in the 45,000 area. It is possible to talk about a return of interest in bitcoin after going beyond $62,400, which will open a direct road to the historical maximum of around $66,500.
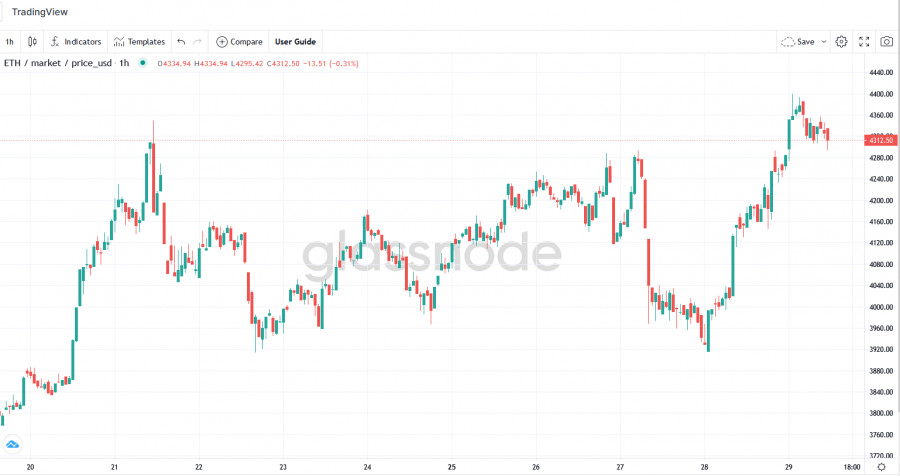
Australia prepares to launch Bitcoin ETF Finally, I would like to talk about what the Australian Securities and Investments Commission (ASIC) has determined: Bitcoin and Ether meet the criteria as the corresponding underlying assets traded on the exchange. The ASIC released a guide on Friday for those wishing to offer cryptocurrency derivatives. Such a request was sent back in June this year. The ASIC stated that a cryptocurrency can be a valid ETP asset only if five criteria are met: a high level of institutional support and recognition; reputable and experienced service providers to support products; mature spot market; regulated futures markets for derivatives trading and transparent pricing mechanisms. Based on this, Bitcoin and Ether "seem to satisfy all five factors to be called the underlying asset for ETP," the ASIC said. An ETF is expected to launch in Australia shortly, offering access to cryptocurrency products. The trailblazer will be ETF BetaShares, which plans to start trading in Australia in the near future. Ether Ether continues to grow and now traders are aiming at breaking through the next historic highs. The created supply shortage is pushing prices higher. ETH has hit a new all-time high on Friday as more Ethereum tokens have been burned than have been issued in the past 24 hours. Looking at the numbers since the beginning of this month, Ether is up 45% compared to Bitcoin's 40% gain.
As for the technical picture of the Ether A downward movement from historical highs and then an instant return to them indicates a high demand from players. A return to $4,367 will most likely take place with a breakdown and an exit to new all-time highs around $4,420 and $4,485. In the case of a downward correction, you can count on support in the area of $4,114, or even lower – in the area of $3,885, where major players have actively shown themselves this week. The material has been provided by InstaForex Company - www.instaforex.com |
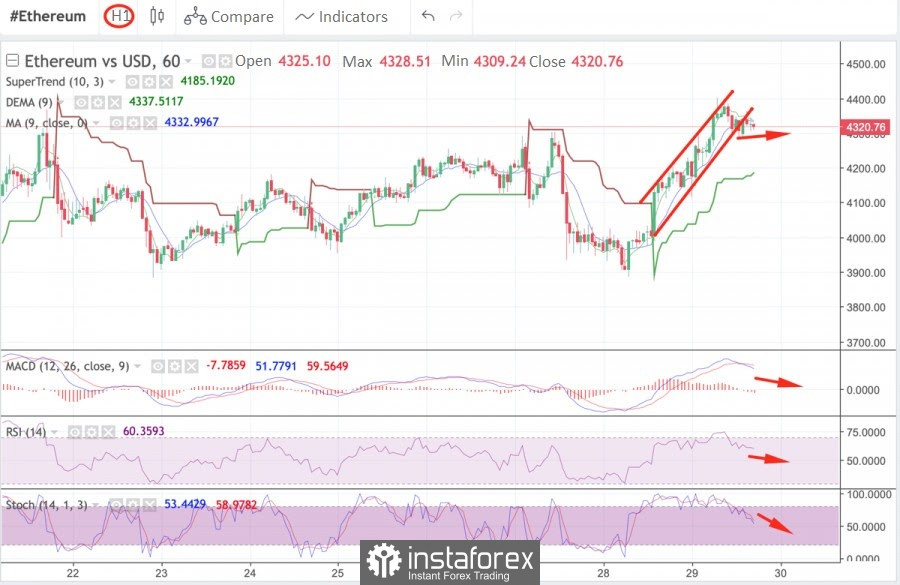
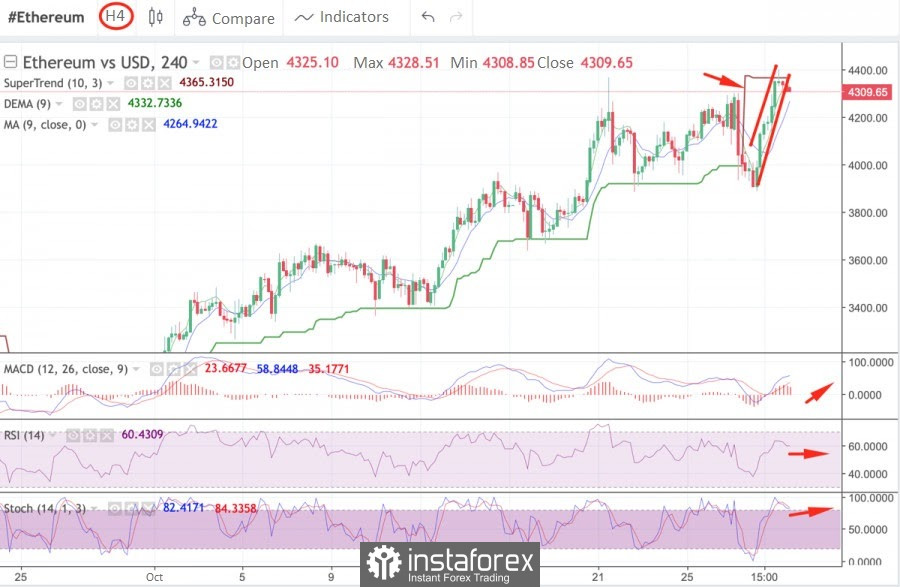
| Posted: 29 Oct 2021 08:55 AM PDT While Bitcoin is stabilizing near the growth zone, the second leader of the cryptocurrency market updated the historical maximum early on October 29, reaching $4.4k. The absolute record of altcoin was achieved against the background of a successful update that launched the phase of merging versions 1.0 and 2.0., as well as a sharp increase in on-chain activity. The combination of these factors allowed Ethereum to reach $4.4k at the moment, after which the price decreased slightly, and as of 11:30 UTC, the asset is trading around $4.3k. The coin retains positions favorable for growth, and therefore it is necessary to conduct a technical analysis of ETH/USD to determine whether the coin is able to continue the upward movement and rewrite the historical record again. Over the past day, altcoin has risen in price by 4% with daily trading volumes in the region of $30 billion, which is an average indicator and indicates a temporary decline in activity in the asset network. At the same time, the ether retains the positive dynamics of price movement and in a two-hour section, quotes increased by 1%. This indirectly confirms the desire of investors to continue the bullish rally. However, the technical indicators on the hourly chart are beginning to decline, and there are prerequisites for the price to test the strength of the support zone at $4.2k. This is evidenced by the bearish breakdown of the "bullish flag" technical analysis figure after setting a new record, which is a sign of a local decline and weakening of the short-term upward trend. The main indicators also began to signal a decline, although it is worth noting that the starting point was the overbought zone, and therefore this process should be considered as stabilization. The MACD has formed a bearish intersection and is starting to decline beyond the zero mark, and the stochastic is falling beyond the 40 mark, which indicates an increase in pressure on the price. The relative strength index is also acquiring a downward trajectory, but it is still holding above 50.
*Learn and analyze On-chain activity is the actions of cryptocurrency market players who independently manage their crypto assets, which is why the recording goes directly to the main blockchain. These statistics include both private investors and large companies. Price consolidation is the period when a certain cryptocurrency is within a narrow horizontal price channel. Usually, this process indicates price stabilization or weakness of market participants (buyers and sellers). Relative Strength Index (RSI) is a technical indicator that allows you to determine the strength of a trend (downward or upward), warns of possible changes in the direction of price movement. Thanks to this metric, it is possible to determine in what stage the asset is - overbought or underbought. The optimal mark for this chart is 60 for a bullish trend. It indicates strong demand for the coin and the strength of the current upward momentum. Upon crossing this mark, the coin begins to move towards overbought. MACD (Moving Average Convergence / Divergence Index) is an indicator that allows you to draw certain conclusions about the trend based on the movement of moving averages and finding the metric values between them. A common bullish signal is the intersection of the white line below the red and bearish, on the contrary, when the white line crosses the red from above, which indicates a downward movement. Stochastic (Stochastic Oscillator) indicates the strength of the momentum of the current prevailing trend. If the indicator is above 80, then the asset can be considered overbought, but if the stochastic is below 20, then this is a signal that the asset is oversold. Supertrend line is a technical indicator that reflects a bullish (green - a buy signal) and bearish (red - a sell signal) trend on the horizontal charts of a cryptocurrency. On the four-hour chart, the price is still holding below the supertrend line, despite breaking the historical record. At the same time, the situation begins to stabilize and major indicators move sideways or signal an attempt to realize a bullish impulse. For example, the MACD has passed the red zone and started to grow, and the stochastic oscillator is close to forming a bullish intersection, which indicates a local upward momentum. However, the relative strength index continues to fall and will soon break through the 50 mark, which indicates that there is no opportunity to develop an upward movement in the medium term due to the lack of growth in buyer activity. Summing up the results of the interim analysis of narrow timeframes, the bullish strength of the short-term upward trend has almost dried up.
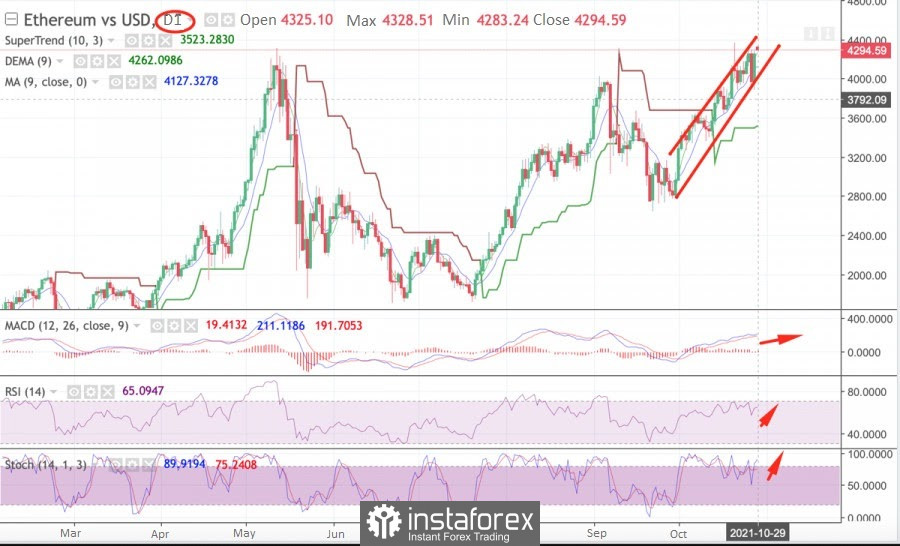
On the daily chart, the situation acquires a clear bullish color: according to the results of the previous trading day, the coin formed a bullish engulfing candle, and the price is confidently holding above the supertrend line, which indicates a positive market mood. At the same time, technical indicators continue to indicate a further increase in quotes, which is why a divergence is formed between the market price and technical indicators. At the moment, Ether sank to $4.3k, while the MACD continues its upward movement, indicating the strength of the medium-term momentum. The stochastic oscillator has crossed the safe zone and is approaching the 80 mark, which indicates that the asset is overbought in the daily range. The relative strength index remains within the safe zone, but will also enter the overbought corridor soon. With all this in mind, the probability of a local correction and a test of the strength of support zones in the region of $4.2k, $4k, and $3.8k is growing. These are the most likely points of rebound to the growth range followed by a period of stabilization and recovery. Therefore, betting on longs and setting a new historical record in the next day or two is risky.
|
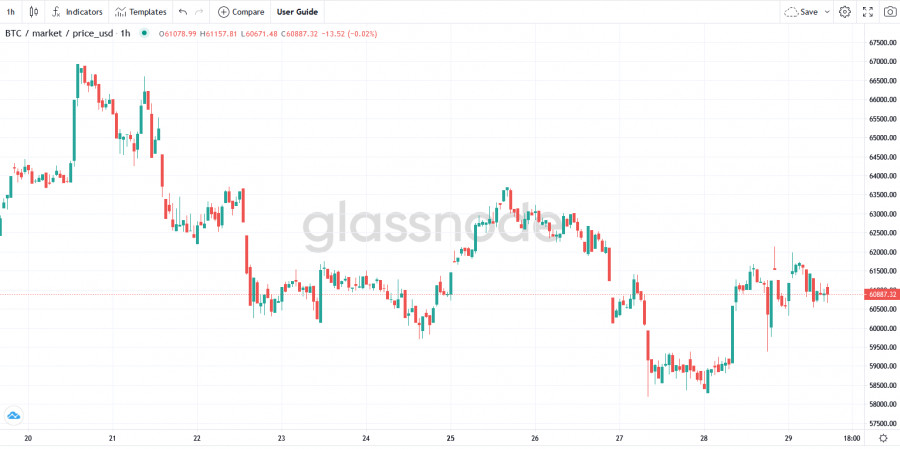
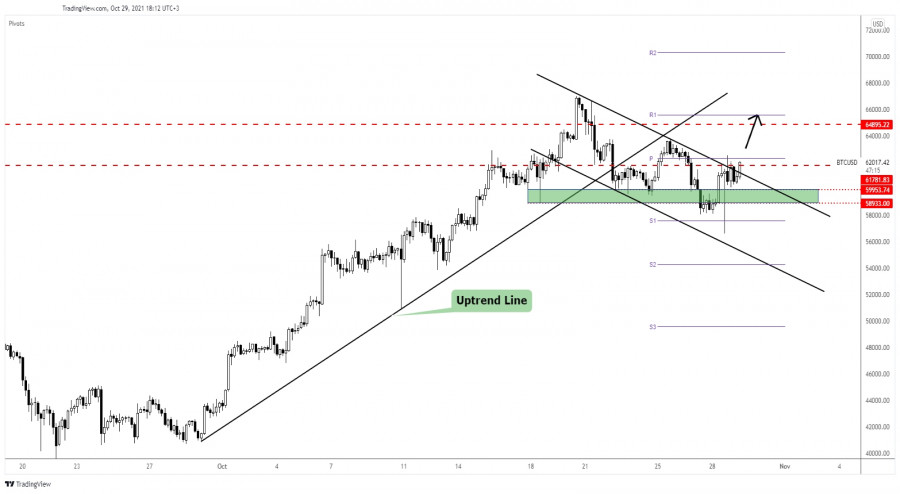
| Posted: 29 Oct 2021 08:47 AM PDT Bitcoin is trading at 61,830.73 level at the time of writing, far above 56,677 yesterday's low. The bias is bullish, so BTC/USD could approach and reach new highs soon. Technically, the crypto is located at near-term resistance, a valid breakout through the immediate obstacles could announce further growth. Bitcoin is up by 0.83% in the last 7 days and by 0.64% in the last 24 hours. After yesterday's huge spike down, BTC/USD could resume its upside journey anytime. Technically, the price action signaled that the downside movement is over and that the price could turn to the upside. BTC/USD Down Channel Breakout!
BTC/USD is trading in the green and is almost to escape from the down channel pattern. As you can see, the crypto registered a false breakdown with great separation below 58,933 static support, 58,100 former low, and under the weekly S1 (57,607.27). The pin bar candle signaled that the downside is over and that the rate could start increasing again. Making a valid breakout through the downtrend line and above the weekly pivot point (62,328.90) could announce and activate further growth. Bitcoin Forecast!Escaping from the down channel and stabilizign above the 61,781.83 level and above 62,328.90 could announce further growth towards 64,895.22 and up to the 67,016.50 all-time high. The material has been provided by InstaForex Company - www.instaforex.com |
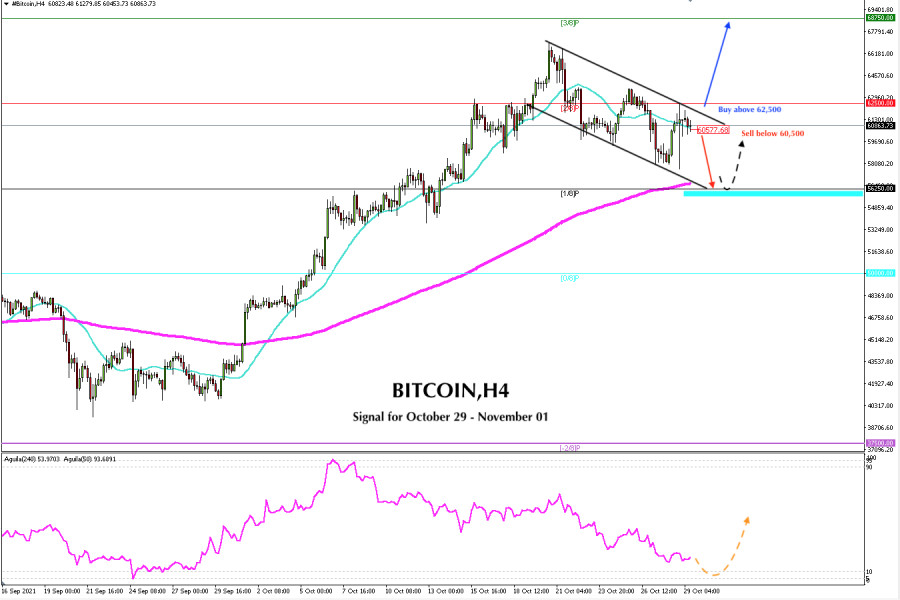
| Trading signal for BITCOIN on October 29 - November 01, 2021: sell below 60,500 (SMA 21) Posted: 29 Oct 2021 08:11 AM PDT
The overall trend of Bitcoin in daily charts is still bullish. However, since October 20 after reaching its historical maximum, a secondary downtrend channel has been formed. Since then, BTC is going through a downward correction. Now it is located below the 21 SMA and it is likely to continue oscillating within this bearish channel. BTC is also consolidating below 2/8 murray and this level is very strong resistance because on previous occasions it has prevented Bitcoin from a further rise. Given that it is now below this zone, we should expect it to continue to decline up to the 200 EMA around 56,250. The price of BTC should exceed the level of $ 62,550 where 2/8 of murray is located. BTC is expected to break the bearish channel. With a consolidation above this level, BTC could gain momentum again and the price could rise to 3/8 of murray around 68,750. While it is trading below this level, there is a probability that BTC will continue its fall to the key support of 56,250 (200 EMA). As long as Bitcoin remains above the 200 EMA in 4-hour charts and 56,250 (1/8 of a murray), any bounce towards this level will be a good opportunity to continue buying with the nearest targets at 62,500 and up at 68,750. On the contrary, a breakout and daily close below the 200 EMA and below 1/8 of a murray could be the start of a bearish scenario and we could expect a drop to the psychological level of 50,000 (0/8). The eagle indicator is approaching an oversold level. It is likely that in the next few days it will touch the level of 10 or 5 points. Then it could be a signal to buy Bitcoin again, our forecast is to wait for the level of 56,250. This would be a good point to buy cheaply. Support and Resistance Levels for October 29 - November 01, 2021 Resistance (3) 35,235 Resistance (2) 63,270 Resistance (1) 62,500 ---------------------------- Support (1) 58,516 Support (2) 57,851 Support (3) 56,250 *********************************************************** A trading tip for BITCOIN for October 29 - November 01, 2021 Sell below 60,500 (SMA 21) with take profit at 56,250 (EMA 200), stop loss above 62,500. The material has been provided by InstaForex Company - www.instaforex.com |
| Posted: 29 Oct 2021 07:30 AM PDT
At the beginning of the American session, gold (XAU / USD) is trading below the 21-moving average, located at 1,795. The metal is approaching the bottom of the uptrend channel that has been formed since September 27. It has remained intact during a period of more than a month. Each time, gold hits support and rebounds, it is likely to move in the same manner again. Gold is expected to make a good bounce above the uptrend channel support. On the contrary, if it breaks this channel and consolidates below 1,790, it will be a negative sign of weakness and gold is likely to make a rapid decline to the EMA of 200. 5/8 of murray converges at the same level around 1,781. The key level is located at 1,781-1,779 since there is the 200-day moving average. As long as the price remains above this level, the outlook for the precious metal remains bullish. A daily close and a consolidation below 1,780 could be the start of a bearish scenario. It is likely that next week we could see a drop of the gold price to the level of 1,750 around 4/8 of a murray. The US dollar is putting pressure on gold as it has managed to bounce above 3/8 murray and now sits above the 200 EMA. USDX is likely to keep pushing gold down. Another factor may be that investors are taking refuge in the dollar in light of the uncertainty of the Fed's monetary policy forecast for November. So, gold is likely to fall to the 1,750 level in the coming days. If gold manages to stay above 1,780 and above the dynamic support of the 200 EMA, there is still the possibility that it will continue to rise and move within an uptrend. If this happens, the gold price could rise to the 1,812 level and up to the 1,843 level where there is strong resistance of 7/8 of the murray that represents a reversal zone. Market sentiment report on gold shows that there are 77.72% of traders who are selling gold. This is a positive sign. Gold is likely to find support around 1,780-1,770 and could give it a further upward momentum and could again rebound to the level of 1,812 and even higher to 1,840. The eagle indicator reached the level of 90 points yesterday. This means that the market is overbought. So, an imminent correction is likely to happen in the next few hours. This could also favor our selling strategy if gold stays below 1,790 as long as the uptrend channel is broken. The trading plan for the next few hours is to sell below the 21 SMA located at 1,795. If the uptrend channel is broken, we could continue selling below 1,790 with targets at 1,780. If this level is broken, we could carry on selling until 1,750 in the short term. Support and Resistance Levels for October 29 - November 01, 2021 Resistance (3) 1,812 Resistance (2) 1,808 Resistance (1) 1,800 ---------------------------- Support (1) 1,788 Support (2) 1,781 Support (3) 1,772 *********************************************************** A trading tip for GOLD for October 29 - November 01, 2021 Sell below 1,795 (SMA 21) or if breaks 1,790, with take profit at 1,781 (5/8) and 1,750 (4/8), stop loss above 1,800-1,796. The material has been provided by InstaForex Company - www.instaforex.com |
| October 29, 2021 : EUR/USD daily technical review and trading opportunities. Posted: 29 Oct 2021 07:07 AM PDT
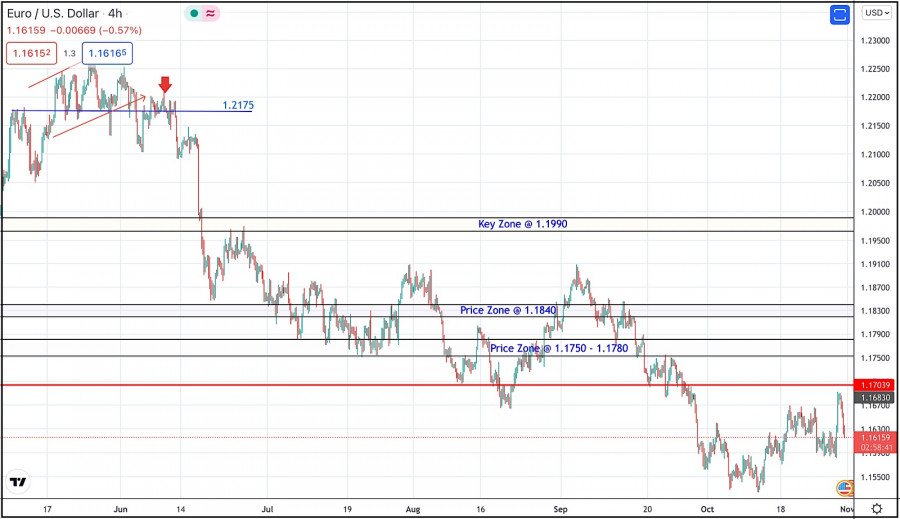
Recently, Persistence below the depicted price zone of 1.1990 indicated further downside movement towards 1.1840 and 1.1780 where a sideway consolidation range was established. During last week, the EURUSD pair has been trapped within a narrow consolidation range between the price levels of 1.1780 and 1.1840. A bullish breakout was executed above 1.1840 shortly after. Temporary Upside pullback was expected towards 1.1990. However, re-closure below the price level of 1.1840 has initiated another downside movement towards 1.1780 which failed to hold prices for a short period of time before significant upside movement was presented into market. Intraday traders were advised to wait for candlestick closure above 1.1780 - 1.1840 for another ascending swing to be initiated. However, immediate downside selling pressure brought the pair down below 1.1700. More downside movement took place towards the price level of 1.1600 where significant buying pressure existed. Bearish persistence below 1.1700 and 1.1600 has enhanced further decline towards 1.1500. Currently, the price zone around 1.1700 stands as a prominent supply-zone to be watched for SELLING pressure and a possible SELL Entry upon any upcoming ascending movement. The material has been provided by InstaForex Company - www.instaforex.com |
| October 29, 2021 : EUR/USD Intraday technical analysis and trading plan. Posted: 29 Oct 2021 07:06 AM PDT
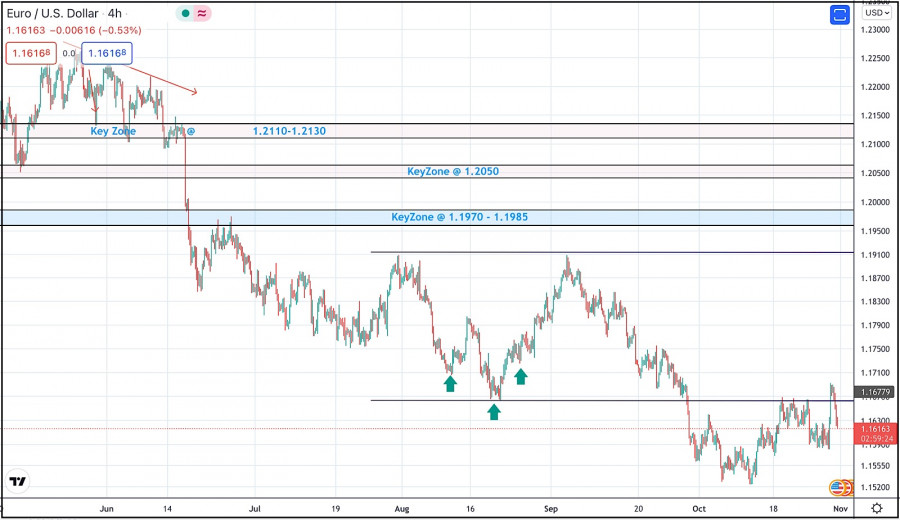
Bearish persistence below the price zone of 1.2050-1.2000 allowed the recent downtrend to be established. So, the EURUSD pair has expressed significant bearish decline while the price level of 1.1650 stood as a prominent demand level that prevented further bearish decline. The bullish pressure that originated around 1.1650 failed to push higher than the price level of 1.1900. That's why, another bearish pullback towards 1.1650 was executed. Bullish signs were expected around the price levels of 1.1650-1.1700 as it corresponded to a recent previous bottom. However, extensive bearish decline has pushed the EURUSD pair towards 1.1600 and lower levels was about to be reached if sufficient bearish momentum was maintained. Moreover, significant bullish recovery has originated recently upon testing the price level of 1.1570. The current bullish pullback towards 1.1650-1.1680 should be considered for bearish rejection and a valid SELL Entry. Initial T/P levels are located around 1.1570 and 1.1530. Bullish persistence above 1.1680 should be considered as an early Exit signal. The material has been provided by InstaForex Company - www.instaforex.com |
| October 29, 2021 : GBP/USD Intraday technical analysis and significant key-levels. Posted: 29 Oct 2021 07:05 AM PDT
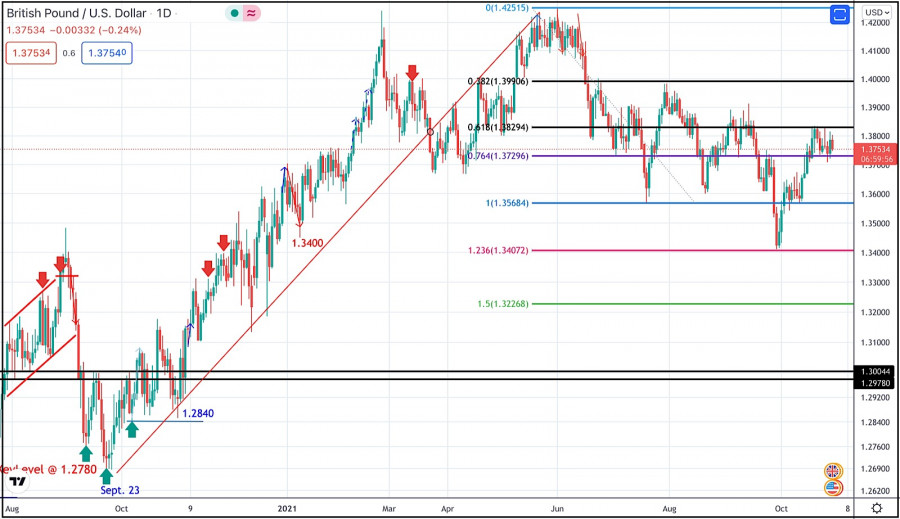
The GBPUSD pair has been moving sideways with some bearish tendency while bearish breakout below 1.3600 was needed to enhance further bearish decline. On the other hand, the nearest SUPPLY level was located around 1.4000 where bearish rejection and a valid SELL Entry was anticipated. The recent bullish rejection witnessed around 1.3600 as well as the temporary bullish breakout above 1.3880 indicated a high probability that this bullish movement may pursue towards 1.4025 then 1.4100. However, the pair remained trapped within a fixed price range until significant bearish momentum emerged into the market. Bearish breakout below 1.3720 enabled further bearish decline towards 1.3560 then 1.3400 which was expected to be reached. Recently, the GBPUSD pair was testing Demand-Zone located around 1.3400 which corresponded to 123% Fibonacci Level of the most recent bearish movement. This was a good entry level for a corrective bullish pullback towards 1.3650 and 1.3720 which was bypassed. Currently, the short-term outlook remains bullish as long as the pair maintains its movement above 1.3730. However, the pair was testing the resistance zone around 1.3830 where some bearish pressure originiated into the market. Bullish persistence above 1.3830 is needed to enable further bullish advancement towards the next Fibonacci Expansion level around 1.3990. On the other hand, another bearish decline below 1.3720 will probably be an indicator for more bearish movement towards 1.3570 as it corresponds to the next Fibonacci Expansion Level. The material has been provided by InstaForex Company - www.instaforex.com |
| European indices decrease on Friday Posted: 29 Oct 2021 07:04 AM PDT
European main indices are showing a decline in trading on Friday. Thus, the FTSE 100 index dropped by 0.27%, the DAX index fell by 0.86%, the CAC 40 index declined by 0.33%. The FTSE MIB index dropped by 0.3%. European main indices are showing a decline in trading on Friday. Thus, the FTSE 100 index dropped by 0.27%, the DAX index fell by 0.86%, the CAC 40 index declined by 0.33%. The FTSE MIB index dropped by 0.3%, and the IBEX 35 index fell by 0.1%. The STOXX Europe 600 index plummeted by 0.5%. The increase in European countries' inflation occurred this month triggered the fall in European indices. Inflation in annual terms rose to 4.1% annually from the previous month's level of 3.4%. At the same time, according to analysts' forecasts, the growth of inflation was expected to reach only 3.7%. Consumer prices rose to 4.1% this month. This is a record reading for the last 13 years (by comparison, last month it was 3.4%). At the same time, according to analysts' forecasts, the prices were expected to grow by 3.7%. According to the ECB report, the PEPP is scheduled to be tapered as early as March next year. Investors are assessing data on the GDP of European states. According to primary data, GDP growth in the previous quarter was 3.7% in annual terms and 2.2% in quarterly terms. At the same time, according to experts' forecasts, growth in annual and quarterly terms should have reached 3.5% and 2%, respectively. According to preliminary information, economic growth in France in the previous quarter was 3% compared to the second quarter, which exceeded the expectations of 2.1%. At the same time, consumer spending in September decreased by 0.2% compared to the August reading, Although, according to experts' forecasts, it should have grown by 0.3%. Inflation in the country rose to 3.2% from 2.7% in the previous month, which also did not match analysts' forecasts estimated at 3.1%. French bank BNP Paribas SA gained 0.6% thanks to a 32% rise in profits and a 5% rise in revenues, which outperformed analysts' expectations. Air France-KLM gained 5.7% on 81% revenue growth. In Germany, the economic growth in the third quarter was slightly lower than in France and amounted, according to preliminary information, to 1.8% - the level of the second quarter. Inflation rose by 2.5% annually. At the same time, according to analysts' expectations, the growth was 2.2% quarterly and 2.5% annually. The Signify N.V. stock fell by 5% due to a decline in profits of the company, associated with supply disruptions. At the same time, Daimler AG securities grew by 1.6% due to a 20.5% increase in profits. Italian Eni SpA's 83% increase in revenues boosted its stock price by 1%. Securities of the Swedish company Volvo Cars rose by 10%. Thanks to good reports, the value of the securities of Swiss Re AG also increased by 3%. The material has been provided by InstaForex Company - www.instaforex.com |
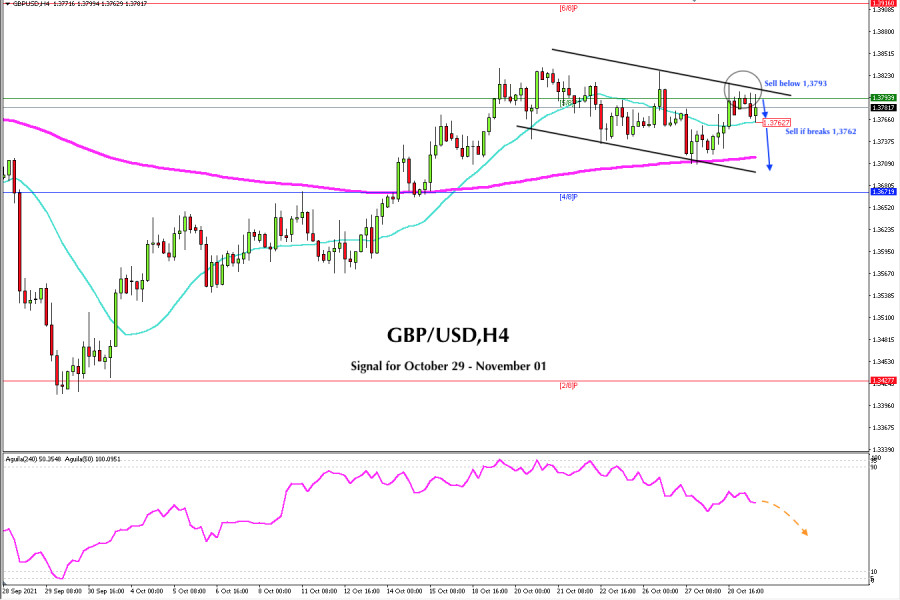
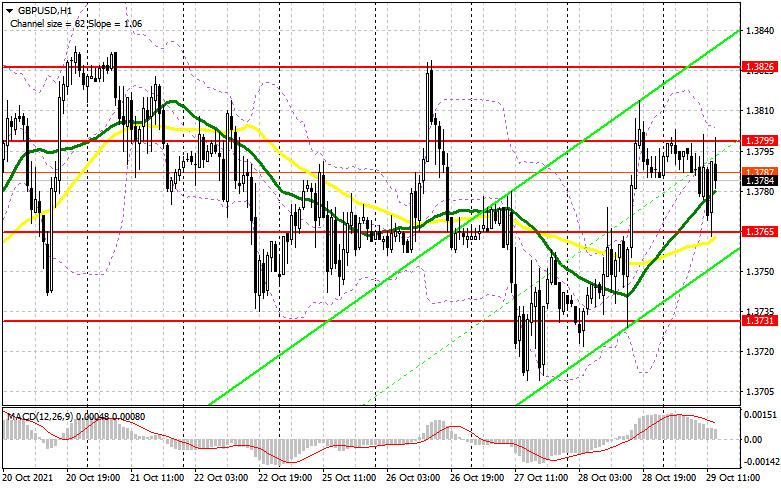
| Trading signal for GBP/USD on October 29 - November 01, 2021: sell below 1,3793 (5/8) Posted: 29 Oct 2021 06:45 AM PDT
On the American pre-market, the British pound is trading below 5/8 of murray and below the downtrend channel that was formed on October 18. Yesterday GBP/USD could not overcome the barrier of 1.38. The last 4-hour candles show that there were several attempts to consolidate above this level but the pair could not achieve it. At the moment, the currency pair is retracing and trading at 1.3781. As the British pound has consolidated below the top of the downtrend channel and below 5/8 Murray, a downward movement is likely if it remains below this level. Immediate support stands at the 21 SMA around 1.3762. A breakdown and consolidation below this level could accelerate the decline to the 200 EMA around 1.3710. As long as it remains above the 200-day moving average, this retracement would be considered a correction and we could look for an opportunity to buy around 1.3690 because at this level 4/8 of a murray is also located and could offer support to the pair. Our target will be at 1.3793. If this level is broken, the price could go up to 1.3916 (6/8). On the other hand, in the case of a break and consolidation below 1.3771, we should place sell orders because the market would confirm a new bearish scenario. The EMA of 200 and 4/8 of murray are exerting downward pressure, so GBP/USD could easily fall to the low of September 29 of about 1.3427. It is the strong support of 2/8 murray. Since October 18, the oscillator of the eagle indicator has entered an overbought zone and the signal continues to give a bearish movement. The eagle indicator will also support our strategy of selling below 5/8 of murray with targets at 1.3709 and 1.3671 (4/8). The market sentiment report for Friday shows that there are 43.53% of traders who are buying GBP / USD. This is a positive sign for the pair. It seems that that after this period of correction there will be an opportunity to buy around of 1.3671 and could go up to 1.3916. Our trading plan is to sell at the current price levels around 1.3781. Otherwise, if a pullback occurs towards the top of the bearish channel, it would be a good idea to sell if it fails to break, with targets at 1.3762 and up to 1.3700. The eagle indicator supports our bearish strategy. Support and Resistance Levels for October 29 - November 01, 2021 Resistance (3) 1.3890 Resistance (2) 1.3861 Resistance (1) 1.3816 ---------------------------- Support (1) 1.3765 Support (2) 1.3724 Support (3) 1.3697 *********************************************************** A trading tip for GBP/USD for October 29 - November 01, 2021 Sell below 1.3793 (5/8) with take profit at 1.3762 (SMA 21) and 1.3709 (EMA 200), stop loss above 1.3825. The material has been provided by InstaForex Company - www.instaforex.com |
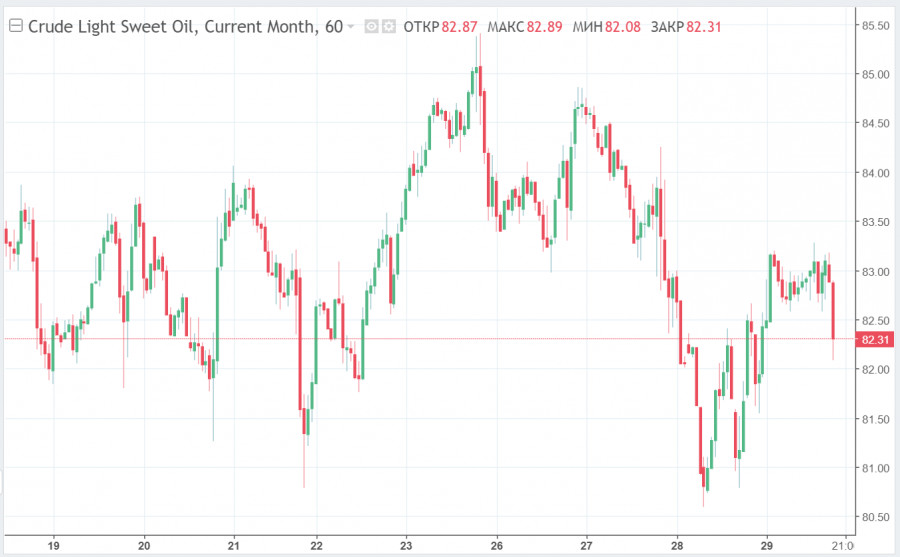
| Oil closes week's trading at $83 Posted: 29 Oct 2021 06:18 AM PDT
Oil prices were under pressure in the first half of Thursday. The sell-off began immediately after the release of weak data from the EIA. Brent dropped to $82.3 per barrel, but by the evening the benchmark managed to recover most of its losses. Public statements by Iranian officials that negotiations on a nuclear program with the US are likely to continue may have triggered weakness in oil prices on Thursday. The exact date will be announced next week, but it is already known to be the end of November. If the deal is successful, Iran's oil and gas sanctions could be lifted and an additional 1 million bpd of crude could flood into the market. It raises concerns, however, these are just assumptions, because no one knows what the current state of Iran's production capacity is. There is a low probability that Iran will take less than a month to restore production. Besides, the Iranian authorities have hinted that the resumption of negotiations with the US is impossible until the latter unfreeze Iranian assets abroad in the amount of $10 billion. Therefore, although the market takes into account the expected growth of production, it is not expected to pose any strong threat. Iran's economy is suffering greatly because of US sanctions. However, the Iranian government is in no hurry to agree with the conditions provided by the US but is desperately trying to demonstrate its ability to resist the imposed restrictions and defend its interests. The Iranian authorities are also not ruling out the fact that any improvement in relations with the US government could last for a short time. Worries about this are increasing as the US presidential election approaches in 2024 and the Republicans may win it. Iran has no reason to be confident that the new authorities in the US will not impose new sanctions against them. However, the current White House administration also cannot guarantee this. The OPEC+ countries received another argument in favor of preserving the status quo at the upcoming meeting and refraining from a more forced production increase. On Thursday, the head of Algeria's energy ministry announced that the committee did not need to increase production in December over the previously planned 0.4 million bpd. The main reason for this tactic is the exorbitant risks and continuing uncertainty. Although Algeria is not the most influential country in OPEC, its opinion on this issue nevertheless reflects the position of the majority of the alliance members. Another significant event for the oil market: the new estimate of the OPEC+ technical committee shows that world commercial hydrocarbon stocks in the 6th quarter of this year will decrease by 1.1 million bpd, although previously it was expected to drop by 0.67 million bpd. The Brent crude oil futures, by the time this article was prepared, slightly retreated from the levels of yesterday's trading session results. The benchmark oil fell by 0.36% to $83.21 per barrel in the afternoon hours, while WTI fell by 0.68% to $82.09 per barrel. Market players are eagerly awaiting news: the Euroregion GDP figures for Q3 this year, the monthly oil production report, and the September US personal income and spending data. Oil prices are unlikely to rebound after a mid-week decline mainly due to a lack of strong upside factors and are very likely to close this week's trading session at around $83 per barrel.
|
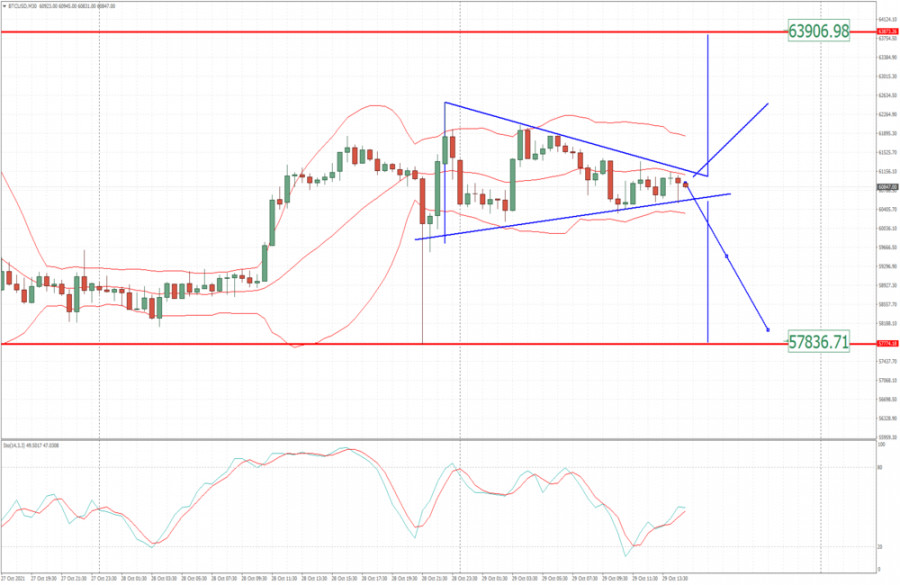
| BTC analysis for October 29,.2021 - Symmetrical triangle in play, watch for the breakout Posted: 29 Oct 2021 05:10 AM PDT Technical analysis:
BTC is building symmetrical triangle in last 24 hours. I see potential for the breakout in the next period. Trading recommendation: Due to well established symmetrical triangle in the background, my advice is to watch for the breakout to confirm further direction. Upside breakout can confirm test of $63,900 and buying opportunities on the pullbacks would be best option in that case. Downside breakout of support will can produce downside movement towards $57,835 and in that case, bearish opportunities on the rallies will be preferable option. The material has been provided by InstaForex Company - www.instaforex.com |
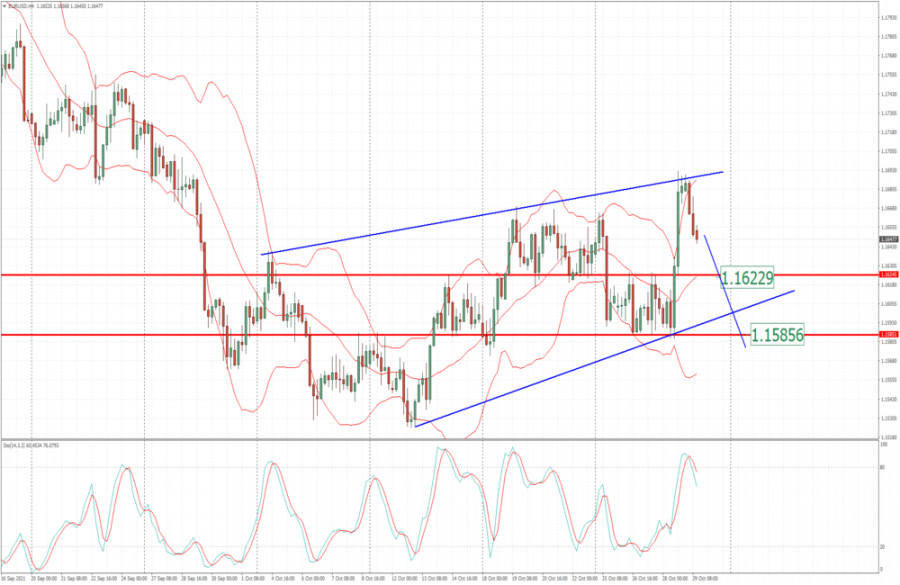
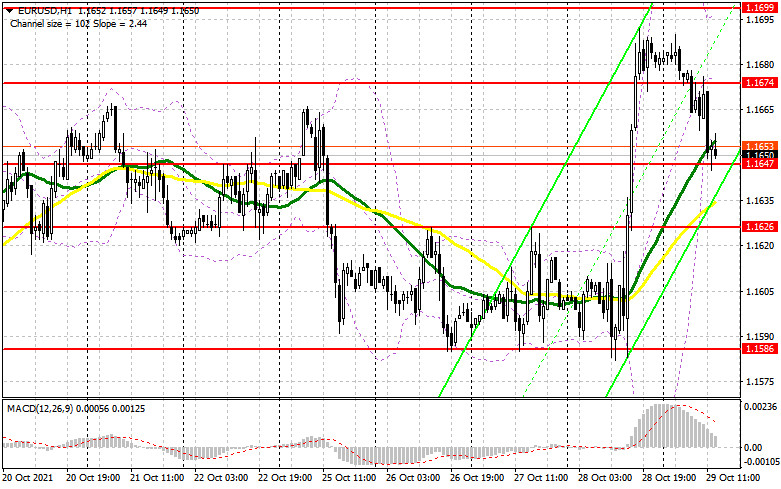
| Posted: 29 Oct 2021 05:00 AM PDT Technical analysis:
EUR/USD has been trading upside yesterday but we got buying climax in the background, which is sign of the weakness. Trading recommendation: Due to the buying climax in the background and downside today, I see potential for further downside continuation today. My advice is to watch for selling opportunities on the rallies with the downside objective at the price of 1,1625 and 1,1585. Stochastic oscillator is showing fresh bear cross and overbought condition, which is sign for the further downside movement. Key resistance set at 1,1690 The material has been provided by InstaForex Company - www.instaforex.com |
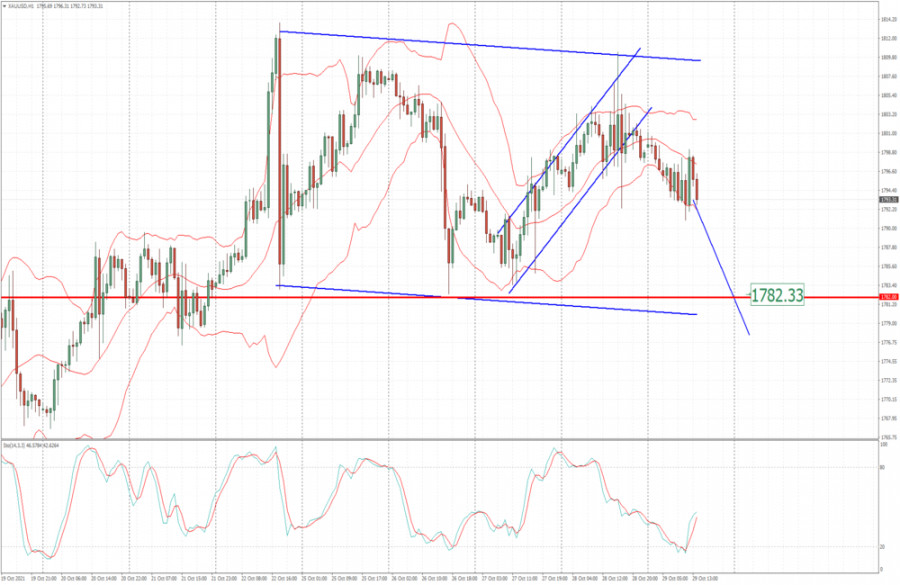
| Analysis of Gold for October 29 - Potential for the drop towards $1.782 Posted: 29 Oct 2021 04:46 AM PDT Technical analysis:
Gold has been trading sideways at the price of $1,794 but I see potential for the downside movement towards lower area of channel. Trading recommendation: Due to te breakout of the rising channel in the background, I see potential for the downside movement. Watch for selling opportunities on the intraday rallies with the downside objective at $1,782. Key resistance is set at $1,810 The material has been provided by InstaForex Company - www.instaforex.com |
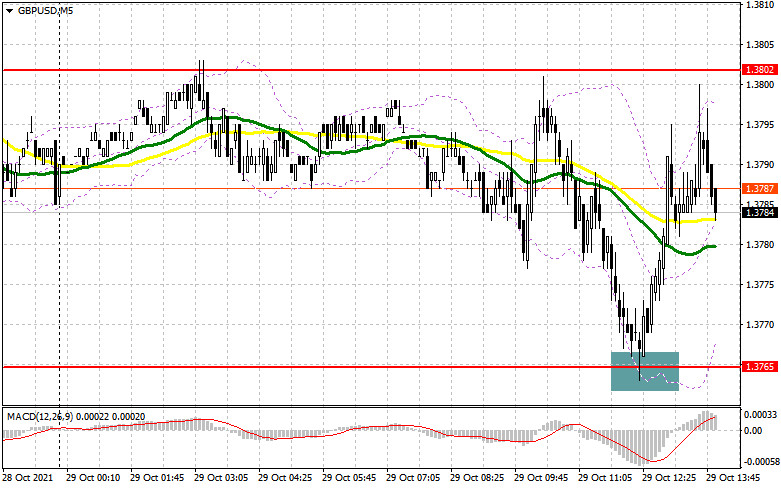
| Posted: 29 Oct 2021 04:37 AM PDT To open long positions on GBP/USD, it is required: In the first half of the day, an excellent signal was formed to buy the pound. Let's look at the 5-minute chart and analyze the entry point. As a result of the decline to the support of 1.3765, which I emphasized in my morning forecast, an unsuccessful attempt by bears to push through this area led to the formation of a false breakdown and a signal to buy GBP/USD. By the middle of the day, the bulls returned to the resistance area of 1.3800, which allowed them to take about 35 points of profit from the market. For the second half of the day, the technical picture has not changed much.
The main focus of traders will be placed on changes in the level of spending and income of the US population, as well as on the consumer sentiment index from the University of Michigan. The Chicago PMI index is unlikely to lead to serious changes in the market, but it is also worth paying attention to. The bulls' task is still to return the pair to monthly highs, and it is necessary to break above 1.3799, which could not be done in the first half of the day. Only a reverse test of this level from top to bottom will give an entry point into long positions, which will allow updating the level of 1.3826. A breakdown of this range will lead to the demolition of several bears' stop orders and a larger growth of the pair in the area of the highs: 1.3864 and 1.3910, where I recommend fixing the profits. In the scenario of a decline in the pair in the afternoon against the background of strong indicators for the American economy, an equally important task for buyers will be to protect the support of 1.3765, which they successfully coped with during the European session. There are also moving averages playing on their side. Only the formation of a false breakdown by analogy with what I have analyzed above will increase the chance of a further upward correction of the pair within the day. In the scenario of the absence of active actions on the part of the bulls in the area of 1.3765, the best option for buying the pound will be a test of the next support of 1.3731. However, I advise you to open long positions there only after a false breakdown. You can watch GBP/USD purchases immediately for a rebound from the new low of 1.3697, or even lower - from the support of 1.3668, counting on a correction of 25-30 points within the day. To open short positions on GBP/USD, you need: The sellers of the pound are also aimed at bringing the market back under their control, but it seems that now is the time to think about how to defend the resistance of 1.3799. Only the formation of a false breakdown there will lead to the formation of a sell signal, which will push the pair to the support of 1.3765, where the moving averages that limit the downward potential pass. A breakout of 1.3765 and a reverse test from the bottom up will form a signal to open new short positions in the expectation of a fall to the lower border of the 1.3731 side channel, the breakdown of which will provide the sellers of the pound with a direct path to the lows: 1.3697 and 3668, where I recommend fixing the profits. However, such a scenario will be possible in the case of strong fundamental statistics on the American economy. In case of further growth of GBP/USD in the afternoon and the absence of bear activity at 1.3799, I advise selling the pound only after the formation of a false breakdown at monthly highs around 1.3826. I advise you to open short positions immediately for a rebound from the level of 1.3864, or even higher - from a new maximum in the area of 1.3910, counting on the pair's rebound down by 20-25 points inside the day.
The COT reports (Commitment of Traders) for October 19 recorded a reduction in short and an increase in long positions, which reflects the upward trend in the pound observed in the middle of this month. It led to the return of the net position of a positive value. Speeches and statements by representatives of the Bank of England that it is necessary to take inflationary pressure more seriously also add confidence to buyers of the pound. Last week's speech by the Governor of the Bank of England, Andrew Bailey, was positively received in the market. He once again repeated his position on changing monetary policy. However, a slight slowdown in monthly and annual inflation growth in the UK limited the upward potential of the pair in the middle of the week, which led to its locking in a side channel. I advise you to count on the further strengthening of the pound and take advantage of any decline in the short term, which may form in the case of weak fundamental statistics. The COT report indicates that long non-commercial positions rose from the level of 46,794 to the level of 49,112, while short non-commercial positions fell from the level of 58,773 to the level of 47,497. It led to a change in the non-commercial net position from a negative value to a positive one. The delta was 1,615, against -11,979 a week earlier. The closing price of GBP/USD increased significantly: from 1.3591 to 1.3735. Signals of indicators: Moving averages Trading is conducted above 30 and 50 daily moving averages, which indicates the continuation of the pound's growth in the short term. Note: The period and prices of moving averages are considered by the author on the hourly chart H1 and differ from the general definition of the classic daily moving averages on the daily chart D1. Bollinger Bands Volatility has decreased, which does not give signals to enter the market. Description of indicators
|
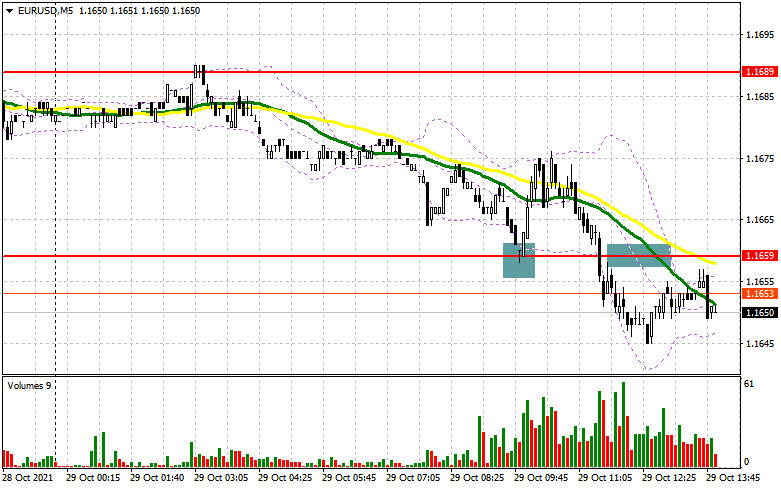
| Posted: 29 Oct 2021 04:33 AM PDT To open long positions on EURUSD, you need: In the first half of the day, I paid attention to the 1.1659 level and recommended making decisions from it. Let's look at the 5-minute chart and talk about what happened. Strong inflation in the eurozone and weak growth rates of the German economy in the 3rd quarter of this year left mixed feelings among investors, which led to a decline in the euro to the support area of 1.1659. The formation of a false breakdown there formed a signal to open long positions in continuation of yesterday's trend, but after a jump up by 15 points, everything ended and the pair again descended to the area of 1.1659. After that, a breakdown followed, but without a reverse test – for this reason, I did not enter into short positions against the trend from this level. In the afternoon, the picture changed slightly.
Buyers have a problem since even at current lows, no people are willing to open new long positions. A serious inflationary jump in the eurozone is not helping the bulls much yet, so they are counting on the pair's continued growth. In the afternoon, everyone will focus on the return of the 1.1674 resistance, which they missed today following the results of European trading. Only a breakdown and a test of this level from top to bottom, together with weak data on Americans' spending, form an excellent entry point into long positions, which will open the way to a maximum of 1.1699. Only a similar breakthrough of this range will lead EUR/USD to the area of 1.1724 and 1.1749, where I recommend fixing the profits. In the event of a decline in EUR/USD in the afternoon and the absence of buyers at 1.1647, and there are moving averages limiting the downward correction of the pair, an equally important task for the bulls will be to protect the next support of 1.1626. Only the formation of a false breakdown there forms a good entry point into long positions. In the absence of bulls there, I advise you to postpone purchases at 1.1568, where you can buy immediately for a rebound based on a correction of 15-20 points within a day. To open short positions on EURUSD, you need: The initial task of the sellers of the euro remains to protect the resistance of 1.1674. Only another formation of a false breakdown there, along with strong data on the growth of spending and income of Americans, as well as a rise in consumer sentiment from the University of Michigan – only this will lead to the formation of a good entry point into short positions, which will again push the pair to the support of 1.1674 formed in the morning. A breakout and a test of 1.1674 from the bottom-up form an additional signal to open new short positions already to reduce EUR/USD to the area of 1.1626. A breakdown of this range will also demolish several buyers' stop orders, which will quickly collapse the euro by 1.1586, where I recommend fixing the profits. In the scenario of the pair's growth in the afternoon and the absence of sellers at the level of 1.1674, it is best to postpone sales until this month's maximum is updated - 1.1699. It is possible to open short positions immediately for a rebound based on a downward correction of 15-20 points even higher - from the level of 1.1724.
The COT report (Commitment of Traders) for 19 recorded a reduction in both short and long positions, which led to a slight recovery of the negative delta, as more sellers left the market than buyers. Last week, inflation in the eurozone came out, which increased and coincided with economists' expectations. It forced many representatives of the European Central Bank to talk again about changes in monetary policy. However, the fact that almost everyone adhered to a wait-and-see attitude and continued stimulus measures in the form of bond purchases after the completion of the PEPP program in March next year put some pressure on the European currency. The slowdown in activity in the manufacturing and services sectors of the eurozone also did not allow euro buyers to get beyond the 17th figure. However, the key problem in the shorter term, which harms the growth of the euro, is the sharp spread of the fourth wave of coronavirus infection throughout the European Union. As for the United States of America, the good pace of recovery of the American economy continues to support the US dollar. The fact that the Federal Reserve is already seriously considering curtailing the bond purchase program at the next meeting in November will also limit the upward potential of the euro against the US dollar. The COT report indicates that long non-commercial positions decreased from the level of 202,512 to the level of 193,320, while short non-commercial positions dropped from the level of 220,910 to the level of 205,427. At the end of the week, the total non-commercial net position decreased and amounted to -12,107 against -18,398. The weekly closing price rose to the level of 1.1613 against 1.1553. Signals of indicators: Moving averages Trading is conducted above 30 and 50 daily moving averages, which indicates the preservation of the upward potential of the euro in the afternoon. Note: The period and prices of moving averages are considered by the author on the hourly chart H1 and differ from the general definition of the classic daily moving averages on the daily chart D1. Bollinger Bands A breakthrough of the lower limit of the indicator in the area of 1.1647 will lead to an instant fall of the euro. In the case of growth, the upper limit of the indicator around 1.1699 will act as resistance. Description of indicators
|


 Thus, the EUR/USD pair made a circle and returned to its previous positions. The targets, in fact, also remained the same. It is advisable for traders to consider the option of short positions with the first target of 1.1570 (a two-week price minimum) and 1.1528 (an annual minimum that coincides with the lower line of the Bollinger Bands indicator on the D1 timeframe). It is too early to talk about lower price values.
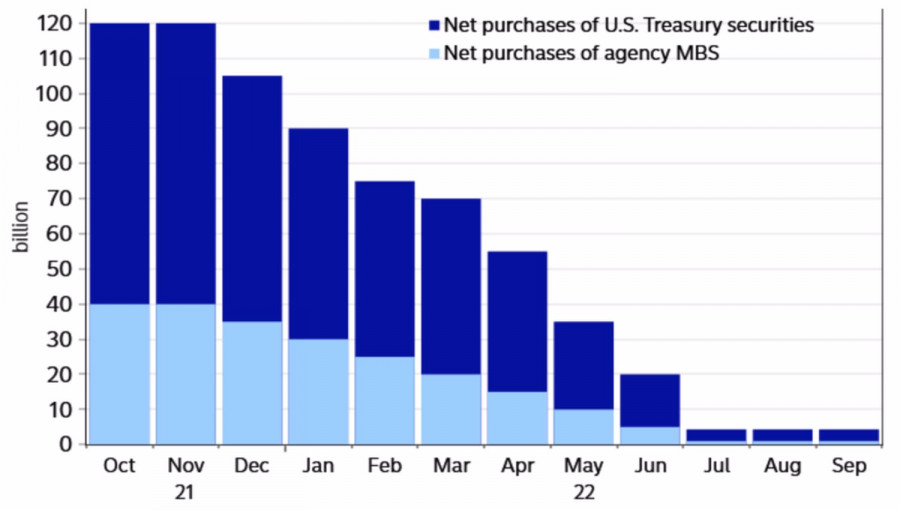

| You are subscribed to email updates from Forex analysis review. To stop receiving these emails, you may unsubscribe now. | Email delivery powered by Google |
| Google, 1600 Amphitheatre Parkway, Mountain View, CA 94043, United States | |


Comments