Forex analysis review
Forex analysis review |
- Trading plan for EUR/USD pair on October 27, 2021
- How to trade EUR/USD on October 27? Simple tips for beginners. The pair let them earn on Tuesday
- Tesla looks to be gearing up for resumption of Bitcoin adoption, with Elon Musk facing strong inflationary pressures
- October 26, 2021 : EUR/USD daily technical review and trading opportunities.
- October 26, 2021 : EUR/USD Intraday technical analysis and trading plan.
- October 26, 2021 : GBP/USD Intraday technical analysis and significant key-levels.
- EUR/GBP: Pound grows on "hawkish" rumors
- Wave analysis of EUR/USD for October 26: Ahead of the ECB meeting
- Trading signal for Ethereum (ETH) on October 26 - 27, 2021: sell below $4,200 (double top)
- Bitcoin: Technical picture ignores growth catalysts
- Trading signal for GBP/USD on October 26 - 27, 2021: sell below 1.3830 (Triple top)
- Crypto market noted record inflows of $1.4 billion in a week; BTC approaches $64k mark
- Trading signal for GOLD on October 26 - 27, 2021: sell below $1,803 (overbought)
- BTC analysis for October 26,.2021 - Potential for drop towards $61.720
- US stock indicators hit all-time highs
- Analysis of Gold for October 26,.2021 - Breakout of the rising trendline
- EUR/USD analysis for October 26, 2021 - Potetnial for the downside continuation
- Oil rally is unstoppable
- Video market update for October 26,2021
- Short-term analysis on EURUSD
- Ichimoku cloud indicator analysis on Gold for October 26, 2021.
- Short-term analysis on Ethereum.
- GBPUSD bulls remain in control of the trend.
- Short-term analysis on the Dollar index.
- Wave analysis of EUR/USD for October 26, 2021
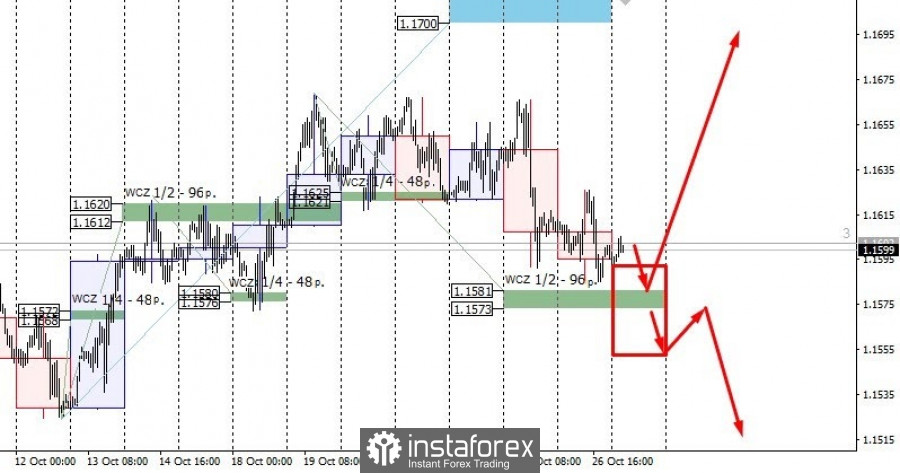
| Trading plan for EUR/USD pair on October 27, 2021 Posted: 26 Oct 2021 08:00 PM PDT The EUR/USD pair is trading around the main support zone – WCZ of 1/2 1.1581-1.1573 today. If testing this zone leads to a stop of the fall and the "absorption" pattern is formed, then purchases may appear. It is worth noting that when forming a trading plan, the upward medium-term pattern has not yet been 100% implemented. This can cause the decline to stop during the test of the Weekly Control Zone 1/2. Today's daily candle should close above the opening of yesterday's trading. This will be a strong hint for a renewed upward impulse. If today's American session closes below the level of 1.1573, then the upward pattern will be broken and a new cycle of bearish momentum will begin.
Both patterns have good potential, but it is still important to determine the direction. The easiest way to do this is after the closing of today's daily candle. With a downward movement, the probability of updating the October minimum will increase to 80%. The material has been provided by InstaForex Company - www.instaforex.com |
| How to trade EUR/USD on October 27? Simple tips for beginners. The pair let them earn on Tuesday Posted: 26 Oct 2021 02:14 PM PDT Analysis of previous deals: 30M chart of the EUR/USD pair
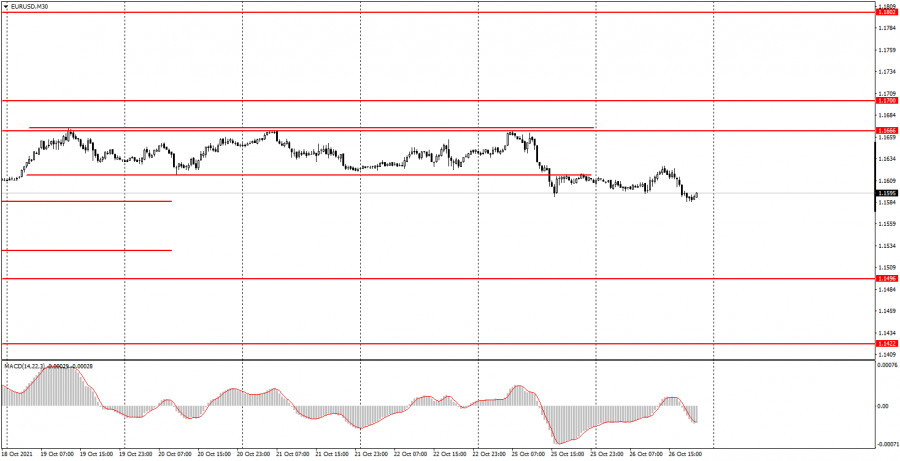
After a rather active Monday, the EUR/USD pair returned to its usual trading mode on Tuesday. Today's volatility was 40 points, and there was no trend movement within the day. Although it is better to say that the trend movement was absent on any timeframes. We haven't seen a trend movement on the 30-minute chart for several weeks: at first the pair was inside one horizontal channel, then inside the second. Yesterday the quotes of the pair left the last horizontal channel, however, as we can see, there is no trend at this time, and the price is now slightly below the horizontal channel. Consequently, the trend is still absent now, and it is still not recommended to consider signals from the MACD indicator. As for the macroeconomic background, only one more or less significant report was published today - the indicator of consumer confidence in the United States, which rose from 109.8 points to 113.8 points. We can say that it helped the dollar a bit, since the dollar continued to rise in price after it was published. However, please note that the strength of the movement after this report has not changed, so this may be a simple coincidence. 5M chart of the EUR/USD pair
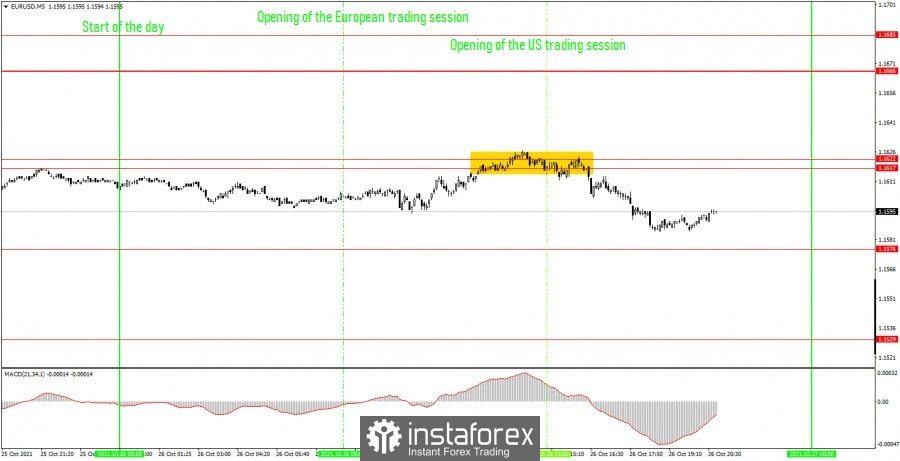
The technical picture on the 5-minute timeframe looks, oddly enough, very good. Despite the fact that the pair spent the entire day in indistinct movements again, one trading signal was still formed. Although it was, to put it mildly, not the most accurate. However, what else can you expect in an almost absolute flat with low volatility? It's good that there was only one signal and not a false one. One way or another, the EUR/USD pair bounced off the resistance area of 1.1617-1.1622, which was a sell signal. Thus, novice traders could open short positions at this point. Fortunately, the downward movement continued and at the current moment the price has failed to reach the nearest target level of 1.1576. Thus, a short position should be manually closed at a profit of about 18 points. This result is excellent considering the overall volatility of the instrument. Unfortunately, in general, rather vague movements continue, in which it is very difficult to count on serious profits. How to trade on Wednesday: The pair left another horizontal channel on the 30-minute timeframe, but there is still no trend at this time. Thus, it is still not very convenient to trade on the 30-minute TF, and we still do not recommend tracking signals from the MACD indicator. We advise you to wait for the formation of a trendline or trend channel. The key levels on the 5-minute timeframe for October 27 are 1.1576, 1.1617 - 1.1622, 1.1666 and 1.1685. Take Profit, as before, is set at a distance of 30-40 points. Stop Loss - to breakeven when the price passes in the right direction by 15 points. At the 5M TF, the target can be the nearest level if it is not too close or too far away. If it is, then you should act according to the situation or work according to Take Profit. On Wednesday, the only more or less important report will be US durable goods orders. This report cannot be called secondary, it used to often provoke a reaction from the markets. However, over the past year, markets have barely responded to it. Consequently, the discrepancy between the actual value and the predicted value must be very large for market participants to react. Basic rules of the trading system: 1) The signal strength is calculated by the time it took to form the signal (bounce or overcome the level). The less time it took, the stronger the signal. 2) If two or more deals were opened near a certain level based on false signals (which did not trigger Take Profit or the nearest target level), then all subsequent signals from this level should be ignored. 3) In a flat, any pair can form a lot of false signals or not form them at all. But in any case, at the first signs of a flat, it is better to stop trading. 4) Trade deals are opened in the time period between the beginning of the European session and until the middle of the American one, when all deals must be closed manually. 5) On the 30-minute TF, using signals from the MACD indicator, you can trade only if there is good volatility and a trend, which is confirmed by a trend line or a trend channel. 6) If two levels are located too close to each other (from 5 to 15 points), then they should be considered as an area of support or resistance. On the chart: Support and Resistance Levels are the Levels that serve as targets when buying or selling the pair. You can place Take Profit near these levels. Red lines are the channels or trend lines that display the current trend and show in which direction it is better to trade now. The MACD indicator (14,22,3) consists of a histogram and a signal line. When they cross, this is a signal to enter the market. It is recommended to use this indicator in combination with trend lines (channels and trend lines). Important speeches and reports (always contained in the news calendar) can greatly influence the movement of a currency pair. Therefore, during their exit, it is recommended to trade as carefully as possible or exit the market in order to avoid a sharp price reversal against the previous movement. Beginners on Forex should remember that not every single trade has to be profitable. The development of a clear strategy and money management are the key to success in trading over a long period of time. The material has been provided by InstaForex Company - www.instaforex.com |
| Posted: 26 Oct 2021 02:14 PM PDT
Tesla has become a company with a global capitalization of $1 trillion, it seems that the corporation is seriously thinking about resuming the adoption of bitcoin for its electric vehicles. Elon Musk is confident that strong inflationary pressure will soon be observed in the world. Musk agrees with other figures of the world monetary policy on this issue, because even the Federal Reserve predicts that inflation will persist, and possibly even increase. This cannot but cause concern for bitcoin, given its deflationary characteristics. Musk is sure that bitcoin is a real magic pill from the problems of fiat funds. The richest man on the planet agreed with Michael Saylor, as well as Ark Invest CEO Katie Wood that inflationary pressure will persist for the next year, maybe two. Michael Saylor and Katie Wood, on the contrary, did not agree with Jack Dorsey's tweet that inflation could change everything. "Inflation is a vector of direction and it clearly defines the movement of many products, services and assets that are not measured using CPI or PCE. Bitcoin is the best solution for holders, corporations, or the average user who is looking for a real hedge asset and inflation protection for a long time," Saylor wrote. Meanwhile, Musk is seriously thinking about returning to paying in bitcoins. In a recent filing with the U.S. Securities and Exchange Commission, the company left the door open to accepting btc for payment for its products in the near future. The document states that for nine full months, the company purchased bitcoins for a total of $1.5 billion. Also, for three months, until March 31, 2021, Tesla accepted bitcoins as payment for electric cars in certain regions and in accordance with current legislation. This procedure was discontinued in May 2021. In the future, Tesla may resume the practice of accepting payments in bitcoin for cars. The material has been provided by InstaForex Company - www.instaforex.com |
| October 26, 2021 : EUR/USD daily technical review and trading opportunities. Posted: 26 Oct 2021 12:28 PM PDT
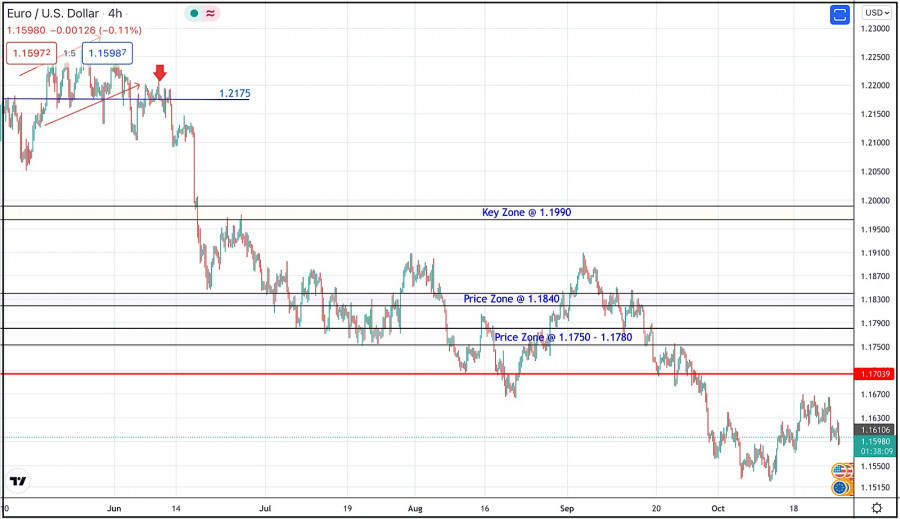
Recently, Persistence below the depicted price zone of 1.1990 indicated further downside movement towards 1.1840 and 1.1780 where a sideway consolidation range was established. During last week, the EURUSD pair has been trapped within a narrow consolidation range between the price levels of 1.1780 and 1.1840. A bullish breakout was executed above 1.1840 shortly after. Temporary Upside pullback was expected towards 1.1990. However, re-closure below the price level of 1.1840 has initiated another downside movement towards 1.1780 which failed to hold prices for a short period of time before significant upside movement was presented into market. Intraday traders were advised to wait for candlestick closure above 1.1780 - 1.1840 for another ascending swing to be initiated. However, immediate downside selling pressure brought the pair down below 1.1700. More downside movement took place towards the price level of 1.1600 where significant buying pressure existed. Bearish persistence below 1.1700 and 1.1600 has enhanced further decline towards 1.1500. Currently, the price zone around 1.1700 stands as a prominent supply-zone to be watched for SELLING pressure and a possible SELL Entry upon any upcoming ascending movement. The material has been provided by InstaForex Company - www.instaforex.com |
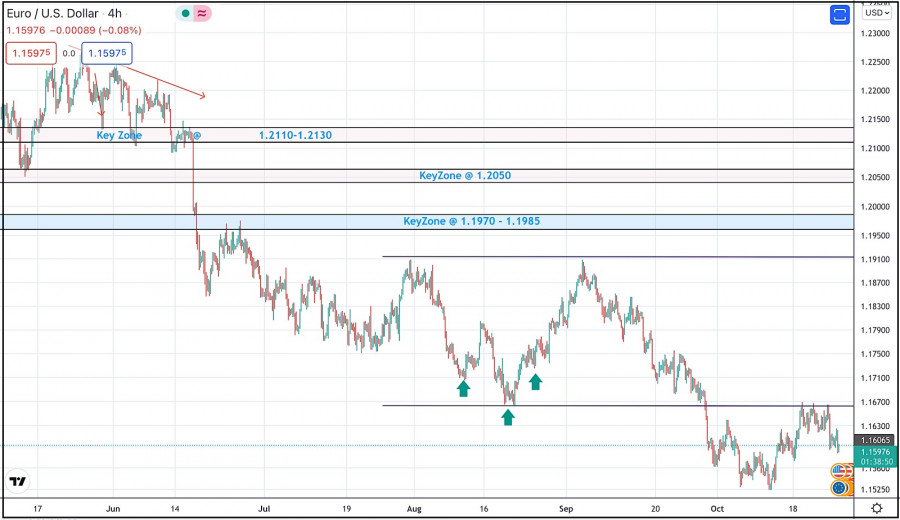
| October 26, 2021 : EUR/USD Intraday technical analysis and trading plan. Posted: 26 Oct 2021 12:28 PM PDT
Bearish persistence below the price zone of 1.2050-1.2000 allowed the recent downtrend to be established. So, the EURUSD pair has expressed significant bearish decline while the price level of 1.1650 stood as a prominent demand level that prevented further bearish decline. The bullish pressure that originated around 1.1650 failed to push higher than the price level of 1.1900. That's why, another bearish pullback towards 1.1650 was executed. Bullish signs were expected around the price levels of 1.1650-1.1700 as it corresponded to a recent previous bottom. However, extensive bearish decline has pushed the EURUSD pair towards 1.1600 and lower levels was about to be reached if sufficient bearish momentum was maintained. Moreover, significant bullish recovery has originated recently upon testing the price level of 1.1570. Upcoming bullish pullback towards 1.1650-1.1680 should be considered for bearish rejection and a valid SELL Entry. Initial T/P levels are located around 1.1570 and 1.1530. The material has been provided by InstaForex Company - www.instaforex.com |
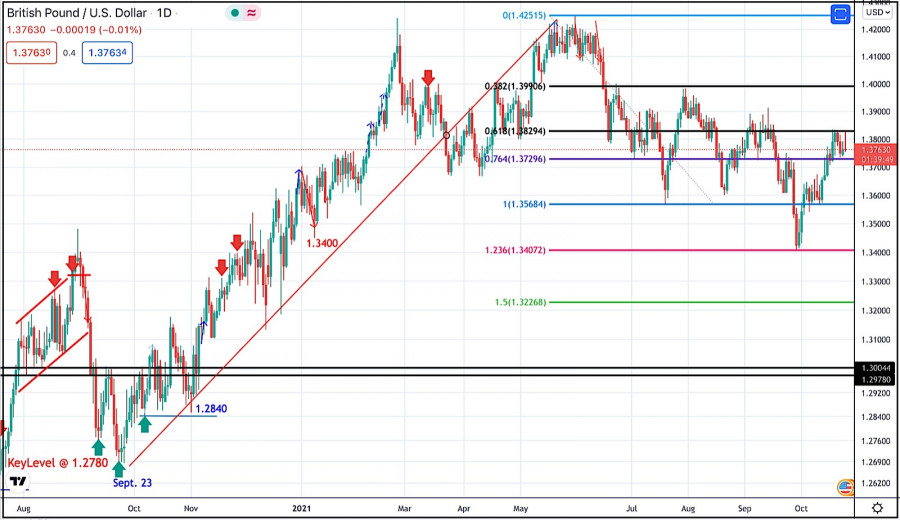
| October 26, 2021 : GBP/USD Intraday technical analysis and significant key-levels. Posted: 26 Oct 2021 12:26 PM PDT
The GBPUSD pair has been moving sideways with some bearish tendency while bearish breakout below 1.3600 was needed to enhance further bearish decline. On the other hand, the nearest SUPPLY level was located around 1.4000 where bearish rejection and a valid SELL Entry was anticipated. The recent bullish rejection witnessed around 1.3600 as well as the temporary bullish breakout above 1.3880 indicated a high probability that this bullish movement may pursue towards 1.4025 then 1.4100. However, the pair remained trapped within a fixed price range until significant bearish momentum emerged into the market. Bearish breakout below 1.3720 enabled further bearish decline towards 1.3560 then 1.3400 which was expected to be reached. Recently, the GBPUSD pair was testing Demand-Zone located around 1.3400 which corresponded to 123% Fibonacci Level of the most recent bearish movement. This was a good entry level for a corrective bullish pullback towards 1.3650 and 1.3720 which maybe bypassed if sufficient bullish momentum is maintained. Currently, the short-term outlook remains bullish as long as the pair maintains its movement above 1.3730. However, the pair was testing the resistance zone around 1.3830 where some bearish pressure originiated into the market. On the other hand, another bearish decline below 1.3720 will probably be an indicator for more bearish movement towards 1.3570 as it corresponds to the next Fibonacci Expansion Level. The material has been provided by InstaForex Company - www.instaforex.com |
| EUR/GBP: Pound grows on "hawkish" rumors Posted: 26 Oct 2021 10:05 AM PDT The pound is again gaining momentum across the market ahead of the penultimate meeting of the Bank of England this year, which will be held next week. Hawkish expectations continue to strengthen amid relevant comments from experts and the growth of key macroeconomic indicators. And in a pair with the dollar, the British pound behaves relatively modestly (dollar bulls restrain the onslaught of opponents), then in the main cross-pairs, the pound has "spread its wings." This is especially evident in the euro-pound pair, which on Tuesday updated a 20-month low. And, apparently, the downside trend has not yet exhausted itself, given the "dovish" attitude of the ECB representatives. The uncorrelation of the positions of the European Central Bank and the British regulator plays the role of a locomotive that pulls the cross to new price lows.
So, on November 4, that is, next Thursday, the Bank of England will sum up the results of its next meeting. This meeting, in any case, will not be a "pass-through": the regulator will either meet the hawkish expectations or disappoint the supporters of the British currency. At the moment, the scales are tipping towards the hawkish scenario. Actually, for this reason, the pound is strengthening its position. For example, according to currency strategists of the financial conglomerate Wells Fargo (which is part of the so-called "big four" US banks), the British regulator will raise the rate by 15 basis points next week. Next year, according to the bank's analysts, the Central Bank of Great Britain will gradually tighten the parameters of monetary policy - the rate will be raised by 25 points in May, and by another 25 in November. In total, the rate will reach 0.75% by the end of 2022. However, not all experts agree with this "hawkish" scenario. Thus, the majority of analysts surveyed by Reuters agreed that the British regulator will be the second (after the Reserve Bank of New Zealand) of the world's leading central banks to decide to raise rates amid the coronavirus crisis. But they did not agree that the first increase will take place this year, and even more so at the November meeting. According to the interviewed experts, the first increase should be expected in the first quarter of next year (that is, at the February or March meeting). Only four out of 19 economists admitted the likelihood of monetary tightening already at the November meeting. From the point of view of medium-term trading, it does not matter at all whether the British regulator decides to raise the rate in November or take a wait-and-see attitude until February-March 2022. Until November 4, the pound will be in high demand due to the "buy the rumor, sell the news" trading principle. And if paired with the dollar, this principle is unlikely to "work" in full (since dollar bulls are also in anticipation of the November Fed meeting), while it will work "to the fullest" in a pair with the euro. It should be noted here that after the last release of quite strong data on the growth of European inflation, cautious talk appeared on the market that the ECB may still raise the interest rate on deposits at the end of next year. Many representatives of the European regulator did not like such rumors. In particular, the chief economist of the Central Bank Philip Lane said that the markets are "wishful thinking," complaining about the weak level of communication. It is likely that Christine Lagarde will also voice such theses following the ECB October meeting, which results will be known on Thursday. Even the moderately dovish attitude of the European regulator will contrast sharply with the intentions that are "attributed" to the Bank of England. I repeat - in the context of the medium-term, it doesn't really matter, whether the Central Bank of Great Britain will raise the rate in November or will it take a wait-and-see attitude. The "hawkish attitude" that keeps the pound afloat will support the British currency until the announcement of the results of the Bank of England meeting. Indirect support for the pound today was provided by the macroeconomic report, which was published by the Confederation of British Industry. This is an indicator of retail sales activity. The indicator is based on a survey of retail and wholesale companies on the dynamics of sales. It turned out that the balance of retail sales CBI grew much stronger than expected in October (30 points against the forecast of growth to 13 points).
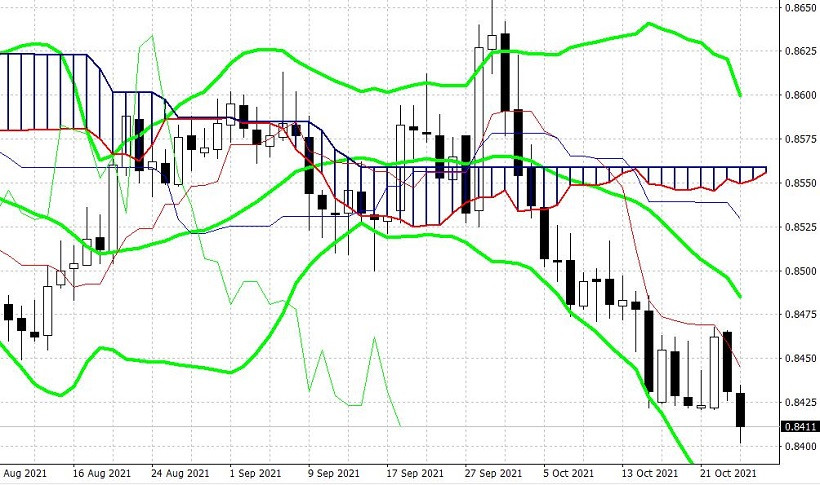
Technically, the EUR/GBP cross has not exhausted its downside potential. In particular, on the D1 timeframe, the price is between the middle and lower lines of the Bollinger Bands indicator, which indicates the priority of the downside direction. The Ichimoku indicator, in turn, has formed a bearish "Parade of Lines" signal, which also indicates a bearish sentiment. The nearest support level (target for the downside movement) is located at 0.8390 (lower line of the Bollinger Bands on the daily chart). The main price barrier is slightly lower - at around 0.8350 (the lower line of the Bollinger Bands on the MN timeframe). The material has been provided by InstaForex Company - www.instaforex.com |
| Wave analysis of EUR/USD for October 26: Ahead of the ECB meeting Posted: 26 Oct 2021 09:31 AM PDT |
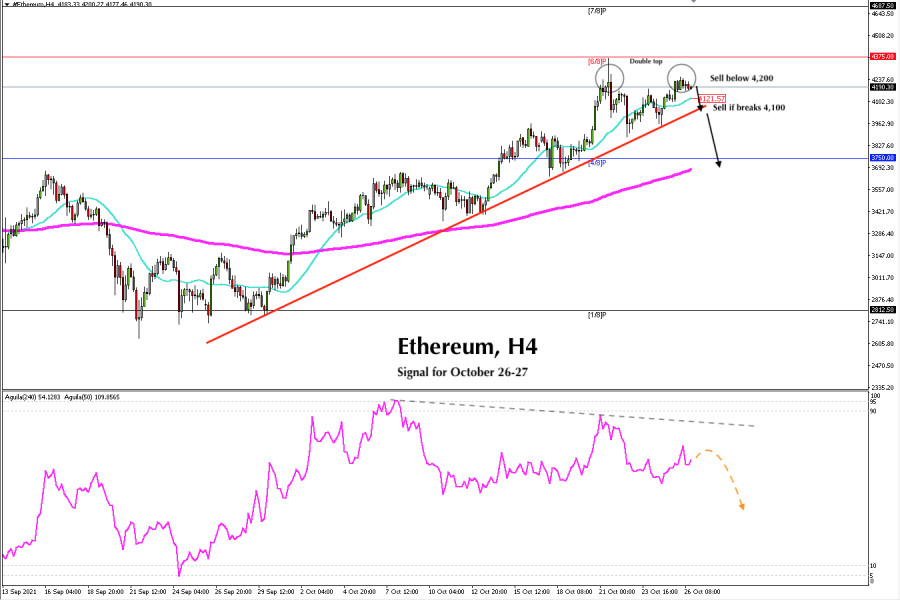
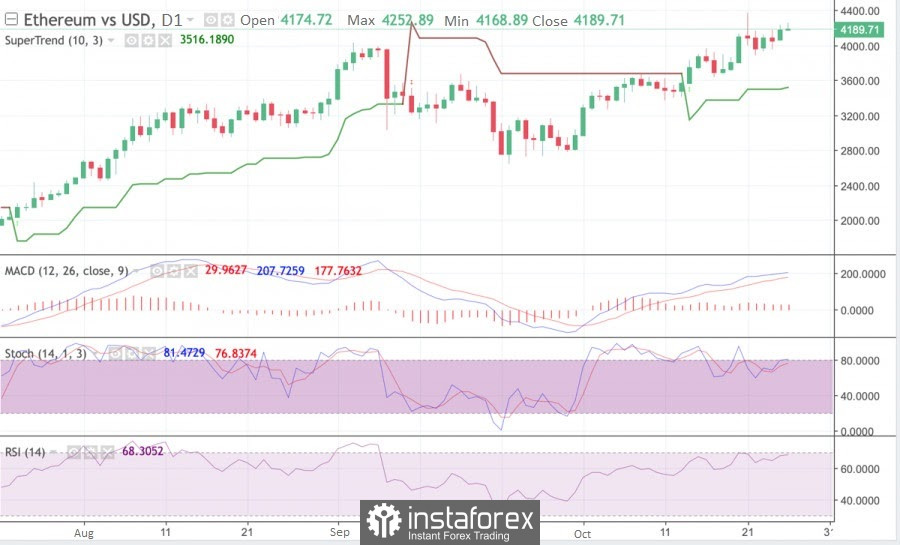
| Trading signal for Ethereum (ETH) on October 26 - 27, 2021: sell below $4,200 (double top) Posted: 26 Oct 2021 08:24 AM PDT
After having risen to the price level of May 12, 2021, Ethereum is making a technical correction. Yesterday there was an attempt to approach the high of 4,375, but the crypto failed to achieve its goal. Now in the American session, we notice that the bulls are getting exhausted and technical indicators are showing an overbought signal, which means that there could be a downward movement in the next few days. We expect a sharp break below the 21-moving average located at 4,121. Besides, we foresee a break and consolidation below the uptrend channel that comes from September 26. Once these steps are confirmed, there could be a fall towards the EMA of 200 around 3,690. For us, it will be a good selling opportunity. We could expect the uptrend to continue. For this, Ethereum must remain intact, trading above the uptrend channel. If ETH bounces at the bottom of the channel it would mean that the buying pressure continues to prevail and the price could break the level of 6/8 of the murray and go up to 7/8 of murray around 4,687. Our trading plan for the next few hours is to sell ETH below the second one-month high that was around 4,250 and below the formation of the double-top pattern, with targets at the uptrend channel. If this channel is broken, we could sell with targets at 4/8 murray around 3,750. Support and Resistance Levels for October 26 - 27, 2021 Resistance (3) 4,395 Resistance (2) 4,330 Resistance (1) 4,252 ---------------------------- Support (1) 4,062 Support (2) 3,896 Support (3) 3,750 *********************************************************** A trading tip for Ethereum for October 26 - 27, 2021 Sell below 4,200 (double top) with take profit at 4,100 (SMA 21) and 3,690 (EMA 200), stop loss above 4,375. The material has been provided by InstaForex Company - www.instaforex.com |
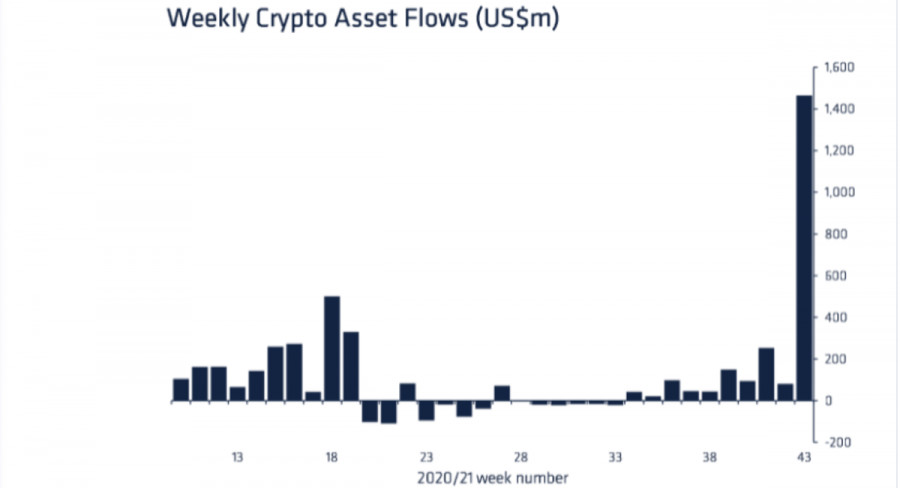
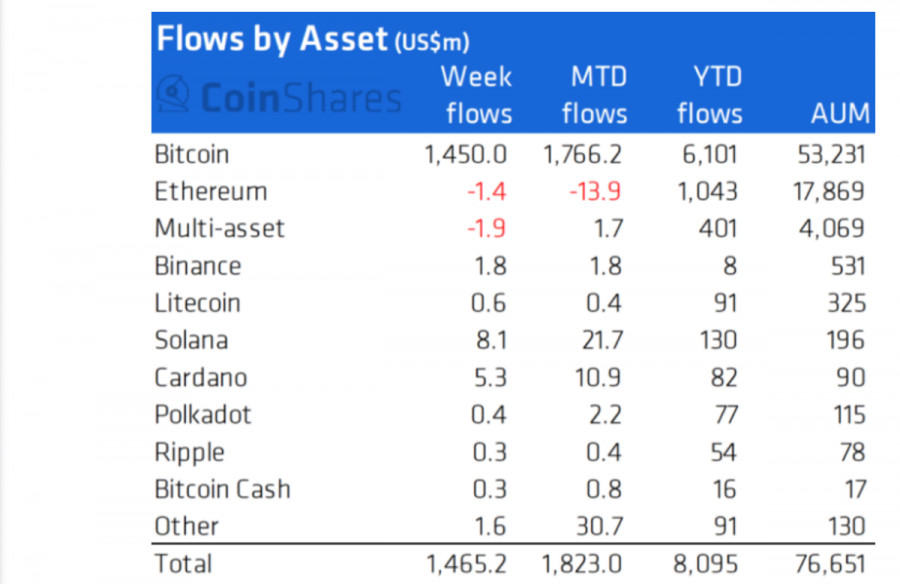
| Bitcoin: Technical picture ignores growth catalysts Posted: 26 Oct 2021 08:08 AM PDT Tuesday was a day of good news for the main cryptocurrency. From a document filed with the U.S. Securities and Exchange Commission (SEC), Tesla is likely to start accepting bitcoins as payment for its cars. But that's not all. Tesla is ready to bring back payment using bitcoins.Elon Musk's company has hinted at the possibility of accepting payments in cryptocurrency in financial details related to his initial purchase of bitcoins, which were added to the company's 10-Q filing with the U.S. regulator. Tesla said that the $1.5 billion purchase of bitcoins was made "during the nine months ended September 30, 2021." During this period, the firm also accepted bitcoin as payment for some of its products for three months, until March 31, 2021. According to a document released on Monday, October 25, 2021, the company now sees an opportunity to allow customers to pay with Bitcoin or other digital assets in the future. Tesla's SEC filing also acknowledges the company's view of digital assets, which the automaker says can provide a long-term investment as well as an alternative to cash. Record flow of investments in cryptocurrency.According to CoinShares' blog post, the cryptocurrency industry noted a record inflow of $1.47 billion this week. Of this, $1.2 billion came exclusively from the new Bitcoin ETF ProShares. It is currently an absolute record with a significant advantage over the previous weeks of the year. The total assets under management reached $76.7 billion. Obviously, massive inflows to the market are related to the listing and approval of BTC futures ETFs. The second-largest provider of funds last week was the ETC Group, which brought in $111 million to the market. And as the main cryptocurrency is becoming more and more popular among institutional investors, against the backdrop of ETFs, there is an outflow from some altcoins. Ethereum has been losing institutional interest for the third week in a row, with $1.4 million withdrawn from it. ProShares ETFs, a success!ProShares' Bitcoin futures exchange-traded fund, launched last week, has surpassed the $1 billion mark in assets under management. It became the fastest ETF in the history of investment products. It is also worth noting that the net asset value of the first U.S. ETF reached the $1 billion mark and came close to the ETFs based in Canada, which have been trading since February and April this year. The main difference between the two funds is that Canadian ETFs actually contain bitcoins, while U.S. ETFs only deal with bitcoin futures so far. Technique VS Foundation: it's too early to relax.While the market is showing signs of growing demand for the main cryptocurrency, things don't look so rosy on the Bitcoin chart. The local resistance level 62,637.96 has not yet been broken: Monday's breakout turned out to be false. This means that the threat of the formation of a head and shoulders reversal pattern in the range of $60,000 - $63,000 per coin has not yet passed. As noted earlier, if the recovery stops below $67,000 per coin in the coming days, the price may well return to the $60,000 support and break through, opening the way for bitcoin to $55,000 or even $52,000 per coin.
|
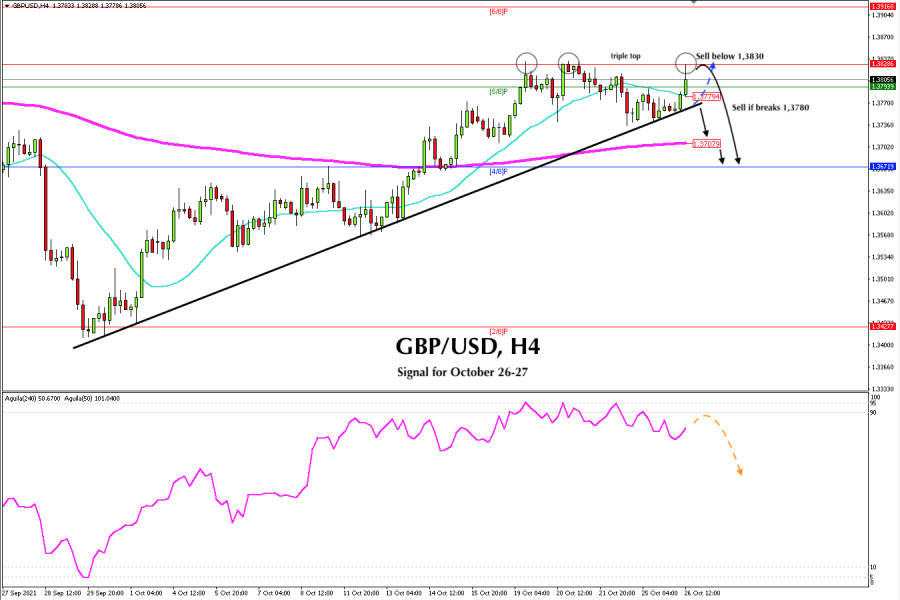
| Trading signal for GBP/USD on October 26 - 27, 2021: sell below 1.3830 (Triple top) Posted: 26 Oct 2021 07:45 AM PDT
In the European session, GBP/USD has come to test the strong resistance of 1.3828. As the pair has not been able to break it, it is now making a retracement. GBP/USD is likely to find support and make a technical bounce at the SMA of 21 around 1.3780. We can see in the 4-hours chart that the British pound is located within an uptrend channel. Yesterday it was bouncing above this channel and has gained momentum since, but it has not been enough to beat the level. of 1.3830. Therefore, a sharp break below this channel will be the start of the bearish scenario and the price could fall to 4/8 around 1.3671. Only a sharp breakout and a consolidation above 1.3830 could mean there is upside potential and GBP/USD could rally to resistance of 1.3916 where there is 6/8 of murray. As long as the pair remains above the SMA of 21 around 1.3779, there is a possibility of this scenario. On the other hand, the US dollar index #USDX is showing some strength as it is consolidating above the 200 EMA around 93.75 which prevents the British pound from gaining more momentum and can overcome the barrier of 1.3830. If the pound continues its technical correction and consolidates below 1.3779, there is a likelihood that there could be a drop to the 200 EMA and to 4/8 at 1.3671. Our forecast is bearish as we can see a triple top at the 1.3828 level. In addition to this, the eagle indicator is showing overbought signals. So, a correction is likely to happen in the coming days towards the pivot support of 1.3671 (4/8). At this level, the pound could be relieved of the upward pressure and there could be a good opportunity to buy. The market sentiment report shows 52.94% of traders who are selling the GBP / USD pair. This means that after making a technical correction, the pound could continue with an upward movement in the coming days and may reach the level of 1.3916. Support and Resistance Levels for October 26 - 27, 2021 Resistance (3) 1.3890 Resistance (2) 1.3829 Resistance (1) 1.3822 ---------------------------- Support (1) 1.3765 Support (2) 1.3739 Support (3) 1.3697 *********************************************************** A trading tip for GBP/USD for October 26 - 27, 2021 Sell below 1.3830 (triple top) with take profit at 1.3779 (SMA 21) and 1.3707 (EMA 200) as well as stop loss above 1.3865. The material has been provided by InstaForex Company - www.instaforex.com |
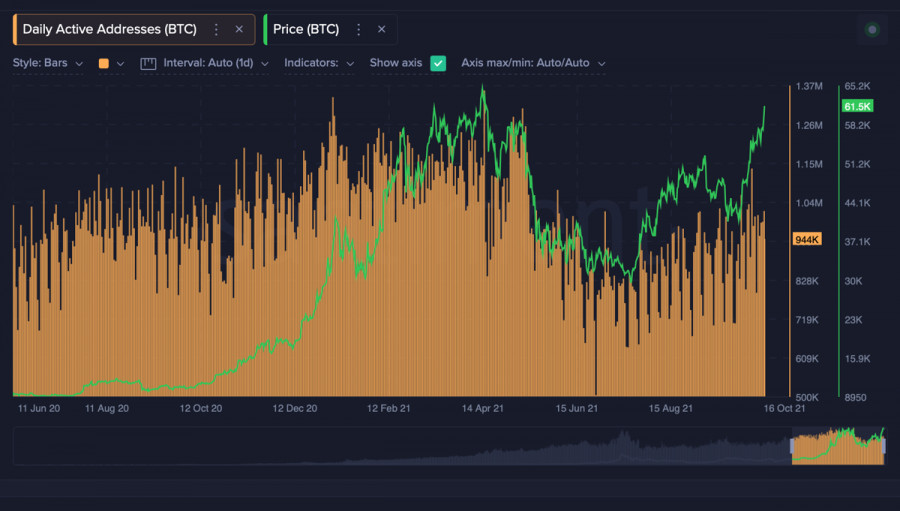
| Crypto market noted record inflows of $1.4 billion in a week; BTC approaches $64k mark Posted: 26 Oct 2021 07:24 AM PDT While bitcoin continues to recover after the recent fall provoked by local profit-taking by holders, investors continue to break all records in terms of interest in the coin. The main culprit of such a strong demand for the asset was the futures market and ETF funds. In addition, it became known that the MasterCard payment system is expanding interaction with cryptocurrencies, and Tesla can again accept digital assets as payment. Bitcoin is approaching the next stage of a bullish rally, which is supported by strong investments from institutional investors. The market is getting closer to the historical maximum of interest in BTC, thanks to which it sets a record for the inflow of investments in products based on the first cryptocurrency in one week. In the period from October 16 to 22, the inflow of investments in crypto-assets and related areas amounted to $1.47 billion. To assess the scale of investments, it is worth noting that the total amount of investments since the beginning of 2021 is about $8 billion. The previous record was set back in February when investments reached $670 million. The main source of BTC financing was ETF funds, thanks to which about $1.24 billion was raised. Other bitcoin-based funds have raised another $138 million, which is nothing compared to the performance of futures institutions. It is worth noting that the outflow of investments from ETH-based products has been maintained for the third week
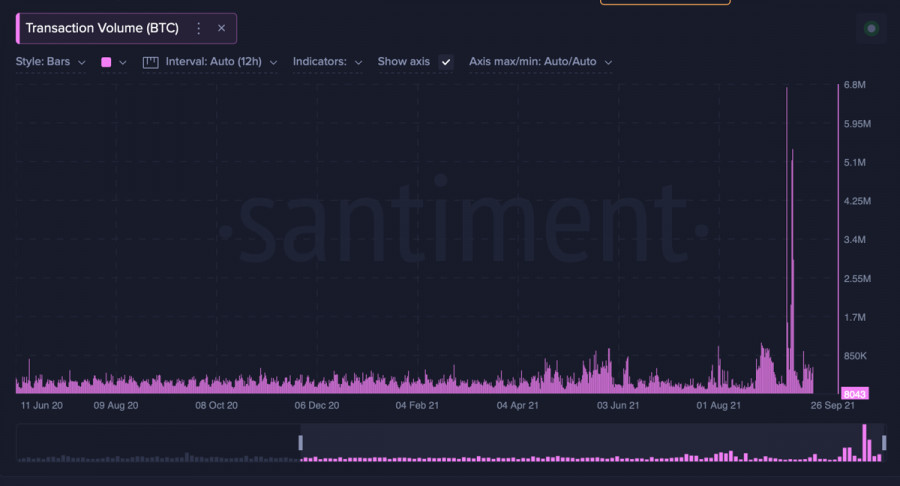
Thanks to such powerful investments, the cryptocurrency successfully gained a foothold above $63k, and the outflow of coins began to be recorded on the exchanges again, which indicates the beginning of the accumulation period. At the same time, on-chain activity remains at a high level, as evidenced by the metric of the number of unique addresses, which remains within 900,000. In addition, the total transaction volumes remain at the level of the period when the historical maximum was set, which indicates the preservation of a high level of player activity.
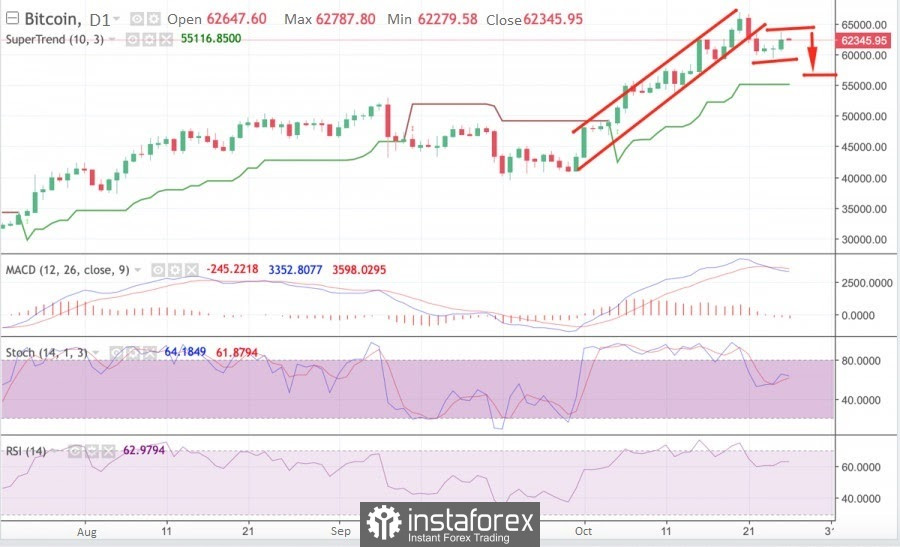
Another important announcement appeared in Tesla's reporting to the SEC, where it is said that the company considers digital assets as a means of investment and a liquid alternative to cash. Based on this, we can conclude that the automaker is preparing to resume payment for its services in cryptocurrencies, which will have a positive impact on the quotes and the marketing component of BTC. However, there were no direct statements from Elon Musk, despite the fact that more than 50% of mining has become environmentally friendly. Meanwhile, bitcoin has confidently recovered above the $63k zone and is approaching the $63.5k mark, where the sales zone passes. Despite the formation of a bullish candle on the daily chart and a confident movement above the supertrend line, the technical indicators of the coin continue to fluctuate. The MACD indicator formed a bearish intersection and began to decline, but again pushed off near the zero mark and may begin an upward movement. Similar fluctuations are also demonstrated by the stochastic oscillator, which completed a bearish intersection, but also pushed off and began to grow, after which it decreases again and is close to another downward spurt. At the same time, the relative strength index moves flat, which indicates a consistently high interest in purchases. In general, the situation is conducive to a slowdown in the bullish trend and a gradual decline in the main indicators. Despite attempts to develop an upward momentum, there is no strong buyer in the market, and therefore the volumes of bears continue to put pressure on the price. In the near future, the price will fluctuate with a shift to the lower limit of the current range, but the fall will worsen when it goes beyond $62.5-$63.3k. Then we should expect a rebound in the area of $59.7k-$60.5k, but if the quotes continue to fall, the $56.6k line may become the key reversal zone.
|
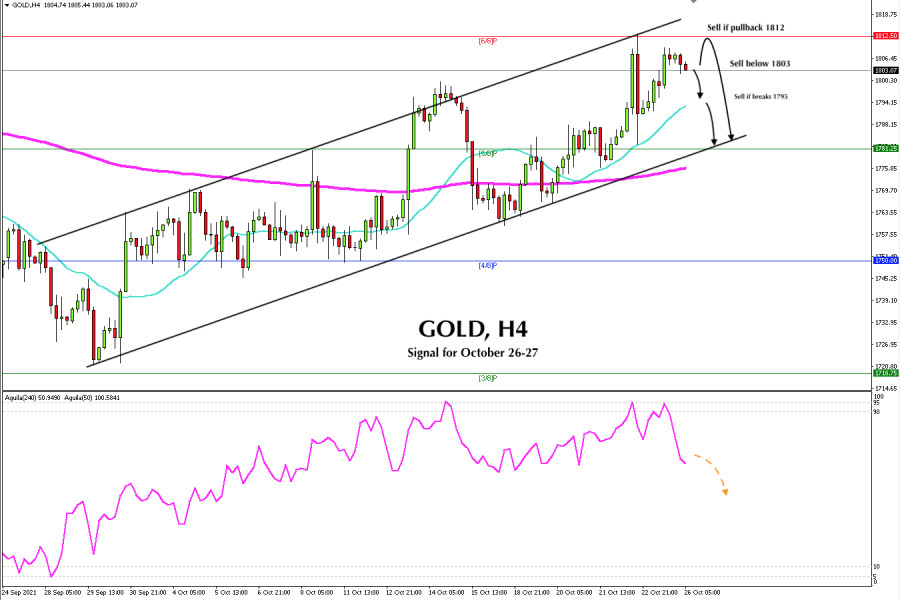
| Trading signal for GOLD on October 26 - 27, 2021: sell below $1,803 (overbought) Posted: 26 Oct 2021 06:37 AM PDT
Gold is trading below the strong 6/8 murray resistance located at 1,812, after having bounced off the 21 SMA on Friday. The bullish power is ebbing away. Judging by the last 4-hour candle, the metal has failed to reach the 1,812 resistance, confirming that there could be a correction in the next few hours to the 21 SMA located at 1,794. Yesterday, gold rose to 1,809 due to the decline in the yields of Treasury bonds. This makes investors take refuge in commodities. The 10-year benchmark rate for the US bond is at 1.61%, away from 1.70% for now. In addition, gold is benefitting from the weakness of the US dollar. Its index is now consolidating above the 200 EMA around 93.60. According to the 4-hour chart, we can see that gold remains within an uptrend channel. This means that any retracement could be an opportunity to continue buying. The immediate level where we can expect a technical rebound is the 21 SMA located at 1,794. That level suggests a good buying opportunity. On the other hand, we can also observe that the eagle indicator has reached the level of 95. This means that an imminent correction could occur in the next few hours. Therefore, it would be a good opportunity to sell at the current levels of $1,803. Alternatively, if gold makes a pullback towards 1,812, it will be a good selling point also given that there is the resistance of 6/8 murray. Our strategy in the next few hours is to sell because gold is at the overbought levels. This would mean that we have the opportunity to sell as long as gold remains below 1,812. We can place a take profit at 21-SMA and 5/8 of murray around 1,781. Medium-term outlook remains bullish for gold as it sits on 4-hour charts above the 200-day moving average (1,770), meaning that any bounce around this level will be considered a good point to continue buying. In addition to this, if gold breaks above 1,812 and consolidates above this level, it will be a sign that the bullish trend prevails and could rise to 7/8 at 1,843. Support and Resistance Levels for October 26 - 27, 2021 Resistance (3) 1,820 Resistance (2) 1,812 Resistance (1) 1,803 ---------------------------- Support (1) 1,796 Support (2) 1,788 Support (3) 1,781 *********************************************************** A trading tip for GOLD for October 26 - 27, 2021 Sell below 1,803 (SMA 21) with take profit at 1,795 (SMA 21) and 1,781 stop loss above 1,812. The material has been provided by InstaForex Company - www.instaforex.com |
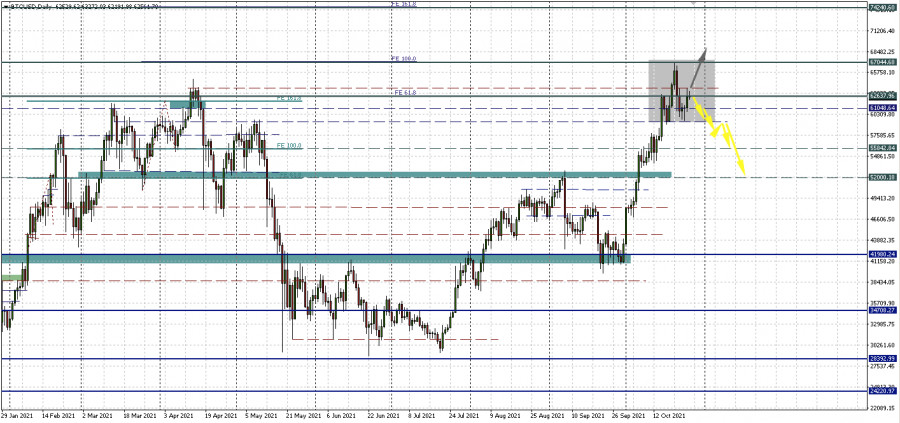
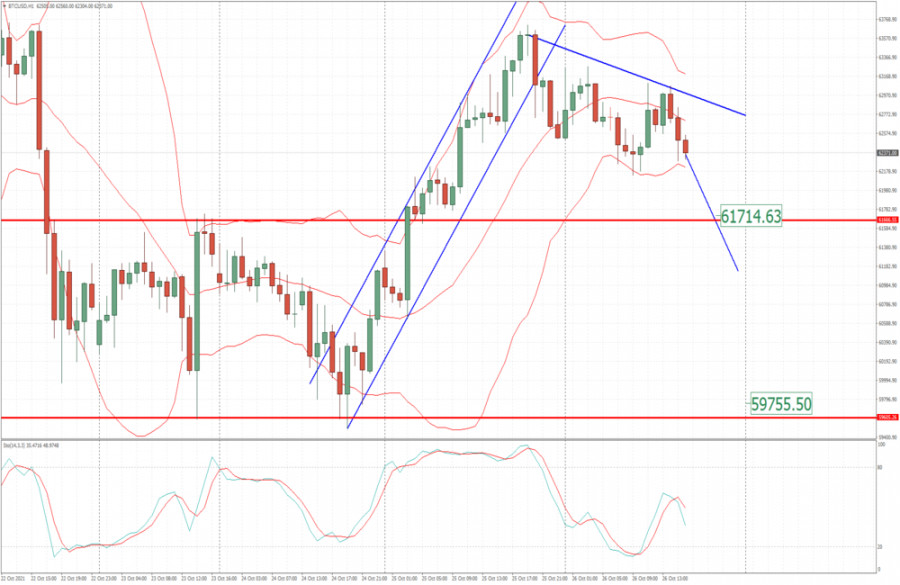
| BTC analysis for October 26,.2021 - Potential for drop towards $61.720 Posted: 26 Oct 2021 06:20 AM PDT Technical analysis:
BTC has been trading downside in last few hours and I see that there is the breakout of the well defined rising channel in the background, which is good sign for the potential downside movement. Trading recommendation: Due to the breakout of the rising channel and the lower highs in past 24 hours, I see potential for fuhrer drop. Watch for selling opportunities with the downside targets at $61,720 and $59,755 There is fresh bear cross on the oscillator, which is another confirmation for the downside movement. Key resistance is set at $63,700 The material has been provided by InstaForex Company - www.instaforex.com |
| US stock indicators hit all-time highs Posted: 26 Oct 2021 06:20 AM PDT
US stock indicators are hitting all-time highs at the close of trading on Monday. The broad S&P 500 gained 0.5% and climbed to 4,566.48 points, the DJIA industrial added 0.2% to 35,741.15 points and the NASDAQ Composite rose by 0.9% to 15,226.71 points. Markets' optimism was bolstered by positive financial reports from banks and other companies that released their results for the third quarter last week. Investors are anxiously awaiting the reports of high-tech companies to be released this week. These companies make up about 30% of the S&P 500 indicator. Facebook has already issued its report, which has had a positive impact on the company's stock price. Microsoft, Twitter, Alphabet, Apple and Amazon will publish reports later this week. Analysts predicted that technology companies are more likely to show a strong record for the last quarter. At the same time, Snap's disappointing results and pessimistic forecasts, given after Apple tightened its privacy policy, will eventually affect Snap's sales, which could have a negative impact on other tech companies. If the major companies' outlooks do not turn out to be optimistic, investors could be deeply worried. Moreover, investors consider global central banks' reaction to growing prices a key factor. According to the government bond market, investors believe that the UK Central Bank plans to increase interest rates as early as next month. Traders also expect data from the ECB and the Bank of Japan. Besides, their meetings are scheduled for the current week. The US Federal Reserve informed of a potential rate hike in 2022. The US Parliament members are actively debating a bill on a major social spending program. According to analysts, it will continue to stimulate economic growth. However, it is not clear how these expenses will be financed. Amid PayPal's refutation of information about the future deal to buy the company Pinterest, the securities of the former rose by 2.7% and the latter dropped by 13%. Kimberly-Clark stocks decreased by 2.2% due to the fact that the company worsened its profit forecast for the current fiscal year. Tesla's shares gained 13% due to strong growth and exceeding the company's $1 trillion value. Besides, it was reported that Hertz Global Holdings Inc. made a bulk order for a large batch of Tesla cars (in the amount of 100,000 units). The profitability of 10-year US Treasury bonds declined to 1.634%. Brent crude oil rose by 0.5% to a 3-year high of $85.99 a barrel. The material has been provided by InstaForex Company - www.instaforex.com |
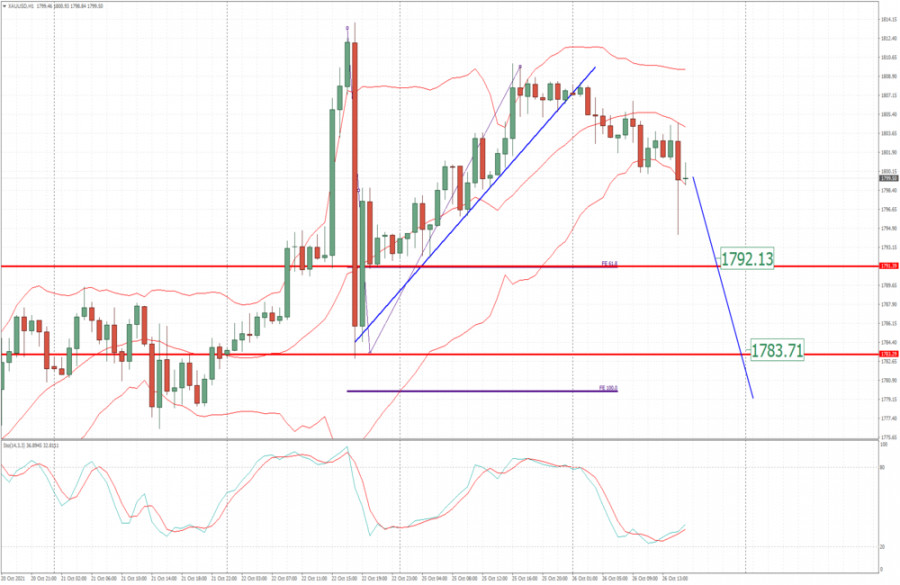
| Analysis of Gold for October 26,.2021 - Breakout of the rising trendline Posted: 26 Oct 2021 06:12 AM PDT Technical analysis:
Gold has been trading downside as I expected. There is the breakout of the rising trend line in the background. Trading recommendation: Due to the breakout of the rising trend line in the background, I see potential for the downside movement towards the downside references. Watch for selling opportunities on the rallies with the downside targets at $1,792 and $1,783. There is the massive supply in the background and major resistance is set at $1,814 The material has been provided by InstaForex Company - www.instaforex.com |
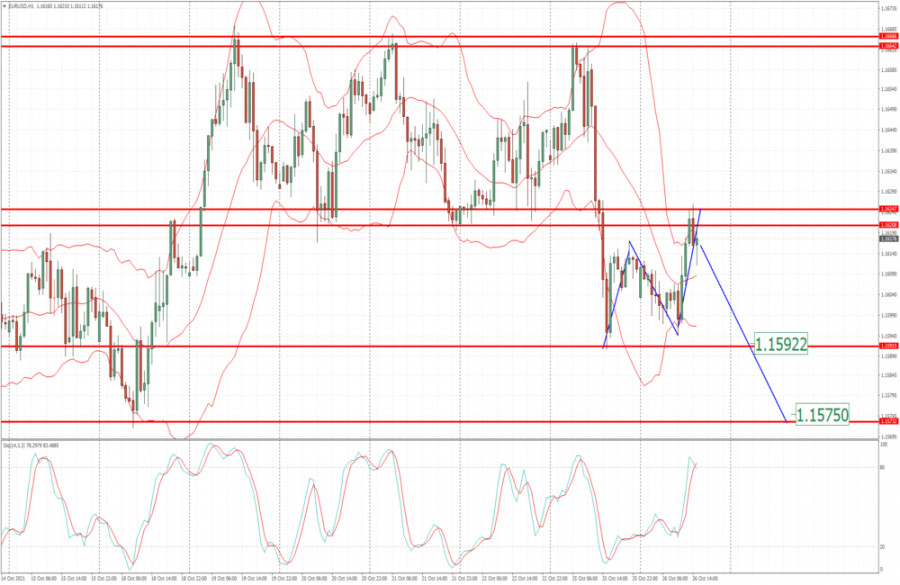
| EUR/USD analysis for October 26, 2021 - Potetnial for the downside continuation Posted: 26 Oct 2021 06:08 AM PDT Technical analysis:
EUR/USD has been trading upside this morning but I see potential for the downside continuation. Trading recommendation: Due to the breakout of the balance in the background and test of major resistance at 1,1625m I see potential for the downside continuation. Watch for selling opportunities with the downside targets at 1,1592 and 1,1575 Stochastic is showing fresh bear cross, which is another sign and confirmation for the downside rotation. Additionally, there is completion of the ABC upside correction in the background The material has been provided by InstaForex Company - www.instaforex.com |
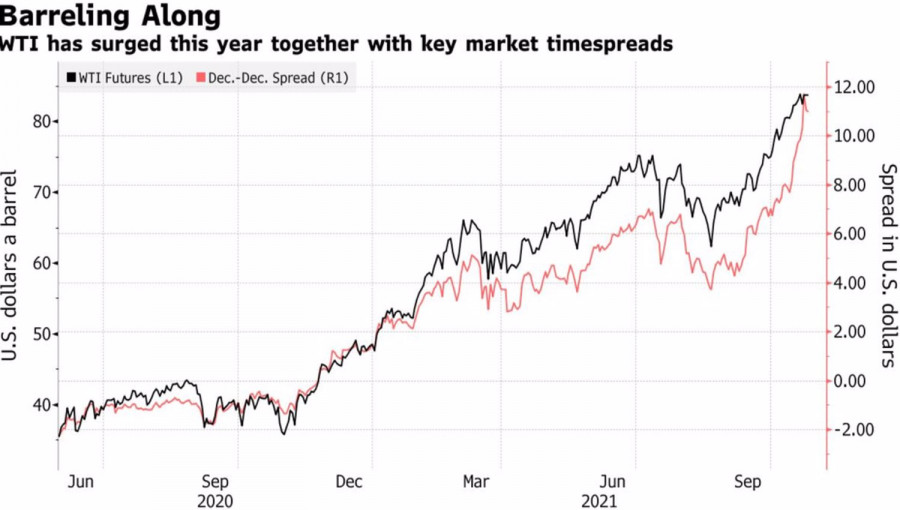
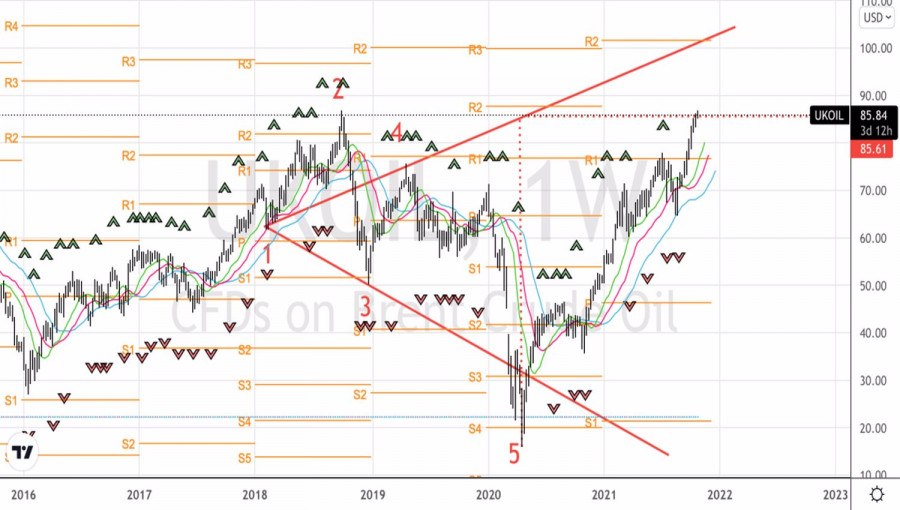
| Posted: 26 Oct 2021 06:06 AM PDT Booming demand and extremely slow recovering supply after the global recession. What could be better for Brent and WTI bulls? Quotes of the Texas grade have rewritten the 7-year high, the North Sea variety is ready to renew the 3-year and head to the peak levels since 2014. Buyers dominate the market, and the slightest pullbacks are immediately used by traders to form longs. According to banks and investment companies, the upward trend in oil is not going to reverse. Goldman Sachs claims that this year, the global demand for black gold will reach the levels that took place before the pandemic, and is ready to raise its forecast for Brent for 2022 in this regard, which already looks rather big – $ 90 per barrel. According to the authoritative company, the energy crisis contributed to the rally of Brent and WTI, which led to an increase in world oil consumption by at least 1 million b/d. BlackRock's stance looks even more aggressive. The world's largest asset manager believes that environmental policies have led to energy inflation. At the same time, insufficient investment in production will restrain the supply recovery process, which may lead to an increase in Brent to $100 per barrel. Not surprisingly, against the backdrop of such bullish comments from the largest players, backwardation in the oil market is constantly expanding. This circumstance fuels speculative demand and contributes to further growth in oil prices. Dynamics of WTI and "bullish" oil spreads
The correction in Brent and WTI could be provoked by a more aggressive OPEC+ policy towards increasing production. But the leaders of the Alliance are signaling that they are in no hurry to do so. Russia expects that at the summit of the cartel and other producer countries on November 4, production will be increased by 400,000 b/d, as planned. Saudi Arabia has warned against excessive supply increases as it believes COVID-19 may still return. Caution in this case is a sign of slowness, which is good news for the Texas and North Sea bulls. The bears associate certain hopes for oil with the negotiations between the EU and Iran. In response to restrictions on Tehran's nuclear program, Brussels could lift its restrictions, which would increase oil exports from the Middle Eastern country and could provoke a counterattack by sellers. However, it is not yet known exactly how the dialogue will end. Optimists believe that while the parties are talking, the chances of a deal remain. Thus, global demand is growing by leaps and bounds, including due to the energy crisis, and supply is not keeping up with it. As a result, there is no reason to doubt the strength of the upward trend. Technically, on the Brent weekly chart, prices reached the first target for the Wolfe Wave pattern near $86 per barrel. This circumstance increases the risks of a rollback. Nevertheless, the correction should be used to buy towards the next target of $102 per barrel. Brent, Weekly chart
|
| Video market update for October 26,2021 Posted: 26 Oct 2021 05:55 AM PDT Watch for continuational patterns on JPY The material has been provided by InstaForex Company - www.instaforex.com |
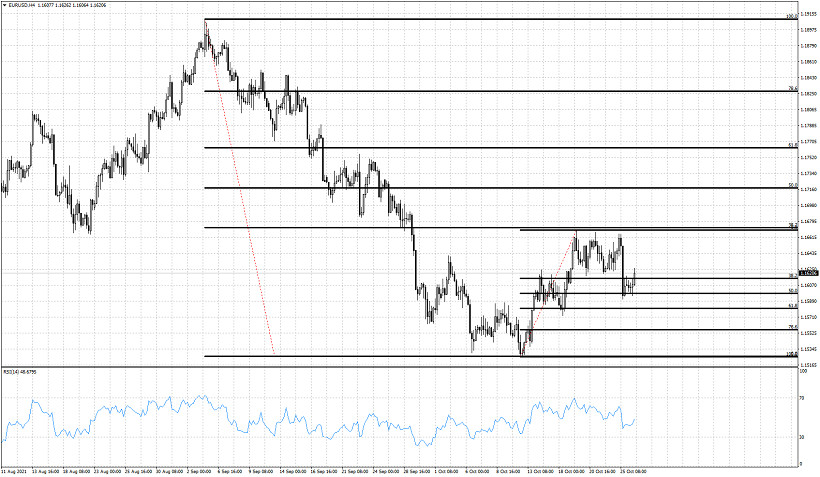
| Posted: 26 Oct 2021 05:34 AM PDT EURUSD is trading at 1.1615 having made a low yesterday at 1.1591 just below the 50% Fibonacci retracement of the recent upward move from 1.1525. Resistance at 1.1670 remains key, where we saw price make a triple top. This is also the major 38% Fibonacci retracement level of the decline from 1.1910.
Black lines - Fibonacci retracement levels EURUSD is bouncing off the 1.1590 low where we find the 50% retracement. Breaking below 1.1590 will open the way for a move lower towards the next two Fibonacci retracement levels at 1.1580 and 1.1555. Bulls need to break the triple top resistance at 1.1670 in order for bulls to move higher towards 1.1717. The material has been provided by InstaForex Company - www.instaforex.com |
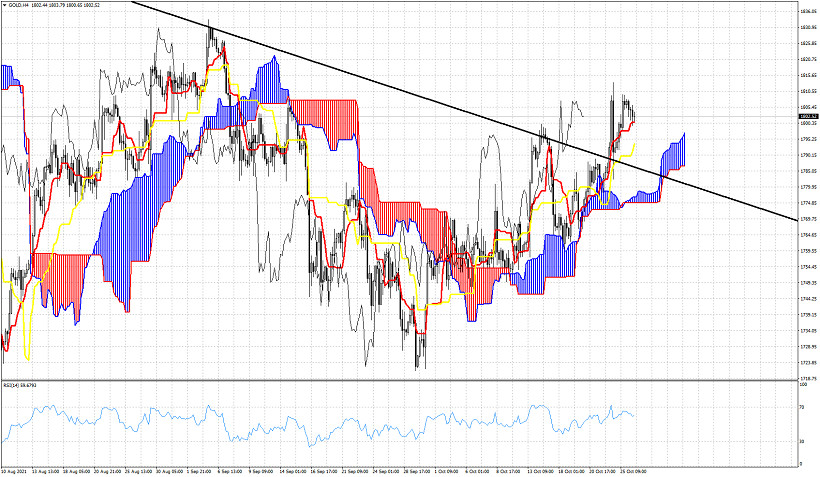
| Ichimoku cloud indicator analysis on Gold for October 26, 2021. Posted: 26 Oct 2021 05:30 AM PDT Gold price is trading around $1,800. Gold price has broken above the key downward sloping resistance trend and is now trading above the 4 hour Kumo resistance. Price is also above both the tenkan-sen and kijun-sen indicators.
Support by the tenkan-sen (red line indicator) is at $1,800 and a 4 hour candlestick close below this level will put pressure on price and will most probably move lower towards the kijun-sen (yellow line indicator) at $1,793. The Kumo (cloud) provides the final support at $1,778. As long as price is above the cloud bulls remain in control of the trend. Price is making higher highs and higher lows. A pull back towards the $1,793 kijun-sen and the black trend line at $1,786 as a back test is justified and can not be ruled out. The material has been provided by InstaForex Company - www.instaforex.com |
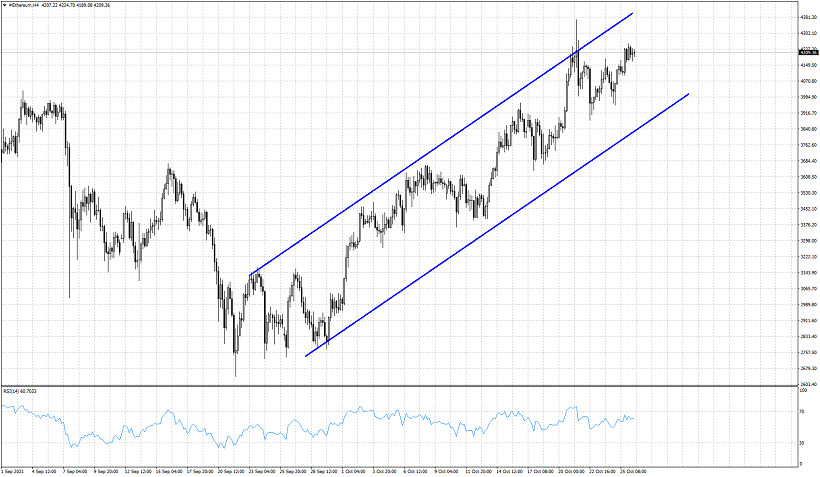
| Short-term analysis on Ethereum. Posted: 26 Oct 2021 05:25 AM PDT Ethereum continues making higher highs and higher lows. Price remains inside the bullish channel it is in since mid September. Price has reached previous all time highs around $4,200. There is a warning signal by the RSI as the price does not make new highs as the Ethereum price does.
Support is found at $4,100 and next at $3,850. The lower channel boundary is at $3,850. Bulls will remain in control of the trend as long as this level remains intact. So far there is no sign of a reversal. Only a warning that the bullish trend is weakening. This should be considered seriously and traders should be prepared for a reversal. The material has been provided by InstaForex Company - www.instaforex.com |
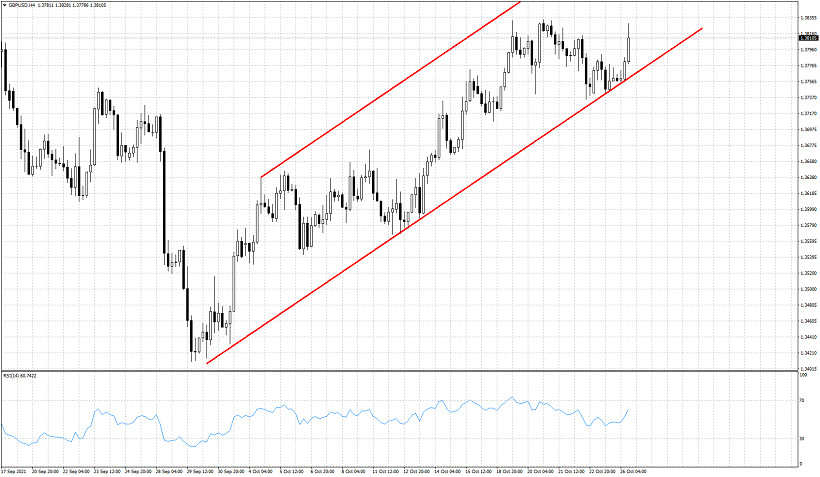
| GBPUSD bulls remain in control of the trend. Posted: 26 Oct 2021 05:21 AM PDT As expected by our analysis, GBPUSD pulled back towards the channel support and lower boundary. Bulls managed to defend the lower channel boundary and produced a new upward move that is close to providing new higher highs above 1.3830.
As we mentioned in our previous analysis, holding inside the channel could lead to another push higher. So far bulls remain in control of the trend as price continues to respect the channel boundaries. Price has potential of making higher highs above 1.3830 and it is important to keep a close eye on the RSI and see if it provides a new bearish divergence. Support at 1.3755 is key and breaking below it would provide a bearish signal. The material has been provided by InstaForex Company - www.instaforex.com |
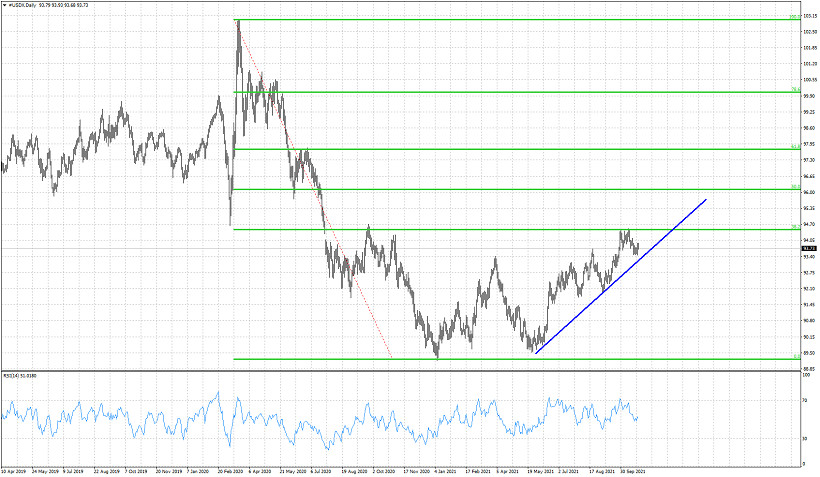
| Short-term analysis on the Dollar index. Posted: 26 Oct 2021 05:16 AM PDT The Dollar index remains in a short-term bullish trend despite the recent pull back. Price reached 94.50 area where we find important Fibonacci resistance. Price got rejected and turned lower towards the short-term support trend line.
Blue line- support trend line The Dollar index so far respects the upward sloping blue trend line, Price has so far reached the 38% Fibonacci retracement and first important resistance. As long as price holds above the blue support trend line, bulls are in control of the trend trying to break above the recent highs. If the recent high is broken upwards and the RSI provides a new higher high, then we have good news for bulls as this would be a positive sign. The material has been provided by InstaForex Company - www.instaforex.com |
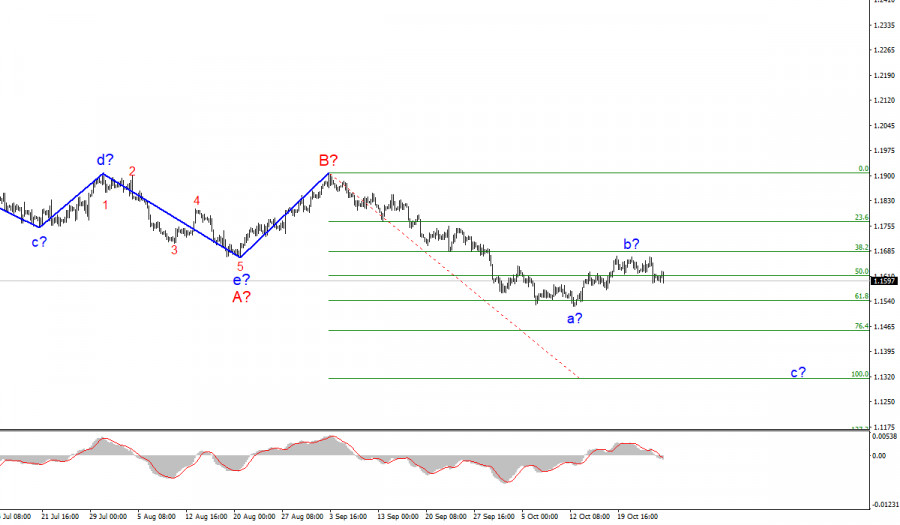
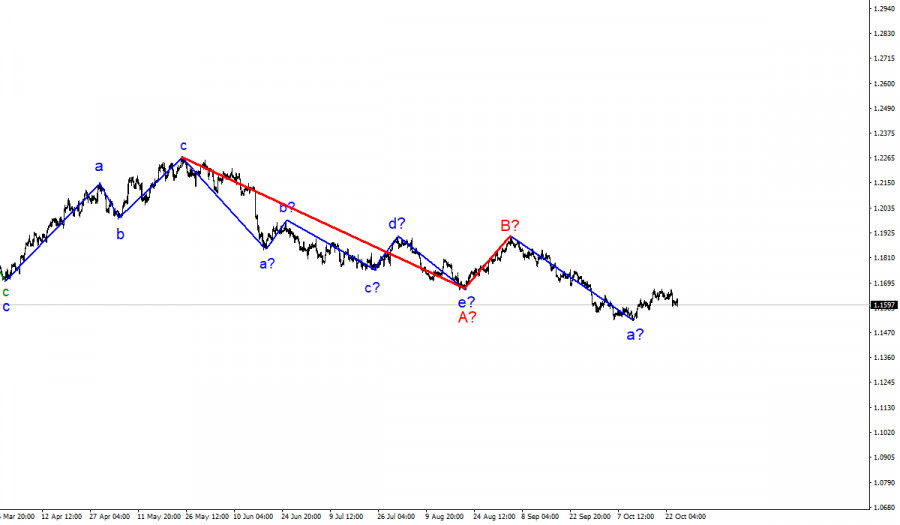
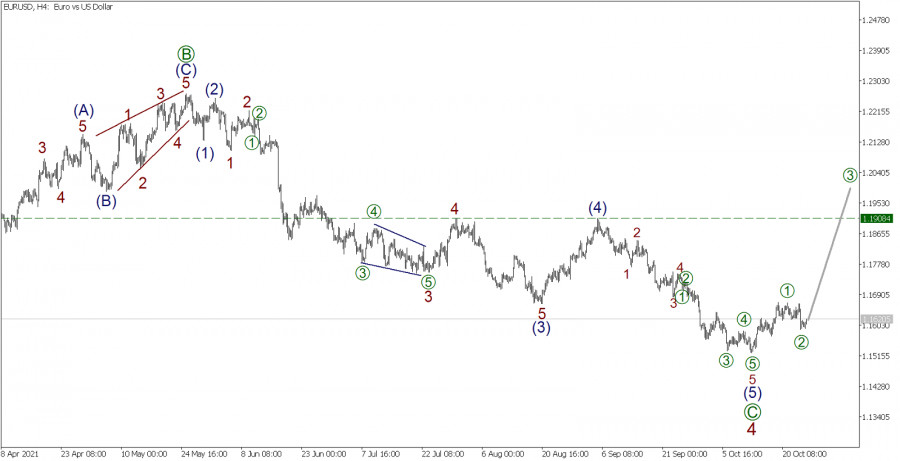
| Wave analysis of EUR/USD for October 26, 2021 Posted: 26 Oct 2021 04:46 AM PDT EURUSD, H4:
The market is assumed to be at the beginning of a major upward trend. Presumably, the formation of corrective wave 4 was completed, which took the form of a simple wave plane [A]-[B]-[C]. Wave [C] of this plane is a bearish impulse consisting of waves (1)-(2)-(3)-(4)-(5). After the completion of the development of the last part of the impulse wave [C], that is, the bearish impulse (5), we saw the market reversal and the beginning of a new bullish wave. Within this bullish wave, waves 1-2 and waves [1]-[2] of a lower wave level were built. Likely, the market will soon rise in a new bullish impulse of a smaller wave level to the target area of 1.1908 and above, which is formed by sub-waves [1]-[2]-[3]-[4]-[5]. Thus, in the current situation, it is possible to open long positions from the current level with the target at 1.1908. The US CB consumer confidence index is set to be released at 14:00 UTC today. The second news, which will be released at the same time, is the sale of new housing in the United States, which will help analyze the economy of the country as a whole. Trading solutions: Buy from the current level. Take profit at 1.1908. The material has been provided by InstaForex Company - www.instaforex.com |


| You are subscribed to email updates from Forex analysis review. To stop receiving these emails, you may unsubscribe now. | Email delivery powered by Google |
| Google, 1600 Amphitheatre Parkway, Mountain View, CA 94043, United States | |


Comments