Forex analysis review
Forex analysis review |
- Overview of the GBP/USD pair. November 1. Two meetings of central banks may end with serious movements of the pound/dollar
- Overview of the EUR/USD pair. November 1. The Fed meeting may keep traders in the foreign exchange market
- Weekly EURUSD analysis.
- Ichimoku cloud indicator analysis on Gold for October 31, 2021.
- Weekly Gold analysis.
- How to trade GBP/USD on November 1? Simple tips for beginners. The pound also fell into the abyss on Friday
- How to trade EUR/USD on November 1?. Simple tips for beginners. Unexpected collapse in the market on Friday
- Short-term technical view on GBPUSD.
- Short-term analysis on Bitcoin.
- Short-term XRPUSD analysis.
- Cardano breaks triangle pattern to the downside.
- Trading plan for the GBP/USD pair for the week of November 1-5. New COT (Commitments of Traders) report. The pound is about
- Trading plan for the EUR/USD pair for the week of November 1-5. New COT (Commitments of Traders) report. Crazy movements
| Posted: 31 Oct 2021 06:04 PM PDT 4-hour timeframe
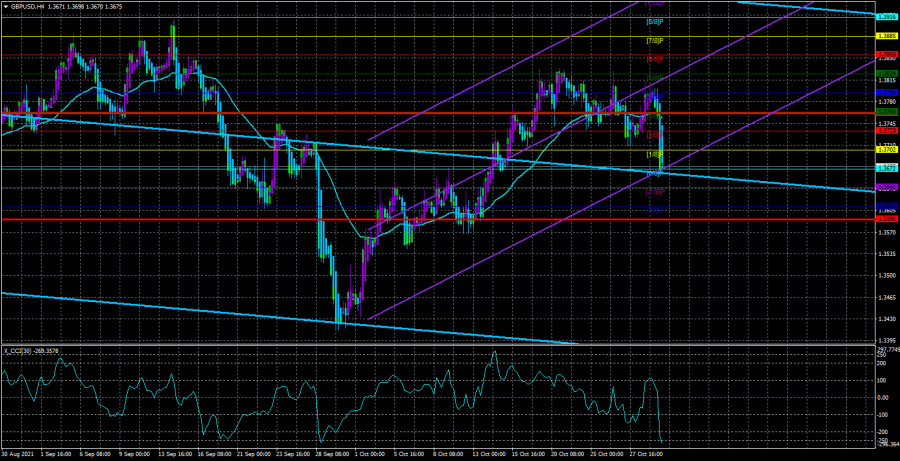
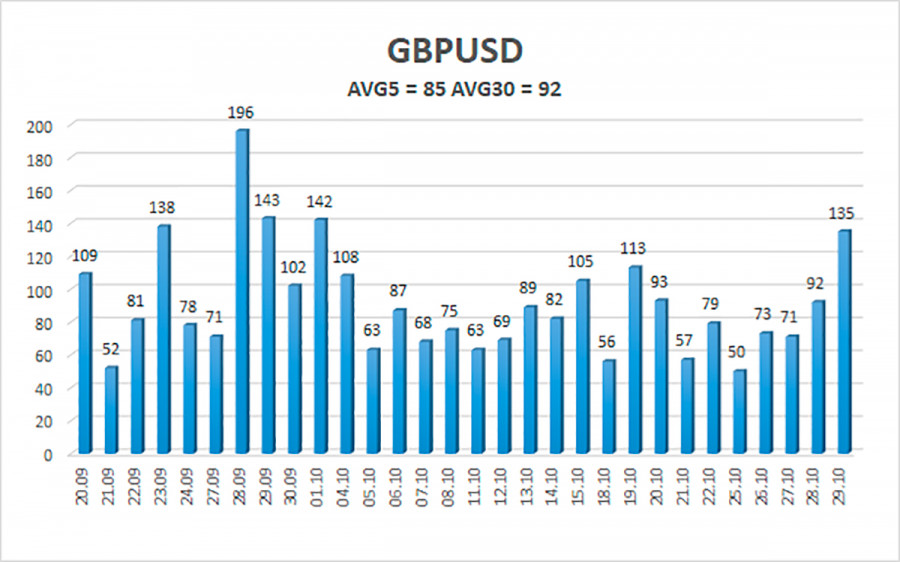
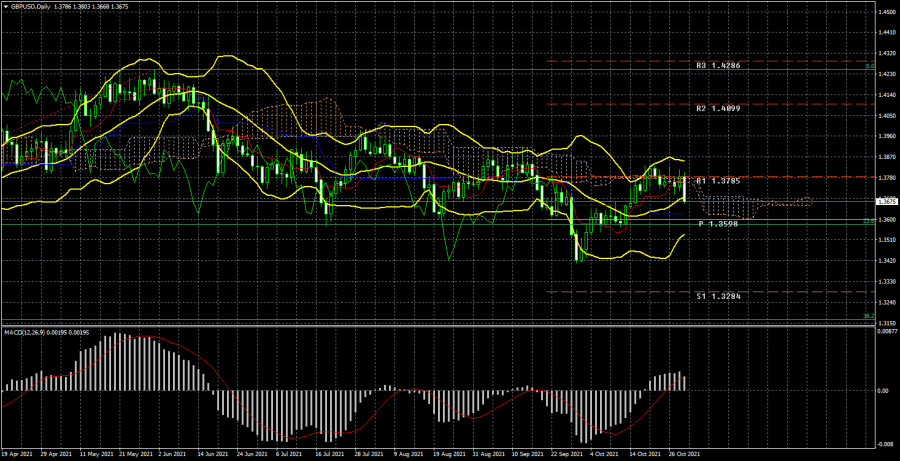
Technical details: Higher linear regression channel: direction - downward. Lower linear regression channel: direction - upward. Moving average (20; smoothed) - downward. The GBP/USD currency pair also collapsed on Friday, as did the EUR/USD pair. And since there were no macroeconomic statistics in the UK, we conclude that both pairs fell heavily not based on any statistics or "foundation". For the British currency, this fall even looked relatively logical, since it has been growing in recent weeks and therefore the time is ripe for a downward correction. In general, the pound continues to trade as confusing as possible. Especially if you look at the 24-hour timeframe. After the price failed to overcome the Senkou Span B line on the daily TF (which we talked about at the weekend), the chances of a resumption of the downward trend increased sharply. At the same time, there are still a few fundamental reasons for the US currency to grow. On the 4-hour timeframe of the Linear Regression Channels system, the quotes once again fell below the moving average line, so the trend has now changed to a downward one. However, it is far from a fact that a strong downward movement will now continue. Or at least the usual downward movement will continue. So far, the whole movement at the end of last week looks like an ordinary accident. It seems that traders lost their nerves, so we saw fairly high volatility. However, as follows from the illustration below, the volatility of the pound for these two days was 92 and 135 points, which is not so much for it. The new week promises to be interesting. Especially for the pound/dollar pair. The new week will be extremely important for the pound and the dollar. At least because it will host two meetings of central banks at once: the Fed and the Bank of England. Is it worth talking about the importance of these meetings at present? The ECB meeting last week, without any important decisions taken, provoked a strong growth of the euro. The same thing could happen this week. The trading week will start rather boring. In the UK and the States, only indices of business activity in the manufacturing sectors will be published on Monday. On Tuesday, there will not be a single macroeconomic report at all that could attract the attention of traders. But on Wednesday, the index of business activity for the services sector will be released in Britain, and the ADP report on changes in the number of employees in the private sector, the indices of business activity in the services sector according to Markit and ISM will be published in the States, and the results of the Fed meeting will be summed up in the evening. As we have already said, the key issue for the Fed will be the question of curtailing the quantitative stimulus program. And on Thursday, the results of the meeting of the Bank of England will be summed up, which also raises the issue of stimulating the economy and its completion. Recall that at the last meetings, two members of the monetary committee out of nine voted in favor of curtailing QE. If there are more of them this time, then the pound may receive tangible support. Well, on Friday, NonFarm Payrolls, a report on unemployment and wages in the United States for October, will also be published. Thus, the last three days of the week are extremely important and volatility on these days can be very high. At the same time, it makes no sense at all to predict the possible movement of the pair for the new week. There are too many important reports and events, the outcome of which is impossible to predict. Therefore, you will have to react as information becomes available to traders. Consequently, the pair's movement this week can be almost anything. In the first two days, it will be important to understand whether the surge of emotions at the end of last week is an accident or not. And already on Wednesday, the most important data will begin to arrive, which will need to be worked out.
The average volatility of the GBP/USD pair is currently 85 points per day. For the pound/dollar pair, this value is "average". On Monday, November 1, we expect movement inside the channel, limited by the levels of 1.3590 and 1.3760. A reversal of the Heiken Ashi indicator upwards will signal a round of corrective movement. Nearest support levels: S1 – 1.3672 S2 – 1.3641 S3 – 1.3611 Nearest resistance levels: R1 – 1.3702 R2 – 1.3733 R3 – 1.3763 Trading recommendations: The GBP/USD pair on the 4-hour timeframe was fixed below the moving average, so the trend changed back to a downward one. Thus, at this time, it is necessary to keep open short positions with the targets of 1.3641 and 1.3611 levels until the Heiken Ashi indicator turns upwards. Buy orders can be considered again if the price is fixed above the moving average line with targets of 1.3794 and 1.3824 and keep them open until the Heiken Ashi turns down. Explanations to the illustrations: Linear regression channels - help determine the current trend. If both are directed in the same direction, then the trend is strong now. Moving average line (settings 20.0, smoothed) - determines the short-term trend and the direction in which to trade now. Murray levels - target levels for movements and corrections. Volatility levels (red lines) - the likely price channel in which the pair will spend the next day, based on current volatility indicators. CCI indicator - its entry into the oversold area (below -250) or into the overbought area (above +250) means that a trend reversal in the opposite direction is approaching. The material has been provided by InstaForex Company - www.instaforex.com |
| Posted: 31 Oct 2021 06:04 PM PDT 4-hour timeframe
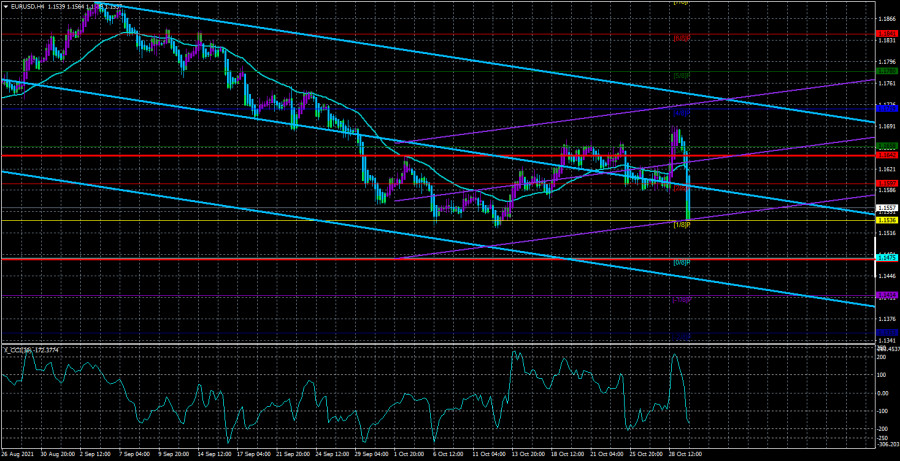
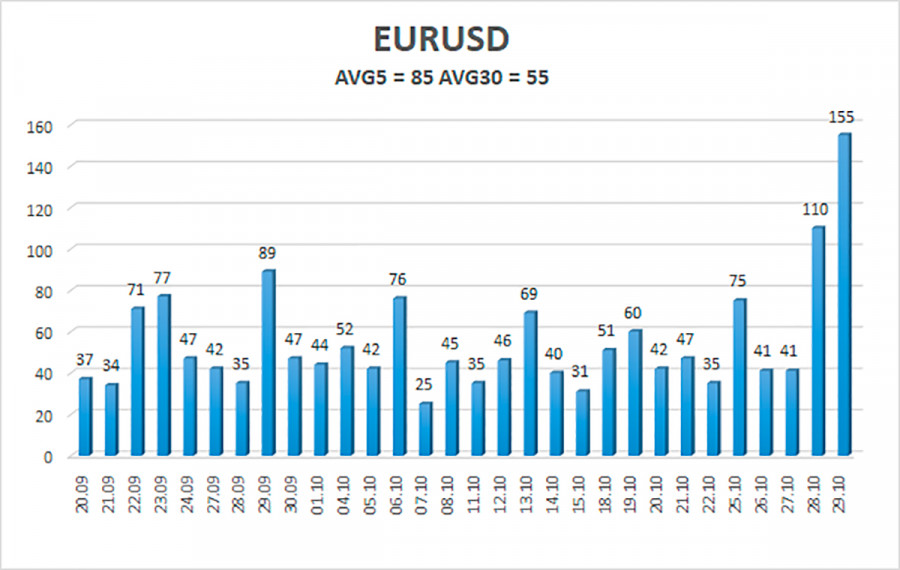
Technical details: Higher linear regression channel: direction - downward. Lower linear regression channel: direction - upward. Moving average (20; smoothed) - downward. The EUR/USD currency pair traded extremely volatile on Friday. We have already said in our previous articles that the currency pair has set a volatility record for the last 3-4 months for sure, and maybe even more. The illustration below clearly shows how the volatility of the last two trading days does not correspond to the overall picture. And if on Thursday such volatility was due to a really strong fundamental and macroeconomic background, then on Friday, the situation was radically opposite. In the European Union, data on inflation and GDP were published. However, they were just ignored by the markets, and the main fall of the pair occurred during the American trading session when there were no important events. Thus, Friday so far does not fit into the understanding of what is happening. We would even recommend watching the developments in the market for a few days, because if traders found reasons for such strong dollar purchases when there was no reason for it, then what will happen next? We have repeatedly said that the "foundation" can now provide only local support to the US currency. All recent reports have turned out to be weak, and the Fed has real prospects for postponing a decision on curtailing the QE program for December. Therefore, now the dollar should be getting cheaper, not more expensive. Thus, the only reason for the strengthening of the US currency may be "technical long-term". On the 24-hour TF, the pair is still correcting against the upward trend that began a year and a half ago. Therefore, the upward trend may resume at any moment, but for now, it is still a correction, which for the euro has been going on for almost 10 months. Preview of the new week. What does the new week have in store for us? Everything will be exceptionally quiet and peaceful in the European Union. The ECB meeting has already been left behind, and in any case, the markets do not pay much attention to macroeconomic reports. Thus, formally, the markets may pay attention to the index of business activity in the manufacturing sector on Tuesday, the unemployment rate on Wednesday, the index of business activity in the services sector and the economic forecast from the European Commission on Thursday, and the change in retail trade volumes on Friday. However, all these data have little chance of affecting the movement of the currency pair. At least, you definitely shouldn't expect such a movement as on Thursday or Friday. Consequently, the reaction of the markets to these events may be in the range of 10-20 points at best. However, a lot will now depend on the volatility indicator. We have already said earlier that the pair has been moving with reduced volatility in recent months. The normal value of this indicator for the euro is 60-80 points per day. Thus, it is now important to understand whether the euro/dollar pair intends to return to its normal activity indicators or is the last two trading days a pure accident? In the first case, everything changes dramatically. The pair can start moving again so that it can be traded every day, and there will be plenty of trading signals. In the second case, everything will return to normal and we will again wait for one signal in the intraday trading system for two or three days or receive a whole scattering of false ones, and in the Linear Regression Channels system, we will need to keep transactions open for 3-4 days to earn at least something. In the first case, it does not matter at all what the macroeconomic statistics will be during the week, since the maximum that awaits traders is a dozen reaction points. But, of course, the main event of the week – the Fed meeting – should not be overlooked. We will talk about it in more detail in the GBP/USD review. Here I would like to add that, in principle, now the attention of traders is directed to the States and the Fed. It is very difficult to assume what will happen on the market this Wednesday. It is impossible to predict what decision the Fed will make. It is especially difficult to talk about the possible movement of the pair after what we saw on Thursday and Friday. Thus, the main thing is caution. Do not forget about Stop Loss orders.
The volatility of the euro/dollar currency pair as of November 1 is 85 points and is characterized as "high". Thus, we expect the pair to move today between the levels of 1.1472 and 1.1642. The upward reversal of the Heiken Ashi indicator will signal a round of upward correction after Friday's fall. Nearest support levels: S1 – 1.1536 S2 – 1.1475 S3 – 1.1414 Nearest resistance levels: R1 – 1.1597 R2 – 1.1658 R3 – 1.1719 Trading recommendations: The EUR/USD pair has consolidated back below the moving average line, so the trend has changed to a downward one. Thus, today, it is possible to stay in short positions with a target of 1.1475 until the Heiken Ashi indicator turns up. Purchases of the pair should be considered if the price is fixed back above the moving average with targets of 1.1642 and 1.1658 and keep these trades open until the Heiken Ashi indicator turns down. Explanations to the illustrations: Linear regression channels - help determine the current trend. If both are directed in the same direction, then the trend is strong now. Moving average line (settings 20.0, smoothed) - determines the short-term trend and the direction in which to trade now. Murray levels - target levels for movements and corrections. Volatility levels (red lines) - the likely price channel in which the pair will spend the next day, based on current volatility indicators. CCI indicator - its entry into the oversold area (below -250) or into the overbought area (above +250) means that a trend reversal in the opposite direction is approaching. The material has been provided by InstaForex Company - www.instaforex.com |
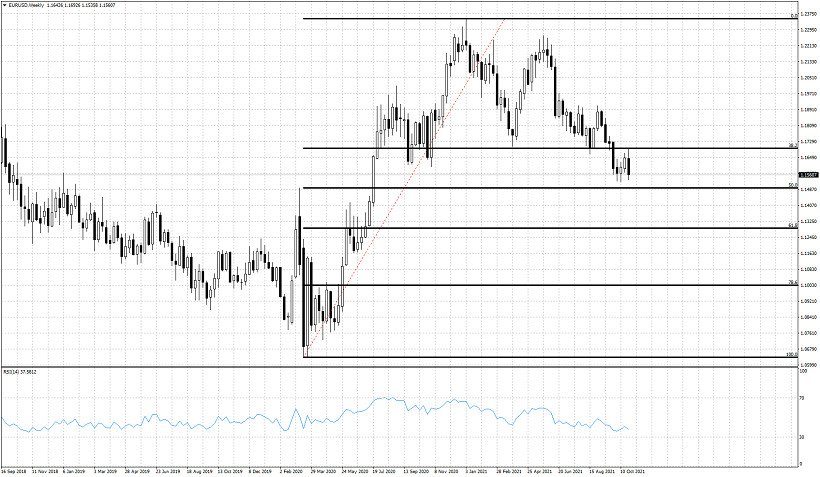
| Posted: 31 Oct 2021 02:35 PM PDT Last week was a roller coaster for EURUSD. Price started under pressure and fell as low as 1.1585. A strong upward move followed that pushed price above the triple top resistance area at 1.1670. Price reached 1.17 but bears took over and pushed price lower towards 1.1560 where we ended for the last week of October.
Black lines - Fibonacci retracement On a weekly basis price formed a bearish candlestick. Price made a new higher high at the beginning of the week but price closed even lower than the low of the previous week. Trend remains bearish as price is making lower lows and lower highs. Short-term trend will change if bulls manage to recapture 1.17. Otherwise there are increased chances of price breaking past the 50% retracement. and heading towards the 61.8% level. The material has been provided by InstaForex Company - www.instaforex.com |
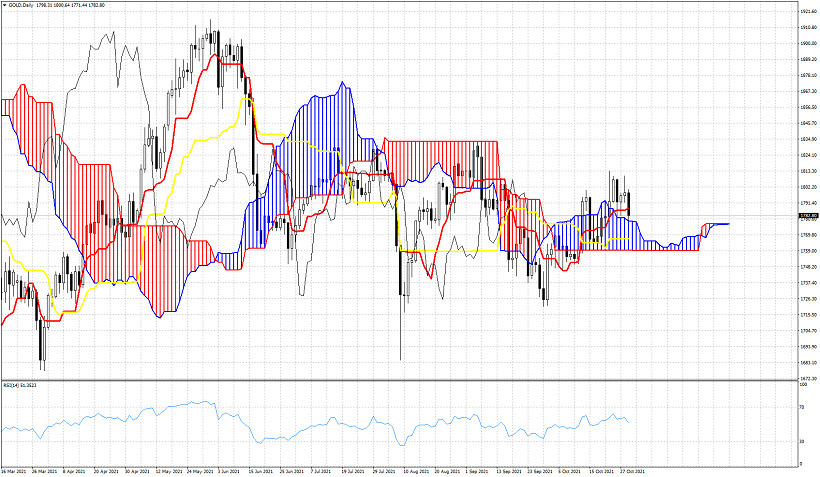
| Ichimoku cloud indicator analysis on Gold for October 31, 2021. Posted: 31 Oct 2021 02:31 PM PDT Gold price ended last week right on top of the Kumo. Price has made a reversal lower and price closed right above the Daily Kumo. Daily trend in Ichimoku cloud terms remains bullish. Price is now challenging the cloud support and holding above it is crucial for the bulls.
|
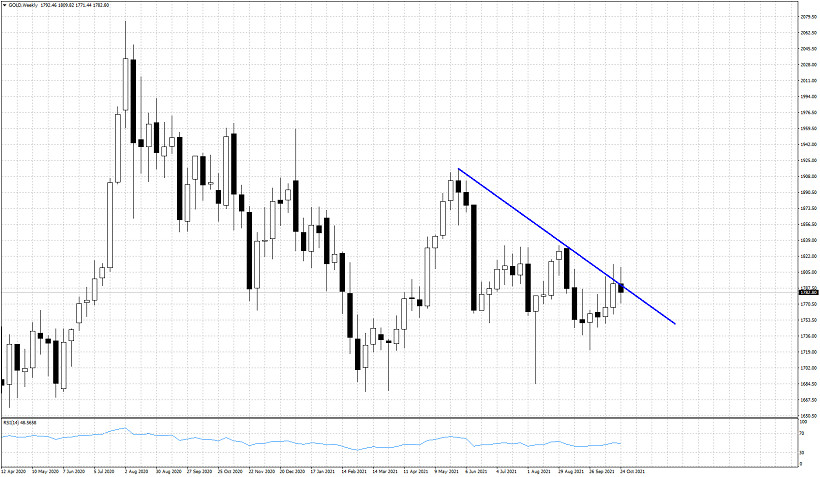
| Posted: 31 Oct 2021 02:27 PM PDT Gold price ended last week below $1,800 and specifically below $1,785. On a weekly basis price remains below the key downward sloping blue trend line resistance that we mentioned in previous posts. Last week's price action does not favor bulls. Bulls need to show signs of strength soon, otherwise we could see price fall even lower.
Gold price last week closed lower than the previous week. This was not necessarily a bearish sign, however the inability to break the blue trend line resistance was a bearish sign. Bulls need to recapture $1,792 and at least close above this level. This would bring price above the weekly trend line resistance and could provide more strength to bulls. Gold bulls need to hold above last week's lows. Breaking below them would be another bearish signal. The material has been provided by InstaForex Company - www.instaforex.com |
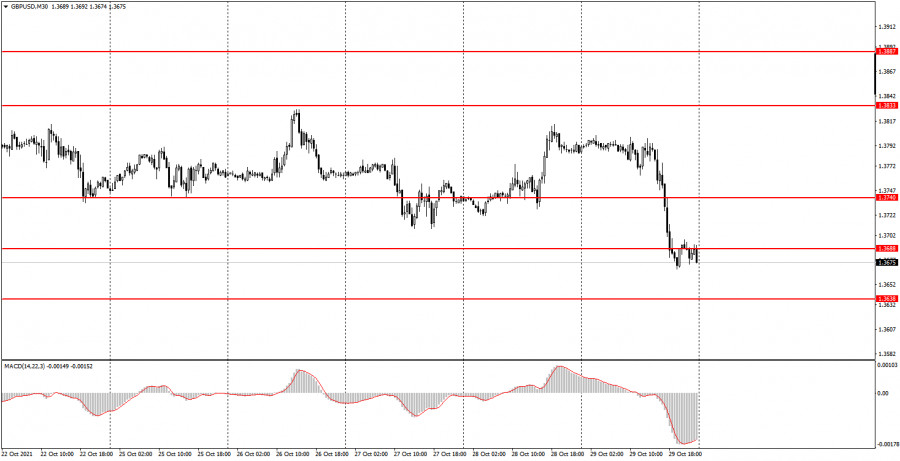
| Posted: 31 Oct 2021 02:27 PM PDT Analysis of previous deals: 30M chart of the GBP/USD pair
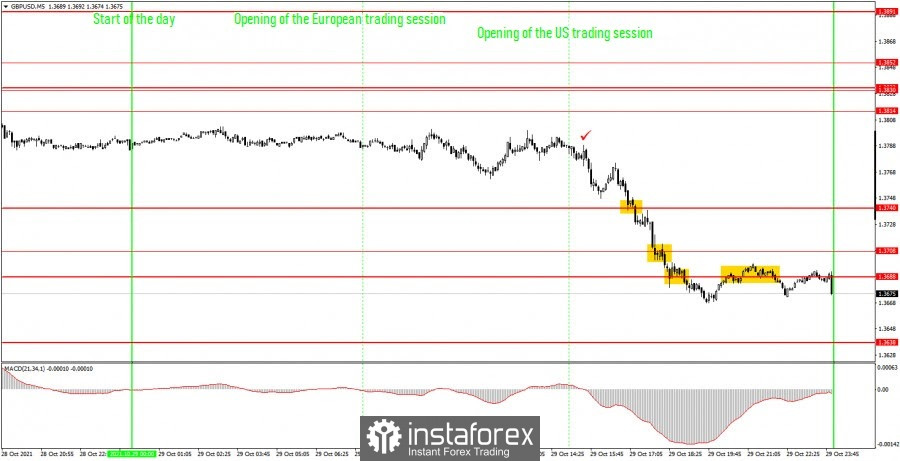
The GBP/USD pair timeframe spent almost nine full days between the levels of 1.3740 and 1.3833 on the 30-minute. That is, in an almost complete horizontal channel. Even Thursday's upward movement, which was triggered by the disastrous US GDP report, did not get the pair out of this channel. Only Friday's fall, which is still unclear what was provoked, allowed quotes to settle below the level of 1.3740, as well as below the level of 1.3688. However, this does not mean at all that a downward trend will now begin to form in the pound/dollar pair. A striking example of this, by the way, is the euro/dollar pair. Even after strong moves on Thursday and Friday, is it really possible to conclude that a trend has begun now? Also in the situation with the pound. One day outside the horizontal channel does not mean that a trend has begun! Thus, we still advise you not to rush into considering trading signals from the MACD indicator. No important statistics were released in America on Friday. At the very least, personal income and expense reports are not important. Nevertheless, it should be admitted that after the publication of these data, the downward movement intensified. Personal spending of Americans rose 0.6%, while income fell 1%. 5M chart of the GBP/USD pair
The technical picture on the 5-minute timeframe was twofold on Friday. On the one hand, there is a great downward movement. On the other hand, it started only in the US trading session, and trading signals began to form only in the middle of this session. Thus, traders missed a good half of this movement. Nevertheless, several trading signals were generated and should have been worked out! The first sell signal was formed when the level of 1.3740 was overcome. At this point, short positions should have been opened. The price subsequently broke through the levels of 1.3708 and 1.3688 and went down about 60 points in total. Thus, the trade could and should have been closed at any Take Profit, which, in any case, would have been greater than the profit near any of the exceeded levels. In fact, only one short position was opened on Friday, and it should have brought 40-50 points of profit. Not a bad result. The last sell signal in the form of a rebound from the level of 1.3688 should not have been worked out, as it was formed quite late. How to trade on Monday: At this time, there is still no trend on the 30-minute timeframe, and volatility has increased only in the last two days. Since there is no trend, we do not advise beginners to follow the signals on the MACD indicator for some time. For these signals to be relevant, a trend movement is required. The important levels on the 5-minute timeframe are 1.3612, 1.3638, 1.3688, 1.3708, 1.3740, 1.3814. We recommend trading on them on Monday. The price can bounce off them or overcome them. As before, we set Take Profit at a distance of 40-50 points. At the 5M TF, you can use all the nearest levels as targets, but then you need to take profit, taking into account the strength of the movement. When passing 20 points in the right direction, we recommend setting Stop Loss to breakeven. On November 1, novice traders can only pay attention to the ISM Manufacturing Index in the US and the UK Manufacturing PMI. The first index, which comes out in the afternoon, will be of greater importance. Basic rules of the trading system: 1) The signal strength is calculated by the time it took to form the signal (bounce or overcome the level). The less time it took, the stronger the signal. 2) If two or more deals were opened near a certain level based on false signals (which did not trigger Take Profit or the nearest target level), then all subsequent signals from this level should be ignored. 3) In a flat, any pair can form a lot of false signals or not form them at all. But in any case, at the first signs of a flat, it is better to stop trading. 4) Trade deals are opened in the time period between the beginning of the European session and until the middle of the US one, when all deals must be closed manually. 5) On the 30-minute TF, using signals from the MACD indicator, you can trade only if there is good volatility and a trend, which is confirmed by a trend line or a trend channel. 6) If two levels are located too close to each other (from 5 to 15 points), then they should be considered as an area of support or resistance. On the chart: Support and Resistance Levels are the Levels that serve as targets when buying or selling the pair. You can place Take Profit near these levels. Red lines are the channels or trend lines that display the current trend and show in which direction it is better to trade now. The MACD indicator consists of a histogram and a signal line. When they cross, this is a signal to enter the market. It is recommended to use this indicator in combination with trend lines (channels and trend lines). Important speeches and reports (always contained in the news calendar) can greatly influence the movement of a currency pair. Therefore, during their exit, it is recommended to trade as carefully as possible or exit the market in order to avoid a sharp price reversal against the previous movement. Beginners on Forex should remember that not every single trade has to be profitable. The development of a clear strategy and money management are the key to success in trading over a long period of time. The material has been provided by InstaForex Company - www.instaforex.com |
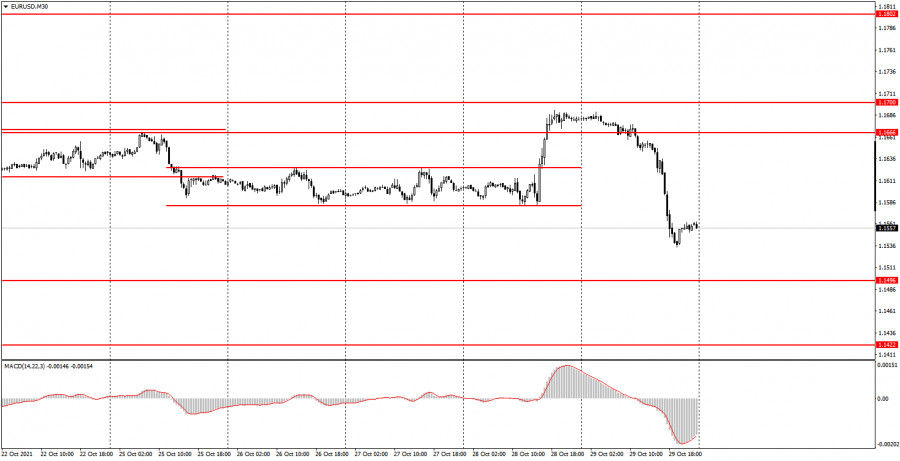
| Posted: 31 Oct 2021 02:27 PM PDT Analysis of previous deals: 30M chart of the EUR/USD pair
The EUR/USD pair fell 150 points on Friday. And, frankly, it's even somehow difficult to comment on. Recall that in the last 3-4 months the pair has been trading at about 40-50 points a day, and I don't even remember the last time there was a volatility of more than 100 points. In addition, the results of the European Central Bank meeting were summed up on Thursday, and an absolutely disastrous report on US GDP in the third quarter was published. Thus, the fall of the dollar and the growth of the euro on Thursday were absolutely logical. But on Friday, statistics were published only in the European Union (important statistics) and again it turned out to be in favor of the euro. But instead of continuing to buy, the markets decided otherwise and started massive sales of the euro. And this is very difficult to explain. GDP in the eurozone in the third quarter was higher than forecast. Inflation accelerated in October to 4.1%, which, as in the case of the dollar, increases the likelihood of curtailing the stimulus program in the European Union. Thus, the euro should continue to rise. But no, instead we saw the biggest drop in the past few months. The technical picture at the 30-minute TF still does not suggest a trend movement. There is no trend line or trend channel now. 5M chart of the EUR/USD pair
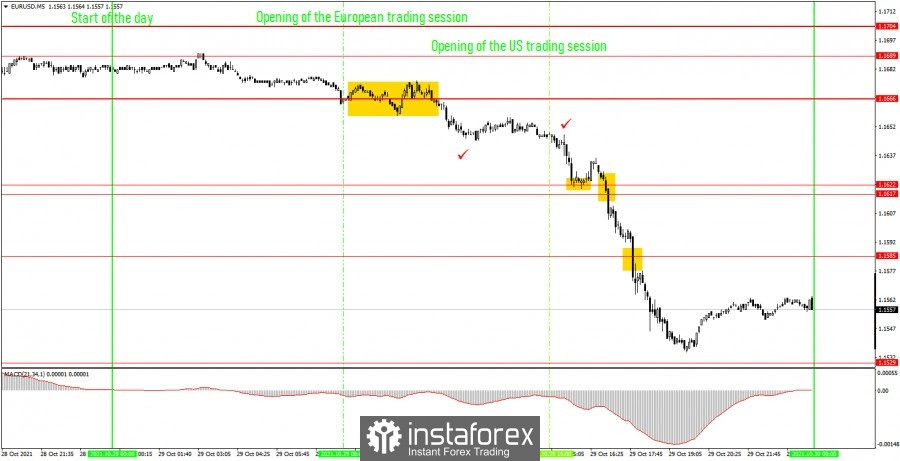
Friday's downward movement on the 5 minute timeframe looks really impressive. But, unfortunately, the essence of the movement itself was not very good. Simply put, there was a strong and powerful movement, but there were no similar signals. Let's try to figure out the trading signals on Friday. The very first signal of the day crossed out the entire future movement of the EUR/USD pair. Simply because at the beginning of the European trading session the price danced around the level of 1.1666 for some time, consolidating itself above it and below it. Thus, only around this level, at least two false signals were formed, which could have brought a loss of about 22 points. However, the main problem is not this, but the fact that if novice traders rejected these signals, then the last sell signal near the same level of 1.1666 should not have been worked out, and it was it that turned out to be profitable! Moreover! The downward movement began, but during the publication of European statistics (the first tick), the pair, on the contrary, stopped moving !!! And when the price reached the next level of 1.1622, it first bounced off it, forming another false buy signal. Its novice traders also had to reject a long position, which turned out to be 25 points unprofitable !!! In general, by the middle of the working day, beginners already had 50 points of loss on the move that should have brought only profit. The signal to sell on consolidation below the level of 1.1617 should also be worked out by a short position. Subsequently, the price settled below the level of 1.1585 and went down about 70 points in total. According to Take Profit, this deal should not have been closed, since it was necessary to win back 50 points of loss. This could have been done by manually closing the deal in the late afternoon. How to trade on Monday: The pair traded actively on the 30-minute timeframe on Thursday, and very actively on Friday, only this did not affect the technical picture in any way. There is still no trend. Thus, it is still not very convenient to trade on the 30-minute TF, and we still do not recommend tracking signals from the MACD indicator. We advise you to wait for the formation of a trend line or trend channel. The key levels on the 5-minute timeframe for November 1 are 1.1496, 1.1529, 1.1585, 1.1617 - 1.1622. Take Profit, as before, is set at a distance of 30-40 points. Stop Loss - to breakeven when the price passes in the right direction by 15 points. At the 5M TF, the target can be the nearest level if it is not too close or too far away. If it is located - then you should act according to the situation or work according to Take Profit. On Monday, the only major report will be the ISM in the US manufacturing sector. But after the overly active last week, it's even difficult to imagine what to expect from the pair on Monday... Basic rules of the trading system: 1) The signal strength is calculated by the time it took to form the signal (bounce or overcome the level). The less time it took, the stronger the signal. 2) If two or more deals were opened near a certain level based on false signals (which did not trigger Take Profit or the nearest target level), then all subsequent signals from this level should be ignored. 3) In a flat, any pair can form a lot of false signals or not form them at all. But in any case, at the first signs of a flat, it is better to stop trading. 4) Trade deals are opened in the time period between the beginning of the European session and until the middle of the American one, when all deals must be closed manually. 5) On the 30-minute TF, using signals from the MACD indicator, you can trade only if there is good volatility and a trend, which is confirmed by a trend line or a trend channel. 6) If two levels are located too close to each other (from 5 to 15 points), then they should be considered as an area of support or resistance. On the chart: Support and Resistance Levels are the Levels that serve as targets when buying or selling the pair. You can place Take Profit near these levels. Red lines are the channels or trend lines that display the current trend and show in which direction it is better to trade now. The MACD indicator (14,22,3) consists of a histogram and a signal line. When they cross, this is a signal to enter the market. It is recommended to use this indicator in combination with trend lines (channels and trend lines). Important speeches and reports (always contained in the news calendar) can greatly influence the movement of a currency pair. Therefore, during their exit, it is recommended to trade as carefully as possible or exit the market in order to avoid a sharp price reversal against the previous movement. Beginners on Forex should remember that not every single trade has to be profitable. The development of a clear strategy and money management are the key to success in trading over a long period of time. The material has been provided by InstaForex Company - www.instaforex.com |
| Short-term technical view on GBPUSD. Posted: 31 Oct 2021 02:23 PM PDT GBPUSD last week finished trading near the weekly lows. Price pulled back towards our target of the 38% Fibonacci retracement around 1.3670. This was our initial target after price broke out of the bullish channel and after breaking below 1.3745.
Black lines- Fibonacci retracements GBPUSD has reached the first important Fibonacci support level. Failure to hold above it will lead price to another move lower towards the 50% or even the 61.8% retracement level. Short-term trend remains bearish. Our most probable scenario is that price bounces at the start of the week but continues lower after forming a lower high. Breaking below 1.3670 will bring fast more sellers in the market. The material has been provided by InstaForex Company - www.instaforex.com |
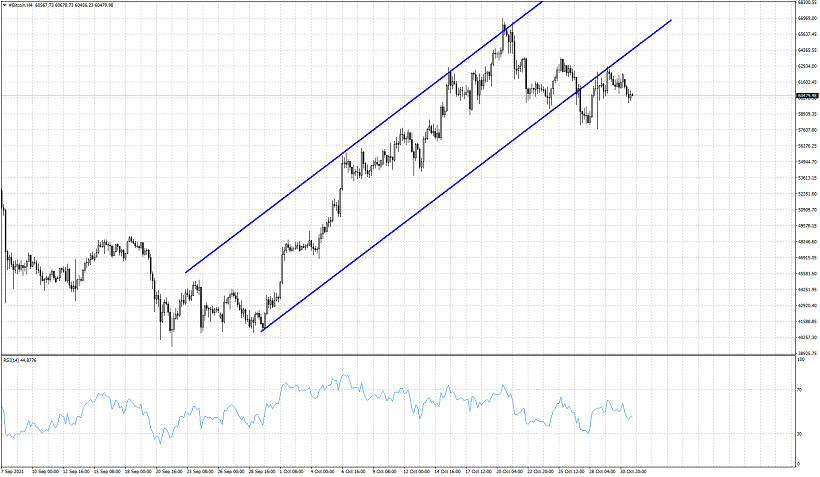
| Short-term analysis on Bitcoin. Posted: 31 Oct 2021 02:19 PM PDT Bitcoin has broken out of the bullish short-term channel and is now back testing it. Bulls need to recapture $65,000 in order to resume the up trend towards $70,000 and higher. This year's end could see Bitcoin price approach $100,000 if support levels are held.
Recent price action justifies a pull back towards $40,000. Support is found at $57,600 and as long as price is above this level, we should expect Bitcoin to retest recent highs. Failure to hold above this support level will lead BTCUSD towards $50,000 and lower. A pull back towards $50,000-$45,000 would be a healthy pause to the up trend. Forming a higher low around $45,000 would be ideal for bulls in order to gather strength for the next bullish cycle. The material has been provided by InstaForex Company - www.instaforex.com |
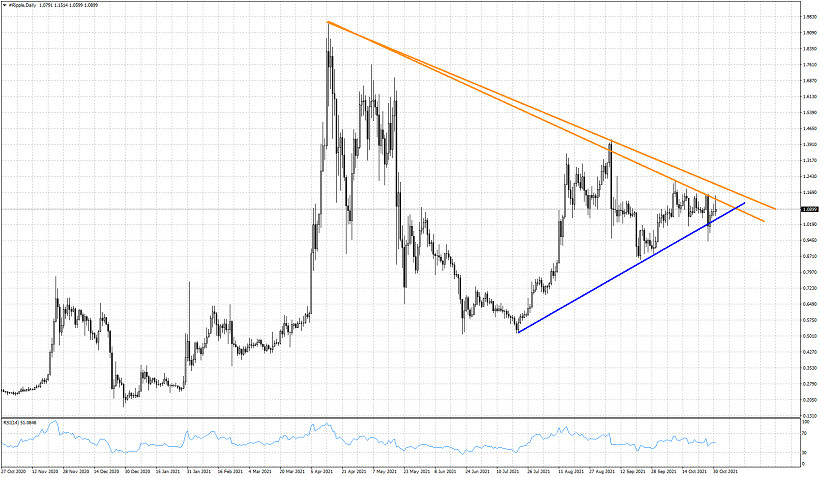
| Posted: 31 Oct 2021 12:46 PM PDT XRPUSD continues to trade below the key resistance area of $1.13-$1.24. Price made a sharp decline last Wednesday but prices bounced back up again. Price continues to respect the key support trend line but bulls are also unable to break above resistance.
Blue line- support trend line XRPUSD continues to trade sideways. Price remains below the key resistance orange trend lines and as long as this is the case, XRPUSD will be vulnerable to a move below $1. XRPUSD will provide a bullish signal if price breaks above $1.24. Our target then will be at $1.45-$1.50 area at least. Until then traders need to remain cautious and patient. The material has been provided by InstaForex Company - www.instaforex.com |
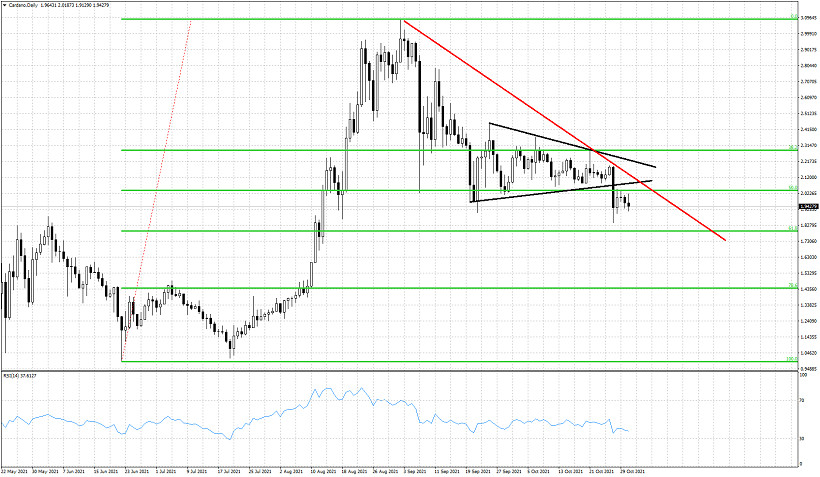
| Cardano breaks triangle pattern to the downside. Posted: 31 Oct 2021 12:40 PM PDT Cardano is trading below $2 after breaking below the short-term triangle pattern. A bearish signal has been given on Wednesday, while price is consolidating near recent lows. Short-term trend is bearish and price is vulnerable to more downside.
Green lines - FIbonacci retracement levels Black lines- triangle pattern Cardano is making lower lows and lower highs. Cardano has resistance at $2.13 at the red downward sloping resistance trend line. As long as price is below the red resistance trend line, Cardano is vulnerable to a move lower towards $1.79. Next target below $1.79 is at $1.44. The material has been provided by InstaForex Company - www.instaforex.com |
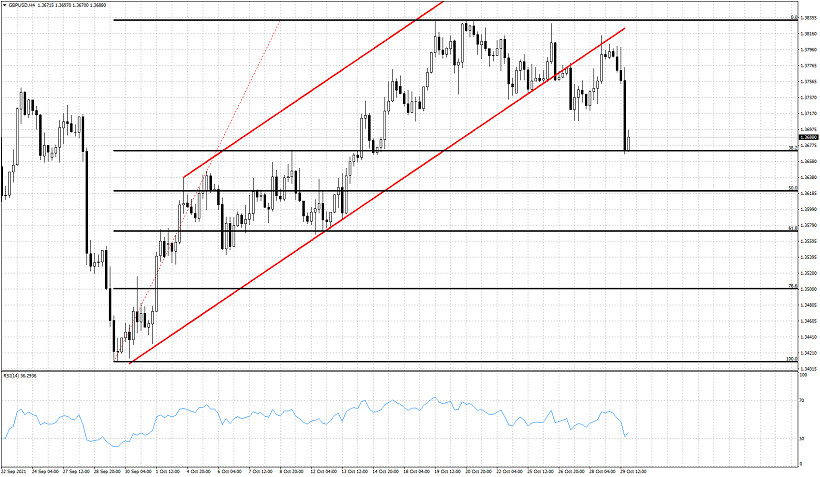
| Posted: 31 Oct 2021 07:59 AM PDT Analysis of GBP/USD 24-hour TF.
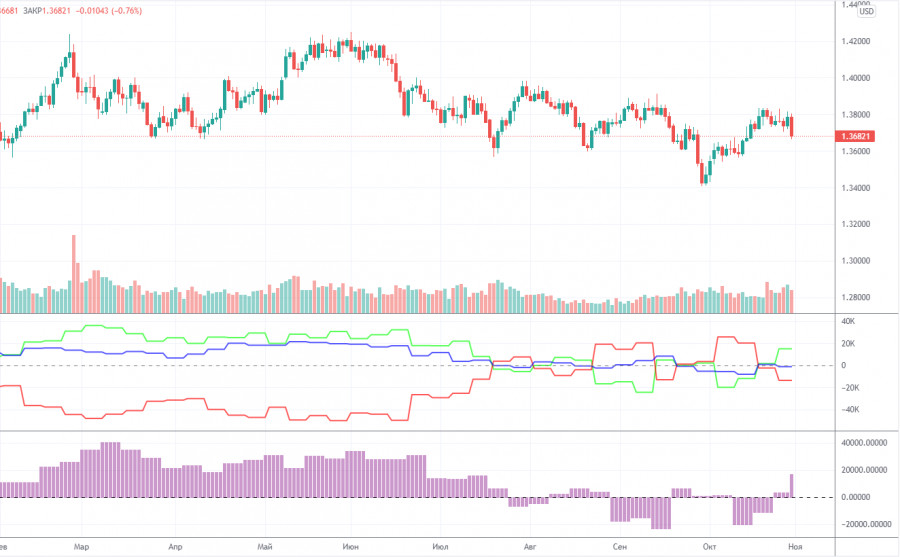
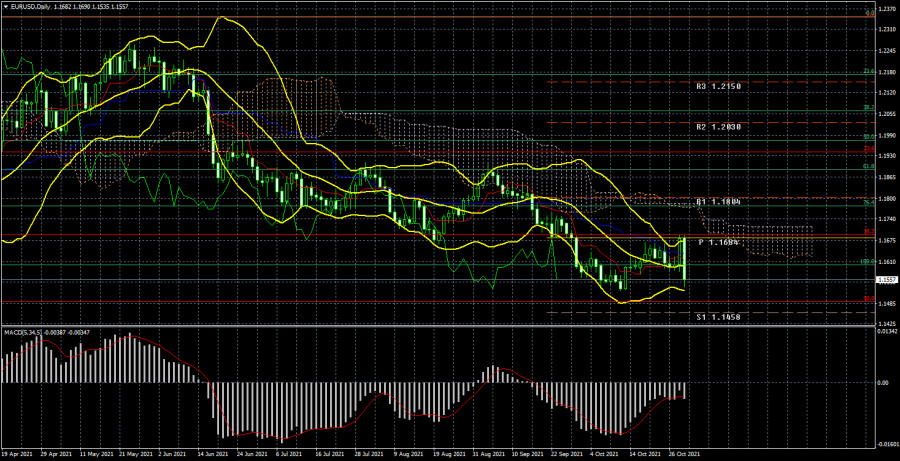
The GBP/USD currency pair continues to trade not too clearly. Last week, we talked about the fact that the price has already risen several times over the past 6 months to the Senkou Span B line, but each time it could not overcome this line. Thus, the downward trend has been maintained all this time, but this is not a trend, and the corrections are very deep. So this time, the quotes of the pound rose to the Senkou Span B line and even went slightly above it, but in the end, they consolidated back below and now the downward movement can resume. Thus, in the long term, the US dollar seems to continue to grow against both the euro and the pound, but all this movement still raises too many questions. We have repeatedly raised the topic of the fundamentals of the dollar's strengthening in the last 6-9 months. If you look at all this movement simply as a correction, then there are no questions, since correction should be in any movement. However, if you try to find reasons for the growth of the dollar, then problems begin to arise. Many factors hypothetically can influence the mood of the market (various kinds of news are regularly received from the UK alone), but most of them now simply cannot be connected with what is happening on the market. The state fundamental background is more important, but it is also weaker at the moment. Everything boils down now to the Fed meeting on November 3, at which it may be announced that the QE program will be curtailed. From our point of view, this is the main factor in the growth of the US currency in recent months. Thanks to the huge volumes of the QE program, the US dollar has fallen very much over the past year and a half. Therefore, when the probability of rejection of incentives increases, it can support the reverse movement. And the weakness of the dollar's strengthening is explained by the fact that the Fed will not begin to curtail incentives in any way. And it may not even announce the relevant decision in November. Analysis of the COT report.
During the last reporting week (October 19-25), the mood of professional traders became more "bullish". The situation with COT reports is even more ambiguous now than with the technical picture. And if we compare the COT reports on the euro and the pound, the situation becomes even more strange. Both indicators in the illustration above show that there is still no clear, accurate, and understandable mood among the major players. Therefore, it simply does not make sense to build any forecasts based on COT reports now. The illustration above clearly shows the entire movement of the pair over the past six months. It's quite difficult to call it a trend or even a trend. In the last couple of months, the mood of the major players has been constantly changing. The green and red lines of the first indicator (the net positions of the "Commercial" and "Non-commercial" groups of traders) change the direction of movement, constantly crossing the zero mark. This means that the two largest groups of traders are constantly increasing and reducing net positions. During the reporting week, professional traders opened 2.8 thousand buy contracts and closed 10.7 thousand sell contracts. Thus, their net position increased by 10 thousand contracts. This corresponds to what has been happening with the pound in recent weeks (it is growing). However, it is not possible to make a longer-term forecast, since, by the end of next week, the net position may fall. Especially considering the fall of the pound itself on Friday. Analysis of fundamental events. In the UK this week, there were no macroeconomic statistics and no "foundation" at all. Thus, traders had to focus only on American statistics, and in the States, there was only one important report - GDP for the third quarter. It was published on Thursday, and the US dollar fell by 60 points because of it. However, on Friday, for no apparent reason, the US currency began to grow strongly and added 120 points during the day. And this is although there were no important macroeconomic statistics on this day either in the States or in Britain. In general, something strange happened on Friday, because the volatility of the two main pairs was high at once, while there was either no news or they were ignored by the markets (as in the case of European inflation and GDP on Friday). Well, in this case, we can only wait for the Fed meeting, which will take place next week. Trading plan for the week of November 1-5: 1) The pound/dollar pair failed to overcome the upper boundary of the Ichimoku cloud. If it manages to gain a foothold above it again, then the trend may change to an upward one, and in this case, we recommend buying the pair since the probability of forming a new upward trend will increase significantly. The first target will be the resistance level of 1.4099. 2) The bears managed to keep the pair below the Ichimoku cloud and now they can try to develop their success again. If the nature of the movement does not change, then a new round of downward movement will begin now with goals below the minimum of the previous round (below the level of 1.3400). However, by and large, the downward movement was observed only on Friday. Thus, everything can still change, especially after November 3. However, sales are still more preferable. If the bears manage to gain a foothold below the critical line, then the chances of further decline will increase even more. Explanations to the illustrations: Price levels of support and resistance (resistance /support), Fibonacci levels - target levels when opening purchases or sales. Take Profit levels can be placed near them. Ichimoku indicators(standard settings), Bollinger Bands(standard settings), MACD(5, 34, 5). Indicator 1 on the COT charts - the net position size of each category of traders. Indicator 2 on the COT charts - the net position size for the "Non-commercial" group. The material has been provided by InstaForex Company - www.instaforex.com |
| Posted: 31 Oct 2021 07:59 AM PDT EUR/USD 24-hour TF analysis.
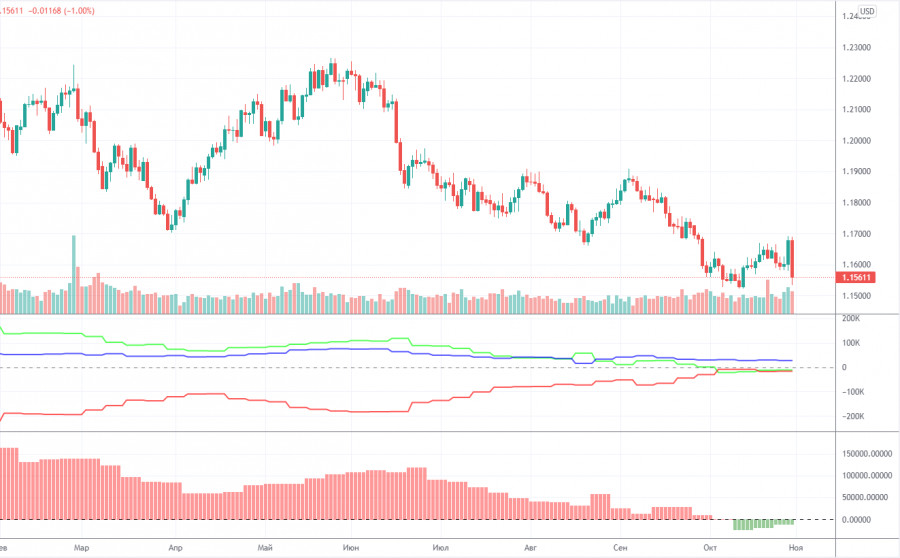
The EUR/USD currency pair continued to adjust against the short-term downward trend during the current week as a whole. If not for the last trading day of the week – Friday, when the pair collapsed down by 140 points, which it has not been for a very long time. And this is although a day earlier, on Thursday, the quotes of the European currency rose by 100 points after the ECB meeting and the US GDP report. What happens? On Thursday, when the "foundation" and "macroeconomics" were strong, the pair passed 100 points, and on Friday, when the "macroeconomics" was weaker, but still, in favor of the euro, the pair fell by 140 points. Illogical behavior of the market. Let's talk about the macroeconomic background a little lower. However, for now, I would like to note the abnormally strong volatility of the euro/dollar pair at the end of this week. Recall that the volatility does not exceed 40-50 points per day for three or four months. Thus, the fall on Friday raises questions. The technical picture could also confuse traders. On Thursday, the quotes were fixed above the critical Kijun-sen line on the 24-hour TF, which allowed us to expect the continuation of the upward movement. However, instead, a collapse followed, after which the pair again found itself under the critical line. In general, this is the case when the "foundation" and "macroeconomics" influenced the "technique" in the wrong way and only confused it. Now the downward trend is formally maintained. However, the Bollinger bands are now directed sideways, which indicates a possible flat. The price may continue to strive for the Fibonacci level of 1.1490 (50.0%), from the entire upward trend segment, which has been forming for a year and a half. Analysis of the COT report.
During the last reporting week (October 19-25), the mood of non-commercial traders has not changed much. During the reporting week, a group of "Non-commercial" traders opened 4 thousand contracts for sale and 4 thousand contracts for purchase. Consequently, the net position of professional players has not changed. And if so, then the mood of the big traders remained "bearish." Yes, it is "bearish", as evidenced by both indicators in the illustration above. The green and red lines of the first (net positions of non-commercial and commercial players) continue to move towards each other, which still means that the upward trend is ending. Or the downward correction is delayed. Recall that the process of convergence of these lines began at the beginning of the year when the upward movement stopped. At the moment, this whole process does not even fit into the illustration – the downward movement continues for so long, which we still consider a correction. The most interesting thing is that the last two trading days of this week were not included in the latest COT report. We do not know how the major players traded on Thursday and Friday when the pair passed about 250 points. It should also be noted that the net position of non-commercial traders remains below zero. The number of short positions exceeds the total number of long positions. Therefore, based on the COT reports, the fall of the European currency may continue. The nearest target, as we have already said, is the important level of 1.1490. So far, COT reports do not allow us to conclude a change in the trend. Analysis of fundamental events. There were quite a lot of macroeconomic and fundamental events this week. However, all the most interesting things that happened last week were almost empty. On Thursday, the ECB summed up the results of its two-day meeting, and they were "moderately hawkish". However, in general, the meeting can simply be considered "passing", because the most important was Christine Lagarde's statement about the slowdown in asset purchases in the fourth quarter. The US GDP report also had a strong impact on the pair, which turned out to be much weaker than forecasts and disappointed traders. However, how to explain Friday's collapse of the euro currency? On this day, the European Union released a report on inflation, which accelerated to 4.1%, as well as a report on GDP, which turned out to be better than forecasts. However, the euro began to fall at night, continued it at the European trading session. It did not react to it during the release of European statistics. Moreover, at the American session, it collapsed "like a stone". The European statistics on Friday were ignored, and the markets admitted that they were wrong on Thursday. Or have they shown that they are not at all interested in buying European currency now? Trading plan for the week of November 1-5: 1) On the 24-hour timeframe, the upward trend has not changed, since the bulls were saved near the first serious 38.2% Fibonacci level of 1.1691. At the moment, the quotes have gone below the Kijun-sen line, and the markets have shown that they are not ready to buy the pair. Thus, the downward movement may continue with the target of 1.1490. The main thing is that now the volatility remains high for as long as possible. 2) As for purchases of the euro/dollar pair, in the current conditions, they should be considered no earlier than fixing the price above the critical line. Ideally, above the Ichimoku cloud, because the price has already overcome the Kijun-sen several times, but then could not continue to move up. And the last such time was just this week. There are few prerequisites for a new upward trend to begin in the near future, although the general fundamental background still indicates a very likely fall in the dollar. Explanations to the illustrations: Price levels of support and resistance (resistance /support), Fibonacci levels - target levels when opening purchases or sales. Take Profit levels can be placed near them. Ichimoku indicators (standard settings), Bollinger Bands(standard settings), MACD(5, 34, 5). Indicator 1 on the COT charts - the net position size of each category of traders. Indicator 2 on the COT charts - the net position size for the "Non-commercial" group. The material has been provided by InstaForex Company - www.instaforex.com |
| You are subscribed to email updates from Forex analysis review. To stop receiving these emails, you may unsubscribe now. | Email delivery powered by Google |
| Google, 1600 Amphitheatre Parkway, Mountain View, CA 94043, United States | |


Comments