Forex analysis review
Forex analysis review |
- Overview of the GBP/USD pair. October 29. The US GDP report led to a fall in the dollar
- Overview of the EUR/USD pair. October 29. Christine Lagarde: Inflation will continue to remain high
- Will there be a massive launch of Bitcoin futures ETFs, and how will this affect the correlation in Bitcoin price?
- How to trade GBP/USD on October 29? Simple tips for beginners. The pound was delighted with the failed US GDP report
- How to trade EUR/USD on October 29? Simple tips for beginners. The ECB meeting provoked a storm in the foreign exchange market
- EUR/USD. Growth in German inflation, slowdown in the US economy and the "walk-through" meeting of the ECB
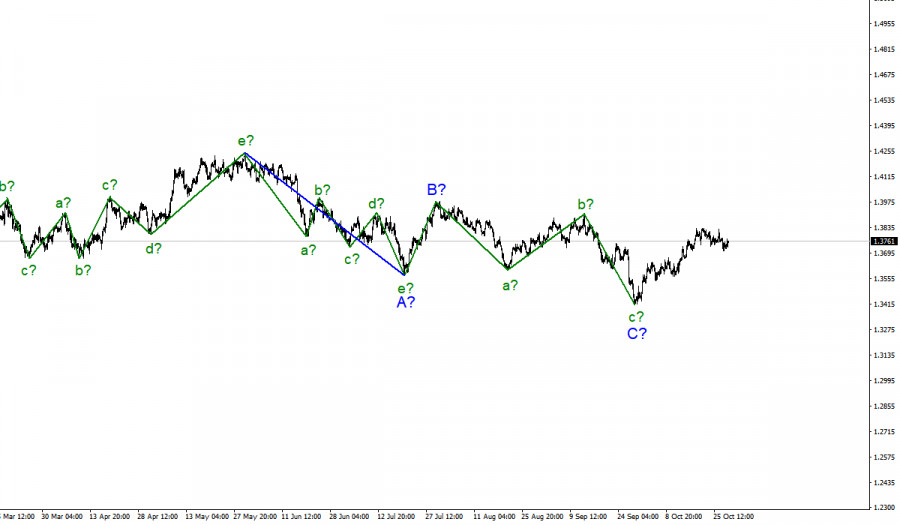
- Wave analysis of GBP/USD for October 28: U.S. GDP in third quarter disappoints
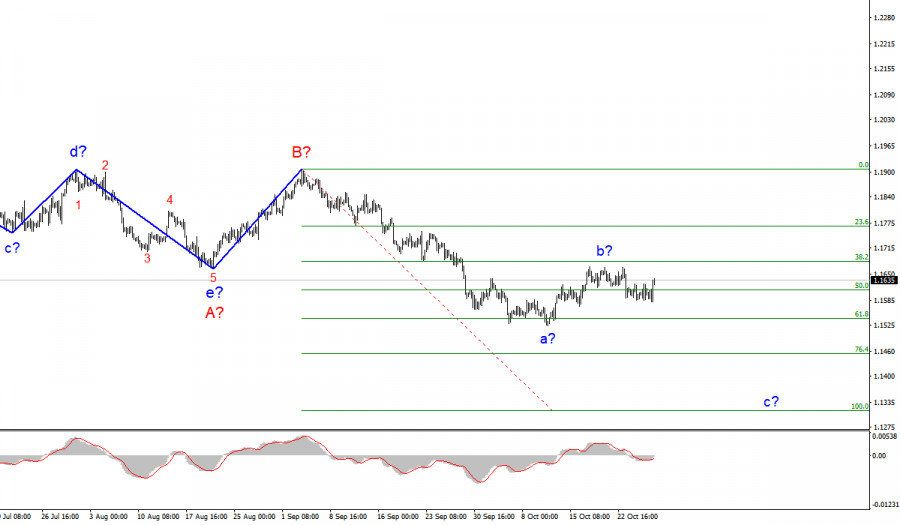
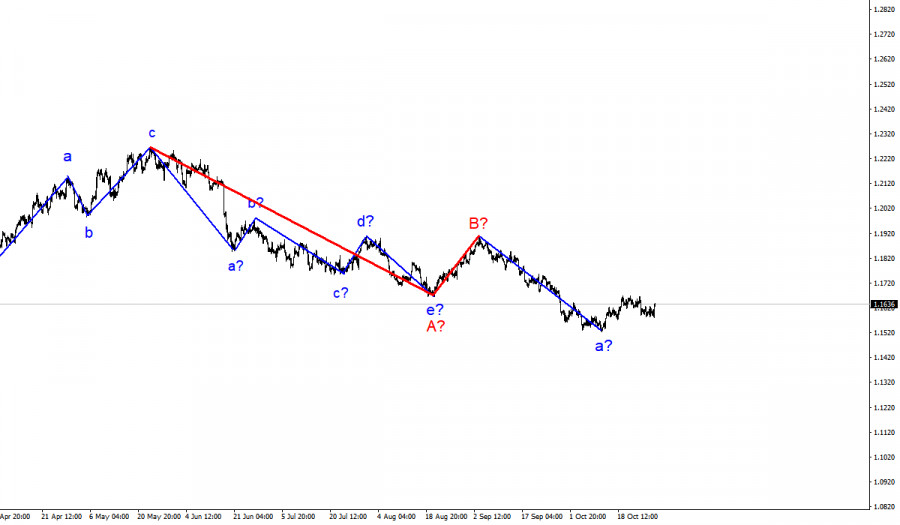
- Wave analysis of EUR/USD for October 28: ECB leaves PEPP program and key rate unchanged
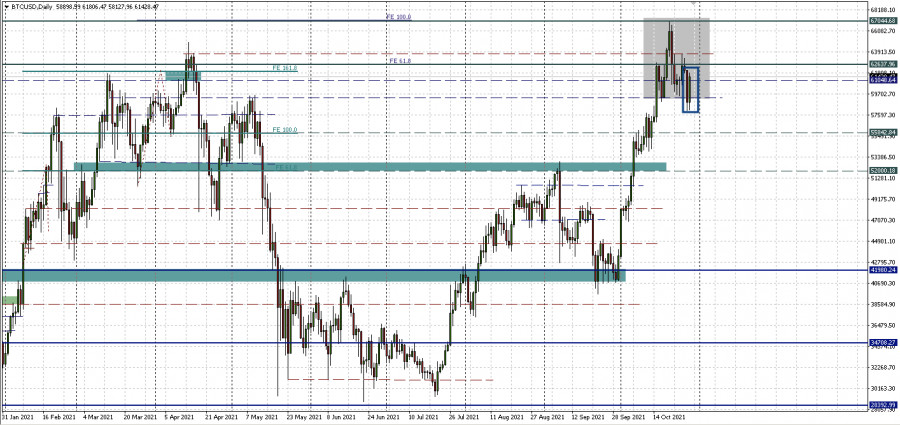
- Bitcoin: The battle for the $60,000 level continues. Will the fall be redeemed?
- Ethereum false breakdown?
- October 28, 2021 : EUR/USD daily technical review and trading opportunities.
- October 28, 2021 : EUR/USD Intraday technical analysis and trading plan.
- October 28, 2021 : GBP/USD Intraday technical analysis and significant key-levels.
- Trading signal for Ethereum (ETH) on October 28 - 29, 2021: sell below $4,280 (top of range)
- Bitcoin: attention at resistance!
- Learn and analyze: what do Bitcoin on-chain metrics say about further price movement?
- Trading signal for GBP/USD on October 28 - 29, 2021: buy above 1,3755 (SMA 21)
- Bitcoin and Ethereum: Antifragility of the crypto industry boggles the mind
- Trading signal for EUR/USD on October 28 - 29, 2021: buy in case of breaks above 1.1615 (zone of range)
- El Salvador buys another 420 bitcoins, Stablecoins poses threat to the American economy
- Strong reports fail: US indices down
- Trading idea for gold
- Crypto fever: bitcoin tumbles, altcoins gains up to 70%
- BTC analysis for October 28,.2021 - Buyers in control
- Analysis of Gold for October 28,.2021 - Inside day formation. Watch for the breakout....
| Overview of the GBP/USD pair. October 29. The US GDP report led to a fall in the dollar Posted: 28 Oct 2021 05:58 PM PDT 4-hour timeframe
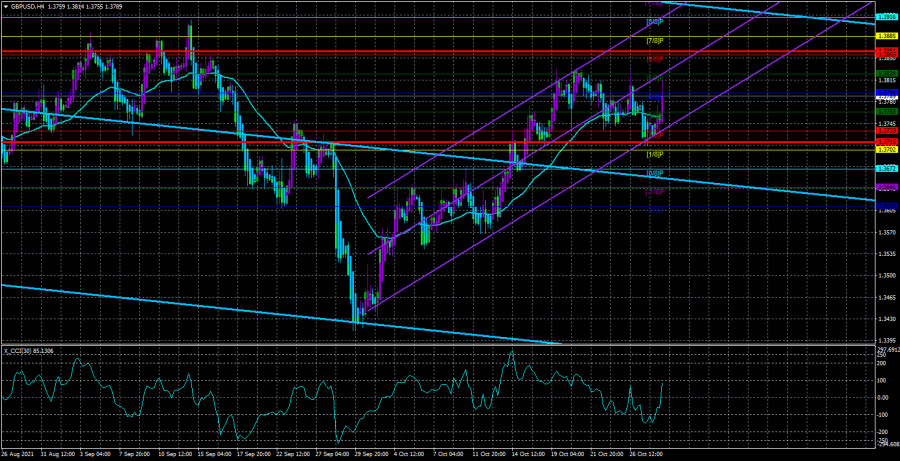
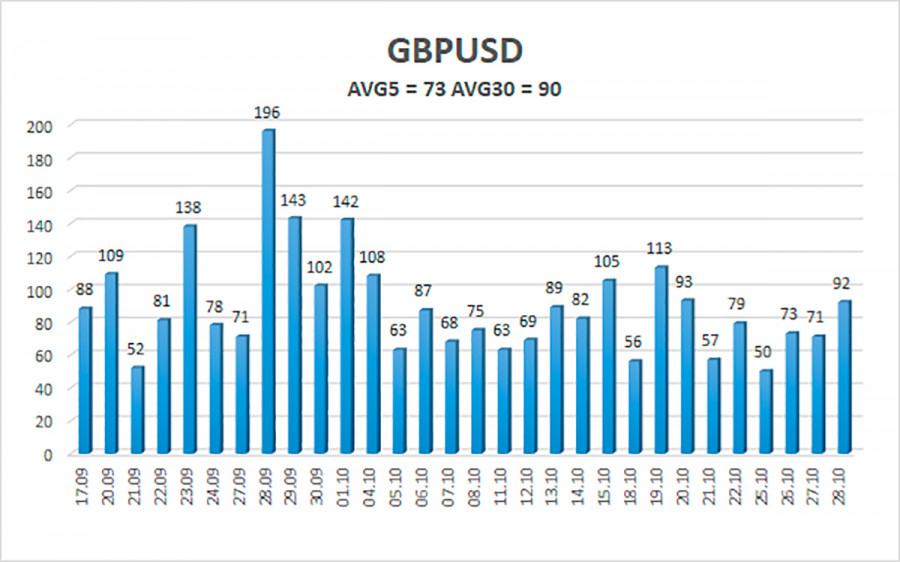
Technical details: Higher linear regression channel: direction - downward. Lower linear regression channel: direction - upward. Moving average (20; smoothed) - sideways. The GBP/USD currency pair was more or less active on Thursday, which traders were frankly waiting for. We have already drawn traders' attention to volatility indicators many times. Now is the time to do it again. The illustration below clearly shows how much the indicators have fallen even in the context of the last month and a half. Yesterday, volatility finally rose slightly, thereby giving hope for its growth in the future. Meanwhile, an important GDP report for the third quarter was published in the States, which could not but disappoint traders. Instead of the expected growth of 2.6% q/q, the markets saw an increase of only 2.0%. Thus, with a slight delay, market participants began to sell the US currency, which led to the consolidation of the pair above the moving average line. It should be noted that, as in the case of the euro/dollar pair, the bears failed to develop their success after consolidating below the moving average. Thus, the upward movement may resume at this time. However, we also draw attention to the fact that yesterday a strong drop in the dollar was provoked by a strong report (and in the European Union - also by the results of the ECB meeting). It may be an isolated case, after which everything will return to its place. In any case, time will tell. Already today, it may become clear whether yesterday's strong movement of both pairs was an accident or whether the markets finally began to trade more actively. A complete set of problems for the UK. Recall that the UK is once again facing problems. We have already written about the "fuel crisis", which is part of the "logistics". We also wrote that negotiations on the "Northern Ireland protocol" with the European Union are at an impasse. In addition, the whole country is gripped by a shortage of some goods, and the British are in panic buying up all the goods for the future. Also, we must not forget about the rather difficult situation with the "coronavirus". Currently, the UK is in second place in the world in terms of infection rates. Over the past 28 days, more than 1 million people have been infected and 3.5 thousand have died. And this is in a country where the entire adult population has received both vaccinations against COVID. As you can see, vaccines are not working very well yet, and the British economy may face a new batch of problems. It is also impossible not to note the fact that people are fleeing from the UK now, as from a sinking ship. Of course, this does not apply to the British themselves. However, recent opinion polls have shown that more than half of the country's population is not happy with how Brexit is proceeding. The European Union is already saying publicly that the UK is facing an economic catastrophe because of Brexit, and the country's government is still trying to disguise the consequences of Brexit under the consequences of the coronavirus pandemic. And now whole countries are fleeing from the Kingdom. Scotland intends to hold an independence referendum next year. Separatist sentiments are maturing in Wales. Earlier, according to opinion polls, it became known that many Northern Irishmen do not see themselves as part of the Kingdom in 10 years. Thus, even if none of these countries leaves the Kingdom, such sentiments perfectly reflect where people live better: in Britain or the European Union. In any case, these are new problems for the British government that will need to be solved somehow. And the more such problems there are, the more likely it is that Boris Johnson will not be the next prime minister, and the Conservatives will not rule in Parliament. Thus, the pound continues to be located quite high. However, in the future, it may resume its depreciation against the dollar for several years.
The average volatility of the GBP/USD pair is currently 73 points per day. For the pound/dollar pair, this value is "average". On Friday, October 29, we expect movement inside the channel, limited by the levels of 1.3715 and 1.3861. The reversal of the Heiken Ashi indicator downwards signals a round of corrective movement. Nearest support levels: S1 – 1.3763 S2 – 1.3733 S3 – 1.3702 Nearest resistance levels: R1 – 1.3794 R2 – 1.3824 R3 – 1.3855 Trading recommendations: The GBP/USD pair on the 4-hour timeframe was fixed above the moving average, so the trend changed back to an upward one. Thus, at this time, it is necessary to keep open long positions with targets of 1.3824 and 1.3855 levels until the Heiken Ashi indicator turns down. Sell orders can be considered again if the price is fixed below the moving average line with targets of 1.3733 and 1.3715 and keep them open until the Heiken Ashi turns up. Explanations to the illustrations: Linear regression channels - help determine the current trend. If both are directed in the same direction, then the trend is strong now. The moving average line (settings 20.0, smoothed) - determines the short-term trend and the direction in which trading should be conducted now. Murray levels - target levels for movements and corrections. Volatility levels (red lines) - the likely price channel in which the pair will spend the next day, based on current volatility indicators. CCI indicator - its entry into the oversold area (below -250) or into the overbought area (above +250) means that a trend reversal in the opposite direction is approaching. The material has been provided by InstaForex Company - www.instaforex.com |
| Overview of the EUR/USD pair. October 29. Christine Lagarde: Inflation will continue to remain high Posted: 28 Oct 2021 05:58 PM PDT 4-hour timeframe
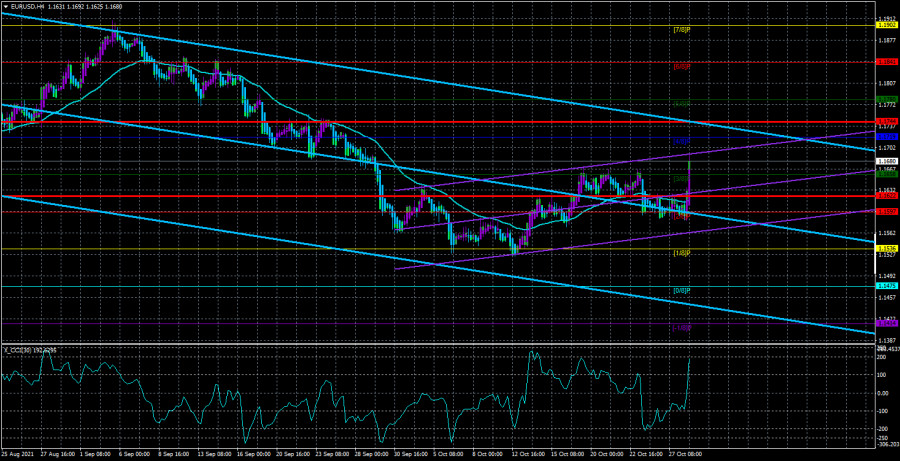
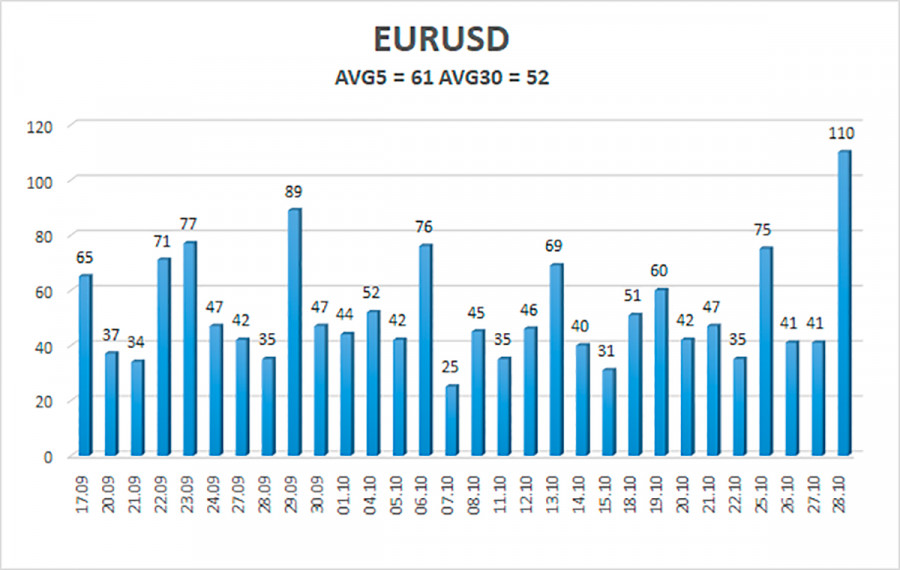
Technical details: Higher linear regression channel: direction - downward. Lower linear regression channel: direction - upward. Moving average (20; smoothed) - sideways. The EUR/USD currency pair traded quite actively on Thursday, which was expected from it. The fact is that the results of the ECB meeting were summed up yesterday, which always arouses the interest of the markets. Thus, the increase in volatility should not cause any surprise. However, we will talk about the results of the ECB meeting a little below. For now, I would like to note that the technical picture has not changed much over the past day. The euro/dollar pair gained a foothold above the moving average line. However, this did not change the essence of the matter, since the bears could not develop their success after three days spent under moving. They could not even break through the 16th level. Thus, a new round of strengthening of the US currency is postponed for now. Of course, this does not mean that the US dollar will not resume its growth next week when the results of the Fed meeting are summed up. After all, the Fed may announce the curtailment of the QE program, which the markets have been waiting for. However, the upward movement has resumed at this time. Recall also that on the 24-hour timeframe, the price has been trying to overcome the Kijun-sen line for more than a week, which is the first bulwark on the pair's path to a new upward trend. Yesterday, we managed to overcome this line. Thus, now the upward movement can continue to the Senkou Span B line (1.1786). We also recall that we have been expecting a resumption of the global upward trend for a long time since the long-term prospects of the US currency remain very vague. Although the American economy has recovered very well over the past year, it should be understood that this growth was provided by the Fed's printing press. Naturally, with such cash injections, the economy recovered quickly. However, a new blow from the "coronavirus" has already collapsed GDP in the third quarter to 2%. Christine Lagarde has announced longer periods of high inflation. As for the ECB meeting, the European regulator has not taken any concrete actions. The key rate remained unchanged, as did the volumes of the PEPP and APP programs. However, the ECB made it clear that in the fourth quarter, the volume of asset purchases under the PEPP program will decrease compared to the second and third quarters. There are different ways to treat this statement since Christine Lagarde has previously stated that with the completion of the PEPP program, the APP program will be increased. The only question is how much the total volume of asset purchases will decrease. It should decrease with the completion of the PEPP program in March next year. And this can support the euro. However, the Fed may also begin to wind down its QE program, which in some way negates the advantage of the euro. Returning to Christine Lagarde, she said at a press conference that inflation will remain high for a long period. It is worth noting that the markets were waiting for words about inflation, although it is not as high in the European Union as in the United States. Nevertheless, Lagarde noted the increase in prices and stated that the increase in energy prices provokes an increase in inflation for almost all goods and services. In addition, she noted that demand is recovering faster than supply, which causes a shortage of some goods and an increase in prices. "We expect further inflation growth in the medium term, and then its slowdown over the next year," said the head of the ECB on Thursday. Lagarde also noted that the pace of economic recovery is declining, which may be caused by new outbreaks of the epidemic, as well as new strains of coronavirus, which have already forced several European countries to introduce a lockdown. After all this information, the European currency rose by 100 points, probably reacting only to the words about the reduction of PEPP volumes. In general, the ECB meeting can be called quite "passing". Previously, the markets have repeatedly ignored such results. However, it was very important for the European currency to start trading more actively. Recall that in the last few months, the pair has been experiencing very serious problems with volatility. Perhaps yesterday will be the starting point for a new period with higher volatility. Also, note that the euro currency could partly grow due to the weak US GDP report.
The volatility of the euro/dollar currency pair as of October 29 is 61 points and is characterized as "average". Thus, we expect the pair to move today between the levels of 1.1622 and 1.1744. The reversal of the Heiken Ashi indicator downwards signals a round of downward correction after yesterday's growth. Nearest support levels: S1 – 1.1658 S2 – 1.1597 S3 – 1.1536 Nearest resistance levels: R1 – 1.1719 R2 – 1.1780 R3 – 1.1841 Trading recommendations: The EUR/USD pair has consolidated above the moving average line, so the trend has changed to an upward one. Thus, today, it is possible to stay in long positions with targets of 1.1719 and 1.1744. The pair's sales should be considered if the price is fixed back below the moving average with targets of 1.1597 and 1.1536. Explanations to the illustrations: Linear regression channels - help determine the current trend. If both are directed in the same direction, then the trend is strong now. The moving average line (settings 20.0, smoothed) - determines the short-term trend and the direction in which trading should be conducted now. Murray levels - target levels for movements and corrections. Volatility levels (red lines) - the likely price channel in which the pair will spend the next day, based on current volatility indicators. CCI indicator - its entry into the oversold area (below -250) or into the overbought area (above +250) means that a trend reversal in the opposite direction is approaching. The material has been provided by InstaForex Company - www.instaforex.com |
| Posted: 28 Oct 2021 03:14 PM PDT
October was truly significant for the entire crypto market, namely the launch of bitcoin futures ETFs, which became a catalyst for the growth of bitcoin. Digital gold has become available to investors through any brokerage account in a tax-efficient shell. VanEck became the second Bitcoin ETF after the ProShares BITO ETF, following them, Valkyrie Investments received the green light from Gary Gensler and started trading on October 22. Despite the huge success that has been seen over the past two weeks, regulatory requirements have always been a problem for bitcoin. ETF issuers have repeatedly tried to bring the exchange product to the cryptocurrency, but no one has received SEC approval. up until October, as everyone had their own arguments and additional investigations. However, physical products have always been and will be more successful and efficient than futures products, since it is very difficult to trade long-term with them and extend them, investors also cannot thoroughly track spot prices. WILL THERE BE ANY MORE ATTEMPTS TO LAUNCH FUTURES ETFS?
Gary Gensler remained very enthusiastic about the bitcoin futures ETFs, as they were created in accordance with the current investment company law of 1940, which protects investors from losses. After the launch of the ProShares ETF BITO, the price rose to all-time highs. Many companies, such as Invesco, have applied to create similar ones. Previously, investors could track products such as the Grayscale Bitcoin Trust (GBTC), which opened the door for them to trade on lower terms, but they were only available to seasoned high net worth investors. If you are not yet sure about investing in bitcoin futures ETFs or want to wait for the launch of new ones, you can look at stocks associated with mining and trading BTC, as they play an important role in placing bets on this asset. The material has been provided by InstaForex Company - www.instaforex.com |
| Posted: 28 Oct 2021 02:13 PM PDT Analysis of previous deals: 30M chart of the GBP/USD pair
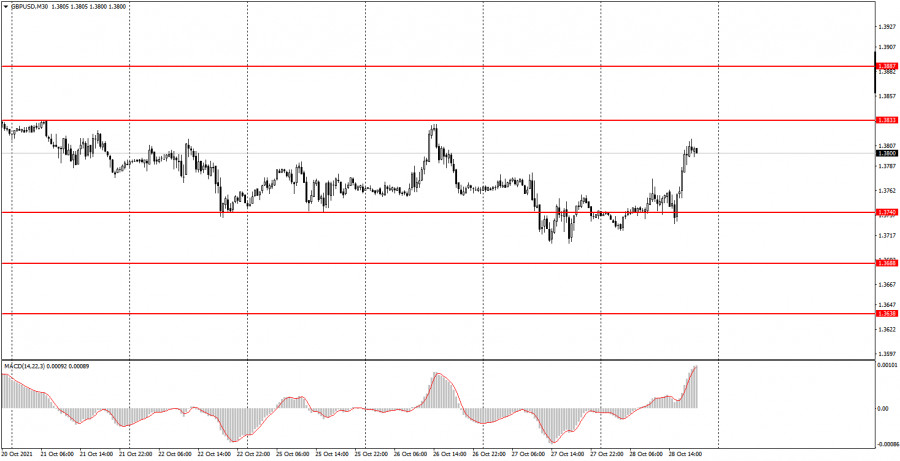
The GBP/USD pair moves between the levels of 1.3740 and 1.3833 on the 30-minute timeframe for the eighth trading day. That is, less than a 100-point horizontal channel. Quotes left this channel for a long time, but they spend most of their time in it. And today, despite a rather strong upward movement (although weaker than for the euro/dollar pair), the quotes remained within this range. Thus, if we cannot talk about a trend in the euro currency now, then even more so for the pound. Therefore, signals from the MACD indicator should still not be considered as there is still no trend. It should also be noted that today's growth in the pound was driven solely by the US GDP report, which completely failed. Recall that the US economy grew by only 2.0% in the third quarter, although the previous quarter recorded growth of 6.7%. 5M chart of the GBP/USD pair
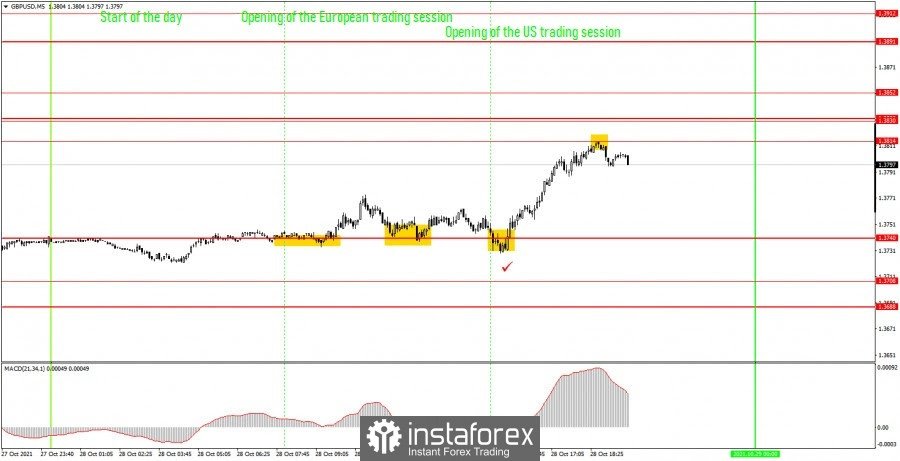
The technical picture was twofold on the 5-minute timeframe today. Several trading signals were generated, which did not raise any questions, but there was also one rather difficult one for novice traders. Let's figure it out. The first buy signal was formed at the very beginning of the European trading session, when the price bounced rather imprecisely from the level of 1.3740. The upward movement after it was 23 points. Therefore, newcomers should have had time to place a Stop Loss order at breakeven. And on this order, the short position was closed, as the price returned to the level of 1.3740 and bounced off it again. Therefore, the second buy signal should also be processed with a long position. This time the price could not go up more than 20 points and once again returned to the level of 1.3740. This happened neatly by the beginning of the US session, when the publication of the GDP report was scheduled in the United States. Thus, there were two options for possible action. Or stay in a long position by setting Stop Loss, but not at breakeven, but slightly lower, since SL is set to breakeven only after passing 20 points in the right direction. Or, you can close the deal before the GDP is published, and then open a new one, as the price bounced off the 1.3740 level again, and the GDP report itself did not speak in favor of the dollar. That in the first, that in the second case, the deal eventually turned out to be profitable and made it possible to earn almost 50 points, since the price subsequently rose to the level of 1.3814 and bounced off it. The last trading signal to sell could no longer be worked out, although it turned out to be profitable and allowed us to earn about 10 more points. How to trade on Friday: At this time, there is still no trend on the 30-minute timeframe, and the volatility remains low. Since there is no trend, we do not advise beginners to follow the signals on the MACD indicator for some time. For these signals to be relevant, a trend movement is required. The important levels on the 5-minute timeframe are 1.3708, 1.3740, 1.3814, 1.3830 - 1.3833, 1.3852. We recommend trading on them on Friday. The price can bounce off them or overcome them. As before, we set Take Profit at a distance of 40-50 points. At the 5M TF, you can use all the nearest levels as targets, but then you need to take profit, taking into account the strength of the movement. When passing 20 points in the right direction, we recommend setting Stop Loss to breakeven. Novice traders may not look into the calendar of macroeconomic events on October 29, because it is empty. Thus, volatility may become lower and movements not as good as on Thursday. Basic rules of the trading system: 1) The signal strength is calculated by the time it took to form the signal (bounce or overcome the level). The less time it took, the stronger the signal. 2) If two or more deals were opened near a certain level based on false signals (which did not trigger Take Profit or the nearest target level), then all subsequent signals from this level should be ignored. 3) In a flat, any pair can form a lot of false signals or not form them at all. But in any case, at the first signs of a flat, it is better to stop trading. 4) Trade deals are opened in the time period between the beginning of the European session and until the middle of the US one, when all deals must be closed manually. 5) On the 30-minute TF, using signals from the MACD indicator, you can trade only if there is good volatility and a trend, which is confirmed by a trend line or a trend channel. 6) If two levels are located too close to each other (from 5 to 15 points), then they should be considered as an area of support or resistance. On the chart: Support and Resistance Levels are the Levels that serve as targets when buying or selling the pair. You can place Take Profit near these levels. Red lines are the channels or trend lines that display the current trend and show in which direction it is better to trade now. The MACD indicator consists of a histogram and a signal line. When they cross, this is a signal to enter the market. It is recommended to use this indicator in combination with trend lines (channels and trend lines). Important speeches and reports (always contained in the news calendar) can greatly influence the movement of a currency pair. Therefore, during their exit, it is recommended to trade as carefully as possible or exit the market in order to avoid a sharp price reversal against the previous movement. Beginners on Forex should remember that not every single trade has to be profitable. The development of a clear strategy and money management are the key to success in trading over a long period of time. The material has been provided by InstaForex Company - www.instaforex.com |
| Posted: 28 Oct 2021 02:13 PM PDT Analysis of previous deals: 30M chart of the EUR/USD pair
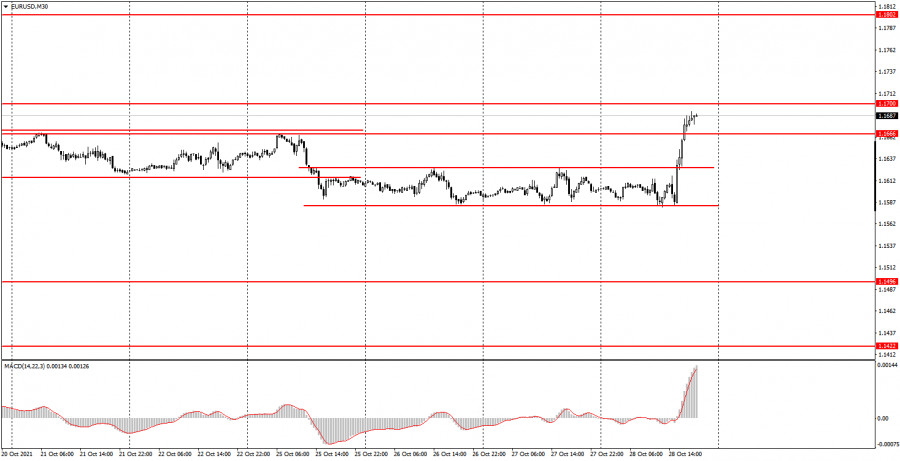
The EUR/USD pair began a strong upward movement on Thursday. The price bounced twice from the lower border of the third consecutive horizontal channel and, having settled above it, rushed further up. Thus, for today the EUR/USD pair has passed about 110 points. However, such a strong upward movement was triggered by strong macroeconomic reports and a strong foundation. Today, one of the most important GDP reports was published in the United States, and besides that, its actual value did not correspond to the forecast at all. And this almost always causes a strong market reaction. The US GDP in the third quarter turned out to be much worse than forecasted, which provoked a strong drop in the dollar. In addition, the European Central Bank today summed up the results of its two-day meeting and announced that in the fourth quarter of 2021 the rate of asset purchases will be reduced, which means, in fact, tightening monetary policy. A tightening almost always causes a strengthening of the currency. Thus, the dollar was falling today, and the euro was rising, which was reflected in the chart of the euro/dollar currency pair with such a powerful upward movement. However, in technical terms, this does not change anything for the pair so far, since it is only one day. The price has just got out of the side channel, so it has not yet reached the trend formation. 5M chart of the EUR/USD pair
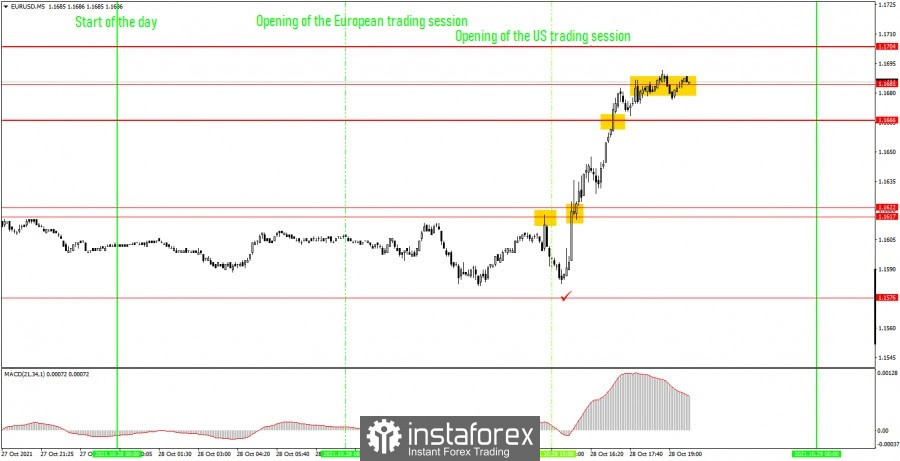
The technical picture looks just fine on the 5 minute timeframe. Today is a good example of how the pair should trade. When the movements are good, and the signals are strong, and profit is obtained from them. Let's take a look at all the trading signals of today. A sell signal was generated first when the price bounced off the level of 1.1617. After that, the price went down 18 points, which was enough to place a Stop Loss order at breakeven. It was on this order that the deal was closed, since the nearest level of 1.1576 was not reached, and it did not come to Take Profit. But already the second deal - consolidating above the 1.1617 - 1.1622 area - was profitable, as the price started a strong movement after the US and European statistics (the time of its release is marked with a tick in the chart) and continued for the rest of the day. The price crossed the 1.1666 level on the way to the level of 1.1685, so long positions should be kept open. And profit should be taken only around the level of 1.1685, since it was not possible to settle above it. As a result, the profit is about 50 points. How to trade on Friday: The pair left another horizontal channel on the 30-minute timeframe, but the trend has not yet come to form. Thus, it is still not very convenient to trade on the 30-minute TF, and we still do not recommend tracking signals from the MACD indicator. We advise you to wait for the formation of a trendline or trend channel. The key levels on the 5-minute timeframe for October 29 are 1.1617 - 1.1622, 1.1666, 1.1685, 1.1704. Take Profit, as before, is set at a distance of 30-40 points. Stop Loss - to breakeven when the price passes in the right direction by 15 points. At the 5M TF, the target can be the nearest level if it is not too close or too far away. If it is, then you should act according to the situation or work according to Take Profit. On Friday, the European Union will publish an important report on inflation for October, but everything will depend on how much the actual value does not correspond to the forecast (3.7% y/y). There will be no important publications and events in America tomorrow. Basic rules of the trading system: 1) The signal strength is calculated by the time it took to form the signal (bounce or overcome the level). The less time it took, the stronger the signal. 2) If two or more deals were opened near a certain level based on false signals (which did not trigger Take Profit or the nearest target level), then all subsequent signals from this level should be ignored. 3) In a flat, any pair can form a lot of false signals or not form them at all. But in any case, at the first signs of a flat, it is better to stop trading. 4) Trade deals are opened in the time period between the beginning of the European session and until the middle of the American one, when all deals must be closed manually. 5) On the 30-minute TF, using signals from the MACD indicator, you can trade only if there is good volatility and a trend, which is confirmed by a trend line or a trend channel. 6) If two levels are located too close to each other (from 5 to 15 points), then they should be considered as an area of support or resistance. On the chart: Support and Resistance Levels are the Levels that serve as targets when buying or selling the pair. You can place Take Profit near these levels. Red lines are the channels or trend lines that display the current trend and show in which direction it is better to trade now. The MACD indicator (14,22,3) consists of a histogram and a signal line. When they cross, this is a signal to enter the market. It is recommended to use this indicator in combination with trend lines (channels and trend lines). Important speeches and reports (always contained in the news calendar) can greatly influence the movement of a currency pair. Therefore, during their exit, it is recommended to trade as carefully as possible or exit the market in order to avoid a sharp price reversal against the previous movement. Beginners on Forex should remember that not every single trade has to be profitable. The development of a clear strategy and money management are the key to success in trading over a long period of time. The material has been provided by InstaForex Company - www.instaforex.com |
| Posted: 28 Oct 2021 02:13 PM PDT Today is a busy day for the euro-dollar pair. The European Central Bank announced the results of the October meeting, Germany reported on the growth of inflation in the country, and the United States - on the growth of the national economy. Such diverse, but at the same time quite important events of a fundamental nature provoked increased volatility for the EUR/USD pair, which has been in a state of suspended animation in recent days.
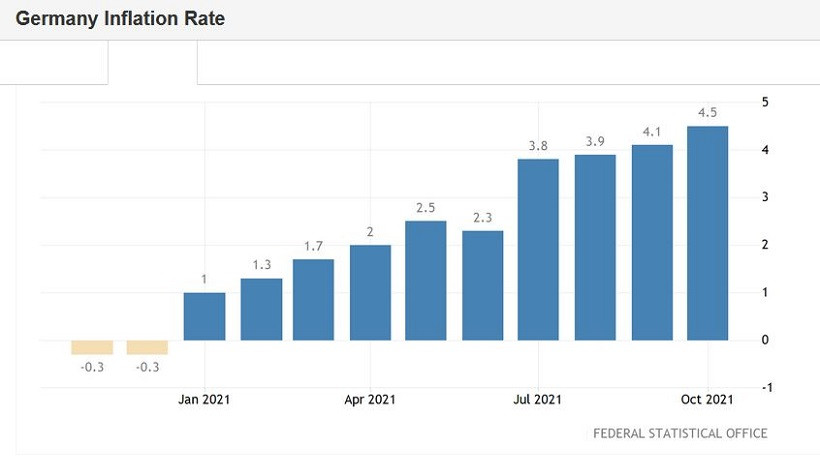
The first emotional decisions of traders were not in favor of the US dollar. At the beginning of the US session, the EUR/USD pair shot up, updating the two-day price high (1.1648). Although just an hour before the upward momentum, the pair updated the week-and-a-half low, dropping to 1.1582. Such price flights are caused by contradictory signals of a fundamental nature. German inflation showed growth, the European Central Bank offset the value of this growth, and the US release completely "redrawn" the fundamental picture, exerting the strongest pressure on the dollar. This hodgepodge eventually turned out to be to the taste of EUR/USD bulls, who organized another corrective counteroffensive. However, will the bulls be able to maintain the set pace? Will they be able to settle above the 1.1670 mark this time (the upper line of the Bollinger Bands indicator on the D1 timeframe), in order to then overcome the resistance level of 1.1710 and settle within the 17th figure? There are no definite answers, even considering the current weakness of the greenback. But let's start with the German statistics. The data released today, which were published simultaneously with the final communique of the ECB, reflected the growth of inflation in Germany. All components of the release were released in the green zone. In annual terms, the overall consumer price index came out at 4.5% with a forecast of growth to 4.4%. This indicator has been consistently growing for 10 (!) months, that is, since January of the current year. On a monthly basis, the indicator also exceeded the forecast values, ending up at 0.5% in October. At the same time, both in September and in August, this component came out at zero. The harmonized consumer price index similarly exceeded forecasts - both in monthly and annual terms. It is worth noting that German data quite often correlates with pan-European data, so we can assume that the October inflation growth in the eurozone will also be a breakthrough – once again.
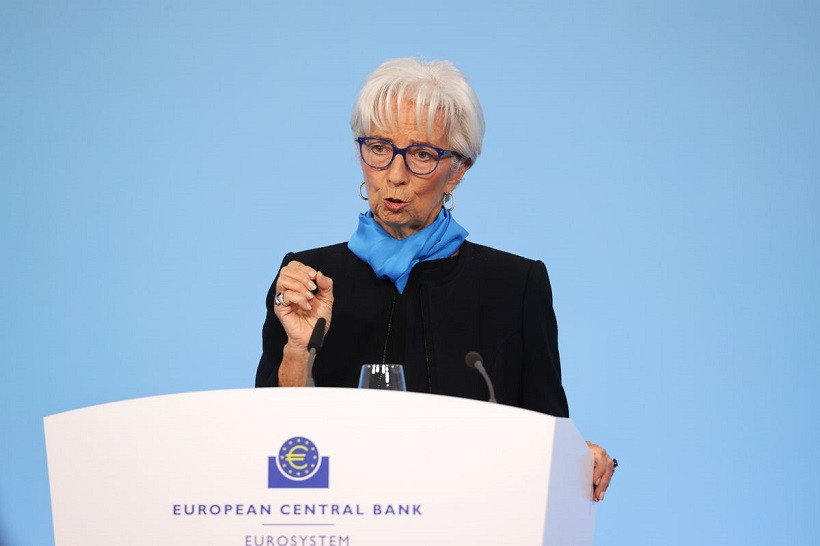
EUR/USD bulls did not have time to take advantage of this fundamental factor. The head of the ECB offset the optimism of traders with her dovish theses. However, ECB President Christine Lagarde did not say anything new – she only refuted the hawkish rumors that were actively exaggerated in the market on the eve of the October meeting. The reason for such conversations was again inflation. Pan-European inflation updated long-term records in September, after which there were suggestions among experts that the ECB might raise the interest rate a little earlier than the designated 2024. Timid assumptions eventually transformed into fairly stable expectations, which provided background support for the euro. However, today Lagarde put a bold end to this correspondence discussion. She stated that "market expectations of a rate hike are at odds with the views of the central bank itself." Actually, this phrase (almost verbatim) was voiced not so long ago by the ECB's chief economist Philip Lane, commenting on the increasing hawkish expectations. But the market reacted weakly to his words, apparently hoping for a "hawkish surprise" from the central bank. But there were no surprises: Lagarde is still a supporter of the accommodative policy, as are most members of the Board of Governors. Speaking at a press conference, she stressed that the slowdown in PEPP purchases "is not a curtailment of incentives." As for inflationary trends, Lagarde also demonstrated "Nordic composure" here. On the one hand, she acknowledged that the phase of inflationary growth "will last longer than originally expected." But on the other hand, she reiterated the thesis that current trends are due to temporary factors, and medium-term inflation is still below the two percent target. In other words, Lagarde once again made it clear that the latest inflation releases will not encourage the members of the central bank to tighten the parameters of monetary policy. This is the key message of today's meeting. The growth of the EUR/USD pair following the results of the October ECB meeting can in no way be correlated, in fact, with the results of this meeting. Lagarde did not sound any hawkish signals – she only stated the fact that the increase in inflation will last longer than previously expected. The pair's upward momentum is due only to the weakness of the dollar, which reacted to the failed data on the growth of the American economy in the third quarter.
US GDP grew by just 2 percent after growing by 6.7% in the second quarter. At the same time, most of the analysts surveyed expected the indicator to grow by 2.8% in the third quarter. Such weak results offset the optimism of dollar bulls regarding a possible increase in the Federal Reserve's interest rate next year. In addition, there have already been suggestions in the market that the central bank may delay the curtailment of QE until December of this year. Against the background of a darkened fundamental background, the US dollar index began to dive down, reflecting the general weakening of the US currency. The EUR/USD pair was no exception: the greenback is also losing its position here, allowing the euro to develop a corrective offensive. Even despite the dovish results of the October ECB meeting. Thus, given such a contradictory fundamental background, there is no need to hurry with trading decisions on the EUR/USD pair. At the moment, bulls are testing the resistance level of 1.1680 (the upper line of the Bollinger Bands indicator on the daily chart), however, in order to consolidate success, they need not only to settle above this target, but also to overcome the resistance level of 1.1710 (the Tenkan-sen line on the weekly chart). In the wake of the general weakening of the greenback, EUR/USD bulls may approach the borders of the 17th figure – but whether they will gain a foothold above 1.1710 is an open question. Therefore, it is most expedient to take a wait-and-see attitude for the pair now, watching the emotional battles of traders from the side. The material has been provided by InstaForex Company - www.instaforex.com |
| Wave analysis of GBP/USD for October 28: U.S. GDP in third quarter disappoints Posted: 28 Oct 2021 11:32 AM PDT |
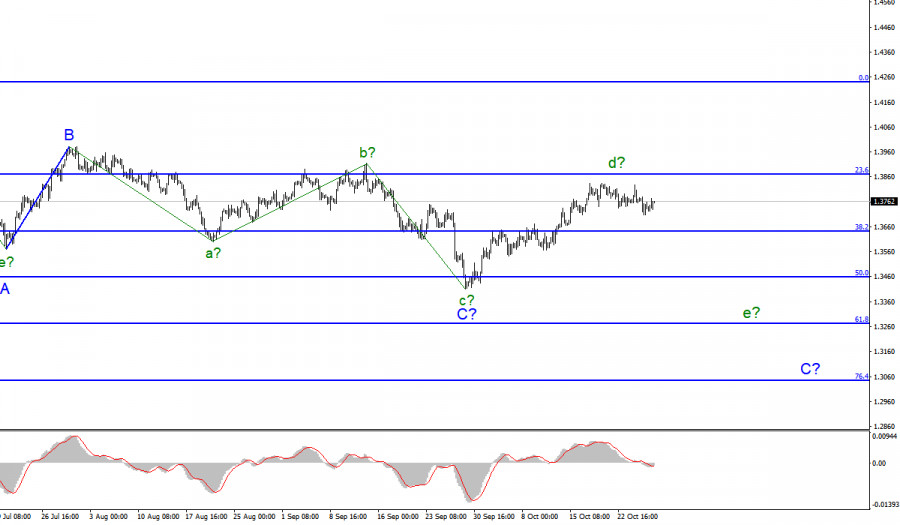
| Wave analysis of EUR/USD for October 28: ECB leaves PEPP program and key rate unchanged Posted: 28 Oct 2021 11:04 AM PDT |
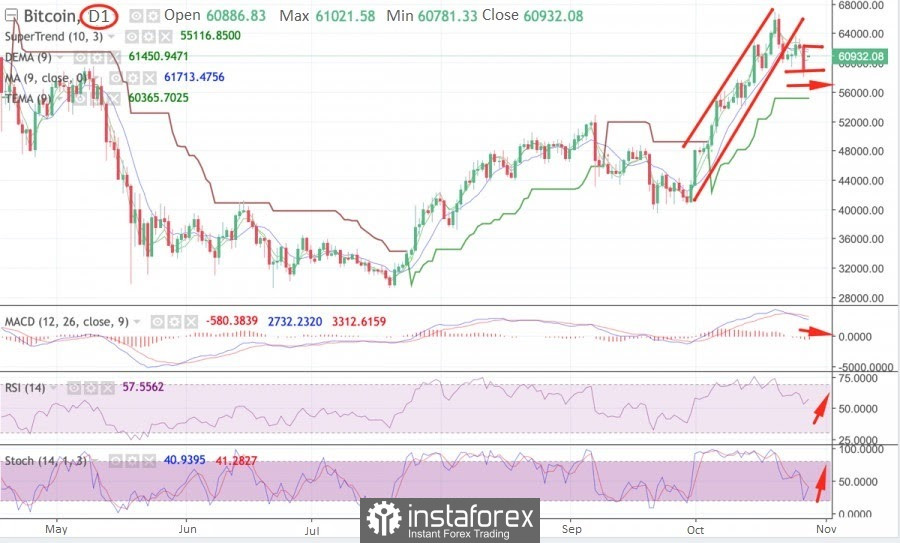
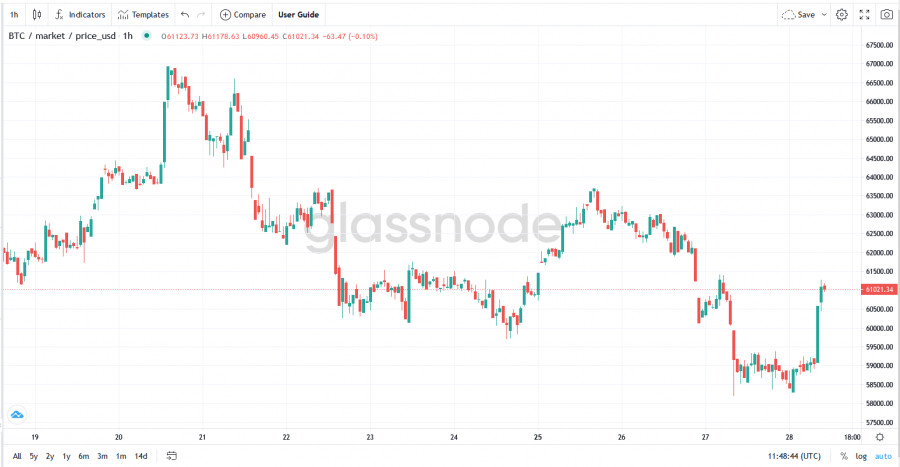
| Bitcoin: The battle for the $60,000 level continues. Will the fall be redeemed? Posted: 28 Oct 2021 10:43 AM PDT After dropping to $58,000 on Wednesday, Bitcoin starts to look better and encouraging on Thursday. But don't jump to conclusions. An important psychological and technical level of $60,000 per bitcoin is being traded. The battle for it is still going on, and how it will end is still unclear. But most of Wednesday's fall has been bought back. On Thursday, the redemption of the bottom became known from El Salvador. They love this tactic. And other participants, too, probably connected. Hints of a possible bullish engulfing formation look encouraging in this situation. And if this pattern is formed, it will be possible to think about further growth. Head and shoulders pattern has not lost its relevance Yes, Thursday's daily candle calls into question anchoring below the $60,000 horizontal. But, it's not over yet. However, Thursday's growth does not guarantee that the price will not return to this level in the following days. This means that the threat of working out the head and shoulders reversal pattern and a decline in the zone of $55,000 and even $52,000 for Bitcoin has not passed. Yes, the situation is uncertain. It is difficult to make predictions, you have to observe. Market growth is not canceled At any position of the price relative to the level of $60,000 per coin, the bull market remains relevant. The only question is how deep the downward correction will be before the next return to strengthening. As for the medium-term trend, many cryptanalysts agree that Bitcoin has now fulfilled only half of its growth potential. For example, Mitch Klee, guided by the signals of the HODL Ratio (RHODL) indicator, notes that the main cryptocurrency is still far from its potential maximum values that can be reached. The expert notes that RHODL is showing seller depletion. Other sources of this opinion include PlanB, the creator of the Bitcoin Stock-to-Flow model. PlanB believes bitcoin still has six months before the turning point and the market change from bullish to bearish. Three reasons for the fall in BTCUSD It is difficult to consider the current decline as anything more than an ordinary technical correction. A strong "Uptober" is coming to an end, and the update of historical values is a good reason to take some of the profit. So the sales started. In addition, ETF funds were launched, enthusiastic expectations calmed down, traders began to sell on facts , also provoking a correction. Finally, the euphoria of October and skyrocketing growth have traditionally led to a partial loss of vigilance in terms of risk. The estimated leverage ratio on cryptocurrency derivatives exchanges is about to hit an annual high, as we talked about earlier. Note that this reason intensified the market collapse in May: positions with leverage with a slight decrease in prices are quickly taken out, and accounts are closed by margin call. If the fundamental background remains neutral and there is no bad news, the market in general and Bitcoin, in particular, will return to growth. Perhaps from current values, or from $55,000-$52,000. But it is difficult to predict the dynamics locally. It is necessary to observe, and, perhaps, the situation will clear up by the end of the week.
|
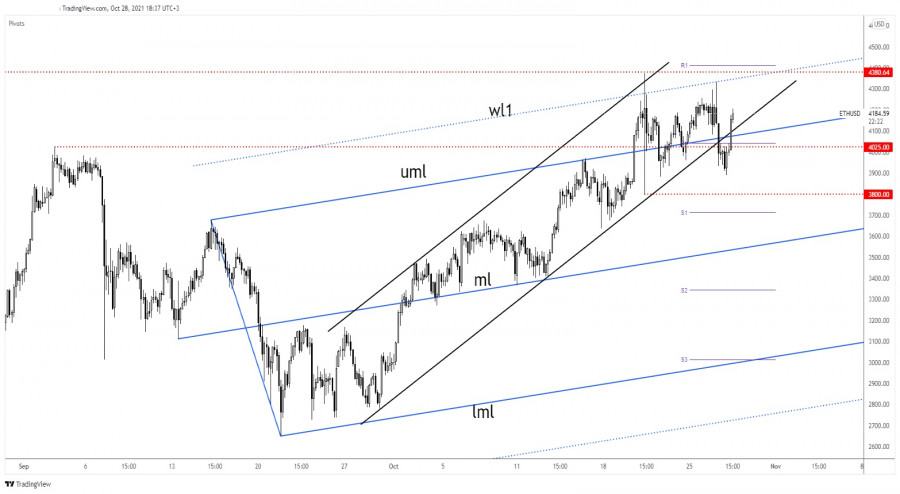
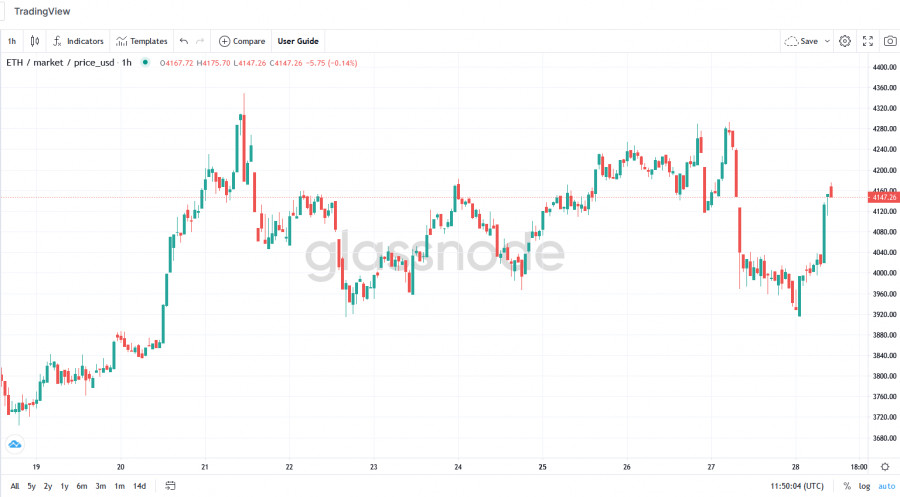
| Posted: 28 Oct 2021 10:04 AM PDT Ethereum registered a strong rally today and invalidated potential deeper drop. It's trading at 4,159 level at the time of writing far above 3,893.16 today's low. Bitcoin's growth helped ETH/USD to come back higher as well. The price of Ethereum registered an 8.06% growth from 3,893.16 daily low to 4,206.89 today's high. In the short term, it moves somehow sideways, we don't have a clear direction. Still, despite the current indecision, ETH/USD maintains a bullish bias. ETH/USD Bullish Momentum!
ETH/USD failed to stay under the broken support levels announcing strong upside pressure. It has found support right above 3,886 former low and now is back above the uptrend line. The crypto is trapped between 4,332.29 and 3,886 levels. The current upside momentum seems very strong, but It's risky to go long here because it's too close to the all-time high of 4,380.64. Technically, failing to stay above the uptrend line and above the upper median line (uml) could announce that we could still have a corrective phase. Ethereum Forecast!You should know that the price of Bitcoin is located right below a strong resistance zone. It remains to see what will happen, BTC/USD's upside continuation indicates that Ethereum could climb higher as well. On the other hand, Bitcoin's drop could signal that ETH/USD could slip lower again. Technically, as long as it stays above 4,025, it could resume its upwards movement. The bias is bullish after failing to make a new lower low, dropping below 3,886. The material has been provided by InstaForex Company - www.instaforex.com |
| October 28, 2021 : EUR/USD daily technical review and trading opportunities. Posted: 28 Oct 2021 09:57 AM PDT
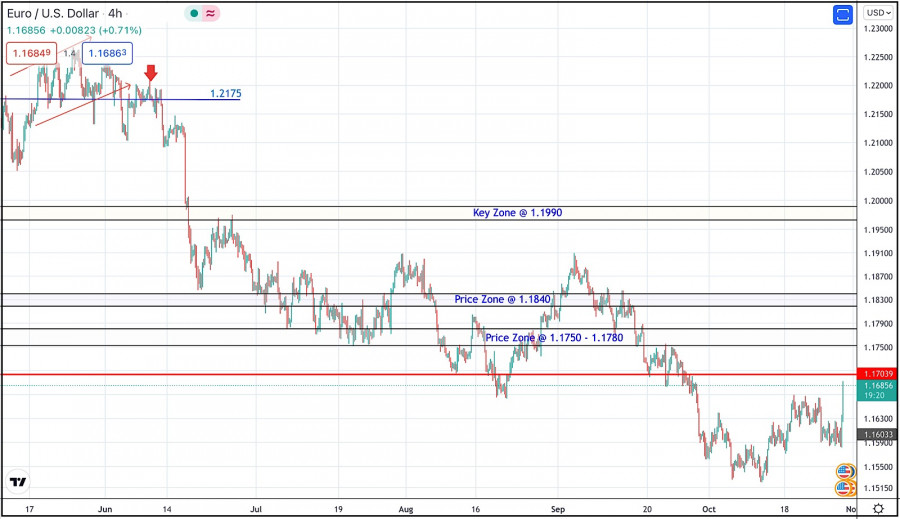
Recently, Persistence below the depicted price zone of 1.1990 indicated further downside movement towards 1.1840 and 1.1780 where a sideway consolidation range was established. During last week, the EURUSD pair has been trapped within a narrow consolidation range between the price levels of 1.1780 and 1.1840. A bullish breakout was executed above 1.1840 shortly after. Temporary Upside pullback was expected towards 1.1990. However, re-closure below the price level of 1.1840 has initiated another downside movement towards 1.1780 which failed to hold prices for a short period of time before significant upside movement was presented into market. Intraday traders were advised to wait for candlestick closure above 1.1780 - 1.1840 for another ascending swing to be initiated. However, immediate downside selling pressure brought the pair down below 1.1700. More downside movement took place towards the price level of 1.1600 where significant buying pressure existed. Bearish persistence below 1.1700 and 1.1600 has enhanced further decline towards 1.1500. Currently, the price zone around 1.1700 stands as a prominent supply-zone to be watched for SELLING pressure and a possible SELL Entry upon any upcoming ascending movement. The material has been provided by InstaForex Company - www.instaforex.com |
| October 28, 2021 : EUR/USD Intraday technical analysis and trading plan. Posted: 28 Oct 2021 09:51 AM PDT
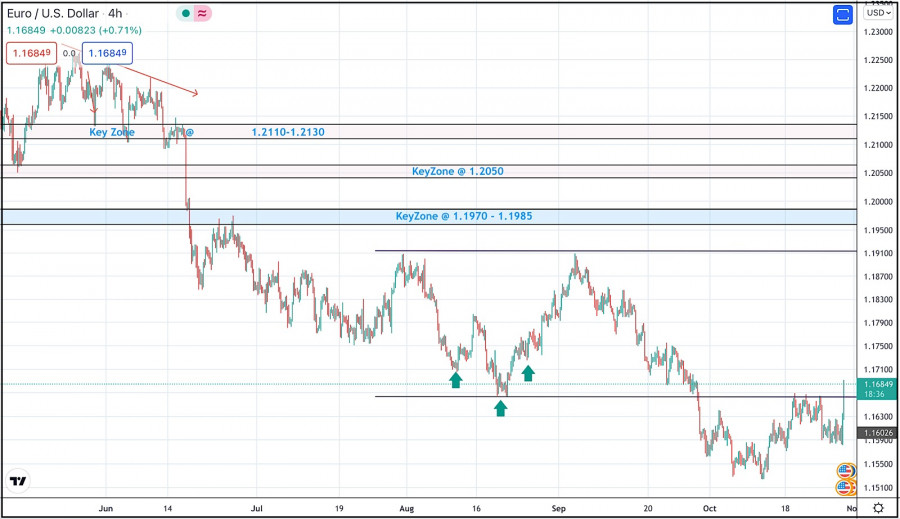
Bearish persistence below the price zone of 1.2050-1.2000 allowed the recent downtrend to be established. So, the EURUSD pair has expressed significant bearish decline while the price level of 1.1650 stood as a prominent demand level that prevented further bearish decline. The bullish pressure that originated around 1.1650 failed to push higher than the price level of 1.1900. That's why, another bearish pullback towards 1.1650 was executed. Bullish signs were expected around the price levels of 1.1650-1.1700 as it corresponded to a recent previous bottom. However, extensive bearish decline has pushed the EURUSD pair towards 1.1600 and lower levels was about to be reached if sufficient bearish momentum was maintained. Moreover, significant bullish recovery has originated recently upon testing the price level of 1.1570. The current bullish pullback towards 1.1650-1.1680 should be considered for bearish rejection and a valid SELL Entry. Initial T/P levels are located around 1.1570 and 1.1530. Bullish persistence above 1.1680 should be considered as an early Exit signal. The material has been provided by InstaForex Company - www.instaforex.com |
| October 28, 2021 : GBP/USD Intraday technical analysis and significant key-levels. Posted: 28 Oct 2021 09:48 AM PDT
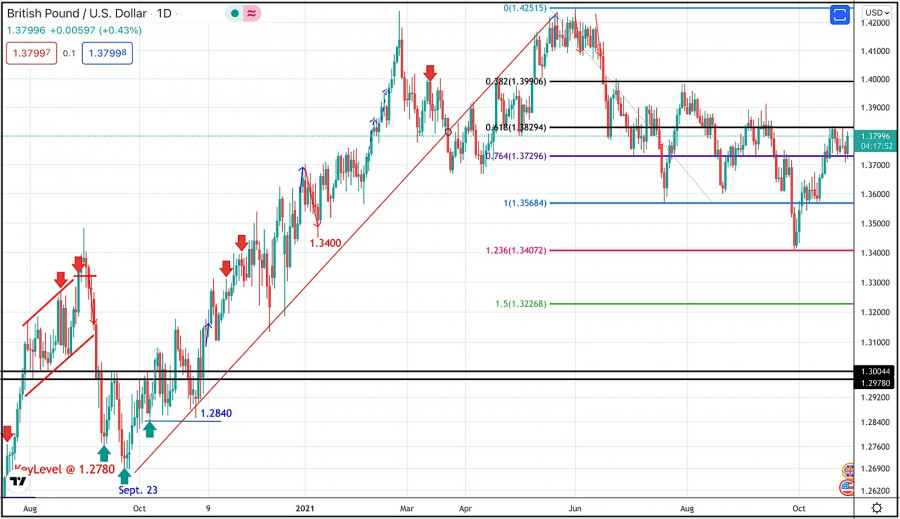
The GBPUSD pair has been moving sideways with some bearish tendency while bearish breakout below 1.3600 was needed to enhance further bearish decline. On the other hand, the nearest SUPPLY level was located around 1.4000 where bearish rejection and a valid SELL Entry was anticipated. The recent bullish rejection witnessed around 1.3600 as well as the temporary bullish breakout above 1.3880 indicated a high probability that this bullish movement may pursue towards 1.4025 then 1.4100. However, the pair remained trapped within a fixed price range until significant bearish momentum emerged into the market. Bearish breakout below 1.3720 enabled further bearish decline towards 1.3560 then 1.3400 which was expected to be reached. Recently, the GBPUSD pair was testing Demand-Zone located around 1.3400 which corresponded to 123% Fibonacci Level of the most recent bearish movement. This was a good entry level for a corrective bullish pullback towards 1.3650 and 1.3720 which was bypassed. Currently, the short-term outlook remains bullish as long as the pair maintains its movement above 1.3730. However, the pair was testing the resistance zone around 1.3830 where some bearish pressure originiated into the market. Bullish persistence above 1.3830 is needed to enable further bullish advancement towards the next Fibonacci Expansion level around 1.3990 On the other hand, another bearish decline below 1.3720 will probably be an indicator for more bearish movement towards 1.3570 as it corresponds to the next Fibonacci Expansion Level. The material has been provided by InstaForex Company - www.instaforex.com |
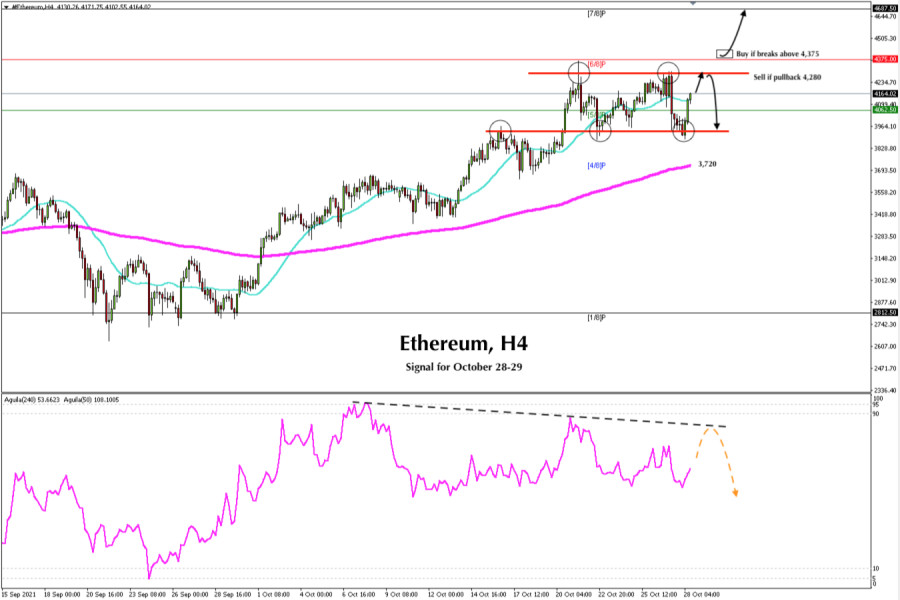
| Trading signal for Ethereum (ETH) on October 28 - 29, 2021: sell below $4,280 (top of range) Posted: 28 Oct 2021 08:27 AM PDT
Ethereum (ETH) is trading within a price range between 4,300 and 3,900. We hope that in the next few hours ETH will continue to oscillate within these levels and could find strong resistance around 4,280. If it fails to break it, there will be a good point to sell as long as it trades below 4,300 and below 6/8 of a murray. As long as it remains above the 3,900 support and above the 200 EMA located at 3,720, Ethereum price is likely to hit new all-time highs. For this, we must expect a daily close above 6/8 of murray (4,375). Thus, the price could rise towards its next target at 4,687 where there is 7/8 of murray and that represents a reversal zone. Conversely, if Ethereum consolidates below the range zone around 3,900, it may fall to the support of the 200 EMA located at 3,720. If this support is broken, ETH could weaken and wait for a drop to the psychological level of 3,000 if the bearish pressure prevails to 1/8 of a murray around the prices of September 26. A decisive daily close above 4,375 (6/8) will confirm that the uptrend is still valid and will give Ether a push towards 4,687 (7/8). The eagle indicator is showing a bullish signal for the next few hours. We must wait for a sharp break from the top of the range to be able to buy. Otherwise, it will be a selling opportunity. Our trading plan is to buy within the range around 3,900 and sell below the top around 4,280. We expect this price swing movement to continue until next week. On the other hand, a sharp break below above these levels could determine the next trend for Ether. Support and Resistance Levels for October 28 - 29, 2021 Resistance (3) 4,375 Resistance (2) 4,207 Resistance (1) 4,062 ---------------------------- Support (1) 3,900 Support (2) 3,750 Support (3) 3,466 *********************************************************** A trading tip for Ethereum for October 28 - 29, 2021 Sell if pullback 4,280 (Top of range) with take profit at 4,062 (5/8) and 3,900, stop loss above 4,375. The material has been provided by InstaForex Company - www.instaforex.com |
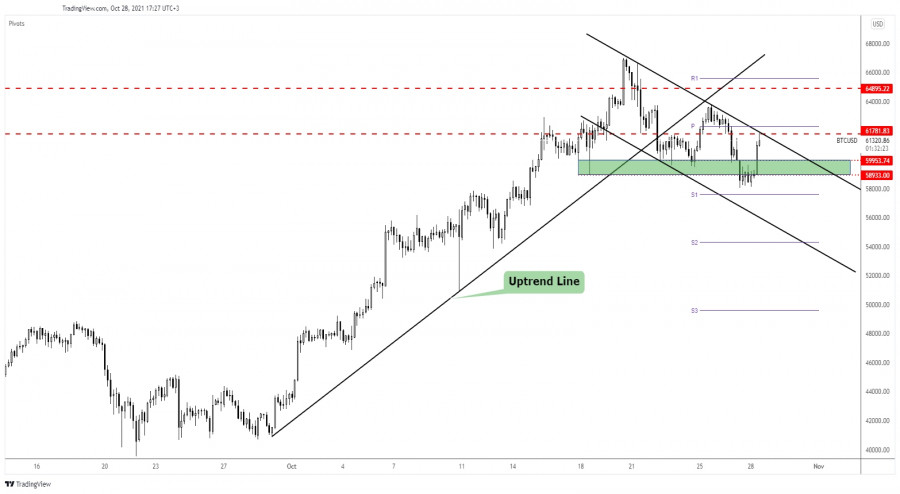
| Bitcoin: attention at resistance! Posted: 28 Oct 2021 08:18 AM PDT Bitcoin rallied after dropping as much as the 58,100.01 level. The crypto has found support around this level and now it has returned higher. It's traded at 61,419 level at the time of writing and is fighting hard to take out strong resistance levels. BTC/USD is into a resistance area. It remains to see how the rate will react. A valid breakout could confirm further growth, while a rejection could signal a new leg down. It has registered a 6.45% growth from 58,100.01 yesterday's low to 61,848.54 today's high. Despite today's growth, the BTC/USD price is still down by 3.69% in the last 7 days. Now, being in a resistance area, well have to wait for a fresh opportunity before taking action again. BTC/USD Down Channel!
As you can see, the price of Bitcoin failed to stabilize under the 58,933 static support and now it has reached the 61,781.83 resistance and the downtrend line. Failing to reach the down channel's support signaled that the rate could come back higher. Technically, we also have a confluence area at the intersection between 61,781.83 and the downtrend line. Making a valid breakout through this confluence area, above these obstacles, could signal further growth and could confirm the channel as a continuation pattern. Bitcoin Prediction!A valid breakout through the confluence area and above the weekly pivot of 62,310.02 could signal that the downside movement, the corrective phase is over. Registering a valid upside breakout from this pattern could activate an upside continuation. On the other hand, registering only false breakouts, a bearish pattern in this resistance area could announce a new leg down. The material has been provided by InstaForex Company - www.instaforex.com |
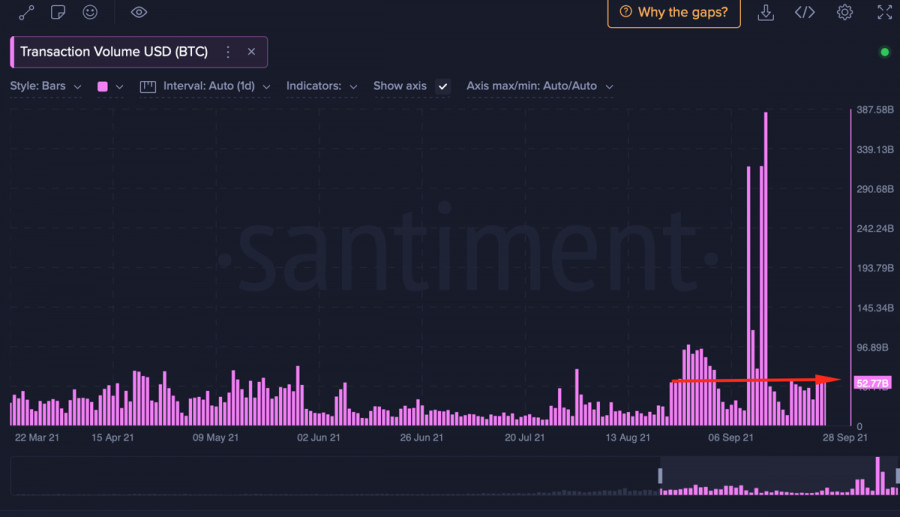
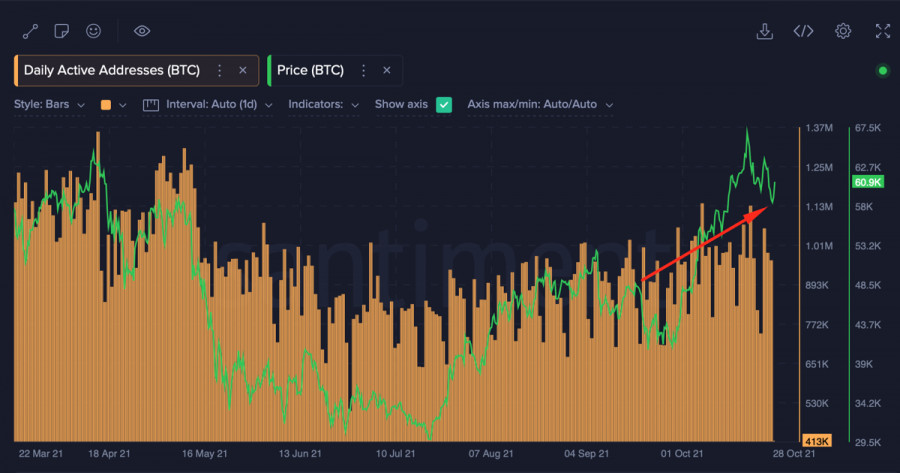
| Learn and analyze: what do Bitcoin on-chain metrics say about further price movement? Posted: 28 Oct 2021 07:39 AM PDT Bitcoin managed to stabilize the situation near the $58.5k mark, after which the price began to move up and as of 12:00 UTC, it is trading around $61k. At the same time, the technical charts of the coin continue to signal local bearish signals. However, such a rapid recovery of the fall suggests that investors are ready to start a bullish rally of the cryptocurrency. In order to assess the market position in relation to BTC, it is necessary to conduct an on-chain analysis of the coin's indicators. First of all, it is worth starting with the main metrics that reflect the audience's interest in bitcoin. To do this, it is worth using indicators of the number of unique addresses and total transaction volumes. Analyzing Daily Active Addresses, it can be concluded that the BTC audience retains bullish sentiments and conducts transactions in the cryptocurrency network. The number of unique addresses continues to remain in the region of 900,000, at the level of a week ago, during the update of the historical record. This indicates that the market continues to count on the resumption of cryptocurrency growth. Similar dynamics are maintained by the volume of transactions in the Bitcoin network, which also remain at the level of indicators of the period of reaching a new maximum. In general, this confirms the high degree of on-chain activity of the audience and readiness for a bullish rally.
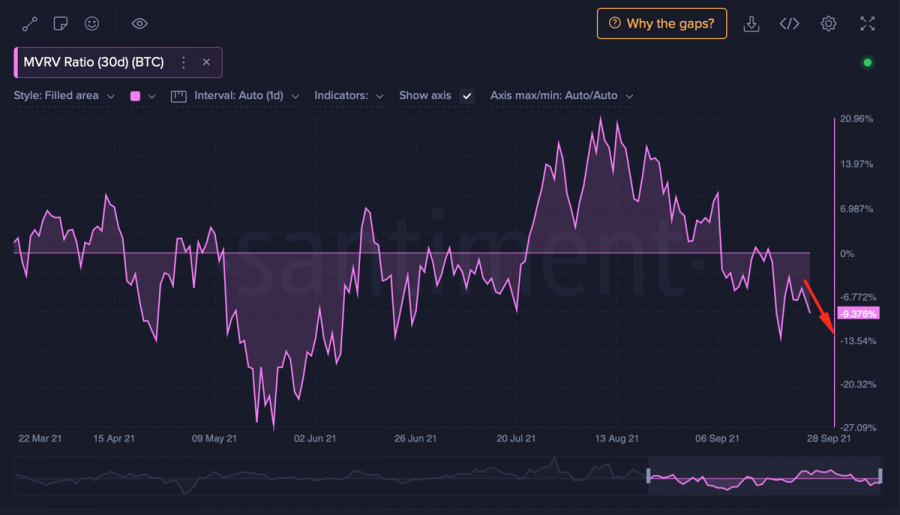
*Learn and analyze Daily Active Addresses is a metric that determines the number of unique addresses in the cryptocurrency network. On-chain activity is the actions of cryptocurrency market players who independently manage their crypto assets, which is why the recording goes directly to the main blockchain. These statistics include both private investors and large companies. MVRV (Market Value to Realized Value) indicator displays the ratio of the market and realized value of a particular cryptocurrency. This metric gives a more objective view of the current value of the coin and the period of the market. The indicator also displays the results of the movement of coins: if the value is below 0, then the players moved coins with a loss, and if it is above 0, then investors have made a profit from operations with coins. Price consolidation is the period when a certain cryptocurrency is within a narrow horizontal price channel. Usually, this process indicates price stabilization or weakness of market participants (buyers and sellers). By balance of addresses is an on-chain metric that allows you to see the growth/decline in the number of addresses with certain wallet balances, as well as track the accumulation trend. Volume of transactions is an indicator that displays the total volumes of transactions performed in the bitcoin network by market participants. Another important metric that reflects the degree of overbought Bitcoin market is the ratio of the market value to the realized value of the coin. According to this metric, the majority of investors are in the red in the coin buying campaign. The 30-day reading is at -9% and continues to decline, which may be a consequence of the recent sell-off due to a sharp drop in prices. Such a low mark of this metric indicates that the market is in the stage of accumulation and recovery. By tracking this indicator, you can determine the beginning of a bull market: the value will cross the zero mark and continue to grow, which will mean an increase in prices and investors' profits.
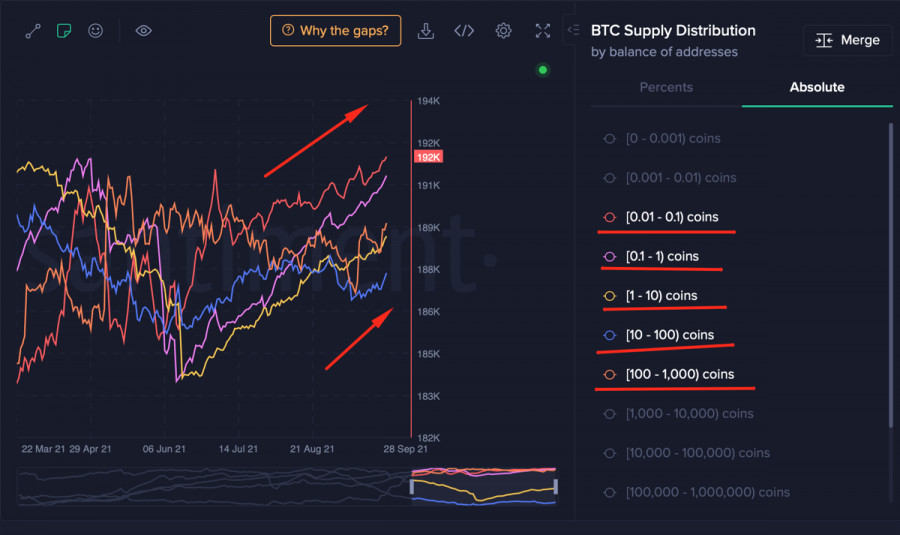
Another important point for determining the current and next stage of the market is the analysis of certain categories of addresses and changes in the balances of their wallets. It is worth noting that, based on on-chain metrics, most of the Bitcoin audience is engaged in the accumulation of coins. Addresses with balances from 0.1 to 10k BTC continue to purchase coins, which is also reflected in the metric of the ratio of the sold to market value of assets. This is a positive and important signal for the market, as it demonstrates traders' faith in further growth. The absence of an impulse sell-off during Wednesday's sharp drop in prices testifies to the maturity of the market and the readiness to resume growth.
Taking into account the fact that the market is completing the stage of accumulation and is gradually moving to the recovery of quotes, it is worthwhile to closely monitor the technical indicators. It is the daily and narrower timeframes that will be the first to signal the start of a full-fledged upward trend. On-chain analysis proves the desire of investors to wait for the growth of bitcoin quotes, and therefore it becomes especially risky to play on a decline. As of 15:00 UTC, entering the asset looks dangerous, but generally a justified undertaking, since there is no doubt about further price growth. The market has proven to be resistant to impulse decisions, which is a defining component of growth.
|
| Trading signal for GBP/USD on October 28 - 29, 2021: buy above 1,3755 (SMA 21) Posted: 28 Oct 2021 07:34 AM PDT
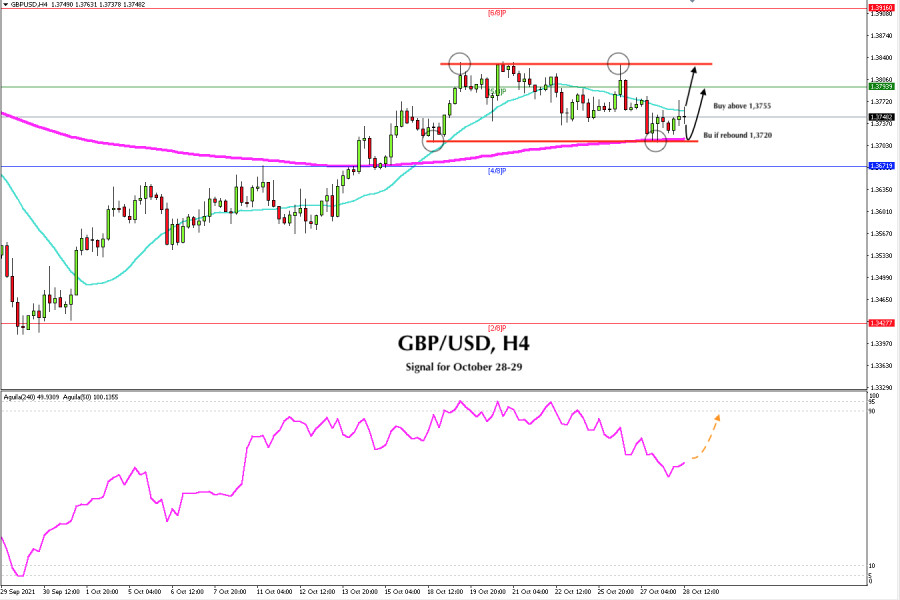
Since October 18, the British pound has been consolidating within a price range between 1.3710 and 1.3830. Yesterday, it came to test the strength of the support of this range. The pair made a technical bounce around the 200 EMA. At this time of writing, if the continued bounce could break above the 21 SMA, it will be a sign of a bullish move to the top of the range around 1.3830. Since September 29, the British pound is moving within an uptrend channel. As long as it remains above this channel and above the 200 EMA located at 1.3703, there is a probability that it will continue its upward movement. This sideways period could be considered a correction for a move towards the 1.3916 level, but first the price should break the top of the range at 1.3830. On the contrary, if the British pound remains under bearish pressure and breaks the 200 EMA around 1.3703 and on daily charts it closes below 1.3690, then it could be a sign of a trend reversal and we could wait for a fall to 1.3671. This will be the last key support and breaking it could accelerate the fall to 1.3427 which is the low of September 29. We believe that the British pound will continue trading within this price range until next week, as the market is watching policy decisions from the Fed regarding its change in monetary policy. Therefore, you can buy and sell within of this range around 1.3720 and 1.3830. After having logged strongly overbought levels and having reached 95 on 3 occasions, the eagle indicator is now around 56 points, hence giving a bullish signal. We could consider this signal to buy the British pound only if it is trading above 1.3755 (SMA 21). Support and Resistance Levels for October 28 - 29, 2021 Resistance (3) 1.3822 Resistance (2) 1.3793 Resistance (1) 1.3765 ---------------------------- Support (1) 1.3706 Support (2) 1.3671 Support (3) 1.3639 *********************************************************** A trading tip for GBP/USD for October 28 - 29, 2021 Buy if breaks above 1.3755 (SMA 21) with take profit at 1.3793 (5/8) and 1.3830, stop loss below 1.3715. The material has been provided by InstaForex Company - www.instaforex.com |
| Bitcoin and Ethereum: Antifragility of the crypto industry boggles the mind Posted: 28 Oct 2021 07:06 AM PDT The whole world does nothing but talk about cryptocurrencies, and this is not only a new wave of FOMO but also a new stage in the formation of the crypto industry. Antifragility in all its colors: the crypto market is constantly being restricted, but it continues to grow, gaining widespread popularity of users, forcing regulators to work shoulder to shoulder with it. The recently approved Bitcoin ETF, as well as the change in SEC policy, are proofs. In fact, regulators are trying not only to take full control of the new area of finance but also to use it to their advantage. Recently, the chairman of the United States Federal Deposit Insurance Corporation (FDIC), Jelena McWilliams, said during the Money 20/20 conference that American regulators are focused on creating clear guidelines for regulating banks' interaction with the crypto industry. It should be understood that regulation is not so bad. The emergence of a regulatory framework is better than a widespread ban, which will ultimately harm the new industry. In my analytical reviews, I have repeatedly written about the intentions of payment systems to adapt their technical processes to cryptocurrency. So, the payment giant Mastercard announced that it will soon announce support for cryptocurrencies in its network. This will give banks and merchants the opportunity to integrate cryptocurrencies into their products. We are talking about bitcoin wallets, credit and debit cards for accruals in cryptocurrencies, as well as loyalty programs, in which points can be converted into digital assets. In fact, we are on the verge of mass adoption of cryptocurrencies in everyday life. Against such a positive background, Tesla, in a report to the US Securities and Exchange Commission, hinted that it may soon resume the practice of accepting cryptocurrency as a means of payment for its products. Let me remind you that last time it became leverage for buyers, which led to the ubiquitous cryptocurrency market.
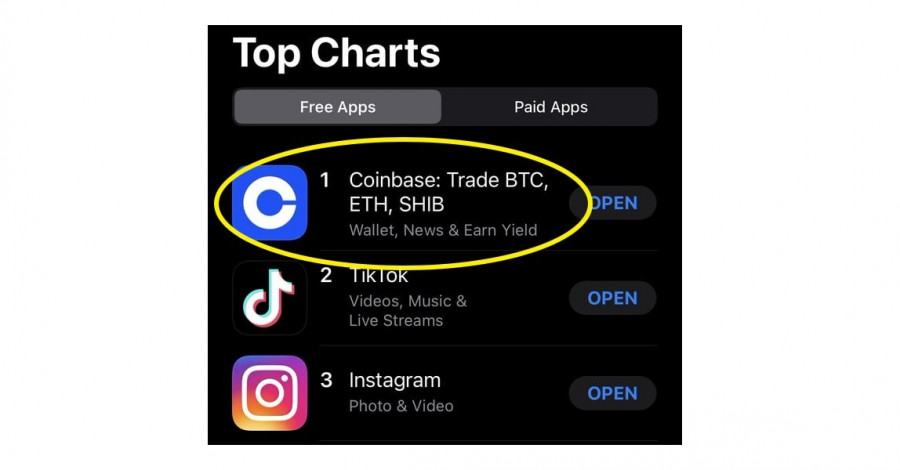
What is happening on Bitcoin and Ethereum trading charts? Last week, Bitcoin managed to update its all-time high, reaching the price level of $67,000. This is an absolute record since the existence of the first cryptocurrency. The excitement is so great for cryptocurrencies that the app of the leading crypto-exchange COINBASE has climbed to number one in the Top Charts of the App Store.
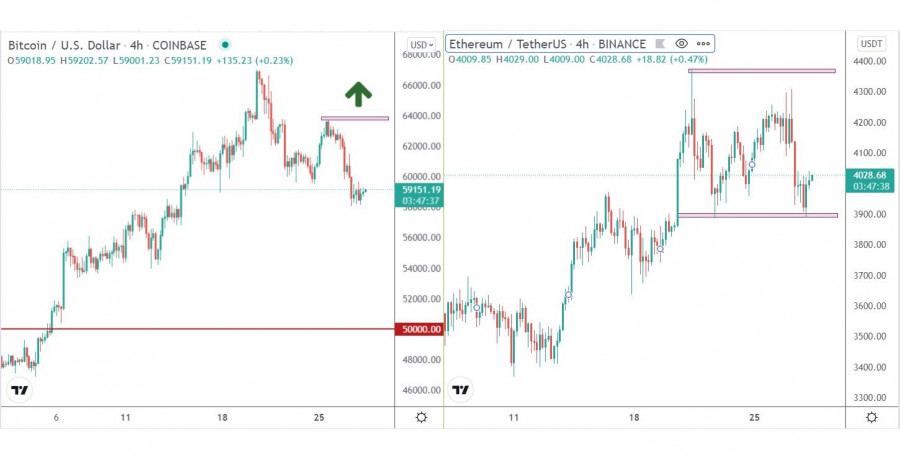
This signals that we are on the wave of FOMO* (loss of profit syndrome*), which is good for cryptocurrencies' growth, but at the same time, it can portend big corrections in the market. At the moment, we already have signs of a correction after the update of the all-time high, but the bullish excitement persists in the market. At this stage, long positions are still considered if the price is held above $64,000. This will result in updating the $67,000 high. As for Ethereum, a local breakout of the historical maximum of May 12 was noticed, but the quote managed to overcome it by only a few dollars. After that, a rollback occurred with the formation of a flat in the 3,888/4,375 range. In fact, there is no correction, and market participants are still aiming at updating the highs. In this situation, the most appropriate strategy is considered to be a breakout of one or another border of the established range. In the case of considering the upper border, we are talking about the prolongation of the upward trend, where there is a high chance of touching the next psychological level of $5,000.
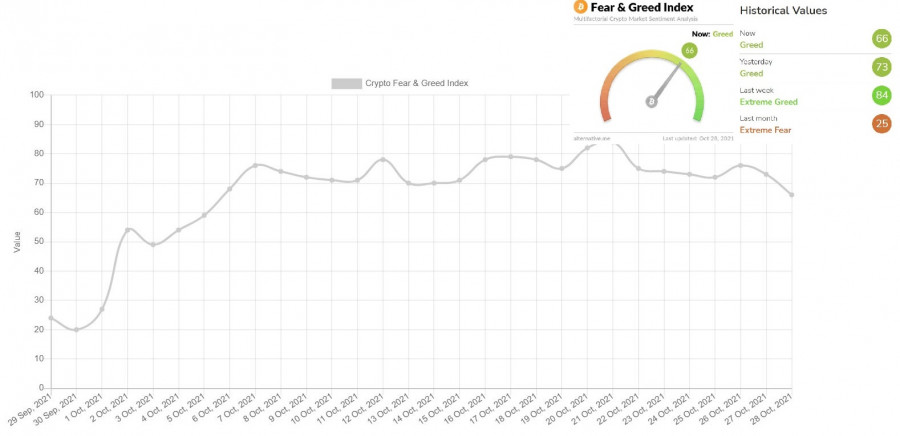
The index of emotions (aka fear and greed) of the crypto market is at the level of 66 points, which is slightly below the FOMO level. This is due to the corrective move in Bitcoin.
|
| Posted: 28 Oct 2021 06:42 AM PDT
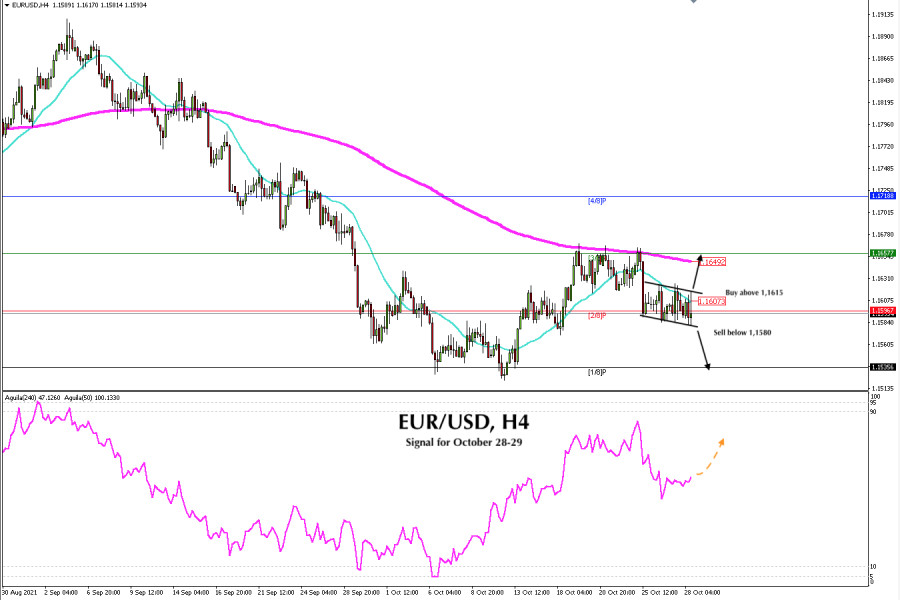
Since October 25, EUR/USD has been trading within a range of about 40 pips. A breakdown and consolidation above or below either border could define the trend of the euro for the next few days. EUR / USD is vulnerable to bearish pressure below the 200 EMA located at 1.1650. Around this zone, any unsuccessful breakout attempts will be an opportunity to continue selling the euro. In the meantime, we expect the euro to break out of the range to be able to open either buy or sell positions. A sharp break above the 200 EMA (1.1649) and above the 3/8 Murray (1.1657) could be the start of a bullish move and the euro could rally to the zone of 1.1718. There is 4/8 of a murray and this level represents very strong resistance. On the other hand, if the euro continues a consolidation below the 21 SMA and below the 2/8 murray, we should expect a consolidation around 1.1580. Then, it will be a sign that the bearish force is prevailing and we can sell the pair with targets up to 1.1535. This level is the support of 1/8 of murray and the swing low of October 12. Our forecast is bullish according to the eagle indicator that is showing a positive signal. For this, we should wait for a break of the top of the range and a consolidation above the 21-moving average. Then, we will be able to buy above 1.16 15 with targets up to 1.1650 where the EMA of 200 is located. Support and Resistance Levels for October 28 - 29, 2021 Resistance (3) 1.1661 Resistance (2) 1.1643 Resistance (1) 1.1627 ---------------------------- Support (1) 1.1578 Support (2) 1.1560 Support (3) 1.1529 *********************************************************** A trading tip for EUR/USD for October 28 - 29, 2021 Buy if EUR/USD breaks above 1.1615 (zone of range) with take profit at 1.1649 (EMA 200), stop loss below 1.1580. The material has been provided by InstaForex Company - www.instaforex.com |
| El Salvador buys another 420 bitcoins, Stablecoins poses threat to the American economy Posted: 28 Oct 2021 06:20 AM PDT While the Bitcoin and Ether exchange rate went on a slight correction, and the expectations of speculative traders for updating historical highs have decreased, the authorities of El Salvador said that they continued to acquire the first world cryptocurrency and do not intend to stop there. In addition, the speech of the director of the U.S. Consumer Financial Protection Bureau, Rohit Chopra, on the topic of the risks that stablecoin carries draw attention. Let's deal with it all.
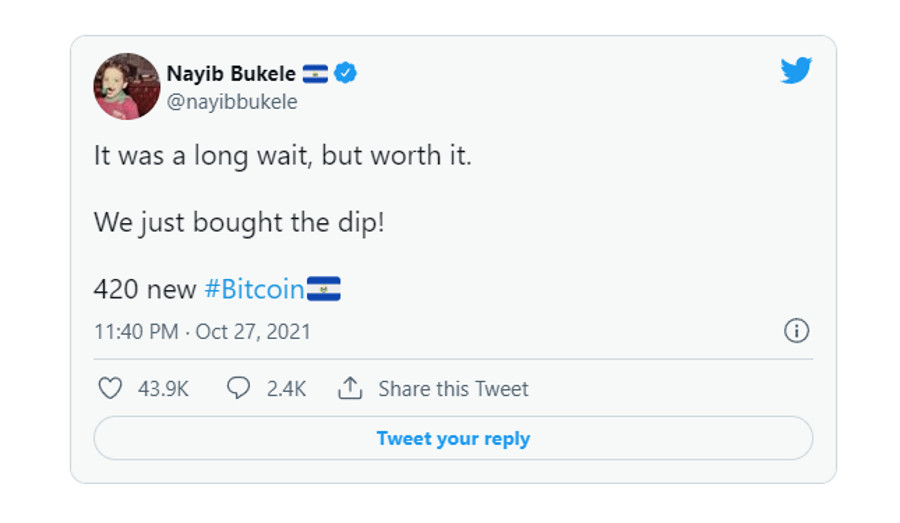
El Salvador adds 420 new BTC According to recent reports, El Salvador has bought another 420 bitcoins, taking advantage of the recent price drop. The President of El Salvador, Nayib Bukele, wrote about this on Twitter. At the moment, the authorities own 1,100 coins in total. On September 6, Bukele announced the first purchases of bitcoin and said that it is equated to the national currency. Since September 7, bitcoin has become legal tender along with the dollar. However, not everyone considers Bukele's act to be correct, and there are quite a few skeptics who are sure that this kind of "trick" can cost El Salvador dearly. More specifically, $ 1.3 billion, which they could lose due to different views with the International Monetary Fund. However, according to the President of the Central Bank of El Salvador, the first-of-its-kind implementation of Bitcoin in El Salvador is not an obstacle for the government to reach the above loan agreement. According to the President of the Central Bank Douglas Rodriguez, at present, the cryptocurrency has almost lost its reputation as a speculative asset and will very soon prove its use as a legal and alternative payment system. He also expects that due to the high volatility of Bitcoin, the country's economy could add about 9.0% this year. "We don't see any risks. The only risk is the risk of bitcoin growth, which is associated with making a profit," said Rodriguez during a virtual meeting in San Salvador. As a reminder, news broke this week that El Salvador's digital Bitcoin wallet Chivo has removed the pricing feature that allowed users to quickly profit from trades. This decision was made in order to minimize speculation with the world's largest cryptocurrency.
Stablecoins are a threat to the economy Stablecoins pose risks to the financial system as more technology and payment companies use or plan to use digital currencies that are not regulated by anyone, according to Chopra. In his speech for the first time to Congress since taking over the CFPB, he said the bureau will analyze and collect data on how companies like Facebook Inc. plan to use the tokens. This is part of a larger program aimed at researching how tech giants collect and use consumer data. "Stablecoins are right now primarily used for speculative purposes," Chopra said during a House Financial Services Committee hearing. "But, if cryptocurrencies are to be embedded in large social networks or tech companies, it's even scary to imagine what it can scale into quickly." Chopra's speech consisted of criticism of Facebook Inc, which recently reiterated its desire to issue its own token, which was met with harsh backlash from regulators. The authorities are alarmed by the rapid growth of stablecoins, a market that is already $131 billion and which is critical for the crypto industry. One of the things that officials fear the most is the sudden, unregulated surge in public adoption of tokens that big tech companies like Facebook Inc. Note that Facebook's latest attempt to create its own Diem token failed under pressure from the regulator. Mastercard recently decided to give banks access to cryptographic credit and debit cards. Mastercard Inc. signed a deal with crypto firm Bakkt, which will make it easier for crypto wallet owners to spend their funds. Chopra also said that the CFPB is one of several agencies that are concerned about systemic risks. A group of officials that are part of the President's Working Group on Financial Markets is expected to release a report this week outlining their recommendations for token regulation.
As for the technical picture of Bitcoin Wednesday's head-and-shoulders pattern is now being tested for strength and a breakdown of support at $59,400 with subsequent consolidation below may lead to a larger downward correction of the trading instrument to the $54,444 area, and then to a low of $50,900. At the moment, the 200-day moving average is in the 45,000 area. It is possible to speak of a return of interest in Bitcoin after it has gone beyond $59,400, as well as after consolidating above the resistance of $62,800, which will open a direct road to the historical maximum in the $66,500 area.
As for the technical picture of the Ether The downward movement from historical highs, which were just a few steps short of updating, does not yet indicate the full-scale development of the bear market. This is nothing more than a technical correction. Even if we fall into the area of $3,600 and update $3,405, such a development of the situation will not yet lead to a reversal of the bull market on the Ether. The main task of buyers is to maintain control above $3,950. In this case, a return of $4,367 is provided in the near future. The material has been provided by InstaForex Company - www.instaforex.com |
| Strong reports fail: US indices down Posted: 28 Oct 2021 06:11 AM PDT
Overall, the US stock market sank and the indicators fell considerably compared to previous values reached the day before. Thus, the S&P 500 lost ground and went down 0.51%, the Dow Jones Industrial Average lost 0.74%, while the NASDAQ Composite remained unchanged Indices showed gains amid companies' positive financial reports as investors thought that strong reports indicated that the companies could overcome the supply problems, inflation and economic growth that the markets faced in September. All these factors contributed to negative investor sentiment. However, positive companies' reports had a beneficial effect on traders' behavior. Currently, 30% of the companies that make up the S&P 500 indicator have already released their reports for the third quarter. Notably, the profit of 82% of these companies has exceeded experts' forecasts. Positive reports have a strong impact on major indices growth. At the same time, according to the statistics released yesterday, the number of US durable goods orders declined by 0.4%. The indicator showed 1.3% gain last month. Experts predicted that it would drop by 1.1% due to supply problems. Energy and financial companies suffered the most due to the decline of stock indicators . Thus, the energy sector of the S&P 500 plunged by 2.9%. This is the largest decline among all 11 indicator sectors. WTI oil futures were down 2.4% to $82.66 per barrel. McDonald's stocks gained 2.7% on news of its US sales growth. Coca-Cola's shares added 1.9% as its actual earnings exceeded analysts' forecasts. Robinhood Markets's stocks went down 10% as the company reduced its profit by 35% in the third quarter compared to the second quarter. Shares of Twitter Inc. lost 10.8% despite the company's positive report in the third quarter. General Motors' shares fell by 5.4% due to a 40% drop in its profit last quarter. However, the company provided a positive outlook for its annual report. Shares of Alphabet Inc. gained 5%, boosted by a 68% increase in revenue last quarter and a 41% increase in the company's earnings. Intel Corp. shares were down 0.8%. The board members bought up the company's stocks worth $2.5 million. Despite a 44% increase in earnings and a 22% increase in revenue in the third quarter, Texas Instruments Inc. shares fell by 5% as the report did not match analysts' forecasts. Microsoft Corp.'s shares gained 4.2% due to its higher profits. Harley-Davidson Inc. increased its profit by 17%, having a positive effect on its stocks. They rose 3.6% in value. Notably, European and Asian stock markets also show a decline. Thus, the STOXX Europe 600 indicator fell by 0.4%, the Shanghai Composite and Hang Seng lost 1% and 1.6% respectively. The material has been provided by InstaForex Company - www.instaforex.com |
| Posted: 28 Oct 2021 05:35 AM PDT
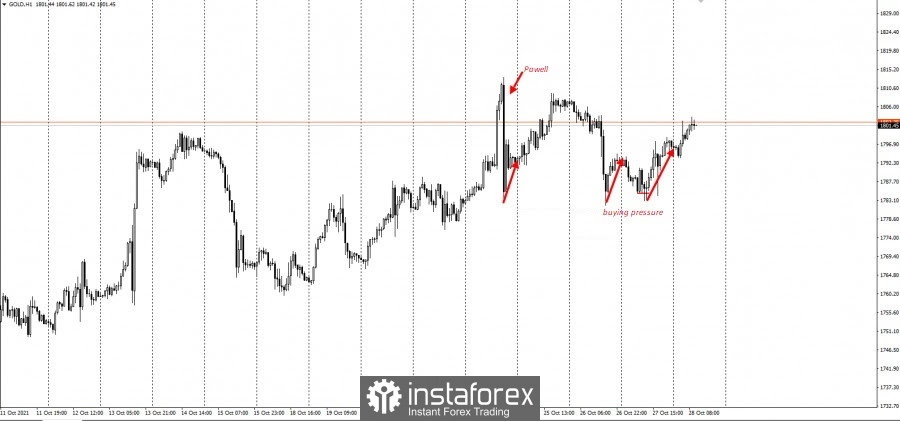
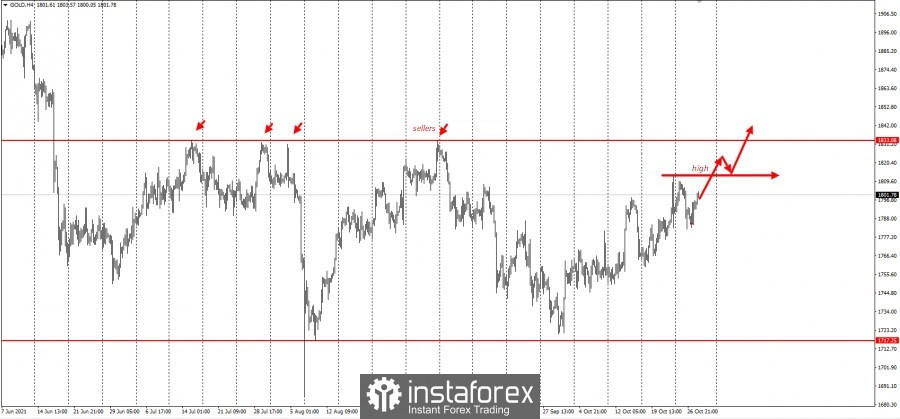
Quite a lot of traders have been buying off gold in the past four days.
This forced sellers to set their stop loss at 1813, while some, the more ambitious ones in particular, placed it at 1833.
Both cases post uncertainty in gold, especially since many rushed to sell last Friday, after Powell announced that the Fed is considering the termination of its QE program. Despite that, it is better to refrain from taking short positions, at least until a false breakdown in 1833. It is also better to wait for opportunities to work for increases to the indicated levels. This analysis is based on Price Action and Stop Hunting strategies. Good luck and have a nice trading day! The material has been provided by InstaForex Company - www.instaforex.com |
| Crypto fever: bitcoin tumbles, altcoins gains up to 70% Posted: 28 Oct 2021 05:16 AM PDT On Wednesday, the digital assets sector closed the trading session with a sharp drop in the value of the leading virtual coins Bitcoin and Ethereum. Thus, BTC dropped to $60,000, and ether fell to $4,000.
Experts believe that the reason for such huge losses lies in the active use of borrowed funds by traders. This means that in the near future, some of the top 10 cryptocurrencies in terms of market capitalization may lose about 15% of their value daily. Amid such high volatility of virtual currencies, market experts warn of high risks in case traders dedicate most of their investment portfolio to digital coins. At the same time, they argue that making money on cryptocurrencies is quite simple, but losing an impressive amount of equity capital is even easier. This advice is especially relevant to investors who are targeting short-term cryptocurrency trading strategies and avoid the buy-and-hold option. However, those who prefer long-term trading, may not worry about the recent drop in the first cryptocurrency. When in doubt, market analysts recommend focusing on the events of 2017, when bitcoin collapsed by 80% in some trading sessions. The altcoin market shows even more unpredictable results this week. Thus, on Wednesday, the price of the Shiba Inu cryptocurrency jumped to 70%. Against this background, its main competitor, the Dogecoin token, lost its honorable ninth place in the ranking of the ten leading cryptocurrencies. At the same time, DOGE did not want to give up. In the early trading session on Thursday, it soared by 40%. In just a couple of hours, the cryptocurrency won back its ninth place in the ranking and came close to its two-month high. The Dogecoin trading volume increased by 300% per day, and its market capitalization turned out to be above $40 billion. Although the SHIB coin continues to gain in value following a significant correction, its market capitalization is still below $30 billion. According to the results of the last week, the price of Shiba Inu soared by 130% (by 645% per month), while DOGE added only 20%. Supporters of the Shiba Inu cryptocurrency continue to believe that Robinhood, a well-known trading platform, will soon include the coin in the list of virtual assets available to customers. If this happens, the popularity and trading volume of this altcoin will considerably increase, thus providing the cryptocurrency with a strong driver for further growth. Market experts attribute such a spectacular rally of the DOGE and SHIB meme coins to the fact that after Shiba Inu's upward movement, traders decided to move funds to the weaker Dogecoin, which is currently trading 55% below the May high. By the way, another popular joke cryptocurrency, the Floki Inu altcoin, named after Tesla CEO Elon Musk's pet dog, has surged by more than 120% over the past 24 hours. Cryptocurrency market experts warn that meme coins are a rather speculative asset, and their price is highly volatile and directly depends on rumors, gossip, and tweets of famous people rather than on complex market processes. The material has been provided by InstaForex Company - www.instaforex.com |
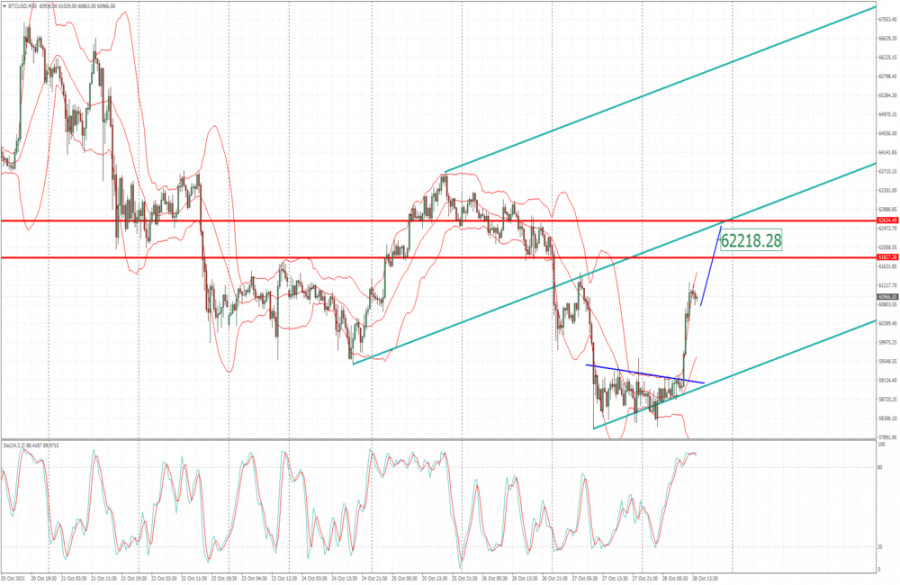
| BTC analysis for October 28,.2021 - Buyers in control Posted: 28 Oct 2021 04:57 AM PDT Technical analysis:
BTC has been trading upside today and I see further upside continuation towards the Pitchfork Middle lane... Trading recommendation: Due to strong upside momentum today, I see potential for the further upside continuation. Watch for buying opportunities on the pullbacks with the downside target at the price of $62,200. Stochastic oscillator is showing overbought reading but with no evidence for the reversal. Intraday support is set at the price of $60,370 The material has been provided by InstaForex Company - www.instaforex.com |
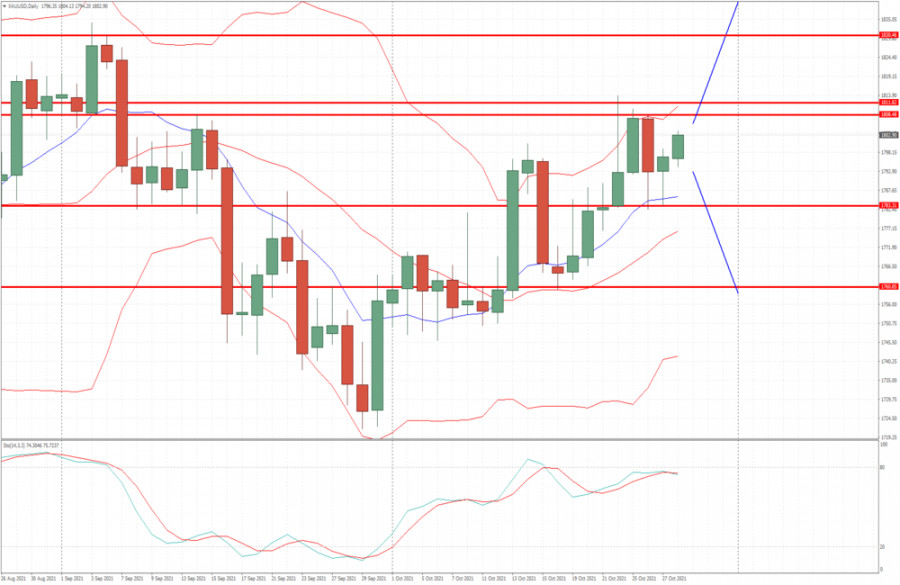
| Analysis of Gold for October 28,.2021 - Inside day formation. Watch for the breakout.... Posted: 28 Oct 2021 04:51 AM PDT Technical analysis:
Gold has been trading sideways in last few days and I see inside day formation. Watch for the breakout to confirm further direction.... Trading recommendation: Due to inside day formation on the daily, watch for the breakout of the pivot high or pivot low to confirm further direction. Upisde breakout of the resistance at $1,810 can confirm upside movement towards $1,830, in that case watch for buying on the dips... Downside breakout of support at $1,783 can confirm drop towards $1,760 and in that case watch for selling on the rallies after the breakdown... The material has been provided by InstaForex Company - www.instaforex.com |
| You are subscribed to email updates from Forex analysis review. To stop receiving these emails, you may unsubscribe now. | Email delivery powered by Google |
| Google, 1600 Amphitheatre Parkway, Mountain View, CA 94043, United States | |







Comments