Forex analysis review
Forex analysis review |
- Forecast and trading signals for GBP/USD for October 4. Detailed analysis of the movement of the pair and trade deals. The
- Overview of the EUR/USD pair. October 4. Joe Biden hopes for the support of Republicans in Congress.
- How to trade GBP/USD on October 4? Simple tips for beginners
- How to trade EUR/USD on October 4? Simple tips for beginners
- Jad Comair: Regulators will not kill Bitcoin. The failure of the experiment in El Salvador.
- Janet Yellen and Jerome Powell do not have a common opinion on inflation.
- Overview of the GBP/USD pair. Preview of the week. The pound is beginning to recover from the "fuel crisis"
- Overview of the EUR/USD pair. Preview of the week. The most important Non-Farm determines the market mood before the next
- Jerome Powell: There is no intention in the Fed's plans to impose a ban on bitcoin.
| Posted: 03 Oct 2021 06:57 PM PDT GBP/USD 5M
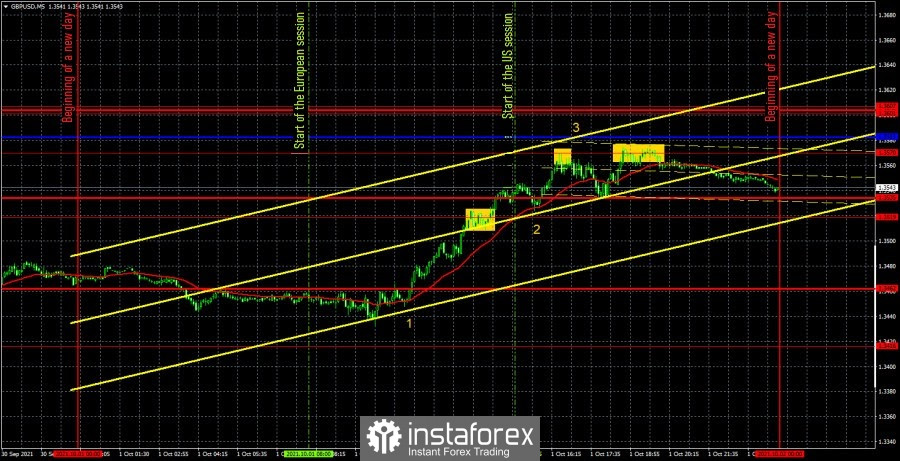
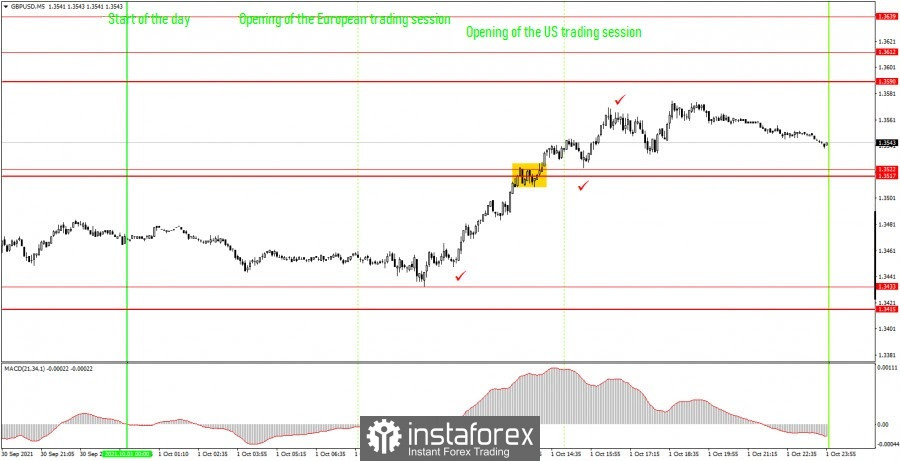
The GBP/USD pair also traded almost perfectly on October 1, passing about 140 points per day. The movement itself did not raise any questions either, since the pair was moving in only one direction almost throughout the day. Immediately I would like to note that it may seem that the British pound's entire growth on Friday was triggered only by the report on business activity in the UK manufacturing sector. It is marked with the number "1" in the chart, and it was at this time that the pair began to grow. However, the report itself does not provide grounds for drawing such conclusions. The fact is that the PMI was 57.1 points against the forecast of 56.3. It's not such a big mismatch for the markets to rush to work it out. Formally, there was a reason for buying the British currency, but it was very illusive. Thus, we believe that this is just a coincidence. Exactly the same coincidence may be that after the publication of data on personal income and expenses of Americans (figure "2" in the chart), the pair began to grow, although these data were better than forecasted and, accordingly, should have provoked a fall in the pair. After the ISM index was published, the euro fell 17 points, which is equal to a third of its daily volatility, and the pound practically did not react in any way. Therefore, we conclude that all movements of the pound/dollar on Friday had no dependence on the macroeconomics. In this case, it could be a corrective movement against the fall earlier by 300 points. As for the trading signals, there were only three of them and they began to form only some time after the upward movement began. The first buy signal was formed when the extremum level 1.3519 was overcome. As a result, the price rose to the extreme level of 1.3570, from which it rebounded. Thus, at this moment, one should close long positions and open short positions. We managed to earn about 24 points. The short position should have been closed near the support level of 1.3535, as it also bounced off. About 10 more points arrived. We are not looking for trading signals around support levels, so the next one was a sell signal when we rebound from 1.3570 again. It was formed in the evening, so it could be ignored. Nevertheless, if traders decided to work it out, then they could earn about 10 more points. Thus, 35-45 points of profit on Friday could be obtained. GBP/USD 1H
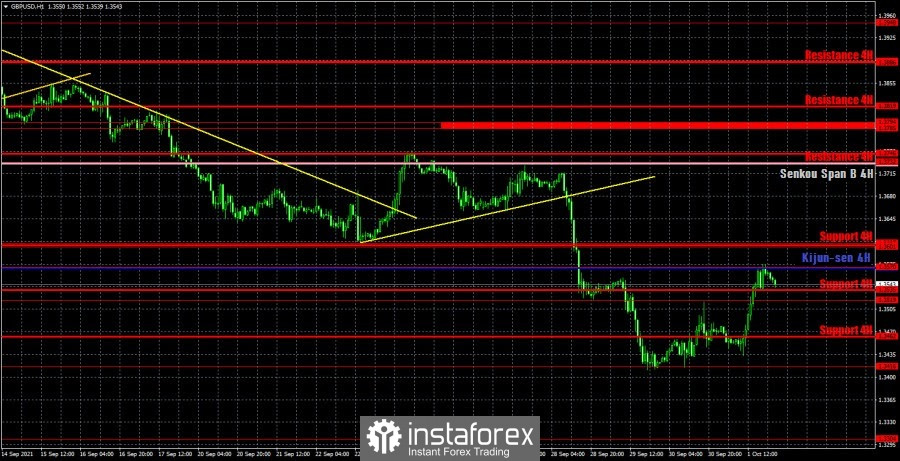
The pound/dollar pair continues its upward correction on the hourly timeframe. However, at this time, there is neither a trend line nor a channel, so it is too early to talk about a trend. At the moment, the pair has risen to the critical line and even rebounded from it. Therefore, the downward movement may resume. But overcoming the Kijun-sen line will allow us to expect the pound's succeeding growth. Take note that last week this currency collapsed due to the "fuel crisis" in Great Britain. But it looks like the markets have already worked out this topic, so the pair began to recover. We distinguish the following important levels on October 4: 1.3304, 1.3416, 1.3519, 1.3570, 1.3601 - 1.3607. Senkou Span B (1.3730) and Kijun-sen (1.3568) lines can also be sources of signals. It is recommended to set the Stop Loss level at breakeven when the price passes in the right direction by 20 points. The Ichimoku indicator lines can move during the day, which should be taken into account when looking for trading signals. There are no major macroeconomic reports scheduled in the UK on Monday either. Thus, the pair will be trading on pure technique almost until Friday, when the report on Nonfarm will be published in America. We also recommend that you familiarize yourself with the forecast and trading signals for the EUR/USD pair. COT report
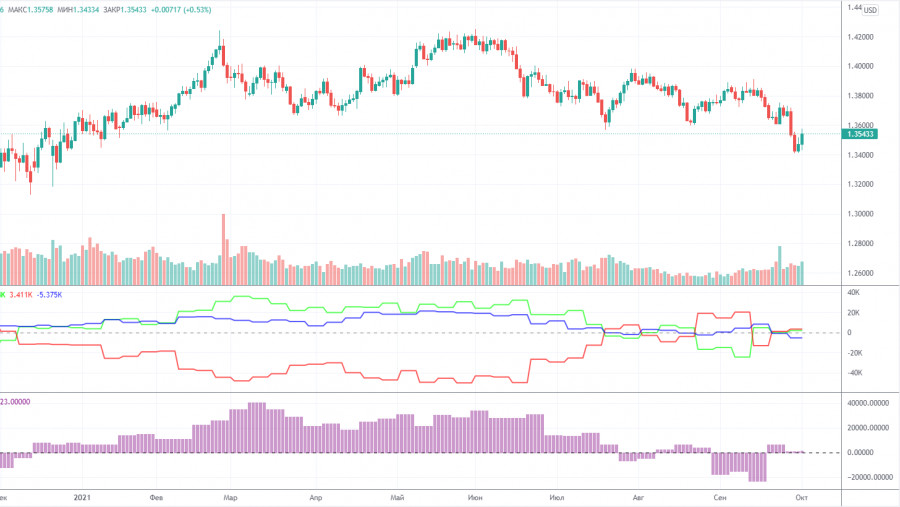
Major players slightly strengthened their bullish mood during the last reporting week (September 21-27). Although it is now as neutral as possible in fact. The fact is that the value of the net position for the non-commercial group of traders is now around zero, which means equality between the number of open long and short positions in the pound. Consequently, neither bulls nor bears have the initiative. Moreover, in the last couple of months, the mood of professional traders has been constantly changing, as the net position is either increasing or decreasing. Thus, from our point of view, the conclusion is obvious: the COT reports do not indicate either bullish or bearish sentiment now. During the reporting week, changes in the non-commercial group were minimal. 5.5 thousand Buy contracts (longs) and 4.5 thousand Sell contracts (shorts) were opened. Thus, the net position of non-commercial traders increased by 1,000. If in the case of the European currency, the COT reports signal a very likely further fall, then in the case of the pound, the COT reports just indicate the neutral mood of traders. The picture above shows a clear downward trend, but the problem is that professional players do not continue selling the British currency. Consequently, further decline is not evident for the pound. Take note that the euro corrected by about 43% against the upward trend, and the pound - by 24%. Explanations for the chart: Support and Resistance Levels are the levels that serve as targets when buying or selling the pair. You can place Take Profit near these levels. Kijun-sen and Senkou Span B lines are lines of the Ichimoku indicator transferred to the hourly timeframe from the 4-hour one. Support and resistance areas are areas from which the price has repeatedly rebounded off. Yellow lines are trend lines, trend channels and any other technical patterns. Indicator 1 on the COT charts is the size of the net position of each category of traders. Indicator 2 on the COT charts is the size of the net position for the non-commercial group. The material has been provided by InstaForex Company - www.instaforex.com |
| Overview of the EUR/USD pair. October 4. Joe Biden hopes for the support of Republicans in Congress. Posted: 03 Oct 2021 06:31 PM PDT 4-hour timeframe
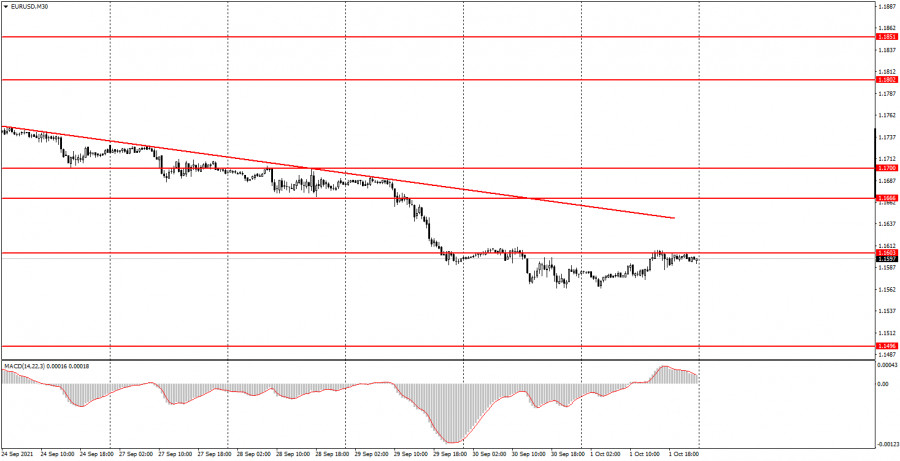
Technical details: Higher linear regression channel: direction - downward. Lower linear regression channel: direction - downward. Moving average (20; smoothed) - downward. The EUR/USD currency pair starts a new week with the status of an adjusting pair. However, the correction is so weak at the moment that it can only be called a "pullback." However, the whole movement shown by the pair can hardly be called strong. But at the same time, the US dollar has been getting more expensive for a month and has managed to grow by 300 points during this time. 300 points in a month are not much, considering that the movement was almost recoilless. Thus, the question of volatility, which remains at a low level, arises again and again. As for the technical picture, now there is no question at all about what the trend is. Both linear regression channels are directed downwards, as is the moving average line, and last week the bears overcame the important level of 1.1700, near which they have been trampling for a long time. Thus, the pair may continue to move down, especially if the markets keep in mind the possible curtailment of the QE program in November. Recall that, from our point of view, QE is the main reason for the growth of the dollar. Or rather, its very likely completion in the near future. Thus, it is not recommended to consider purchases until the price is fixed above the moving average line. Meanwhile, the States are increasingly facing the problem of the national debt limit. Janet Yellen has been regularly calling Congress to suspend the limit or raise it over the past few months. Otherwise, her department will not be able to make all the necessary payments. It would be strange in this situation not to know the opinion of President Joe Biden. That's what American journalists did on Saturday. Joe Biden told them that he hoped for the agreement of Republican senators on this issue. He also expressed hope that Republicans in the Senate will show responsibility and consider the situation's urgency. He also advised senators not to try to "seize the podium" or delay decision-making by delaying the debate. Recall that the House of Representatives agreed to suspend the debt limit until December 16, 2022. However, now the bill must be supported by senators. Although, as we said earlier, there should not be a special problem, given that there are 50 Democratic senators and the same number of Republican senators, and the key vote belongs to Kamala Harris, Joe Biden's vice president. We also believe that it makes no sense for Republicans to reject this bill, since in this case, the discontent of the American people may be directed at them. For it is the American people who will stop receiving aid, pensions, and benefits. In addition, the financing of some state structures and institutions may stop, and Republicans will be "to blame" for all this in the eyes of the people, who have already lost several positions in the ratings and lost the last election. Nevertheless, the American media are afraid that the bill may still be blocked. However, the Republicans' position on this issue is quite tough. They demand Biden and the Democrats that they cut spending and start taking at least some measures to reduce the national debt, which has been growing "by leaps and bounds" in recent years. So far, this topic is unlikely to impact the dollar, which has been strengthening against the euro in recent weeks. Traders do not believe that the Senate will not be able to pass this bill. And in any case, Donald Trump has accustomed Americans to "shutdowns." Thus, the markets are not too worried about this yet. In any case, in the coming week, everything will become clear and understandable. Therefore, there are no openly important events planned for the dollar that can radically change the fundamental global background in the coming weeks. The question now is, by and large, quite simple: when will the markets stop buying the dollar only on expectations of curtailing a huge quantitative stimulus program? However, practice shows that it is precisely such slow, progressive movements that are the longest. From a global perspective, we believe that the current movement is just a much-delayed correction. But in any case, there are no grounds for buying the euro/dollar pair now. Therefore, we should expect a change in the fundamental background or saturation of the bears. This week, only one report can quite strongly affect the long-term mood of traders. This report is NonFarm Payrolls – but it will be released only on Friday, so until that time, the pair can continue calm movements and may even stop falling. Note that the CCI indicator has already entered the oversold area twice (below the -250 level), which signals a possible upward reversal of the pair.
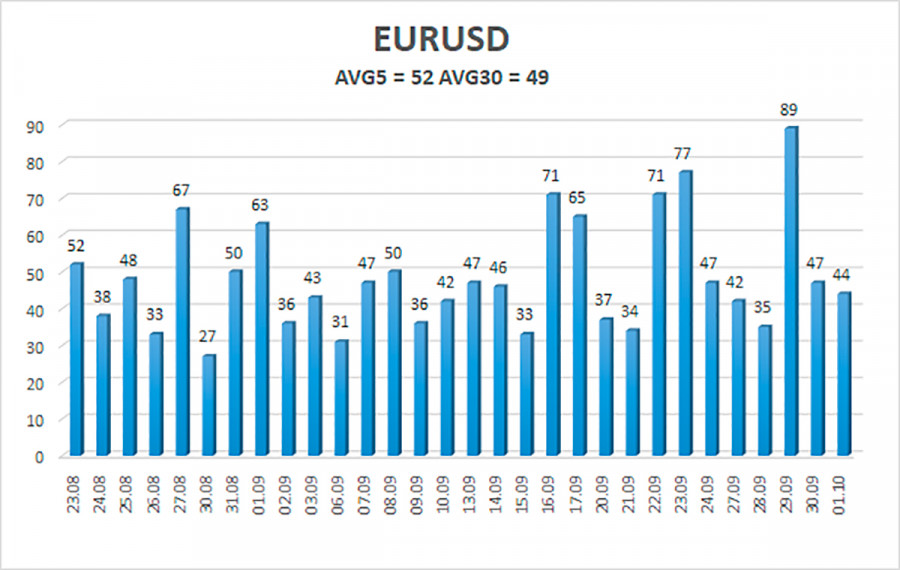
The volatility of the euro/dollar currency pair as of October 3 is 52 points and is characterized as "average." Thus, we expect the pair to move today between the levels of 1.1545 and 1.1649. The reversal of the Heiken Ashi indicator back down will signal the resumption of the downward movement. Nearest support levels: S1 – 1.1536 S2 – 1.1475 S3 – 1.1414 Nearest resistance levels: R1 – 1.1597 R2 – 1.1658 R3 – 1.1719 Trading recommendations: The EUR/USD pair started a weak correction on Friday. Thus, today, we should consider new options for opening short positions with targets of 1.1545 and 1.1536 after the reversal of the Heiken Ashi indicator down. Purchases of the pair should be opened if the price is fixed above the moving average line with targets of 1.1719 and 1.1780. They should be kept open until the Heiken Ashi indicator turns down. The material has been provided by InstaForex Company - www.instaforex.com |
| How to trade GBP/USD on October 4? Simple tips for beginners Posted: 03 Oct 2021 02:13 PM PDT Analysis of Friday deals: 30M chart of the GBP/USD pair
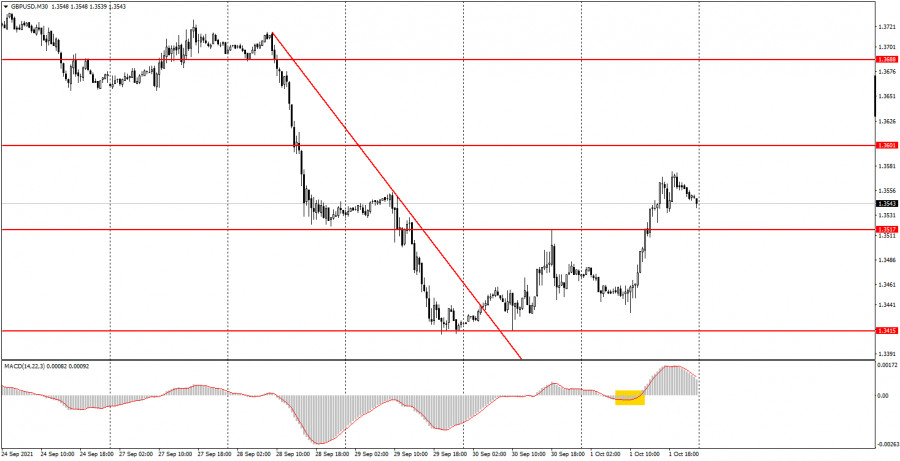
The GBP/USD pair was actively moving on the 30-minute timeframe last Friday. Therefore, novice traders managed to make good money, but more on that below. After a disastrous first half of the week, the pound began to recover very quickly and by the end of Friday won back about half of its losses. Let us remind novice traders that the pound's fall was triggered by the news of the "fuel crisis" in the UK. Without going into details, it should be noted that this is an unprecedented phenomenon for a country like Britain, and at the same time very unexpected. Therefore, the markets could not help but react to it. Although, of course, it was impossible to predict it in advance. Nevertheless, in the last two trading days the pair has been actively recovering and this recovery cannot be attributed to macroeconomic statistics. Only one report was published in Britain on Friday, which could hardly have caused a movement of 130 points. And the US reports came out when more than half of the upward movement of the pair passed. Thus, if there was any influence, it was minimal. The British PMI (the first tick in the picture below) was better than expected, but not enough to make the pound cheer up. Therefore, most likely, the markets began to recover the pound themselves after such a strong fall. The movement intensified on the 30-minute timeframe, so the signals from the Ichimoku indicator could be considered. Last Friday, a strong buy signal was created in the form of an upward reversal of the indicator near the zero level. This buy signal made it possible to earn about 100 points of profit, as it was formed almost at the very beginning of the movement. 5M chart of the GBP/USD pair
It moved very well on the 5-minute timeframe on Friday and it is a pity that we could not "catch" this movement from the very beginning. On the other hand, we had a signal at the 30-minute TF, where we managed to "catch" the movement. In the morning, the price did not reach the level of 1.3415, only 18 points, and it has also not hit the level of 1.3433, since this is at least Friday. Thus, the first and only signal - to buy - was formed almost at the US trading session, when the price crossed the levels of 1.3517 and 1.3522. Here, novice traders could open long positions (if they missed the signal from the MACD), since the signal itself was strong enough. Subsequently, the price went up another 40 points, which was enough to trigger the minimum Take Profit, but did not reach the nearest level of 1.3590. Also, the deal could be manually closed in the late afternoon at a slightly lower profit. Thus, although we did not manage to work out the entire movement on the 5-minute TF, we still managed to make money. How to trade on Monday: There is no clear tendency at this time on the 30-minute timeframe. Nevertheless, the pair continues to move up after breaking the not strongest downtrend line. Therefore, formally, the trend is still upward, and the movement is quite strong. Therefore, it is possible to trade bullish using the signals of the MACD indicator. The important levels on the 5-minute timeframe are 1.3433, 1.3517, 1.3522, 1.3590, 1.3612. We recommend trading with them. The price can bounce off them or overcome them. As before, we set Take Profit at a distance of 40-50 points. At the 5M TF, you can use all the nearest levels as targets, but then you need to take profit, taking into account the strength of the movement. When passing 20 points in the right direction, we recommend setting Stop Loss to breakeven. There are no major events scheduled for Monday in the UK and the US, so you will have to trade exclusively on technical signals. On the chart: Support and Resistance Levels are the Levels that serve as targets when buying or selling the pair. You can place Take Profit near these levels. Red lines are the channels or trend lines that display the current trend and show in which direction it is better to trade now. The MACD indicator consists of a histogram and a signal line. When they cross, this is a signal to enter the market. It is recommended to use this indicator in combination with trend lines (channels and trend lines). Important speeches and reports (always contained in the news calendar) can greatly influence the movement of a currency pair. Therefore, during their exit, it is recommended to trade as carefully as possible or exit the market in order to avoid a sharp price reversal against the previous movement. Beginners on Forex should remember that not every single trade has to be profitable. The development of a clear strategy and money management are the key to success in trading over a long period of time. The material has been provided by InstaForex Company - www.instaforex.com |
| How to trade EUR/USD on October 4? Simple tips for beginners Posted: 03 Oct 2021 02:13 PM PDT Analysis of Friday deals: 30M chart of the EUR/USD pair
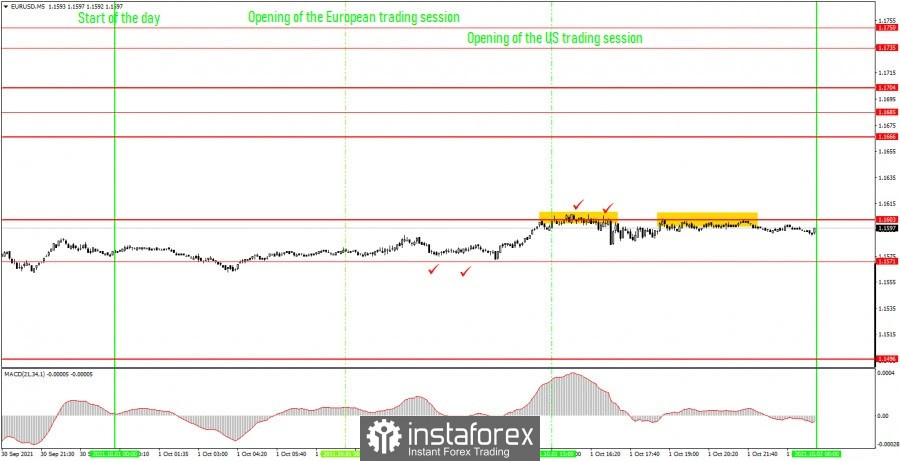
The EUR/USD pair continued to be in a downward trend on Friday, which is eloquently evidenced by the downtrend line. Nevertheless, if we look at the direction and nature of the movement, we can draw the following conclusions. First, the volatility was too low again, only about 40 points. And we have already said many times that with such volatility, trading is, in principle, very difficult. Secondly, the pair began to correct, but this correction is so weak so far that it is very difficult to call it a "correction". And this is all despite the fact that there were quite significant publications of macroeconomic statistics in the European Union and in the United States on Friday. For example, in the European Union there was a report on inflation (second checkmark in the chart below), and in the US - an ISM report on business activity (fourth checkmark). But, as we can see, no serious movements began after all the reports of the day. The only exception can be the ISM report, after which the quotes fell by 17 points in 5 minutes, which was already an achievement for the pair on October 1. With such a movement, even the MACD indicator was unable to form a single signal during the day. In the middle of the day, there was an attempt to reverse down near the zero level, but the reversal did not occur. With such volatility, it is better for novice traders to again ignore the signals of the MACD indicator. 5M chart of the EUR/USD pair
The technical picture on the 5-minute timeframe was frankly boring last Friday. We have already talked about macroeconomic reports above, here we will analyze trading signals. In principle, there were not many of them, only two. And both did not bring any profit to the newcomers. On the other hand, with such a movement, the absence of losses is almost a profit. The main movement of the day happened a couple of hours before the opening of the US trading session, but the price did not form any signal in front of it. There were two bounces from the level of 1.1603, both are not accurate and these were two sell signals. Theoretically, several profit points could be taken after the first signal, but in practice the pair could not go down more than 20 points. That is, a short position should have been closed either manually near the same level of 1.1603, or by Stop Loss at breakeven, since the price also could not go above the level of 1.1603. How to trade on Monday: The EUR/USD pair has formed a new downward trend on the 30-minute timeframe and continues to adhere to it. Unlike the pound, the euro quickly returned to its usual pattern of movement and its usual volatility. Therefore, in the near future, we again advise against using the MACD indicator as a source of trading signals. And next week there will be little macroeconomic statistics, so it is highly likely that volatility will remain low. The key levels on the 5-minute timeframe for October 4 are 1.1496, 1.1571, 1.1603, 1.1666. Take Profit, as before, is set at a distance of 30-40 points. Stop Loss - to breakeven when the price passes in the right direction by 15 points. At the 5M TF, the target can be the nearest level if it is not too close or too far away. If it is, then you should act according to the situation or work according to Take Profit. On Monday, neither the US nor the European Union will publish a single macroeconomic report and no fundamental events are planned. Therefore, we do not expect strong movements during the day. On the chart: Support and Resistance Levels are the Levels that serve as targets when buying or selling the pair. You can place Take Profit near these levels. Red lines are the channels or trend lines that display the current trend and show in which direction it is better to trade now. The MACD indicator (14,22,3) consists of a histogram and a signal line. When they cross, this is a signal to enter the market. It is recommended to use this indicator in combination with trend lines (channels and trend lines). Important speeches and reports (always contained in the news calendar) can greatly influence the movement of a currency pair. Therefore, during their exit, it is recommended to trade as carefully as possible or exit the market in order to avoid a sharp price reversal against the previous movement. Beginners on Forex should remember that not every single trade has to be profitable. The development of a clear strategy and money management are the key to success in trading over a long period of time. The material has been provided by InstaForex Company - www.instaforex.com |
| Jad Comair: Regulators will not kill Bitcoin. The failure of the experiment in El Salvador. Posted: 03 Oct 2021 06:08 AM PDT
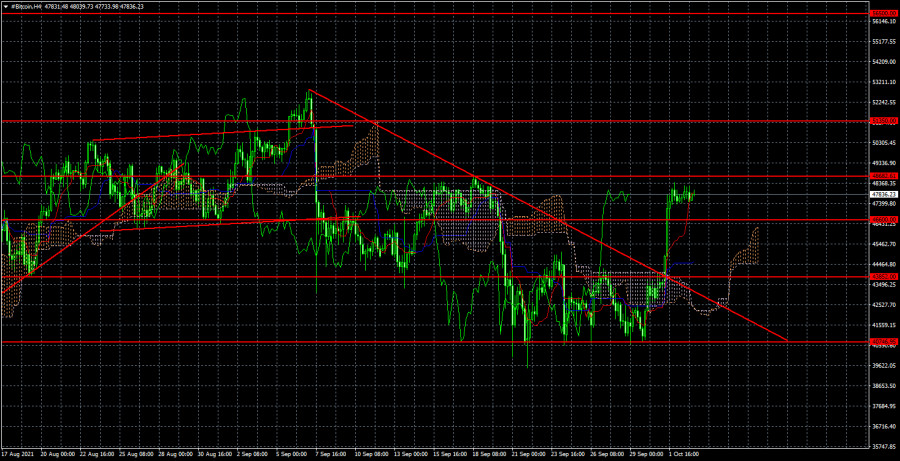
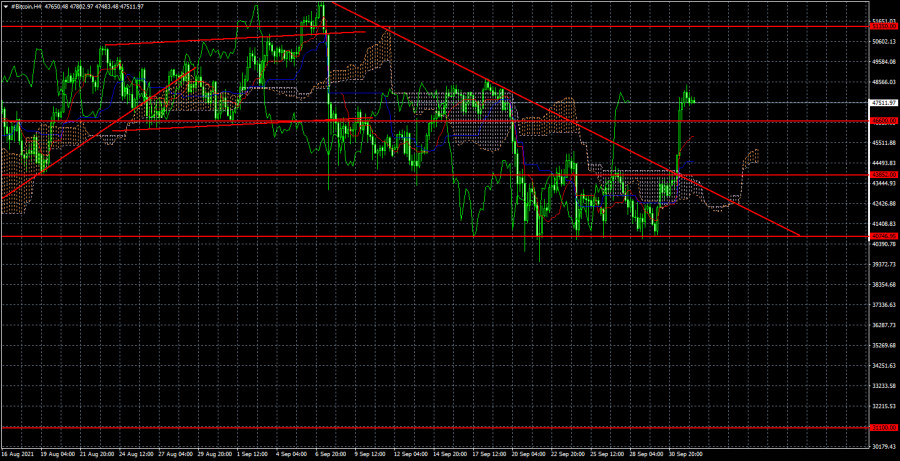
The bitcoin cryptocurrency rose by $ 5,000 on Friday and is now around the $ 48,000 mark per coin. We already said yesterday that the bitcoin exchange rate had overcome the descending trend line and the Ichimoku cloud on the 4-hour timeframe, so it is a justified strategy to expect further growth now. Nevertheless, the level of $ 48,682 now lies on bitcoin's path to new heights, and until the bulls manage to gain a foothold higher, bitcoin may lead to a small correction. Recall that the level of $ 48,682 is the last local maximum. Not so long ago, Ray Dalio, the founder of the Bridgewater Associates foundation, said that regulators would sooner or later "strangle" bitcoin, as it would prevent them from controlling all financial flows. The founder of the Melanion Capital fund, Jad Comair, disagrees with this opinion. In his view, at the moment, many Americans have invested in bitcoin, and its ban may lead to negative consequences in the economy. "I don't think any developed country, like the United States or any of the members of the Big Seven, will take such a serious step," Comair said. He also noted that most governments impose certain restrictions and tighten regulations not to ban bitcoin but to protect investors. And proper regulation of the cryptocurrency segment will only help in its development. Comair also gave his forecast regarding the future value of bitcoin. In his opinion, the cryptocurrency will never drop to 0, and in the future, it may grow to $ 500,000 per coin. Comair also voiced a rather widespread opinion that gold is much worse than bitcoin as a hedging instrument. In addition, gold mining causes much more environmental damage than bitcoin mining. It also became known that the experiment with bitcoin in El Salvador can still be called a failure. The government, we recall, allocated each Salvadoran $ 30 in bitcoins to popularize the cryptocurrency within the country. However, instead of using bitcoin for calculations, Salvadorans either try to speculate on it or immediately withdraw it into dollars. According to Bloomberg, everyone is engaged in such business, from teachers and drivers to business owners. However, most country residents still immediately withdraw bitcoin into dollars, bypassing the government's condition that at least one transaction must be made before being withdrawn into cash. Salvadorans send bitcoin to their relatives or friends, who immediately send it back, followed by a withdrawal in dollars. Also, Bloomberg reports, the Chivo application (an electronic wallet where bitcoins are credited) breaks down very often, so Salvadorans cannot pay for goods and services with bitcoin at any time. Experts also report that the experiment of President Nayib Bukele is very risky for himself since if people start losing money on bitcoins, it will lead to a drop in his support by the population.
The trend on the 4-hour timeframe changed to an upward one after the price was fixed above the descending trend line and above the Ichimoku cloud. There is no ascending trend line now, but there is a level of $ 48,682 - the last local maximum, from which a rebound is very likely. If there is a rebound, then a new round of downward movement with goals is possible $ 46,600, $ 43,852, $ 40,746. If the $ 46,862 is overcome, then we continue to buy with a target of $ 51,350. The material has been provided by InstaForex Company - www.instaforex.com |
| Janet Yellen and Jerome Powell do not have a common opinion on inflation. Posted: 03 Oct 2021 04:11 AM PDT
Last week, a whole scattering of speeches by high-ranking officials in the United States took place. In particular, Jerome Powell made several speeches, as well as Treasury Secretary Janet Yellen. Naturally, the markets have been following their speeches very closely, as the US stock market has been experiencing the best times in recent weeks and is being adjusted. However, many experts have long been convinced that a "bubble" has inflated the stock market, which will burst sooner or later. We have also repeatedly said that QE's curtailment in the US might lead to a fall in stock indices, as less money will come from nowhere into the economy. Also, investors can start getting rid of some securities in advance, anticipating a stock market collapse. Returning to the speeches of Yellen and Powell, it is worth noting that inflation in the United States remains at a high level. However, the Finance Minister and the head of the Fed disagree on the current price growth in America. For example, Janet Yellen said in Congress that she sees some signs of a slowdown in price growth. She also noted that the American economy continues to recover, at the same time very quickly, and she expects that the labor market will reach pre-crisis levels next year. In addition, Yellen once again stated that the refusal of Congress to raise the debt limit could lead to disastrous consequences for the American economy. "We expect that by October 18, the ministry will have minimal resources, which will be quickly exhausted. It is unknown whether we will be able to continue fulfilling all the country's obligations after this date," Janet Yellen said. "It would be a disaster for the American economy, for financial markets, and for millions of families and workers whose financial security would be at risk due to delayed payments," Yellen added. In turn, Jerome Powell, who also addressed Congress this week, said that inflation is likely to continue to remain high for several more months, but then it will begin to slow down. According to Powell, the price increase caused by supply chain disruptions and other factors was longer than expected. However, the head of the Fed is confident that inflation will return to the target of 2%. Thus, Jerome Powell is most likely right, who is still "in charge" of monetary policy, which means he can influence inflation. In recent months, the acceleration of growth has stopped, but so far, it cannot be said that inflation has begun to decline. If the QE program starts to be curtailed in November, it will mean that inflation will begin to decline, but this will not happen before November. And it is unlikely that the consumer price index will immediately collapse after the first month with a reduced QE. The material has been provided by InstaForex Company - www.instaforex.com |
| Posted: 03 Oct 2021 03:07 AM PDT 4-hour timeframe
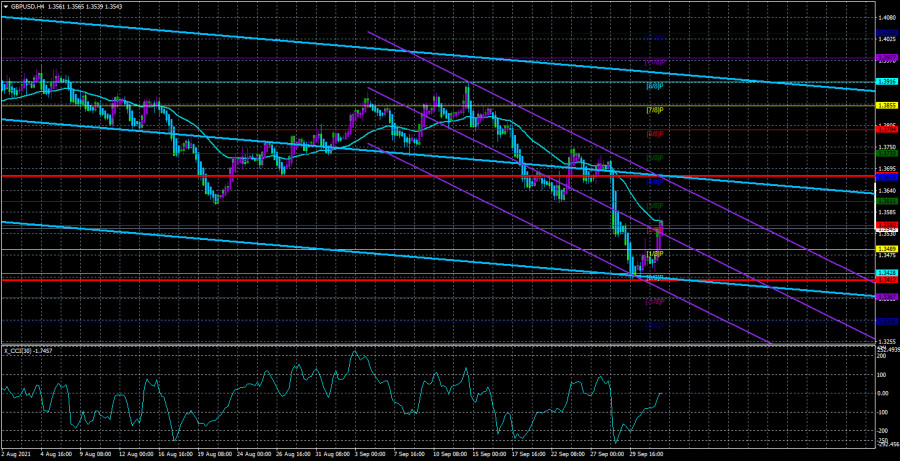
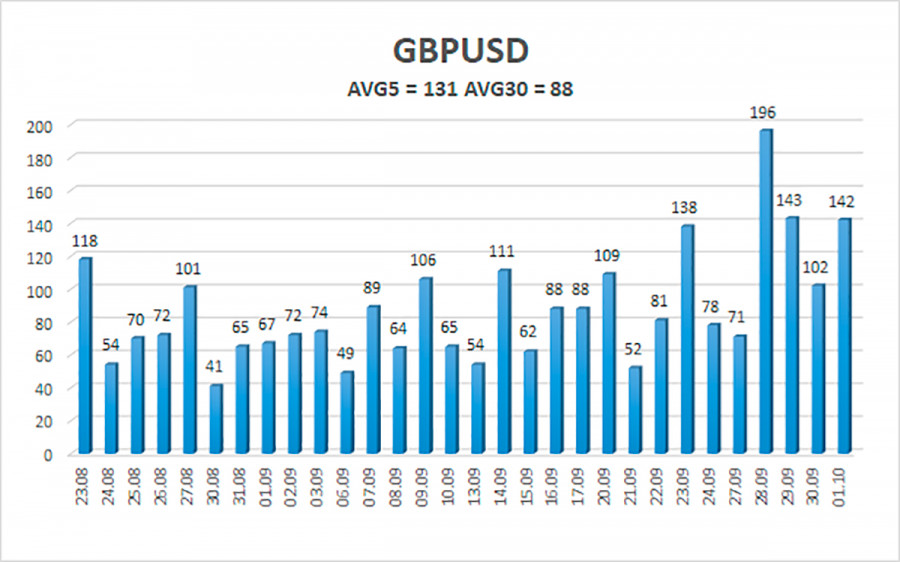
Technical details: Higher linear regression channel: direction - downward. Lower linear regression channel: direction - downward. Moving average (20; smoothed) - sideways. This week, the British pound paired with the US dollar showed just excellent volatility, moving like in the good old days. Recall that the normal volatility for the pound/dollar pair is 100-130 points per day. It is the value of the indicator we see now in the context of the last five days. We continue to believe that the main reason for the powerful fall of the pound and the growth of the dollar is the "logistical crisis," part of which is the "fuel crisis" that Britain faced just last week. We have already drawn traders' attention to the fact that the lack of gasoline at the gas station means its lack of ordinary drivers and the lack of the most significant services in the state plan (for example, ambulance). So far, there have been no reports from the UK that one or another state structure has stopped its work due to lack of gasoline, but still, this event has no analogs. Thus, the pound could fall by 300 points due to this factor. However, the pair's recovery began on Thursday and Friday, and the price has returned to the moving average line. Therefore, on Monday and Tuesday, the future fate of the pound will be decided. If there is a consolidation over the moving, it will be possible to talk about the resumption of the upward movement and a new upward trend. If not, then the movement to the south is likely to continue. It should also be noted that the pair overcame the most important level of 1.3600 for itself, which it could not "take" for six months. But at the same time, the pair have still adjusted by only 24% about the entire upward trend, which began a year and a half ago. Thus, the latest fall of the pound/dollar pair is practically nothing in global terms. Next week, traders will have almost nothing to turn their attention to in macroeconomic terms. For the whole week, only two not the most significant reports will be published in the UK – business activity indices for the services sector and the construction sector. We can hardly expect a strong reaction to these reports. It should also be noted that if the chairmen of central banks spoke almost every day last week, then no important speeches are planned for the next week. Thus, market participants will have to pay attention only to statistics from overseas, where the most important report will be Nonfarm Payrolls, which will be published on Friday. However, in addition to this, you should pay attention to non-economic news. For example, the same "fuel crisis." So far, Boris Johnson's government has decided to involve the military in the case, who have become truckers and issue temporary visas to drivers from other countries. It cannot be said that the problem has already been solved since, according to media assurances, truck drivers from other countries are not eager to go to the UK for a couple of months and then be deported. Drivers are interested in permanent and stable work, so to speak, in relation to labor migration. Moreover, after Brexit was completed at the beginning of the year, many drivers made a choice in favor of other EU countries, where prosperity and working conditions are no worse than in Britain. Thus, for the time being, the problem will be solved by the military. However, the country may face not only a "fuel crisis." Some respected news agencies reported last week that there may be a shortage in other sectors of the economy. In particular, there may be a shortage of some products in stores. Thus, Boris Johnson needs to solve the global problem of labor shortage in places where the British themselves are not used to working and do not want to do it. Consequently, next week, any news about the "logistical crisis" aggravation may provoke a new fall in the British currency. In general, we suggest traders observe the pair's behavior in the first four days of the trading week. Especially if there are no new reports regarding the shortage of gasoline from Britain. If this condition is met, it will be possible to understand whether the markets are set up for further pair sales, which can be justified by the high probability of curtailing the QE program in the United States? If the pound continues to fall anyway, then the downward trend will no longer be just an assumption. It will become an expectation.
The average volatility of the GBP/USD pair is currently 131 points per day. For the pound/dollar pair, this value is "high." On Monday, October 4, we expect movement inside the channel, limited by the levels of 1.3412 and 1.3677. The upward reversal of the Heiken Ashi indicator signals a round of corrective movement. Nearest support levels: S1 – 1.3489 S2 – 1.3428 S3 – 1.3367 Nearest resistance levels: R1 – 1.3550 R2 – 1.3611 R3 – 1.3672 Trading recommendations: The GBP/USD pair has started a corrective movement on the 4-hour timeframe but has not yet overcome the moving average. Thus, at this time, it is still necessary to consider sell orders with targets of 1.3489 and 1.3428 levels in the event of a price rebound from the moving average line. Buy orders should be considered again if the price is fixed above the moving average with targets of 1.3611 and 1.3672 and keep them open until the Heiken Ashi turns down. The material has been provided by InstaForex Company - www.instaforex.com |
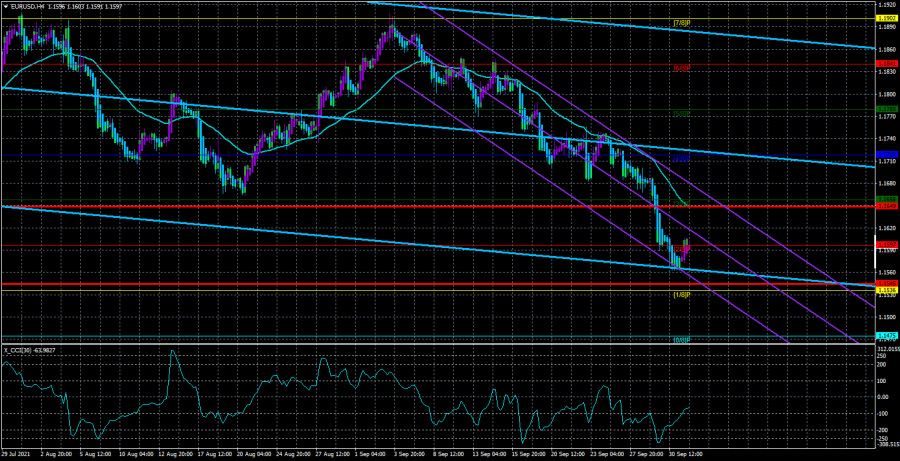
| Posted: 03 Oct 2021 03:07 AM PDT 4-hour timeframe
Technical details: Higher linear regression channel: direction - downward. Lower linear regression channel: direction - downward. Moving average (20; smoothed) - downward. The EUR/USD currency pair broke through the 1.1700 level this week and intensified the downward movement. We cannot say that volatility has sharply increased for the pair. However, there have been several very volatile (in the current conditions) days. The illustration below clearly shows that the pair even set its local record (for the last 30 trading days), passing as many as 89 points on September 29. Recall that the normal average volatility for the pair is 60-80 points per day. Now, both averages are still much lower than this indicator. Nevertheless, the illustration above clearly shows that the movement has intensified, and the downward trend persists. In previous articles, we have already said that the most likely reason for such a strong strengthening of the US currency is the belief that the Fed will begin to wind down its huge quantitative stimulus program in 2021. The Fed's QE program has larger volumes than the ECB's PEPP program. Thus, the market is facing a potentially greater decrease in cash flow to the American economy than the European one. This factor can support the US dollar. However, from our point of view, all this is just market expectations. We can say that market participants now buy the dollar and sell the euro "in advance." We still do not see how the US dollar can form a new downward trend. Also, recall that the upward trend persists in global terms, and the downward movement in the last nine months can be easily interpreted as a standard 3-wave correction. Thus, despite overcoming the 1.1700 level, we still do not believe the pair can go too far down. However, there is a downward trend, so you should trade down. There was a lot of "foundation" this trading week, and there was practically no "macroeconomics." None of the speeches by Christine Lagarde, Jerome Powell, and Janet Yellen caused a corresponding market reaction. From "macroeconomics," we can highlight an excellent report on US GDP and the ISM index in the manufacturing sector. There will also be few macroeconomic statistics in the next trading week. However, some reports are very important. But about everything in order. Everything will begin on Tuesday when the index of business activity in the service sector will be published in the European Union. It is not the most important indicator, and it is not necessary to expect serious changes from it. In the United States, the business activity index in the service sector (ISM) will also be published on this day, which is more significant than its European counterpart. Thus, on Tuesday, all attention is on the ISM index. On Wednesday, the ECB report from the monetary policy meeting will be published in the European Union. And the most significant day of the week will be Friday, when unemployment data, NonFarm Payrolls, and changes in average wages will be published in the United States. Thus, if the markets will react to the statistics, it will be on Friday. Recall that the Fed is guided by the state of the labor market and inflation when making decisions on monetary policy. Therefore, the Nonfarm Payrolls report is of great importance in the local sense of the word and the global one. The latest labor market report for August was not that weak but much weaker than the previous two. Therefore, the markets immediately started talking about the decline in the pace of recovery of the American economy. Moreover, this week, Fed Chairman Jerome Powell said that the labor market is still very far from the levels of maximum employment. Accordingly, the new Nonfarm report will be of great importance. If it again falls short of forecasts, which amount to 460-475 thousand, it may mean that the Fed may postpone the decision to start curtailing the QE program from November to December. If the actual value is in line with the forecast or exceeds it, this will further increase the chances of QE curtailing at the next Fed meeting and provide local support for the US currency. However, until Friday, the pair will move almost without the influence of statistics and the "foundation." Thus, in the first four trading days of the week, we will understand whether the markets are set to continue buying the US dollar? If the growth of the US currency continues, then it will be possible to talk about the influence of the global factor that we talked about in the first paragraph. If not, then the markets rely solely on local factors when making trading decisions.
The volatility of the euro/dollar currency pair as of October 3 is 52 points and is characterized as "average." Thus, we expect the pair to move today between the levels of 1.1545 and 1.1649. The reversal of the Heiken Ashi indicator back down will signal the resumption of the downward movement. Nearest support levels: S1 – 1.1536 S2 – 1.1475 S3 – 1.1414 Nearest resistance levels: R1 – 1.1597 R2 – 1.1658 R3 – 1.1719 Trading recommendations: The EUR/USD pair started a weak correction on Friday. Thus, today, we should consider new options for opening short positions with targets of 1.1545 and 1.1536 after the reversal of the Heiken Ashi indicator down. Purchases of the pair should be opened if the price is fixed above the moving average line with targets of 1.1719 and 1.1780. They should be kept open until the Heiken Ashi indicator turns down. The material has been provided by InstaForex Company - www.instaforex.com |
| Jerome Powell: There is no intention in the Fed's plans to impose a ban on bitcoin. Posted: 02 Oct 2021 04:24 AM PDT
The bitcoin cryptocurrency has worked out the $ 40,746 level six times and bounced off it six times. Already on Friday, the nerves of traders and investors could not stand it, and a new wave of mass purchases of cryptocurrencies began. Thus, it can be concluded that the market has kept cryptocurrencies above the required level. I just didn't let it fall lower because as soon as the price approached the $ 40,746 mark, purchases immediately followed, and pending buy orders were triggered. Thus, despite the high probability of a correction scenario, at the moment, bitcoin is again in an upward movement. The quotes of "bitcoin" got out of the narrowing triangle and fixed above the descending trend line. Thus, the markets "survived" the news about the ban on any cryptocurrency transactions in China. They are now ready to raise the rate of the first cryptocurrency without the participation of Chinese traders and investors. Although in reality, it is hardly possible to say that they will leave the market, given that bitcoin is decentralized and can be bought and stored in any country. Also, significant support for bitcoin was provided by the head of the Federal Reserve, Jerome Powell, who said yesterday that his organization would not follow the example of China and prohibit cryptocurrency transactions. In principle, this is not surprising. The United States is still a democracy, unlike the PRC. Many American experts have repeatedly noted that bitcoin is too deeply embedded in the current financial system of the world to be banned everywhere. Nevertheless, the probability of a tightening of regulation of the cryptocurrency sphere remains. Recall that almost any central bank or government does not need a currency or equivalent beyond its control. "We have no intention to ban cryptocurrencies," the head of the Fed said at a House Financial Services Committee meeting. Also, on Friday, Finance Minister Janet Yellen said that her department is preparing to amend the tax legislation on cryptocurrencies. In addition, on Friday, it became known about the lifting of the ban on mining in Iran, which was previously introduced due to a lack of electricity in the country. This factor also had a positive impact on the quotes of "bitcoin." Thus, at this time, bitcoin is growing again and is in demand. Immediately, many experts and economists started talking about updating the annual highs, although a week ago, it was about a further fall to the level of $ 30,000. From our point of view, the correction scenario remains relevant. Recall that in the period from July 20 to September 6, the cryptocurrency increased by $ 20,000, and the reasons for this movement remain a mystery. From time to time, bitcoin gets a foundation for continued growth, but still, an increase of $ 20,000 for no particular reason is very cool. Recall that, for example, the leading US stock indices are currently being adjusted since the Fed may announce the curtailment of QE in November. It means that there will be much less money entering the markets.
The trend on the 4-hour timeframe changed to an upward one after the price was fixed above the descending trend line and above the Ichimoku cloud. There is no ascending trend line now, but there is a level of $ 48,682 - the last local maximum, from which a rebound is very likely. If there is a rebound, then a new round of downward movement with goals is possible $ 46,600, $ 43,852, $ 40,746. If the $ 46,862 is overcome, then we continue to buy with the goal of $ 51,350. The material has been provided by InstaForex Company - www.instaforex.com |


| You are subscribed to email updates from Forex analysis review. To stop receiving these emails, you may unsubscribe now. | Email delivery powered by Google |
| Google, 1600 Amphitheatre Parkway, Mountain View, CA 94043, United States | |


Comments