Forex analysis review
Forex analysis review |
- Overview of the GBP/USD pair. December 30. Boris Johnson is elated and believes that the UK has won the negotiations with
- Overview of the EUR/USD pair. December 30. The results of Donald Trump's four-year rule are depressing. The US currency "pays
- USDX: Dollar can breathe before falling below 90 points
- Analytics and trading signals for beginners. How to trade GBP/USD on December 30? Analysis of Tuesday. Getting ready for
- Analysis and trading signals for beginners. How to trade EUR/USD on December 30. Analysis of Tuesday trades. Getting ready
- December 29, 2020 : EUR/USD daily technical review and trade recommendations.
- December 29, 2020 : EUR/USD Intraday technical analysis and trade recommendations.
- December 29, 2020 : GBP/USD Intraday technical analysis and trade recommendations.
- Stock Europe continues to rally
- Gold Could Change Its Direction
- Market optimism pushes EUR/USD pair up. Dollar retreats, and euro intends to consolidate its success
- EUR/USD Upside Continuation Signaled
- Short-term analysis on NZDUSD
- Ichimoku cloud indicator Daily analysis of Gold
- Ichimoku cloud indicator Daily analysis of EURUSD
- Trading Signal for EUR/USD for December 29-30, 2020
- Price of gold soar amid weak dollar
- Bitcoin Goes For New All-Time Highs
- BTC analysis for December 29,.2020 - Potential upside continuation towards $28.400
- Analysis of Gold for December 29,.2020 - Testing of the rising trendline and potential for higher price towards $1.895
- EUR/USD analysis for December 29 2020 - Firsst ttarget at the price of 1.2250 has been reached, second target in play at
- GBP/USD price analysis for 29 December, 2020
- Analysis and Forecast for GBP/USD on December 29, 2020
- Analysis and Forecast for EUR/USD on December 29, 2020
- EUR/USD analysis for December 29. Donald Trump gives in and sings coronavirus relief bill
| Posted: 29 Dec 2020 06:08 PM PST 4-hour timeframe
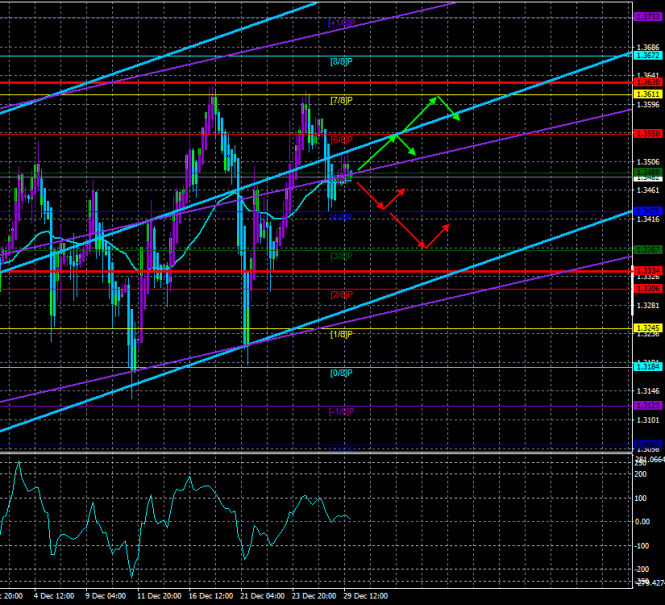
Technical details: Higher linear regression channel: direction - upward. Lower linear regression channel: direction - upward. Moving average (20; smoothed) - sideways. CCI: 10.6656 The British pound has calmed down by the end of 2020. I want to believe that this is not an accident. Tuesday's volatility was lower than usual. However, we would not jump to conclusions that the "high-volatility swing" is complete. They are visible in the illustration. The pair in recent weeks is very fond of passing 300-400 points in different directions in short periods. Thus, it is still very early to talk about the stabilization of the situation. The key point that we can note is the double working out of the Murray level of "7/8"-1.3611, which is the 2.5-year high of the pound. Thus, two price rebounds from this level and allows us to assume the end of the upward trend. However, in recent months, there have been situations in which we expected the end of the upward trend, and the pound continues to grow as if nothing had happened. Thus, this time the upward movement may continue, given the unprecedented low demand for the US currency. Traders, analysts, and experts continue to talk about the prospects of the British economy while the pound continues to rise in price in the long term. According to many, at the end of 2020 (the fourth quarter) and the beginning of 2021 (the first quarter), the British economy will again lose 1-3% of GDP, which means that there will be no question of any economic recovery after the pandemic and crisis in these periods. Therefore, it is still extremely difficult for us to find reasons why the British currency may become more expensive in the near future. Especially because the US economy in the fourth quarter of 2020 is likely to gain a couple of percent compared to the third quarter, according to forecasts. Thus, we get that the American economy will continue to recover, and the British economy will continue to fall. It is still not clear why the pound is still growing. But the reasons may be the same as we listed in the article on the euro/dollar. Speculative growth and actions of major market players. And so the British currency can rise in price for as long as you want, although there are no fundamental reasons for this. Thus, traders just need to keep in mind that the pound can start a strong fall at any time or at least stop growing. We still recommend trading up as long as the upward trend continues, as trying to predict a downward trend reversal is a thankless task. It should be remembered that in 2008, oil broke all records of value, and in 2007, the pound was worth more than $ 2. After reaching these peak values, long falls of both instruments followed. At the same time, the media got an internal document of the British government, which describes the victory in the negotiations between London and Brussels. This document states that the UK won on 28 points, reached a compromise solution on 26 points, and only conceded to the European Union on 11 points. British politicians and economists now rejoice and celebrate their victory, European ones – their own, and independent experts assure that such an agreement (clearly not without disadvantages for both sides) is still better than the absence of it. Thus, the European Union and Britain in any case benefited from the fact that they managed to jump literally into the last car. But the consequences of this agreement will be visible in the first two quarters of the new year. We can only closely monitor the situation and hope that the unjustified growth of the British currency will stop soon. It should also be noted that no important information is currently published in the UK or the States. Markets, if not yet celebrating the New Year, are preparing for it with might and main. Thus, trading and forecasting become especially difficult these days. The fundamental background is empty, there is no macroeconomic data, there is nothing to react to.
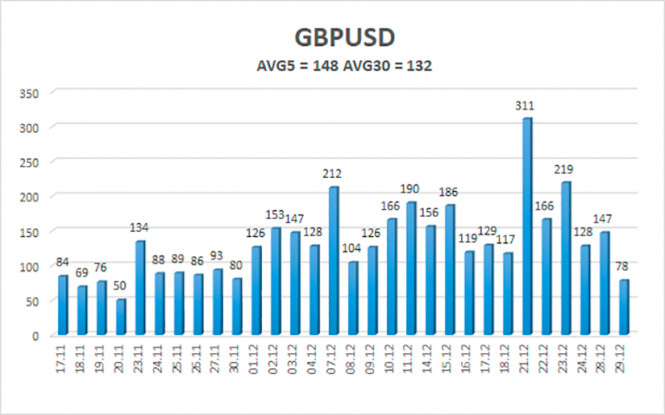
The average volatility of the GBP/USD pair is currently 148 points per day. For the pound/dollar pair, this value is "high". On Wednesday, December 30, thus, we expect movement inside the channel, limited by the levels of 1.3334 and 1.3630. The reversal of the Heiken Ashi indicator downwards signals a new round of downward movement within the "swing". Nearest support levels: S1 – 1.3428 S2 – 1.3367 S3 – 1.3306 Nearest resistance levels: R1 – 1.3489 R2 – 1.3550 R3 – 1.3611 Trading recommendations: The GBP/USD pair on the 4-hour timeframe is now in a new round of upward movement. Thus, today it is recommended to trade for an increase with the targets of 1.3550 and 1.3611 if the pair remains above the moving average. It is recommended to trade the pair down again with targets of 1.3428 and 1.3367 if the price is fixed below the moving average line. In general, the "swing" continues now. Not a good time to trade. The material has been provided by InstaForex Company - www.instaforex.com |
| Posted: 29 Dec 2020 06:08 PM PST 4-hour timeframe
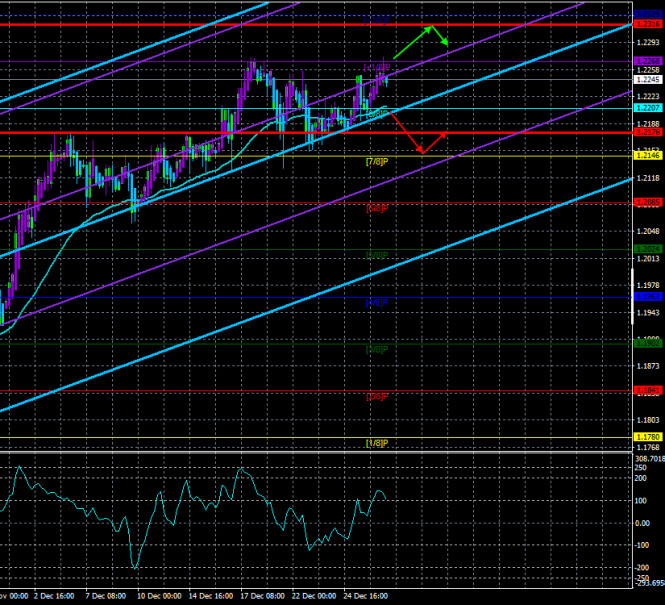
Technical details: Higher linear regression channel: direction - upward. Lower linear regression channel: direction - upward. Moving average (20; smoothed) - upward. CCI: 106.2500 The EUR/USD currency pair was trading very calmly and at the same time actively on Tuesday. There were no sharp reversals, however, the pair maintained an upward trend and continued its upward movement for most of the day. It is the continuation of the rise in the price of the European currency and the fall of the dollar that still raises a huge number of questions. However, along with the bewilderment, we have repeatedly talked about the possible reasons for the fall of the US currency. The two most likely causes are: 1) the actions of major players do not follow the logic of the market; 2) speculative growth of the euro. The first reason suggests that major players (central and commercial banks, large companies, and enterprises) can carry out transactions in the foreign exchange market without starting from macroeconomic indicators, as most ordinary traders do. They buy and sell currency based on their calculations, analysis, and needs. It turns out that now is a time when the analysis of ordinary traders does not coincide with the analysis of major players. And since the market is not driven by small traders, then the movement turns out to be illogical. The second reason is even more simple. The instrument (or currency) becomes more expensive for a long time and more traders want to join the trend and "skim the cream". Therefore, without any reason, they buy a more expensive asset (bright examples: Bitcoin, oil), which leads to their even greater growth. At this time, the euro and the pound are rampant in price, so they can buy without hesitation. At the end of the year, the markets receive almost no important information. Certain news is available, however, they are not important for currencies and traders. We have already said that at the end of the year, the United States managed to avoid a new "shutdown", and the budget for 2021 and a package of economic stimulus measures were finally signed. Trump has about 22 days left in power, and he does not want to spend them on a "shutdown". We believe that now is the time to take stock of the presidency of Donald Trump. If you survey the world, 90% of respondents will answer that Trump is the most controversial US president in recent decades, and maybe a century. Many high-ranking politicians in the United States are also businessmen, however, Trump is a businessman in the square. And this quality of his, which can bring him billions of dollars, played a cruel joke on him as president of the country. Perhaps in business, it is possible to conduct business from a position of force, pressure, threats, and other various "tricks". However, when it comes to politics, especially international politics, Trump has forgotten that any of his actions and words will be carefully analyzed, discussed, and criticized. Roughly speaking, Trump was 4 years under the microscope of the American public, and especially the media, for which "finding information" is bread. Thus, in the case of Trump, a whole bunch of information got out. It is enough to recall the most high-profile scandals with Trump: the impeachment case, an attempt to put pressure on Ukrainian President Zelensky in the investigation of the Biden cases in Ukraine (to remove the main competitor in the fight for the 2020 election), concealment and tax evasion (when it turned out that Trump's companies show losses in financial reports from year to year). Also, Trump managed to be remembered for a whole series of breaks in international treaties (the climate treaty, the treaty on the elimination of intermediate-range and short-range missiles, the nuclear agreement with Iran, the withdrawal from the WHO). Trump also became the first president who tried to communicate with people through social networks. However, it was not communication, but information. Trump probably figured that 20 posts a day on Twitter would make him closer to the people and miscalculated. The number of unverified, blatantly false statements and posts that Trump made every day, sooner or later should have raised questions for all Americans. They did. Almost every message of Trump was marked as "misleading" and "inconsistent with the truth" on Twitter and Facebook. Can you imagine this level of absurdity when a social network openly declares that the president is lying or talking nonsense? This state of affairs is the norm. Do not forget that Trump completely quarreled with all the media, which should have published and shown only the information that would be beneficial to him. Trump suddenly forgot that the media in the United States is independent. Although everyone supports a particular political party or presidential candidate, they are still the same business structures like the one that Trump himself owns. This means that profit comes first. A separate story on the wall on the border with Mexico can be recalled. Wanting to stop the endless flow of illegal migrants from this country, Trump proposed to build a wall on the border with it. Naturally, Trump said that Mexico itself would pay for the wall, then began frantically looking for money for this project, which led to the longest "shutdown" in the country's history in January 2019. Trump did not find the funds in full, so only 700 kilometers of the wall were built out of the total length of the border of 3.1 thousand kilometers. A wall that is not difficult to climb with the help of an ordinary ladder. Also, Trump failed to repeal the Affordable Care Act, which was passed by Barack Obama, the so-called Obamacare. Further. How can we not recall Trump's attitude to health care and the environment? Ecology, according to the president, only hindered economic growth, and health issues were at the last place in the list of important tasks of the president. What this led to is visible at the end of 2020. Trump withdrew from the Trans-Pacific Partnership, revised the terms of the North American Free Trade Agreement, launched a trade war with China, imposed trade duties against several other countries, unilaterally withdrew from the nuclear deal with Iran, and lying that Tehran violates its terms, although the other parties to the agreement (Russia, China, Germany, France, Great Britain) stated that the terms were not violated by Iran. In general, Trump has destroyed and broken more than he has created and improved in 4 years.
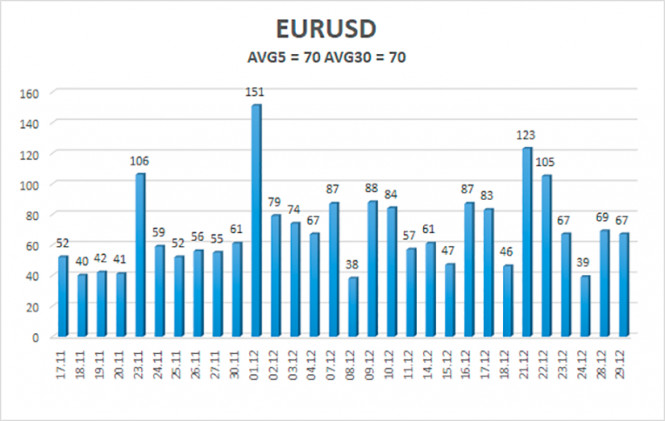
The volatility of the euro/dollar currency pair as of December 29 is 70 points and is characterized as "average". Thus, we expect the pair to move today between the levels of 1.2176 and 1.2316. The reversal of the Heiken Ashi indicator downwards signals a new round of downward correction. Nearest support levels: S1 – 1.2207 S2 – 1.2146 S3 – 1.2085 Nearest resistance levels: R1 – 1.2268 R2 – 1.2329 Trading recommendations: The EUR/USD pair has started a new round of upward movement. Thus, today it is recommended to keep open long positions with a target of 1.2316 until the Heiken Ashi indicator turns down. It is recommended to consider sell orders if the pair is again fixed below the moving average with a target of 1.2146. The material has been provided by InstaForex Company - www.instaforex.com |
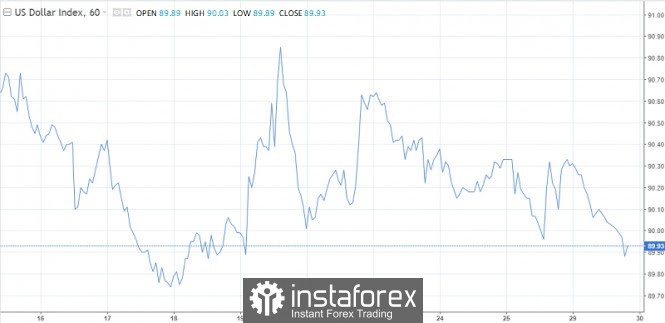
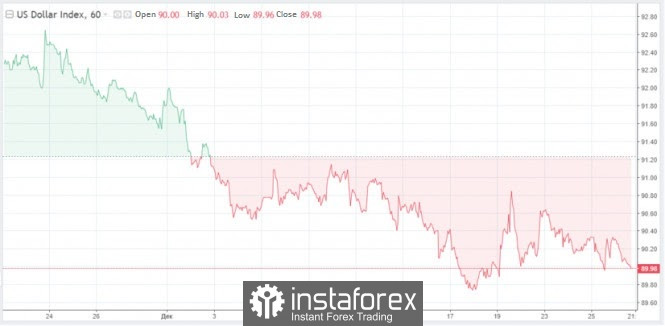
| USDX: Dollar can breathe before falling below 90 points Posted: 29 Dec 2020 01:38 PM PST The forecasts do not bode well for the dollar next year. And as it got closer, traders almost doubled their rates against the US currency. According to the CFTC, the volume of net short positions of non-commercial traders in the dollar index futures has jumped to its highest levels in the last nine years. The weakening trend in the US dollar against major world currencies will continue due to a number of factors. According to currency strategists, the Federal Reserve's monetary policy will contribute to such dynamics. Therefore, "institutional investors will have an increased need to search for more risky investments, including in other currencies," experts write. There are also opposite points of view. Perhaps the new American leader Joe Biden will not interfere in the activities of the central bank, as his predecessor did. Trump, as everyone remembers, put pressure on the Fed to ease monetary policy and lower the dollar. "Trump needed a weak dollar, zero rates and unlimited quantitative easing to win the trade wars, which, judging by the dynamics of the trade balance, in the end, could not succeed," analysts write. Meanwhile, the new head of the Treasury, Janet Yellen, is expected to contribute in every possible way to market exchange rates, free from outside interference. This is unlikely to help the dollar, at least in the first half of the coming year. The fact that Washington will focus on a strong dollar has not yet been confirmed. Thus, the trend will remain downward. More aggressive moves by the Fed contribute to this. In addition, these very steps may be revised upward after the adoption of a new stimulus package by Congress. The strengthening of the dollar next year should not be ruled out. Naturally, we are talking about corrective growth during a period of short-term pessimistic sentiments in global markets. Unless a new catastrophe occurs in the form of the coronavirus or other shocks that could break the current upward trend in the stock market, the US dollar will mostly trade in the red. Analysts do not exclude a correction in the US currency at the very beginning of the year. What do we see now? The dollar index is still at its lows in 2.5 years, but has not managed to gain a foothold below 90 points. This is the so-called milestone, from which the lion's share of investment bank analysts predicted a protracted drop in the greenback for the whole of 2021. Today, after another attack by sellers, the dollar index went below 90. It will not be easy to go beyond this turning point. The greenback is at a crossroads, its further dynamics will depend on how quickly after the coronavirus crisis the economies of European and Asian countries will recover in comparison with the United States. If America lags behind the rest of the world, investing in stocks outside the US will become more attractive than in the outgoing year. The prospect of further weakening of the dollar against a basket of competitors will remain. As for the correction that some market players expect from the dollar at the beginning of the year, it is associated with a shortage of cash. There is almost no free money left on the market, more than 96% of all funds have already been invested in securities. This means that in January a partial return of investors in the dollar is possible. The drama certainly won't happen. The most that we will see is a correction phase similar to the one that took place after the dollar index fell in June and September. That is, about 3% for the dollar index. Thus, in January volatility may surge in favor of the dollar. One has only to take into account that it will be short-lived, on average up to three weeks, analysts predict. In this scenario, the EUR/USD pair will decline from the current 1.22 to 1.18. In general, the European economy will recover as the pandemic recedes and the lockdowns weaken. This will be facilitated, among other things, by the stimulating policy from the ECB. "Taking into account the fact that the real interest rate in the euro area is above zero, while in the US it is below zero, the euro will maintain its advantage over the dollar in 2021 by this criterion," analysts write. The high demand for risk will also play a role. During such periods, the single currency tends to strengthen against the dollar. EUR/USD in the new year may update its high since February 2018, surpassing the 1.25 level. The material has been provided by InstaForex Company - www.instaforex.com |
| Posted: 29 Dec 2020 01:38 PM PST Hourly chart of the GBP/USD pair
The GBP/USD pair began to correct and spent the whole day doing it. Since the upward trend for the pair has already reversed, we advised you to consider opening short positions. Since there was no sell signal during the day, you should not have opened positions today. At least following our recommendations. In general, after breaking the rising trend line, the downward trend persists, so you need to wait for a new sell signal from the MACD, especially since this indicator has already been sufficiently discharged (above the zero level). As for long positions on the British pound, a new upward trend is unlikely to form in the near future, therefore you should not consider them yet. Fundamentally, there is still absolutely nothing to say now. The UK and the European Union have both agreed on a trade deal, but now there is little to do - it needs to be ratified by both parliaments. The British Parliament will meet to decide this issue on Wednesday, the European Parliament - in February-March next year. However, in fact the deal has already been approved and is unlikely to be rejected by any parliament. Thus, they are just formalities, and the solution is unlikely to affect the pound/dollar pair. We do not expect any important news in the last two days of the outgoing year. The main thing is to end the year without unnecessary losses in the final days. No important macroeconomic reports or other events scheduled for Wednesday, December 30. Thus, there won't be a fundamental background, but this does not mean that the pound/dollar pair will be immobilized. As we could see, the trades were quite active in recent days. Possible scenarios on December 30: 1) Buy orders have lost their relevance, since the price settled below the trend line. And so, the bulls have released the initiative and now we need to wait for a new upward trend in order to be able to trade up. Such a trend is unlikely to appear the next day. 2) Sell positions are more relevant now. The pair corrected and is now preparing for a new round of downward movement. Thus, novice traders can only wait for a new sell signal from MACD and open new short positions while aiming for the support level of 1.3392. On the chart: Support and Resistance Levels are the Levels that serve as targets when buying or selling the pair. You can place Take Profit near these levels. Red lines are the channels or trend lines that display the current trend and show in which direction it is better to trade now. Up/down arrows show where you should sell or buy after reaching or breaking through particular levels. The MACD indicator consists of a histogram and a signal line. When they cross, this is a signal to enter the market. It is recommended to use this indicator in combination with trend lines (channels and trend lines). Important announcements and economic reports that you can always find in the news calendar can seriously influence the trajectory of a currency pair. Therefore, at the time of their release, we recommended trading as carefully as possible or exit the market in order to avoid a sharp price reversal. Beginners on Forex should remember that not every single trade has to be profitable. The development of a clear strategy and money management are the key to success in trading over a long period of time. The material has been provided by InstaForex Company - www.instaforex.com |
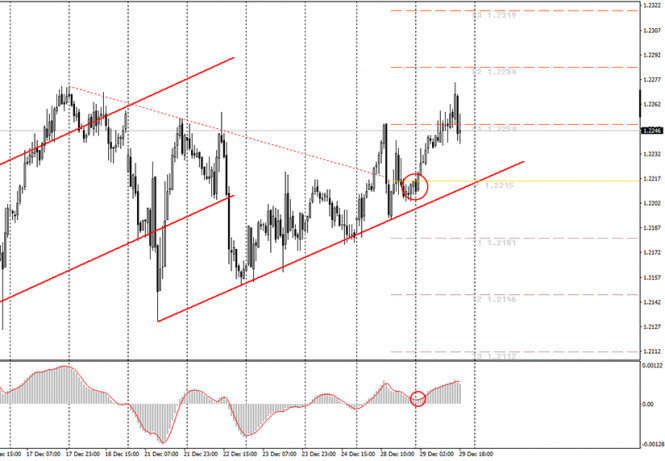
| Posted: 29 Dec 2020 10:37 AM PST EUR/USD hourly chart
On Tuesday, the EUR/USD pair resumed its upward movement and tested the first key target level of 1.2250. A downward correction started just a few hours ago. Before that, the pair had been developing a steady uptrend. Last night, the MACD indicator formed a new buy signal. Those traders who managed to enter the market using this signal should have gained a profit of about 25 pips, even though there was a pullback to the downside. Those who joined the trend in the morning could have also earned some pips if they had closed their trades near the resistance level of 1.2250. The ascending trendline still confirms the uptrend. So now we should wait until the downward correction is completed and a new buy signal from the MACD indicator is formed, or until the price rebounds from the trendline. If the quotes settle below the trendline, we can start selling the pair, but it is still a long way to go. In general, the euro/dollar pair is trading quietly around 2.5-year highs ahead of the new year. On December 29, no important economic reports were released. This means that beginners had to trade using only technical signals, which could be quite a successful strategy. However, in the course of the New York session, the pair faced a sharp fall by 30 pips. On the other hand, there was no important news during the day, so markets had no drivers to react to. On Wednesday, the EU and the US do not expect any major macroeconomic news. So, the fundamental picture will stay mostly unchanged during the day. Traders will again have to rely on technical analysis as long as the trend persists. Currently, the pair is trading in an upward trend. Possible scenarios for December 30 1) Long positions on the pair remain relevant at the moment since the price has passed the descending trendline, while the uptrend is still in place. Now we should again wait until the MACD indicator reaches a zero level and forms a new buy signal. After that, we can consider opening new long positions with the targets at 1.2270 and 1.2284. Also, a price rebound from a trendline can be used as a buy signal. 2) Trading short does not seem appropriate now. You can consider placing new sell orders only when the price settles below the ascending trendline. In this case, you can open short positions with the targets at 1.2167 and 1.2152. On the chart Support and Resistance Levels are the Levels that serve as targets when buying or selling the pair. You can place Take Profit near these levels. Red lines are the channels or trendlines that display the current trend and show in which direction it is better to trade now. Up/down arrows show where you should sell or buy after reaching or breaking through particular levels. The MACD indicator (14, 22, and 3) consists of a histogram and a signal line. When they cross, this is a signal to enter the market. It is recommended to use this indicator in combination with trend patterns (channels and trendlines). Important announcements and economic reports that you can always find on the economic calendar can seriously influence the trajectory of a currency pair. Therefore, at the time of their release, we recommend trading as carefully as possible or exit the market in order to avoid sharp price fluctuations. Beginners on Forex should remember that not every single trade has to be profitable. The development of a clear strategy and money management are the key to success in trading over a long period of time. The material has been provided by InstaForex Company - www.instaforex.com |
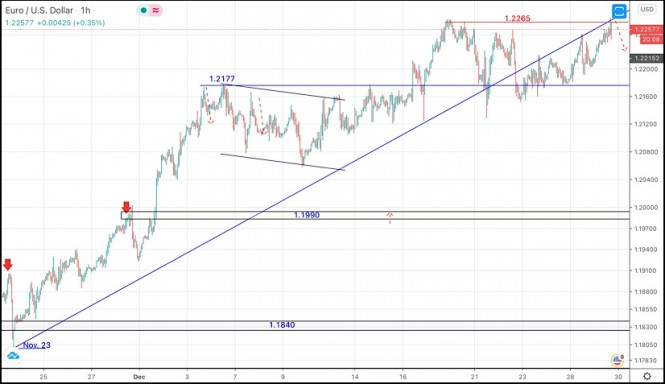
| December 29, 2020 : EUR/USD daily technical review and trade recommendations. Posted: 29 Dec 2020 08:48 AM PST
By the end of November, Signs of BUYING Pressure have been initiated around the depicted price zone of 1.1800-1.1840.Shortly after, the EUR/USD pair has demonstrated a quick upside movement.The pair has targeted the price levels around 1.1990 initially which exerted considerable bearish pressure bringing the pair back towards 1.1920 which constituted a temporary KEY-Zone for the EUR/USD pair.That's why, another episode of upside movement was expressed towards 1.2160 where a false breakout above the price level of 1.2200 was regarded as a considerable bearish reversal signal.Two weeks ago, a short-term reversal pattern has been demonstrated around 1.2265. Intraday downside retracement to the downside was expected to occur. However, the EUR/USD pair has failed to pursue towards lower price levels.On the other hand, Bearish closure below the mentioned price zone of 1.2200 - 1.2170 is needed to turn the intermediate outlook for the pair into bearish and enhance a quick bearish decline towards 1.2040 then 1.1920.Trade Recommendations :-Conservative traders are advised to look for SELL Positions around higher price levels near 1.2250-1.2270. Exit level should be placed above 1.2300. Target levels should be located around 1.2200, 1.2170 then 1.2120. The material has been provided by InstaForex Company - www.instaforex.com |
| December 29, 2020 : EUR/USD Intraday technical analysis and trade recommendations. Posted: 29 Dec 2020 08:26 AM PST
|
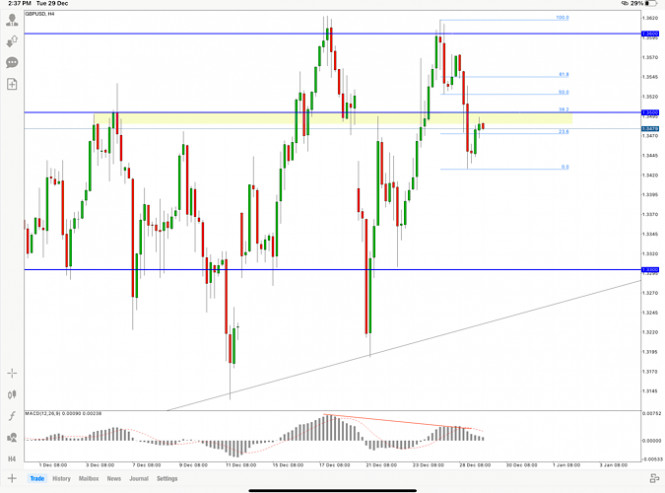
| December 29, 2020 : GBP/USD Intraday technical analysis and trade recommendations. Posted: 29 Dec 2020 08:19 AM PST
In December, the price levels of (1.3380-1.3400) have prevented further bullish movement for the past few weeks.Bearish target was targeted around 1.3300. However, the pair has failed to pursue towards lower targets.Instead, a bullish spike was expressed towards 1.3480-1.3500 where the upper limit of the depicted movement channel has previously provided temporary bearish pressure on the pair.Shortly after, another bullish spike has recently been demonstrated towards 1.3600 where the upper limit applied considerable bearish rejection again.Recently, the GBPUSD pair looked overbought while consolidating above the key-level of 1.3400.As expected, bearish reversal was recently initiated around 1.3600. A quick bearish decline was demonstrated towards 1.3200.Intermediate-term outlook could turn into bearish if only the EUR/USD pair maintains movement below 1.3400.However, the pair has failed to maintain bearish decline below 1.3200.Instead, bullish persistence above 1.3400 invalidates the bearish scenario for the short-term.Another temporary bullish movement may be expressed towards 1.3700 (the channel's upper limit) where bearish rejection should be anticipated. The material has been provided by InstaForex Company - www.instaforex.com |
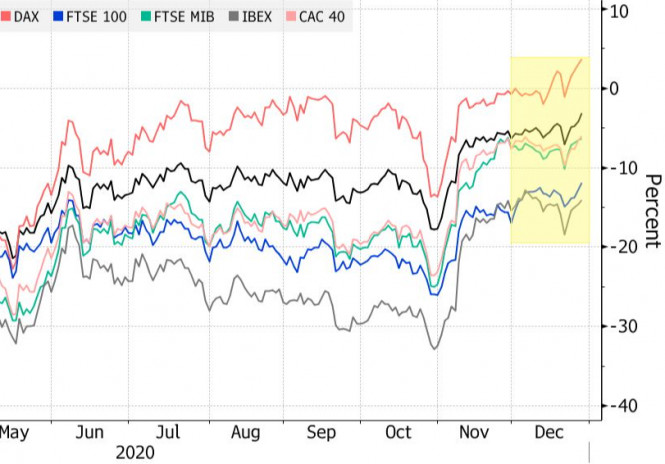
| Stock Europe continues to rally Posted: 29 Dec 2020 07:07 AM PST
The pan-European STOXX 600 is up 1.2%. The index climbed for the fifth consecutive session and reached a new 10-month high. UK indices did the best with the FTSE 100 blue-chip index up 2.6% on its first day of trading following Thursday's Brexit trade agreement between the UK and the European Union. AstraZeneca shares rose 4.7%. The growth was driven by news that the British government is expected to approve a COVID-19 vaccine for emergency use within days. The pound sterling has strengthened weakly as investors worry that the tight-knit nature of the deal will further tear the UK away from the EU than was anticipated in 2016. Germany's DAX rose 0.5% and extended record gains after Wall Street climbed to all-time highs in hopes of expanding a long-awaited relief package for the US population and economy. The US House of Representatives met President Donald Trump's demands and voted to provide checks to households in the amount of $ 2,000, pushing the bill further to the Republican-controlled Senate. Shares in the software group SAP rose 2.2%, supporting the DAX after Qualtrics International's division filed for an initial public offering in the United States. Travel and leisure stocks rose more than other sectors, with TUI, Lufthansa and British Airways, which owns IAG, up 3.3% to 10.4%. Vaccinations in the EU began over the weekend and were among the first to receive vaccinations from Pfizer for healthcare workers and residents of nursing homes across the EU. The material has been provided by InstaForex Company - www.instaforex.com |
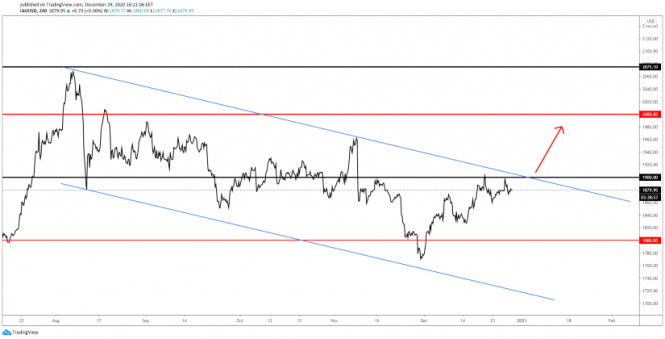
| Gold Could Change Its Direction Posted: 29 Dec 2020 06:41 AM PST
Gold (XAU/USD) stands right below the $1,900 level and under the downtrend line. Jumping and stabilizing above these levels will definitely bring a buying opportunity. The price is somehow expected to escape from this downward channel pattern after failing to reach and retest the lower boundary of the channel support. The price of gold could increase further if USD (US Dollar) depreciates against other major currencies. GOLD Trading TipsWe may have a buying opportunity if gold (XAU/USD) reaches the $1,920 level. The $2,000 and the $2,075 are seen as potential upside targets. The material has been provided by InstaForex Company - www.instaforex.com |
| Market optimism pushes EUR/USD pair up. Dollar retreats, and euro intends to consolidate its success Posted: 29 Dec 2020 06:12 AM PST
In the outgoing year, central banks and governments of the world's largest countries have resorted to unprecedented measures of monetary and fiscal support, against the backdrop of the pandemic. The main beneficiaries of which were the stock markets. In particular, the S&P 500 index was able not only to recover from the March collapse but even to grow to record highs. At the same time, the US dollar, whose money supply has increased by $3.5 trillion since the beginning of the pandemic, has depreciated against the euro by about 15%. From March to December, the single currency won back most of the positions lost over the past almost two years. The EUR/USD pair has remained bearish since reaching 1.2500 in February 2018. In March of this year, it reached a multi-year low near 1.0650. The subsequent growth returned the pair to the highs of April 2018 above 1.2200. The euro has become one of the strongest currencies in the Big Ten this year and is still in demand for a number of reasons. First, the single currency is expected to benefit no less than the pound from a trade deal between the European Union under Brexit, as a breakdown in negotiations would undermine economic activity in both regions. Second, the strict quarantine measures taken by the authorities of France, Italy, Spain, and the Netherlands seem to have begun to bear fruit in the form of smoothing the COVID-19 incidence curve in these countries. A similar improvement in the epidemiological situation can be expected in Germany. "The EUR/USD pair has confidently overcome the resistance around 1.2000 and looks set to gain good support for potential moves towards 1.3000 in the first quarter of 2021," Westpac strategists said. "The EU is now set to implement its Recovery Fund. While this process may be lengthy, it will support national fiscal expansion and reduce pressure on the ECB, as well as improve the euro's outlook, providing greater confidence across the region," they added. US stock indexes, in tandem with which the main currency pair has been moving recently, jumped on Monday, and the protective greenback was again under pressure. There are only a few days left until the New Year, and there are enough reasons for optimism. In particular, US President Donald Trump finally signed the law on stimulating the US economy. "The adoption of financial assistance measures in the US is an incentive for those who are betting on a lower dollar," said strategists at Mizuho Bank. On Tuesday, the USD index is trading near the lowest levels in two and a half years, trying to form support around 90 points. The euro is rising against the more reliable dollar for the fifth day in a row. During this time, the exchange rate euro outgrow the USD by 0.6%. It is assumed that against the background of an almost empty economic calendar for the eurozone this week, the main currency pair will remain at the mercy of the dynamics of the dollar and risk sentiment. On Wednesday, reports on business activity in Chicago and the US trade balance will be released. On Thursday, a report on applications for unemployment benefits in the country will be published. Markets will be closed on Friday for New Year's Eve celebrations. The material has been provided by InstaForex Company - www.instaforex.com |
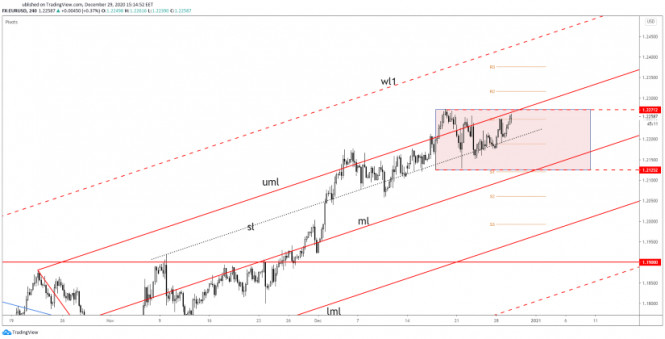
| EUR/USD Upside Continuation Signaled Posted: 29 Dec 2020 06:10 AM PST EUR/USD edges higher again as the USDX is plummeting. The pair is about to hit the 1.2271 static resistance. A valid breakout of this level could validate further growth. The outlook remains bullish after its failure to reach a new lower low. Invalidating the bearish divergence could bring a strong rally in the short term. I have mentioned in my previous analysis that the price has shown some overbought signs but this is not enough for us to consider going short. EUR/USD will continue to increase as long as the US dollar index drops. EUR/USD Downside Invalidated
EUR/USD failed to reach and retest the former low at the 1.2125 static support, signaling that the bulls are still in charge. Registering a valid breakout above the 1.2271 former high and through the upper median line (UML) suggests buying. Still, you should be careful around the immediate resistance levels as any false breakout with great separation, or any other reversal pattern that may invalidate further growth, could bring a corrective phase. EUR/USD Trading ConclusionBuy on a valid breakout (bullish closure and retest) above the 1.2271 high with a potential upside target at the 1.24 level. The material has been provided by InstaForex Company - www.instaforex.com |
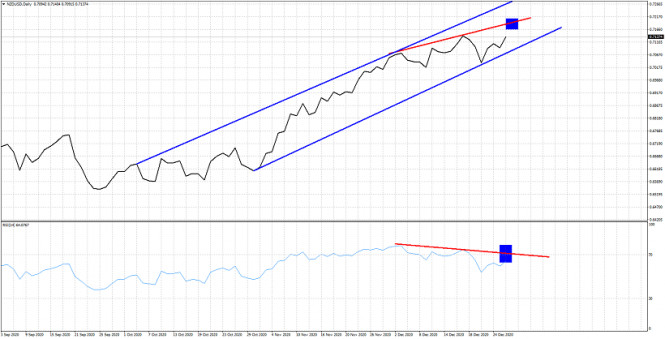
| Posted: 29 Dec 2020 06:07 AM PST In a previous analysis we noted the bearish divergence of the RSI in NZDUSD and we explained that we prefer to be neutral if not bearish but certainly not bullish at current levels. Price pulled back a little bit but key support did not break in order to confirm the start of a pull back.
Blue rectangle- possible top Red lines - bearish divergence NZDUSD remains above the key support level of 0.70 and still inside the bullish channel. The bearish divergence could repeat while price makes a new higher high around 0.72 and the RSI gets rejected around the 70 level. We continue to be pessimistic for NZDUSD however there is no confirmed reversal signal yet. As we have said many times, the bearish divergence is just a warning and not a reversal signal, so traders need to plan their strategy accordingly. The material has been provided by InstaForex Company - www.instaforex.com |
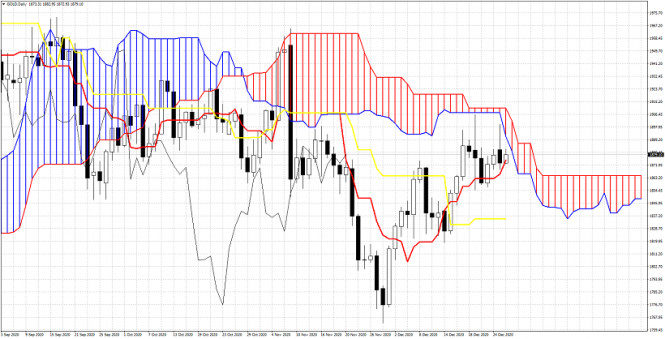
| Ichimoku cloud indicator Daily analysis of Gold Posted: 29 Dec 2020 06:01 AM PST Gold price remains below key cloud resistance. As we explained in previous analysis, the $1,900 level remains important resistance and in order for bulls to hope for another run towards $1,980-$2,000 level, they need to recapture $1,900. On the other hand failure to do so combined with a break below $1,850 will lead to a move lower towards $1,800-$1,790.
|
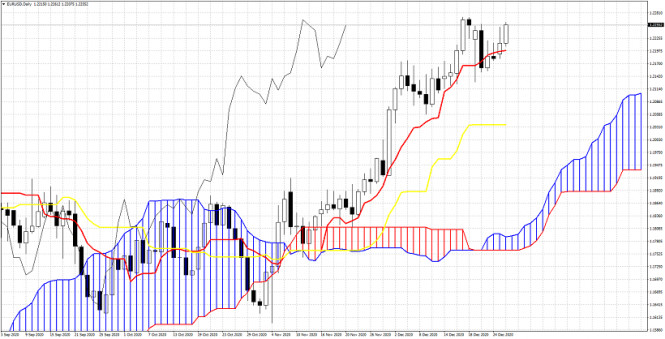
| Ichimoku cloud indicator Daily analysis of EURUSD Posted: 29 Dec 2020 05:55 AM PST EURUSD remains in a bullish trend Price respects the tenkan-sen indicator and despite a short-term move below it, bulls managed to recapture it and they are now challenging recent highs.Trend so far never changed and all indicators continue to support the bullish scenario.
|
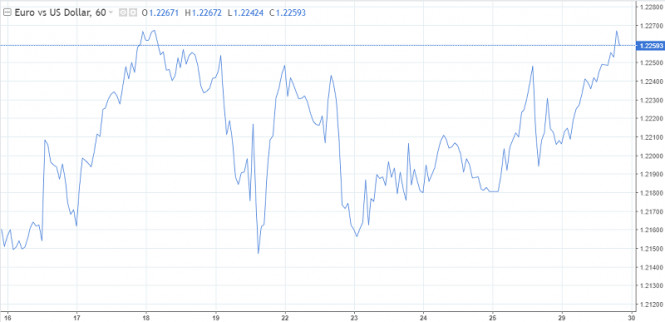
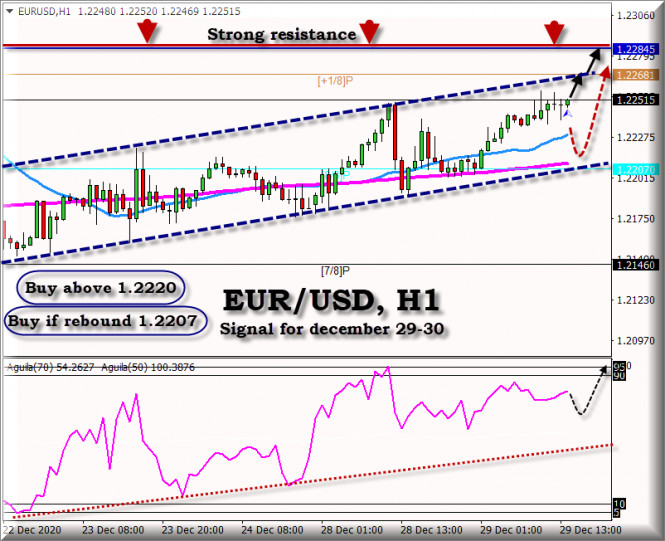
| Trading Signal for EUR/USD for December 29-30, 2020 Posted: 29 Dec 2020 05:52 AM PST In the early New York session, the EUR/USD pair is trading at the level of 1.2250 with the upward potential heading for the 1.2268. The pair is likely to reach a strong resistance level of 1.2285 in the next few hours due to the USDX weakness. A GAP has been formed at the 89.65 level, and we hope that the pair will cover it in the coming days and will develop the upward momentum. Another factor to weigh on USDX is that the United States voted in favor of increasing the stimulus payments to Americans to $2,000 from the approved $600 and sent the decision to the Senate to vote. If approved, it could further weaken the US dollar index, and EUR/USD will gain upward momentum to reach the 1.23 level in the short term. On the 1-hour chart, you can see that EUR/USD is trading above the 21-day SMA and the 200 EMA which shows that the euro market is strongly bullish. However, a breakout below the 200 EMA could lead to a correction to the support levels of 1.2085. Our recommendation is to trade the EUR/USD pair in the uptrend. So, if you see a retracement to the 21 SMA line, it would be a good buying opportunity. A pullback to the 8/8 Murray level at 1.2207 will give the market more bullish strength. We should avoid buying the euro/dollar pair if it trades below the 200 EMA as this could accelerate the decline to the 7/8 and 6/8 Murray level where we expect it to consolidate. Market sentiment for December 29 shows that 68.75% of traders are selling EUR/USD. This means that even though the bullish trend is prevailing in the market, the euro/dollar pair could face the 1.23 zone in the short term.
Trading tip for EUR/USD for December 29 – 30 Buy above 1,2220 (SMA 21) with take profit 1.2268 and 1.2285, stop loss below 1.2185. Buy if the pair rebounds around 1.2207 (8/8), with take profit at 1.2268 (+1/8 of Murray) and 1.2285, stop loss below 1.2175. The material has been provided by InstaForex Company - www.instaforex.com |
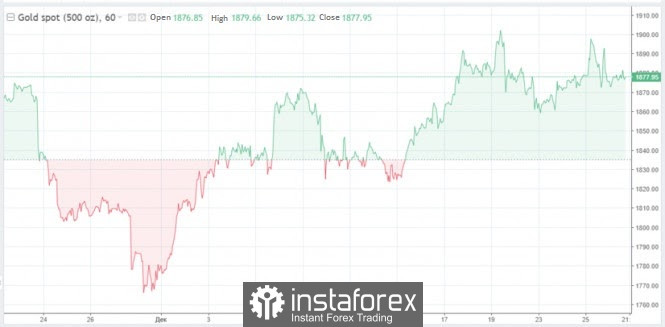
| Price of gold soar amid weak dollar Posted: 29 Dec 2020 05:38 AM PST The price of gold soared on Monday which is largely due to the weakening of the US dollar. The greenback continues its decline, as investors began to buy riskier currencies. This is largely due to the vote in the US House of Representatives, which approved the initiative of President Donald Trump to raise the amount of relief payments to households: the initially agreed amount of $600 was increased to a quite significant $2,000 (we are talking about a new package of assistance to combat coronavirus). The US House of Representatives voted on this issue on Monday, which resulted in the majority of votes in favor of raising the amount of one-time assistance to citizens to $2,000. It is not yet clear whether this new version of the stimulus and government spending bill will be approved in the Senate. The latter is under the control of Republicans, and they have traditionally opposed the increase in payments. But it is worth admitting that they are under pressure from both sides. However, the increase in payments will provide more effective support for citizens' spending in the short term. The spot price of gold on the background of this news rose by 0.11% to $1,876. 85 per troy ounce. On Monday gold prices rose 1.3% The dollar exchange rate against a basket of major world currencies fell by 0.32%, trading near the level of 90.00 The weakening dollar favors the growth of gold, but most of the positive news for the precious metal, such as US incentives, is already embedded in the existing value. The risk of a decline in quotes is very high, because new data on the number of coronavirus cases may well provoke market participants to buy up the traditionally more reliable dollar. Nevertheless, gold this year proved that it still has the status of a completely reliable investment asset. The decline in rates in the US dollar, as well as the growth of uncertainty, determined increased demand and, as a result, a powerful rally that lasted until the fall. The price of gold even updated the historical high, reaching $2,075 per ounce. However, in the future, profit-taking quickly turned into a sell-off, and the volume of gold in physical ETFs began to show an active reduction. Over the past week, gold was trading at $1,880 per ounce (that is, about 25% higher than similar levels a year earlier). The volume of gold in physical ETFs has also normalized, meaning that investors' attitude to gold is not unambiguously negative at the moment. In general, we can say that the current year has been very successful for gold quotes. The material has been provided by InstaForex Company - www.instaforex.com |
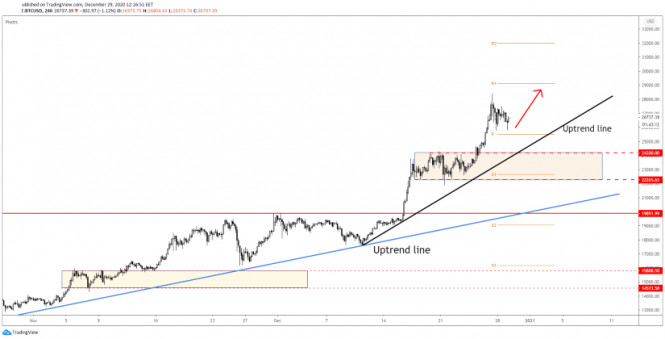
| Bitcoin Goes For New All-Time Highs Posted: 29 Dec 2020 04:43 AM PST Bitcoin increased to $28,387 on Sanday, registering a new historical high. The price is strongly bullish and it could resume its uptrend after the current minor retreat. Technically, BTC/USD is expected to jump higher to approach and reach fresh highs as the uptrend is intact and unharmed. Fundamentally, the COVID-19 crisis helped the bitcoin price to increase, while a potential global economic crisis could lift the price as well. BTC/USD Ready For A Bullish Momentum!
As you can see on the H4 chart, the price is trading above the major uptrend line and above the minor black uptrend line. So, the outlook will be bullish as long as it stays above these dynamic support lines. The rate increased as expected after closing above the $24,300 static resistance, a former high. The price decreased, but it failed to reach the Pivot Point ($25,510) signaling strong buyers. The short term bias is bullish as long as it stays above the Pivot Point and above the minor uptrend line. The R1 ($29,114) and the R2 ($31,993) could be used as upside targets. BTC/USD TipsThe current sideways movement above the PP (25,510) could help you to catch a new bullish momentum. Its failure to reach the PP could represent a buying signal as the price could approach at least the $28,387 historical high. BTC/USD failed to approach and retest the minor uptrend line in the last attempts announcing potential sharp growth. The material has been provided by InstaForex Company - www.instaforex.com |
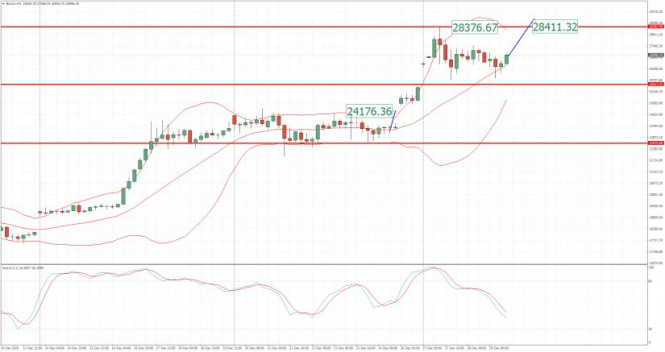
| BTC analysis for December 29,.2020 - Potential upside continuation towards $28.400 Posted: 29 Dec 2020 04:39 AM PST Further Development
Analyzing the current trading chart of BTC, I found that there is potential for the upside continuation towards the $28,400. Watch for potential buying opportunities on the dips with the the target at $28,400. I found that there is bull flag pattern in creation on the 4H time-frame, which is good indication for the upside continuation. Support level is set at $25,760 The material has been provided by InstaForex Company - www.instaforex.com |
| Posted: 29 Dec 2020 04:33 AM PST Standout day for Japanese stocks as Nikkei 225 breaches key milestone Nikkei 225 breaks above 27,000 for the first time since 1991The late rally into the year-end in the equities space is turning into a bit of a precursor for next year as we're seeing stocks get a sort of head start amid thinner liquidity conditions in trading this week. The Nikkei closed higher by a stunning 2.7% today before the final day of trading tomorrow and while window dressing may be part of a factor, the jump today breaks the consolidation period since the pause after the November rally.
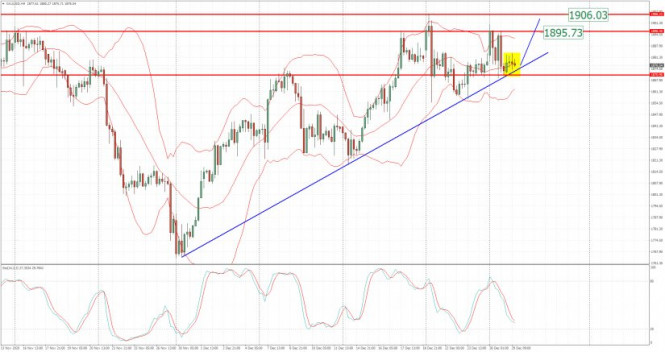
Further Development
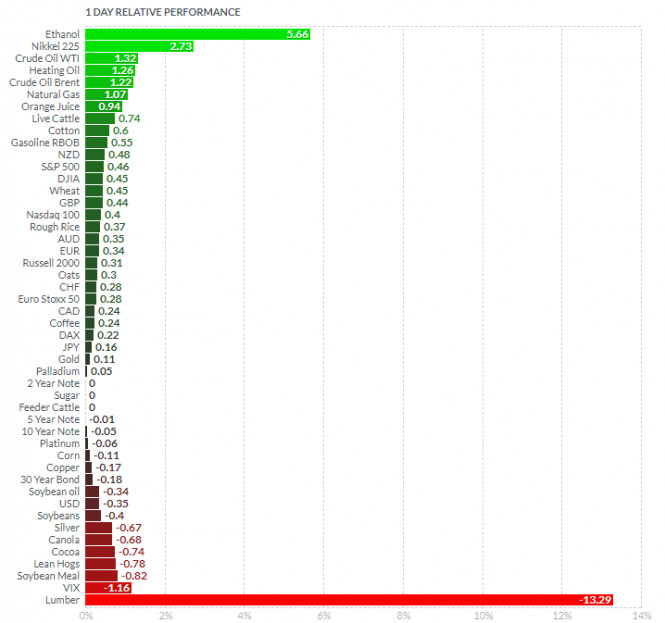
Analyzing the current trading chart of Gold, I found that there is the consolidation period, which is normal during the late December due to lower volatility and liquidity but there is still chance for higher prices. Watch for potential buying opportunities on the dips with the the targets at $1,895 and $1,905. Stochastic oscillator is showing potential bull cross, which is sign for another up cycle... 1-Day relative strength performance Finviz
Based on the graph above I found that on the top of the list we got Ethanol and Nikkei today and on the bottom Lumber and VIX. Gold is slightly positive for the day, which is sign for the continuation. Key Levels: Resistance: $1,895 and $1,905 Support level: $1,870 The material has been provided by InstaForex Company - www.instaforex.com |
| Posted: 29 Dec 2020 04:17 AM PST Georgia runoffs will be one of the first key risk events for the market going into the new year Will Republicans keep hold of the Senate or can Democrats seize control?The two runoff elections will take place on 5 January next year i.e. next Tuesday, with plenty on the line in determining how US politics will shape up under Biden's administration over the coming year(s). As things stand, Republicans hold 50 seats and Democrats 48 seats in the Senate. For Republicans to keep control, they would only need to win one of the two runoffs while Democrats need to win both to technically take control of the Senate. A tie will result in vice president-elect, Kamala Harris, breaking the deadlock. In terms of hardcore Biden policies, the results here won't matter but the optics on its own may be enough to at least get the market feeling more relieved if Congress isn't divided Further Development
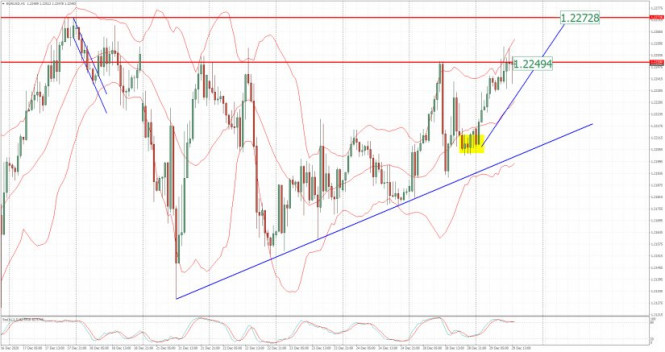
Analyzing the current trading chart of EUR, I found that the EUR reached my first yesterday's target at 1,2250 and is heading towards the second target at 1,2270. Watch for potential buying opportunities on the dips with the the target at 1,2270. Stochastic oscillator is showing the fresh bull cross, which is confirmation for the upside continuation. 1-Day relative strength performance Finviz
Based on the graph above I found that on the top of the list we got Ethanol and Nikkei today and on the bottom Lumber and VIX. Key Levels: Resistance: 1,2270 Support level: 1,2235 The material has been provided by InstaForex Company - www.instaforex.com |
| GBP/USD price analysis for 29 December, 2020 Posted: 29 Dec 2020 04:10 AM PST Key Highlights
GBP/USD trims the biggest losses in one week as buyers battle intraday high near 1.3500. Britain registers record high COVID-19 cases. The study suggests the need to vaccinate two million people a week to prevent a third wave. GBP/USD rose to 1.348 during Tuesday's Asian session. The pair is trading not far from the previous daily low at 1.3428 and at risk of extending its decline. On the 4-hour chart, there was a downside correction below the 1.3500 resistance level, which coincides with the Fibonacci retracement levels. In the meantime, the formation of the bearish divergence (MACD) suggests a reversal to the south. The pair could extend its slump to 1.330 On the upside, the main resistance is near the 1.3600 zone. A close above the 1.3600 level is a must for the upside continuation. In case the quote manages to cross 1.3600 on a daily closing, it will need to pierce the monthly peak around 1.3625 before eyeing the March 2018 low near 1.3710. The material has been provided by InstaForex Company - www.instaforex.com |
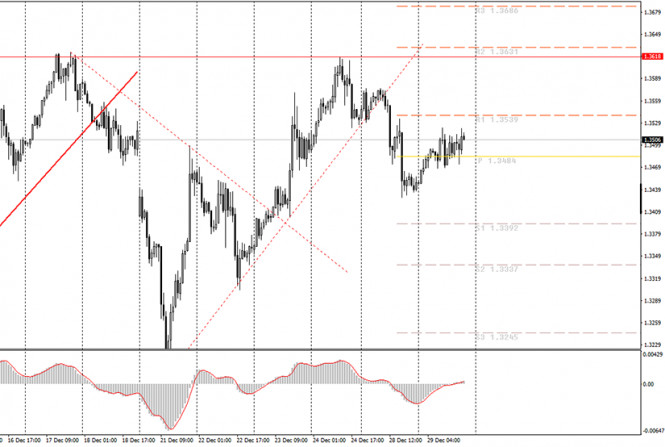
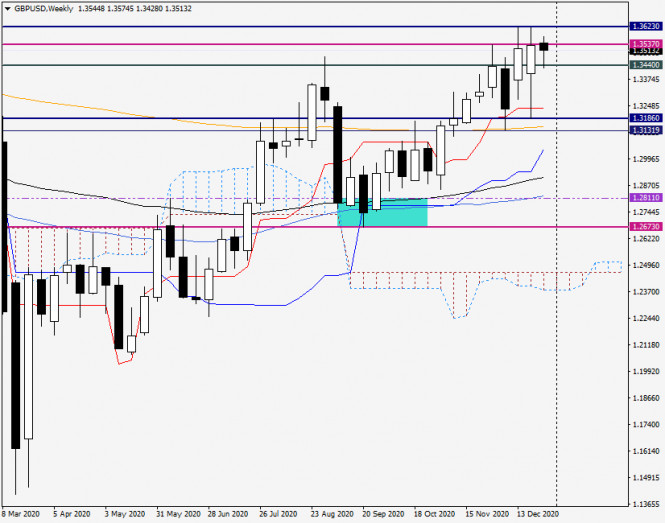
| Analysis and Forecast for GBP/USD on December 29, 2020 Posted: 29 Dec 2020 04:08 AM PST Today's review of the pound/dollar pair starts with a breakdown of the weekly time frame. It should be recalled that the main and extremely positive event for the British currency was the agreement to sign a trade agreement, which avoids the "hard Brexit" or no-deal option. If the House of Commons of the British Parliament ratifies this agreement, this will allow the British economy to avoid the most negative scenario, as it is known to anyone that the EU will remain the United Kingdom's largest trading partner, even after the UK's official exit from the European Union. Weekly
Despite the growth shown during two consecutive trading weeks, the pound/dollar pair failed to break through the sellers' strong resistance not only in the level of 1.3623, but also in the level of 1.3537. As a result of repeated attempts, the last level was only broken, however, the pound bulls failed to close the weekly session above the level of 1.3537. This happened despite the reached agreement on future trade relations with the European Union. Therefore, the current five-day period began negatively for the GBP/USD pair. It pulled back to the level of 1.3428, found a strong support there and recovered its losses. If the downward trend continues to change into an upward one, and the bulls manage to complete the weekly trades above 1.3623, the direction will open to a strong and significant technical zone 1.3700-1.3740. On the other hand, if a bearish model of Japanese candlesticks appears as a result of attempts to break through the level of 1.3623, the pair can be expected for at least a corrective pullback. The target of which may be the price area of 1.3240-1.3180. Daily
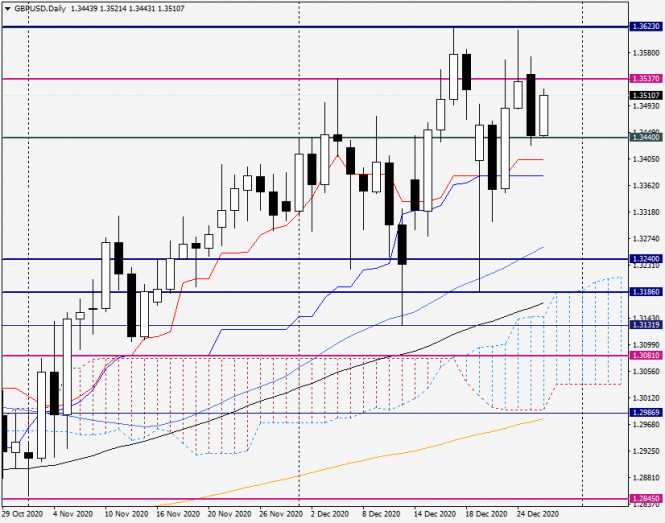
Yesterday, the pair showed a quite impressive decline and closed Monday's trading at the level of 1.3444 after the appearance of Friday's candle with a particularly long upper shadow. Today's trading for the GBP/USD pair is going positively. It is showing growth and is trading near the level of 1.3510. If the upward trend continues, the next task for the pound bulls will be to close today's session above yesterday's highs shown at 1.3574. Meeting this condition will allow you to retest the strong resistance level of 1.3623, where the maximum trading values were shown on December 17 and 24. However, the bulls should do its best, since the market has won back the positivity from the conclusion of the trade deal between the UK and the EU. Nevertheless, the main trading recommendation for the pound/dollar pair is to buy, which are best viewed after short-term declines to the area of 1.3460-1.3430. A signal to open sales will appear if a bearish candlestick analysis pattern forms on the daily, four-hour and/or hourly charts in the resistance price zone 1.3575-1.3620. In terms of today's economic calendar, the US house price index from S&P/Case-Shiller is the only statistics scheduled to be reported, which will be published at 14:00 Universal time. Despite this, I still believe that the course of trading will depend on market mood and the technical component. The material has been provided by InstaForex Company - www.instaforex.com |
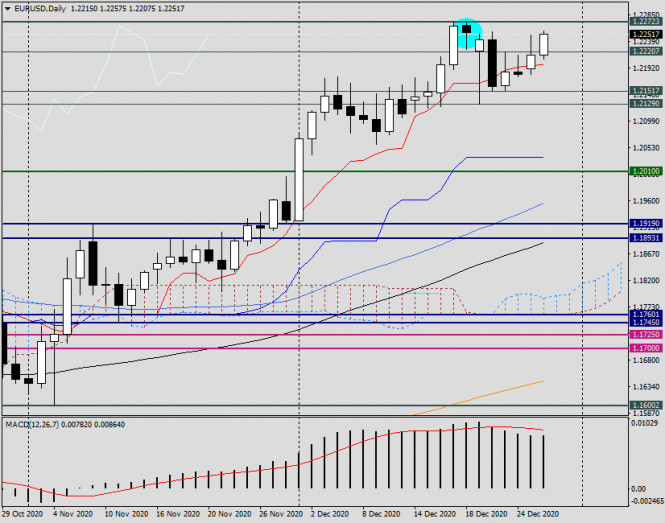
| Analysis and Forecast for EUR/USD on December 29, 2020 Posted: 29 Dec 2020 04:08 AM PST It was noted that yesterday's trading in the main currency pair of the currency market took place under the impact of the still current US President, D. Trump's signing of a bill regarding the $ 900 billion financial aid to the American economy, as well as the conclusion of a trade agreement between the European Union and Great Britain, for which the parliamentarians of the parting parties still have to vote. EU officials have negotiated quite decent terms for future trade relations with the UK, in particular, for fishing in British waters. However, it will become known tomorrow whether the House of Commons of the British Parliament will vote for this document. Basically, the British side has no other way to avoid economic collapse. Meanwhile, Europe is strongly getting ready to meet the third wave of COVID-19, especially after the virus began to mutate. According to the latest data, a new strain of coronavirus infection has already reached Germany. This could lead to an even greater tightening of quarantine measures, which will not be received well by the leading European economy. In addition, one of the most important topics recently is the mass vaccination of Europeans. However, in order to develop collective immunity against coronavirus, it is necessary to vaccinate about 70% of the inhabitants of European countries, which will take some time and the result will be only by spring. Today's economic calendar is almost empty, so the course of trading in the EUR/USD pair will be determined by market mood and the technical factor. Daily
The pair failed to rise above the level of 1.2250 and closed Monday trading at 1.2214, despite yesterday's initial growth. On the one hand, the closing of the day above the important level of 1.2200 can be attributed to the euro bulls. However, on the other hand, the strong resistance of the sellers at the level of 1.2272 remains an unbroken barrier that prevents the main currency pair from continuing to rise to higher prices. During the time of this writing, the euro/dollar is showing growth and is trading near the level of 1.2243, but the day has not yet ended and it is not known how it will end. If the quotes continue to rise and today's trading ends above 1.2272, this will be a signal that the pair is ready to continue its growth. As mentioned before, the nearest target will be the strong price zone 1.2300-1.2320. If a bearish candlestick analysis pattern appears on the daily chart at the end of trading, this may signal a reversal or at least a corrective pullback of EUR/ USD. H4
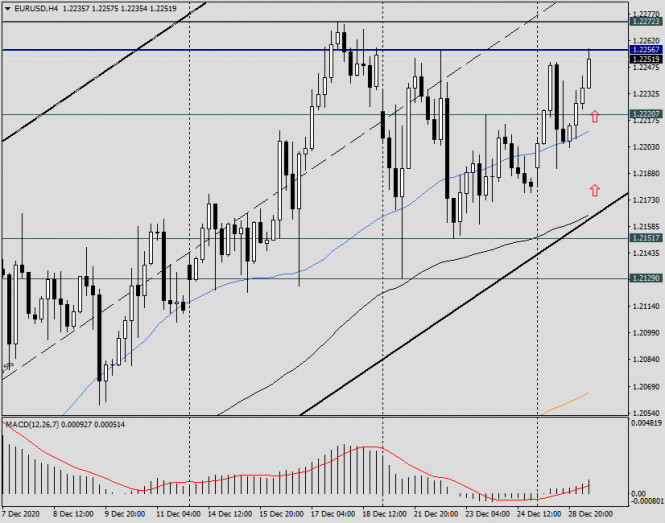
Let's turn to the four-hour chart in order to outline today's trading recommendations. It can be noticed that the euro/dollar pair is still trading in a rising channel within the limits of 1.1601-1.1799 (support line) and 1.1919 (resistance line). It is clearly seen that the 50 simple moving average supports the quote and does not let it lower for now. Therefore, I recommend buying deals after a decline to 50 MA, which is 1.2211. Another option for opening long positions at more attractive prices will be a decline to the lower limit of the channel, where the black 89 exponential moving average is also located. This is the price zone near the level of 1.2165. If a bearish pattern or candlestick analysis patterns appear on this or hourly time frames after rising to 1.2256-1.2272, a signal will appear to open sales. In conclusion, I would like to recommend not to set big goals in both cases, as the pre-holiday market is prone to frequent changes of mood. The material has been provided by InstaForex Company - www.instaforex.com |
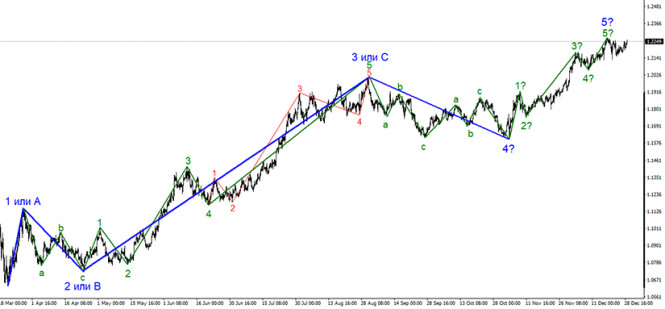
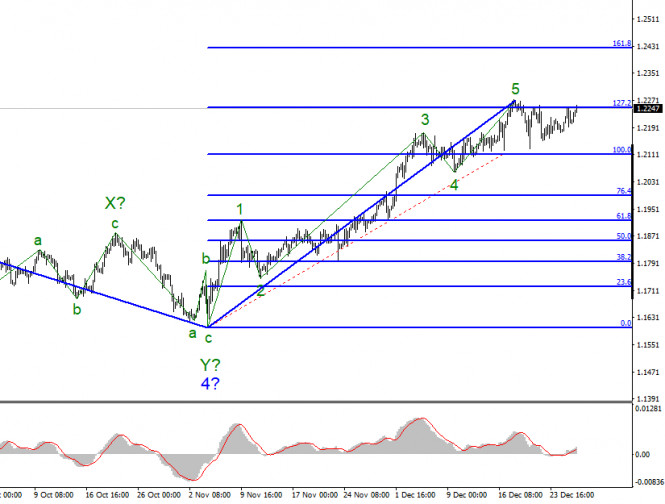
| EUR/USD analysis for December 29. Donald Trump gives in and sings coronavirus relief bill Posted: 29 Dec 2020 03:36 AM PST The wave layout for the EUR/USD pair still indicates the formation of an ascending trend section. However, we can assume that the formation of an uptrend has been already completed. I think that at the moment a new downward trend section is being formed, which may turn out to be a three-wave corrective pattern. At the same time, a successful attempt to break through the high of the expected wave 5 in 5 will indicate the bullish trend in the market. As a result, the ascending section may take on a more complex form. The wave pattern on a smaller time frame also signals a possible completion of the uptrend. The internal wave layout of the supposed wave 5 looks rather clear. So now, at least a three-wave descending pattern can be built. If this is true, then the quotes will continue to decline in the long term to the targets located near the 19th area and below. Three unsuccessful attempts to break through the 127.2% level suggest that the pair is set to start a downward movement soon. However the pair is again testing this level from bottom to top, and this time it may succeed in breaking through it. New Year is approaching, with a few days left ahead. Trading activity on Forex is low due to the festive mood, but traders still open new positions. The euro/dollar pair stays within the uptrend. Almost 30 pips separate the current price level from a yearly high. It seems that the price will finally break through the 127.2% level as market participants are reluctant to buy the US dollar. Therefore, a breakout of this mark will make the ascending trend pattern even more complex. Although different news is coming in recent days, markets seem to downplay this fact. Donald Trump continues to oppose Congress and the Senate in his final month in office. First, the President vetoed the defense spending bill and then refused to sign the coronavirus relief and government funding bill for 2021. The Senate somehow managed to persuade Trump to approve the stimulus package in order to avoid the shutdown. However, in the case with the defense bill, they chose a different strategy. They simply decided to override Trump's veto. This news may seem quite important, but not for the US dollar. Markets are unlikely to react to the disagreement between Trump and the US Congress, given that Joe Biden will take office on January 20. The process of transfer of power has been in full swing for more than a month. Thus, there are hardly any new reasons for the greenback to decline. Its current weakness can be attributed to Christmas and New Year holidays. Conclusion and trading tips The EUR/USD pair seems to have completed the formation of the uptrend. So, I recommend selling the instrument with the targets located near the 20 and 19th area upon every new sell signal from the MACD indicator. At the same time, the wave pattern of the uptrend section may become more complicated and take on a more extended form. For this, the pair needs to break through the 1.2270 mark, which is only 30 pips away from the current price level. The material has been provided by InstaForex Company - www.instaforex.com |
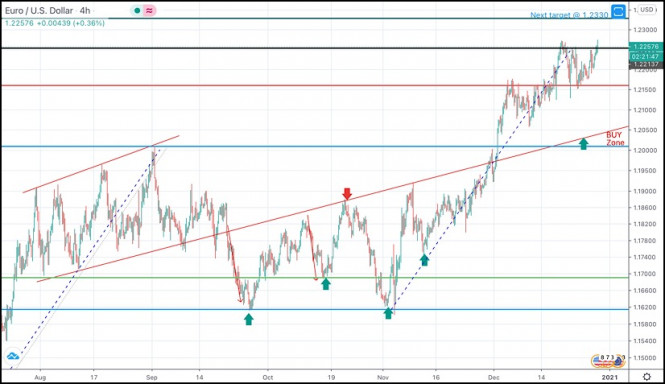 The EURUSD pair was trapped below the previous key-level (1.2000) until bullish breakout occured to the upside recently in December.Further quick bullish advancement was expressed towards 1.2150 just as expected after failing to find sufficient bearish pressure at retesting of the backside of the broken channel around 1.1970-1.2000 which corresponds roughly to Fibonacci Level of 0%.Recently, the pair looked overbought while approaching the price levels of 1.2250 (138% Fibonacci Level).That's why, conservative traders were advised to look either for SELL Positions or low risk BUY trades around lower price levels.Bearish closure and persistence below 1.2160 then 1.2000 is needed to abort the ongoing bullish momentum to initiate a bearish movement at least towards 1.1860 and 1.1770.Otherwise, the intermediate-outlook for the pair would remain bullish at least towards 1.2330 where 150% Fibonacci Level is located.The price zone around 1.2000-1.1975 remains a Demand Zone to offer bullish SUPPORT for the EURUSD pair if any bearish pullback occurs.
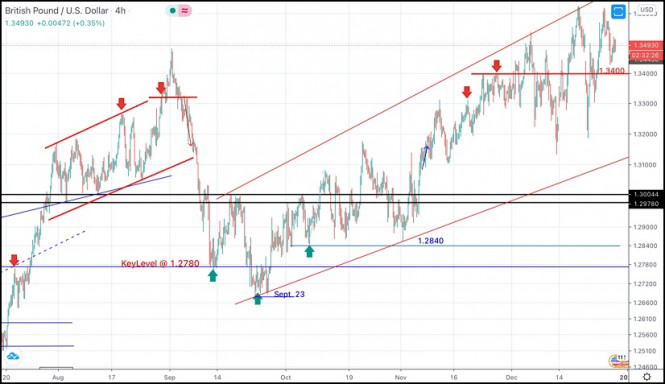


| You are subscribed to email updates from Forex analysis review. To stop receiving these emails, you may unsubscribe now. | Email delivery powered by Google |
| Google, 1600 Amphitheatre Parkway, Mountain View, CA 94043, United States | |


Comments