Forex analysis review
Forex analysis review |
- Forecast for EUR/USD on December 21, 2020
- Forecast for GBP/USD on December 21, 2020
- Forecast for AUD/USD on December 21, 2020
- Forecast for USD/JPY on December 21, 2020
- Analytics and trading signals for beginners. How to trade the GBP/USD currency pair on December 21? Analysis of Friday's
- Analytics and trading signals for beginners. How to trade the EUR/USD currency pair on December 21? Analysis of Friday's
- Trading plan for the GBP/USD pair for the week of December 21-25. New COT (Commitments of Traders) report. Negotiations on
- Trading plan for the EUR/USD pair for the week of December 21-25. New COT (Commitments of Traders) report. Markets continue
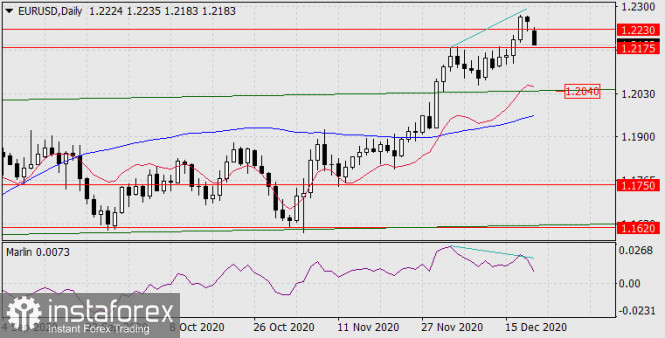
| Forecast for EUR/USD on December 21, 2020 Posted: 20 Dec 2020 07:02 PM PST EUR/USD The week started negatively for the financial markets. Over the weekend, negotiations between the EU and the UK on Brexit failed, although the parties say that there is still a hundred things that can be done, the governments of many countries of the world are afraid of the new British strain of coronavirus and are closing borders, the US government is in danger of falling into a financial lockdown, but it (the government) managed to adopt a plan for two days of funding before approving the budget for next year.
The EUR/USD daily chart shows that a divergence has formed with the Marlin oscillator. The price is bracing for a fall to the support of the price channel line, towards the 1.2040 area, but it still needs to go below the signal level of 1.2175 for this.
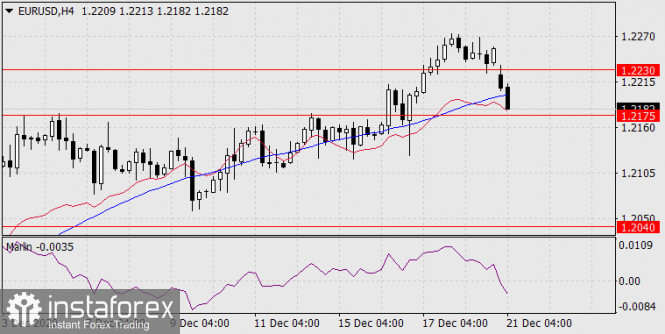
The four-hour chart shows that the downward trend has not strengthened. To do so, the price needs to go below the MACD indicator line, below 1.2200, and the signal line of the Marlin oscillator should move into the area of negative values. Both of these signals can become more successful when the price crosses the signal level of 1.2175. The material has been provided by InstaForex Company - www.instaforex.com |
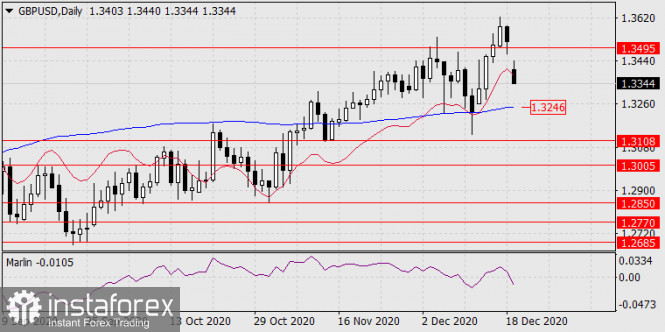
| Forecast for GBP/USD on December 21, 2020 Posted: 20 Dec 2020 06:57 PM PST GBP/USD The British pound has received a double blow today: the failure of Brexit negotiations over the weekend and the closure of borders due to the outbreak of a new type of coronavirus in the south-east of England. In the morning alone, the pound lost 160 points.
The daily chart shows that the signal line of the Marlin oscillator has penetrated into the area of negative values, now the price will have a prolonged fall. Earlier we also said that the pound will still fall even if an agreement between the UK and the EU is concluded, as they say, "in fact", due to it being overbought on expectations and understanding of the fact that the deal will only soften the economic blow to England, but will not cancel it. The first target and support for GBP/USD is the MACD line on the daily chart - 1.3246. Going under the line opens the second target of 1.3108, then 1.3005.
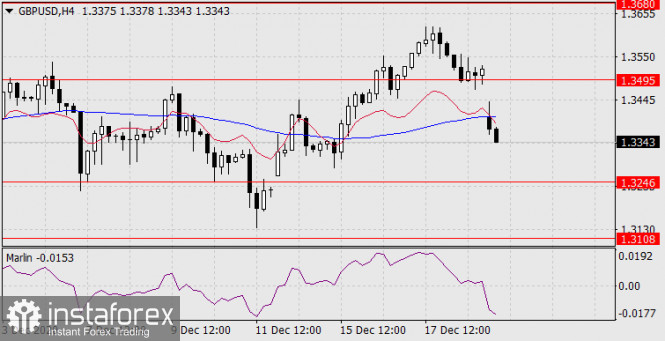
The four-hour chart shows that the price has settled below the MACD line, the Marin oscillator sharply falls. A correction will likely follow from the 1.3246 level, in which Marlin will leave the oversold zone and be discharged to fall further. The material has been provided by InstaForex Company - www.instaforex.com |
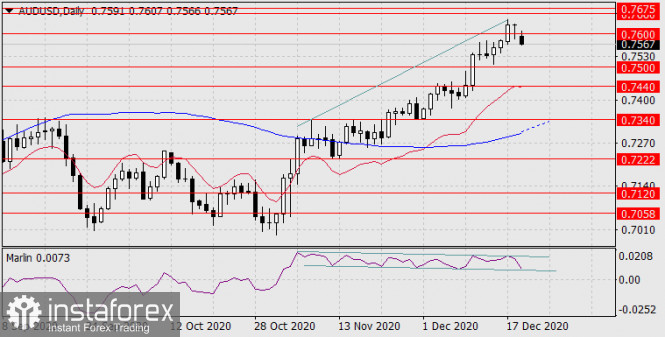
| Forecast for AUD/USD on December 21, 2020 Posted: 20 Dec 2020 06:51 PM PST AUD/USD The extended divergence of the price and the Marlin oscillator on the daily chart, which is a sign that the asset would retreat, is reinforced by the oscillator's own signal line channel, which is a narrow range.
Since the signal line will leave this range, the oscillator will sharply fall as a result. Obviously, the fall of Marlin will carry over and lead to the asset falling as well, in this case, the Australian dollar. The oscillator may leave its own channel after falling by around 50 points, that is, the quote will be around 0.7550. In the future, the price may fall to the target level of 0.7340, which the MACD line approaches on the daily scale.
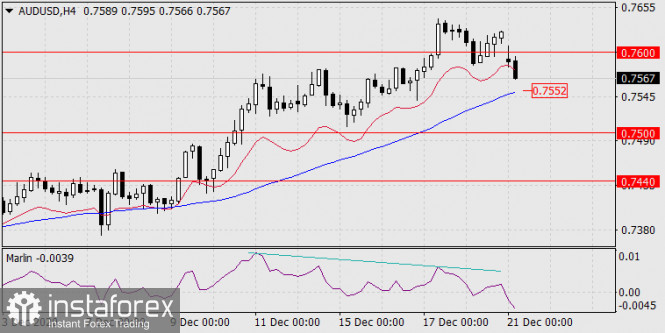
The four-hour chart shows that after the price divergence and the marlin oscillator formed, the signal line of the oscillator went into negative territory, showing the downward mood of the pair. As the price moves under the MACD line in the area of 0.7552, which coincides with the price value at the time when the Marlin signal line transitions from its own channel on the higher price chart, this level becomes more important. So, when the price moves below the signal level of 0.7552, the following targets are open: 0.7500, 0.7440, 0.7340. The material has been provided by InstaForex Company - www.instaforex.com |
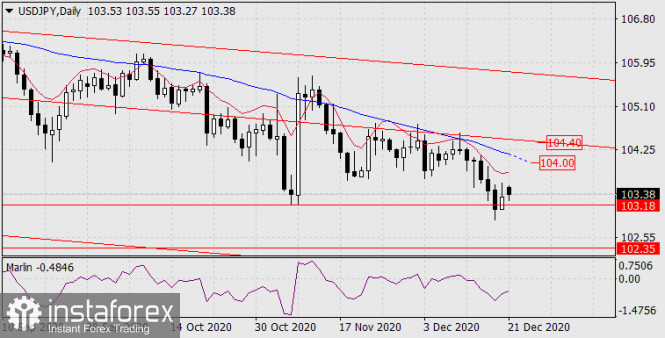
| Forecast for USD/JPY on December 21, 2020 Posted: 20 Dec 2020 06:48 PM PST USD/JPY The US stock market fell by 0.35% (S&P 500) last Friday, due to expectations on news regarding the Brexit talks. There has been no progress on this issue (that is, there have been negative movements), and at the same time a number of countries are closing their borders due to the spread of a new dangerous strain of coronavirus. Today in the Asian session, the Nikkei 225 lost 0.65%, S&P/ASX 200 -0.33%, China A50 -0.26%. The Japanese yen can strengthen as a safe-haven currency amid these events, although every year it weakens in this capacity.
The daily chart shows that the price has surpassed the 103.18 price level (Nov 6 low), but returning to the area under it opens the 102.35 target. The probability of rising towards the MACD line (104.00) has been significantly reduced.
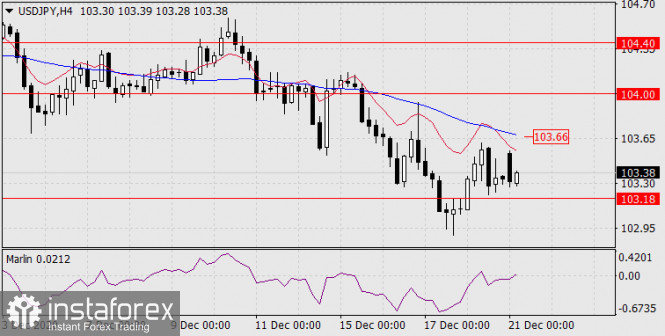
The four-hour chart shows that the price growth from last Friday was not supported by the Marlin oscillator, its signal line did not stay in the area of positive values. We are waiting for the price to settle below the 103.18 level and then the pair should fall to 102.35. The material has been provided by InstaForex Company - www.instaforex.com |
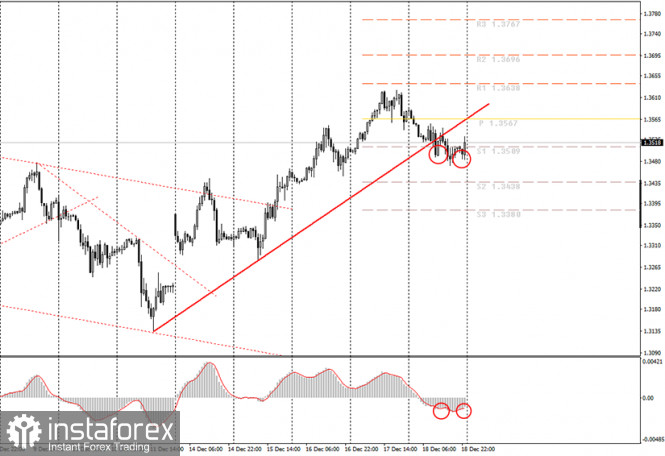
| Posted: 20 Dec 2020 08:30 AM PST The hourly chart of the GBP/USD pair.
The GBP/USD pair at the end of the current working week still started a weak downward movement, which in all respects fits the definition of "correction". However, according to our technical picture, the pair's quotes were fixed below the upward trend line, thus, the trend changed to a downward trend. Thus, now we expect a downward movement of the pound/dollar pair. Novice traders should now consider short positions. We remind you that the pound continues to rise in price unreasonably if we take into account all the factors available to us. Thus, we consider almost any downward movement as a possible beginning of a new long-term downward trend. At the moment, despite overcoming the trend line, the MACD indicator has already turned up, thus, now you need to wait for new sell signals. We remind you that the MACD indicator should be discharged to zero (in practice, this means that the indicator should be as close to it as possible or exceed it). The British pound continues to grow despite everything. We have been repeating this for several months. However, nothing changes. At the end of last week, nothing was interesting in either the UK or the US. In Britain, a report on changes in retail sales volumes for November was published, however, despite higher values of indicators than expected, it was the pound that fell on Friday, which once again proves the lack of desire among market participants to pay attention to the fundamental background and macroeconomic reports. For novice traders, this is a very confusing situation, as markets usually react to the fundamental background and reports. But now this is the specifics of the movement of almost all instruments. There's nothing you can do about it. On Monday, December 21, the UK will release a completely secondary indicator of the CBI on the change in the volume of industrial orders for December. It is unlikely that traders will even pay attention to this report. But maybe at least this week the negotiations on a trade deal between the UK and the EU will become clear? Recall that negotiations have been underway for 9 months and this is considered very small for a deal of such volume and scale. Therefore, it is not surprising that the parties cannot agree. They simply don't have enough time at their disposal. However, it is surprising that the pound continues to strengthen, given the growing likelihood of no deal in 2021. But we have repeatedly drawn attention to the fact that the markets do not want to take this factor into account now and firmly believe that London and Brussels will eventually agree. As of December 21, the following scenarios are possible: 1) The upward trend is temporarily canceled, as the price is fixed below the upward trend line. Thus, now to be able to start traders to consider again trading on the increase, you need to wait for the end of the downward trend or the formation of a new upward one. Until then, it is not recommended to buy the pound. 2) Sales, from our point of view, are now appropriate since the price is fixed below the trend line. Thus, it is now possible to open short positions with the targets of support levels 1.3438 and 1.3380. To do this, you need to wait for the discharge of the MACD indicator and its new sell signal. What's on the chart: Price support and resistance levels – target levels when opening purchases or sales. You can place Take Profit levels near them. Red lines – channels or trend lines that display the current trend and show which direction is preferable to trade now. Up/down arrows – show when you reach or overcome what obstacles you should trade for an increase or decrease. MACD indicator – a histogram and a signal line, the intersection of which is a signal to enter the market. It is recommended to use it in combination with trend lines(channels, trend lines). Important speeches and reports (always contained in the news calendar) can greatly influence the movement of the currency pair. Therefore, during their exit, it is recommended to trade as carefully as possible or exit the market to avoid a sharp reversal of the price against the previous movement. Beginners in the Forex market should remember that every trade cannot be profitable. The development of a clear strategy and money management is the key to success in trading over a long period. The material has been provided by InstaForex Company - www.instaforex.com |
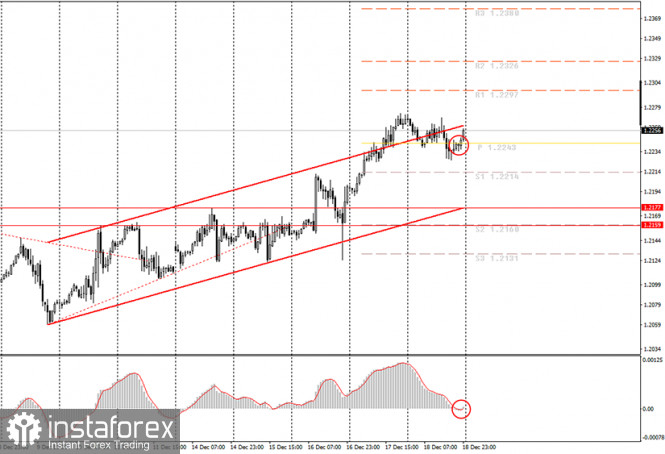
| Posted: 20 Dec 2020 08:04 AM PST The hourly chart of the EUR/USD pair.
The EUR/USD currency pair started the weakest downward correction during the fifth trading day of the week. A little earlier, the pair's quotes went above the ascending channel. However, on Friday, they still returned to it. Thus, since the price was adjusted all day, novice traders were deprived of new buy signals. Recall that we have an ascending channel at our disposal, thus, we are considering buy orders. However, by the very end of the trading day, the MACD indicator still formed a buy signal, and novice traders could even work it out. That is, according to the reversal of the MACD indicator upward, traders could open new purchases and now wait for the opening of trading on Monday. Last Monday, the markets opened with a "gap". We hope that this will not happen tomorrow. Based on all of the above, the price has an excellent chance of continuing to move up. Now it is generally impossible to conclude that the upward trend is nearing completion. Sellers still refuse to enter the market. On Friday, December 18, the European Union and the United States did not publish a single macroeconomic report. There was also other news. It should be understood that the matter is approaching first to the Catholic Christmas, and then to the New Year. Many politicians and deputies go on vacation, and in principle, events in the foreign exchange market are becoming much less. There's not much to say about the European Union right now. The ECB meeting is over, the economic recovery fund and the budget for 2021-2027 are unblocked, and vaccination against the "coronavirus" will soon begin. In the US, Donald Trump is losing time after time in attempts to turn the results of the presidential election. Democrats and Republicans continue to try to agree on a $ 900 billion aid package for the American economy, and vaccination against the "coronavirus" is also beginning in the United States. Thus, the fundamental background is now as neutral as possible, however, the euro currency continues to feel better than the US dollar. No important publications are scheduled for the first trading day of the week in the EU and the US. However, an extremely small number of macroeconomic publications and other events are planned for this week. On the other hand, what difference does it make if the markets still don't work out the news and reports? We expect a drop in volatility this week, as some traders will already start to leave the markets ahead of the Christmas and New Year holidays. On December 21, the following scenarios are possible: 1) Long positions remain relevant at the moment, as the upward trend continues. At the end of Friday, a new buy signal was even formed, according to which novice traders could open long positions with the targets of the resistance levels of 1.2297 and 1.2326. As for new purchases, until tomorrow morning, while maintaining the current signal, you can still try to have time to "jump on the train", however, it should be remembered that volatility may decrease. 2) Trading on the downside now looks impractical, as there is a clear upward trend. Thus, sellers need to wait for either the completion of this upward trend, or the formation of a downward one, and only then consider the possibility of opening sales. The most likely signal will be a consolidation below the current ascending channel. What's on the chart: Price support and resistance levels – target levels when opening purchases or sales. You can place Take Profit levels near them. Red lines – channels or trend lines that display the current trend and show which direction is preferable to trade now. Up/down arrows – show when you reach or overcome what obstacles you should trade for an increase or decrease. MACD indicator (14,22,3) – a histogram and a signal line, the intersection of which is a signal to enter the market. it is recommended to use it in combination with trend lines (channels, trend lines). Important speeches and reports (always contained in the news calendar) can greatly influence the movement of the currency pair. Therefore, during their exit, it is recommended to trade as carefully as possible or exit the market to avoid a sharp reversal of the price against the previous movement. Beginners in the Forex market should remember that every trade cannot be profitable. The development of a clear strategy and money management is the key to success in trading over a long period. The material has been provided by InstaForex Company - www.instaforex.com |
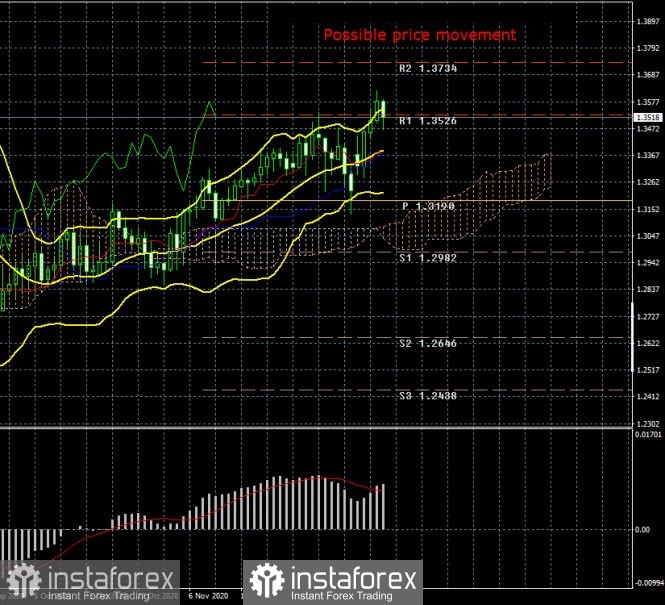
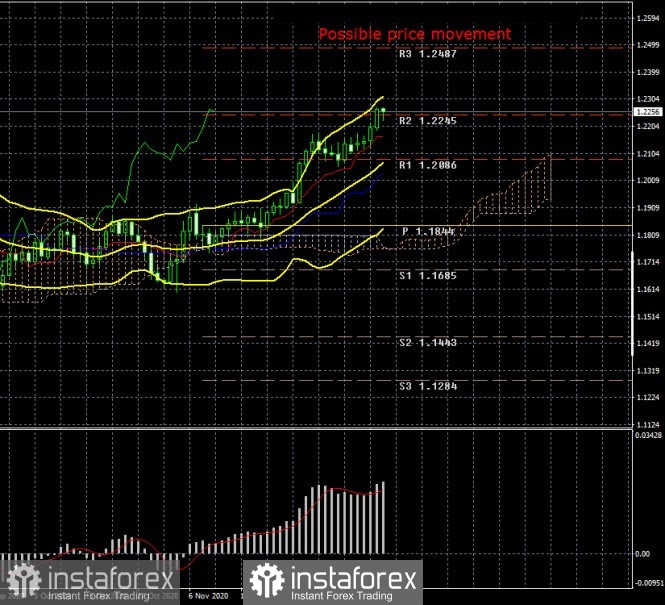
| Posted: 20 Dec 2020 01:56 AM PST GBP/USD - 24H. The GBP/USD currency pair, after a very encouraging drop of 400 points a week earlier, rose by 500 this week. Thus, the price has updated 2.5-year highs and resumed the formation of an upward trend. As in the case of the euro, we continue to argue that there are no fundamental reasons for the pair's growth. That is, the pound sterling, like the euro currency, continues to grow solely on speculative factors. The British currency is overbought, and finding an answer to the question of why the pound is being bought if the UK is on the edge of an abyss called "Brexit without a deal" is generally impossible to explain. However, we have already said more than once that this is a market. Here you can never predict the movement of the pair with a probability of 100%. There are such periods when it is impossible to understand why a particular currency is growing at all. But 2020 also brought many other "surprises", so you can not be surprised at what is happening in the foreign exchange market. This is not the strangest thing that happened in the past year. Thus, at the moment, we can conclude that the upward trend continues, however, we are still waiting for its completion, since even speculative growth cannot continue forever. COT report. During the last reporting week (December 8-14), the GBP/USD pair increased by 80 points. However, the COT report in the last reporting week again gave us such data that does not allow us to make any specific conclusions and forecasts. The changes were again minimal and contradictory. Professional traders closed 4 thousand buy-contracts and 2.3 thousand sell-contracts during the reporting week. Thus, the net position of the most important group of traders decreased by 2.3 thousand. This means that the mood of major players has become more "bearish". But it is best to pay attention to the first indicator now to understand what is happening with the mood of non-profit traders. The green line (as well as the red one) constantly changes the direction of movement: up and down. This indicates the lack of a clear and firm attitude of the "Non-commercial" group. Thus, now it is impossible to draw any conclusions at all. The pound has continued to grow for almost three months (and this is only the last round of its upward movement), but COT reports do not say that at this time the mood among non-profit traders became more "bullish". Or even that any group of traders at this time actively increased purchases of the pound. The fundamental background for the GBP/USD pair remained unchanged. During the week, the parties continued to negotiate a trade agreement, but came to nothing, there was no progress. Thus, today another deadline expires, which this time was already set by the European Union, and which also has no meaning. Recall that these deadlines were a huge number. But the Minister for European Affairs of France, Clement Bon, generally said that Brexit negotiations are likely to continue after Sunday. That is, this is exactly what we have talked about repeatedly. The negotiations will continue for as long as necessary. MEPS have previously said they could vote for the deal on December 28 if the terms of the agreement are agreed before midnight on December 20. At the time of writing, there was no news of a consensus being reached. Thus, trade negotiations may continue next week. We continue to wait for the parties to officially and publicly declare that the negotiations will be extended to 2021, or when they will officially put an end to the negotiations since it is not possible to reach an agreement. Recall that the European Parliament and the British Parliament still need to have time to read the text of the agreement (several hundred pages) and only then vote. There was no time for all this on November 15, and it is already December 20. Thus, from our point of view, the probability that the parties will have time before the New Year is negligible. This is what Boris Johnson and Ursula von der Leyen regularly state. Trading plan for the week of December 21-December 25: 1) The price resumed its upward movement without any problems and worked out the first resistance level of 1.3526. Thus, in the 24-hour timeframe, the next target for an upward movement is the level of 1.3734. We recommend that you continue to consider options for opening long positions on lower timeframes and do not try to guess the end of the upward trend. 2) Sellers are still quite weak. Last week, the bears tried to seize the initiative, but it all failed. Thus, for the possibility of opening short positions, it is now recommended to wait again, at least, for the price to consolidate below the critical line. If this condition is met, a downward trend may form in the 4-hour timeframe. Explanation of the illustrations: Price levels of support and resistance (resistance/support) – target levels when opening purchases or sales. You can place Take Profit levels near them. Ichimoku indicators, Bollinger Bands, MACD. Support and resistance areas – areas from which the price has repeatedly bounced. Indicator 1 on the COT charts – the net position size of each category of traders. Indicator 2 on the cot charts – the net position size for the "non-commercial" group. The material has been provided by InstaForex Company - www.instaforex.com |
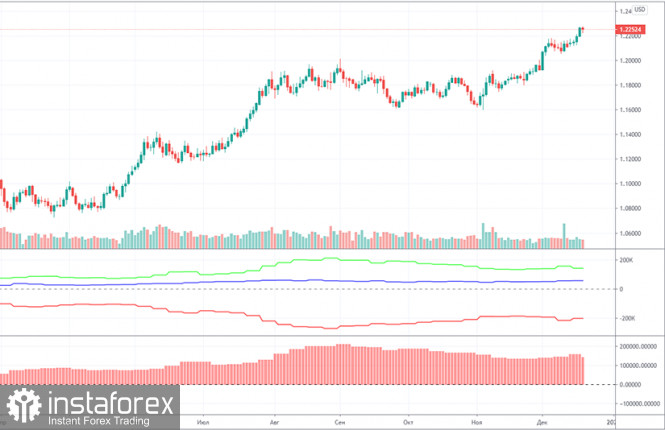
| Posted: 20 Dec 2020 01:56 AM PST EUR/USD - 24H. During the past week, the EUR/USD pair again continued to break all records of its own high cost. The euro currency continues to grow and be in demand in the foreign exchange market. In the first place in terms of importance among all factors, technical ones remain, because the fundamental background and COT reports have long been in favor of the fall of the European currency. Now there are simply no fundamental reasons for the growth of the euro. Thus, the euro/dollar pair continued its upward movement and overcame the resistance level of 1.2245 during this week. This means that the upward trend continues to persist on the lower timeframes, thus, you should continue to trade for an increase. It is very difficult to say when will the march to the north end. We continue to believe that the nature of the current strengthening lies solely in the "speculative factor". A lot of people are now comparing the rise of the euro with the rise of oil in 2008 to a record $ 145 per barrel. COT report. During the last reporting week (December 8-14), the EUR/USD pair increased by 30 points. Recall that over the past few weeks, COT reports have shown an increase in the net position of non-profit traders. Simply put, the mood of professional players became more "bullish", although for several months they had been preparing for massive sales of the euro currency. In the last reporting week, the Non-commercial group closed 5,200 buy contracts and opened 10,800 sell contracts. That is, the net position decreased by 16 thousand, which is quite a lot. That is, professional players are again looking in the direction of selling the euro currency. And if we take into account the long-term perspective, then non-commercial traders continue to lean towards selling the euro currency. This point is again clear and understandable. The euro has been growing for a full nine months. All this time, it is extremely difficult for the dollar to even adjust. Therefore, the euro is now overbought. As for the indicators, they show the same decrease in the net position of non-commercial traders. The green line of the first indicator began to move again to meet the red line (net position of commercial traders), which is a signal of the end of the trend. Thus, we still expect the end of the euro's upward march, but at the same time, we remind you that until there are technical signals about the end of the upward trend, it is not recommended to trade down. There is no need to try to guess the downward reversal. The fundamental background for the pair continues to be present. That is, at this time (11 days before the New Year), there is (remained) a sufficient number of important and interesting topics. However, the absolute majority of them just remain an interesting topic. For example, the Fed held a meeting this week. The last one this year. And although it was again "passing", the American regulator did not give any new reasons to expect monetary policy easing. That is, there were no reasons after the Fed meeting to sell off the dollar again. However, market participants continued to do just that. Also this week, a new package of stimulus measures for the US economy was discussed again. It was discussed and not accepted. The epic is only slightly less interesting than the epic of Brexit and the London-Brussels trade negotiations. Since no package has yet been approved in the US Congress, traders again had no reason to sell the dollar and buy the euro. Well, as we have said many times, the fourth quarter for the European economy is likely to be a quarter of contraction, while the American economy is likely to grow by several percent. Thus, in economic terms, it is the US economy that is now in a better position. But as you can see, this also does not play any role for market participants. Therefore, there is only one thing to recommend here: continue to follow the trend as long as it persists. There's nothing else to do. Trading plan for the week of December 21-December 25: 1) The pair's quotes continue their upward movement and now, in the coming weeks, they will aim for the level of 1.2487. Although the COT report and the fundamental background continue to signal a possible and very likely fall in the pair's quotes and the baselessness of the current growth, it can continue. "Technique" now eloquently signals an upward trend, so it is recommended to trade for an increase. 2) To be able to sell the EUR/USD pair, you need to at least wait for the price to consolidate below the Kijun-sen lines. However, we do not expect such a development in the near future, as the price is quite far from this line. Thus, short positions can only be considered on lower timeframes if a downward trend is formed. Explanation of the illustrations: Price levels of support and resistance (resistance/support) – target levels when opening purchases or sales. You can place Take Profit levels near them. Ichimoku indicators, Bollinger Bands, MACD. Support and resistance areas – areas from which the price has repeatedly bounced. Indicator 1 on the COT charts – the net position size of each category of traders. Indicator 2 on the COT charts – the net position size for the "non-commercial" group. The material has been provided by InstaForex Company - www.instaforex.com |
| You are subscribed to email updates from Forex analysis review. To stop receiving these emails, you may unsubscribe now. | Email delivery powered by Google |
| Google, 1600 Amphitheatre Parkway, Mountain View, CA 94043, United States | |


Comments