Forex analysis review
Forex analysis review |
- Forecast for AUD/USD on December 29, 2020
- Forecast and trading signals for GBP/USD on December 29. COT report. Analysis of Monday. Recommendations for Tuesday
- Forecast and trading signals for EUR/USD on December 29. COT report. Analysis of Monday. Recommendations for Tuesday
- Forecast for USD/JPY on December 29, 2020
- Forecast for GBP/USD on December 29, 2020
- Overview of the GBP/USD pair. December 29. Boris Johnson's optimism is unfounded. The British economy is still struggling
- Overview of the EUR/USD pair. December 29. The US Congress can pass a single bill that increases payments to Americans, as
- Analytics and trading signals for beginners. How to trade GBP/USD on December 29? Analysis of Monday. Getting ready for Tuesday
- Analytics and trading signals for beginners. How to trade EUR/USD on December 29? Analysis of Monday. Getting ready for Tuesday
- Evening review of EURUSD on 28.12. Euro keeps growing
- USD turns bearish immediately after sudden growth. EUR/USD took the chance for a rebound
- December 28, 2020 : GBP/USD Intraday technical analysis and trade recommendations.
- December 28, 2020 : EUR/USD Intraday technical analysis and trade recommendations.
- December 28, 2020 : EUR/USD daily technical review and trade recommendations.
- USDCAD rejected at back test of resistance and previous support zone
- GBP/USD analysis on December 28. EU representatives: there should be a trade deal with the UK
- Gold bulls face important resistance
- Trading Signal for EUR/USD for December 28 - 29, 2020: Key Level at 1.2207
- EURUSD remains inside bullish channel
- Trading Signal for GBP/USD for December 28 - 29, 2020
- EUR/USD analysis for December 28. Donald Trump approves budget for 2021. The demand for USD stays unchanged
- EUR/USD Accelerates Its Sell-Off
- BTC analysis for December 28,.2020 - Major target at $28.000 reached.. Potential for another re-test of tthe $28.00 level...
- EUR/USD analysis for December 28 2020 - Targets reached and potential for the upside continuation towards 1.2250
- Analysis of Gold for December 28,.2020 - Testing of the rising trendline and potential for upside continuation towards $1.896
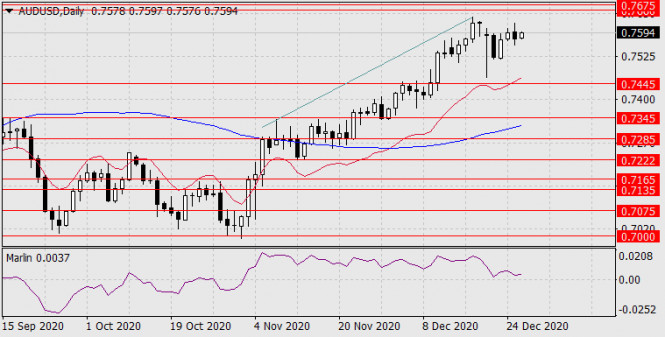
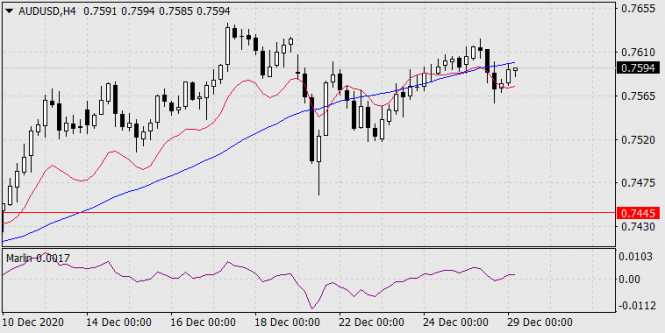
| Forecast for AUD/USD on December 29, 2020 Posted: 28 Dec 2020 07:08 PM PST AUD / USD The Australian dollar closed the day down to 16 points yesterday. The main role here was played by the Marlin oscillator, whose signal line turned down from the lower border of its own channel. But the oscillator needs to do a more important thing, that is to gain a foothold under the zero line and to move the promising trend downwards. To do this, the price needs to gain a foothold below the low of yesterday.
Based on the four-hour chart, the price was fixed under the Kruzenshtern indicator line. The Marlin oscillator is still in the positive territory. Here, the price needs to go under the minimum of yesterday to shift the trend to the zone of a declining trend. We are waiting for developments. The target of 0.7445 is postponed to January next year.
|
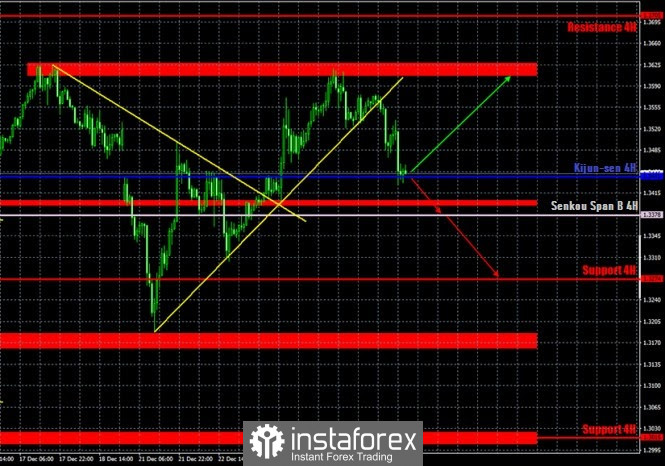
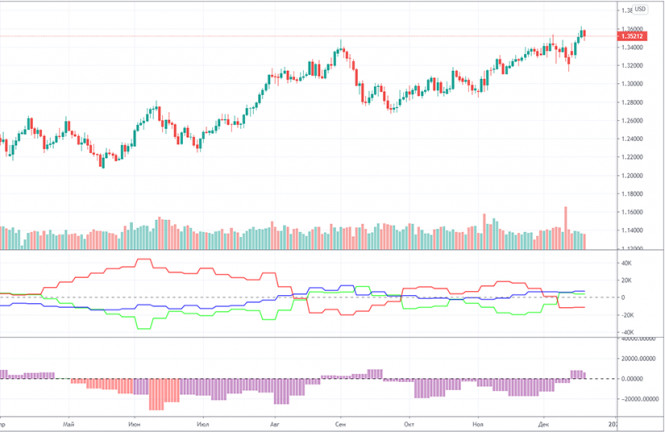
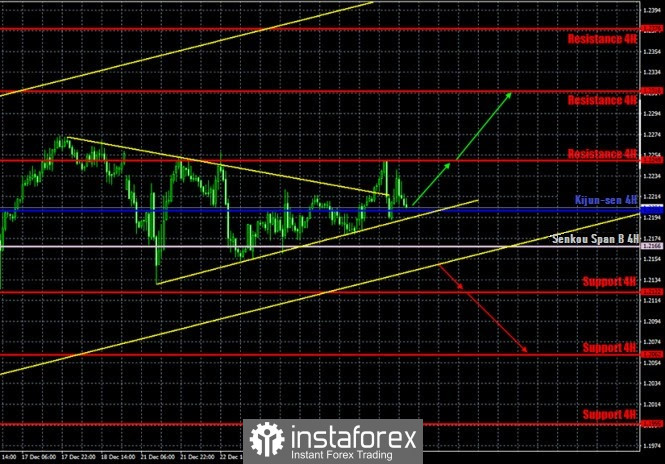
| Posted: 28 Dec 2020 07:05 PM PST GBP/USD 15M Both linear regression channels turned to the downside on the 15-minute timeframe. Thus, in the short term, the upward trend changed to a downward one after buyers failed to overcome the 1.3606-1.3626 area. GBP/USD 1H The GBP/USD pair began a new round of downward movement on Monday and broke the rising trend line. Thus, buyers failed to take the pair above the previous local high. At the moment, the quotes fell to the critical Kijun-sen line, which keeps them from falling further. However, if this line is crossed, the downward movement might reach targets like the Senkou Span B line and the support level of 1.3274. We have already mentioned that we expect a powerful and strong downward movement. Considering the fact that the pair has rebounded from the resistance area of 1.3606-1.3626 twice, creating a Double Top pattern is also possible. And we have already mentioned the fundamental background a million times. And in the past few months, and in the next couple of months, it will be extremely difficult for the pound to find reasons for growth. The deal is a bargain, and the British economy continues to experience serious problems. And this is noted by the Bank of England and many experts and analysts. COT report The GBP/USD pair increased by 80 points during the last reporting week (December 8-14). Small price changes, but in general, the pound remains in a steady upward trend. But the latest Commitment of Traders (COT) report gave us data that does not allow us to draw any specific conclusions and forecasts. The changes were minimal and contradictory. Professional traders closed 4,000 Buy-contracts (longs) and 2,300 Sell-contracts (shorts) during the reporting week. Thus, the net position of the most important group of traders decreased by 2,300, which is not much. This means that major players have become more bearish. But it is best to pay attention to the first indicator in order to understand what is happening with the mood of non-commercial traders. The green line (as well as the red one) constantly changes the direction of movement: up and down. This indicates the lack of a clear and firm attitude of the non-commercial group. So now it is impossible to draw any conclusions. The pound has continued to grow for three months (and this is the last round of its growth), but COT reports do not state that the mood among non-commercial traders became more bullish. Or that any group of traders at this time actively increased purchases of the pound. The new COT report did not come out on Friday because of Christmas. The fundamentals for the British currency were blank on Monday. News such as that the European Council has approved a "temporary application" of the trade deal, as the European Parliament is not going to vote for it until next year, is not considered significant. Basically, traders had nothing to react to. Plus the holidays are about to begin. We are inclined to believe that traders are now starting to cut long positions, which will cause the pound's quotes to drop. We continue to expect a downward trend. No news or reports scheduled for the second trading day of the week. As well as for the entire week. Traders have to wait for the British Parliament's verdict regarding the same deal, but we believe that there should be no problems with the adoption by British MPs. The British opposition simply doesn't have enough power in Parliament to block the deal or to counter Prime Minister Boris Johnson's opinion. Nothing more is expected in the coming days. We have two trading ideas for December 29: 1) Buyers for the pound/dollar pair retreated, finding no reason and grounds to continue buying the pound around 2.5-year highs. At the moment, the upward trend has been canceled; nevertheless, in the event of a price rebound from the Kijun-sen line (1.3441), it will be possible to re-examine buy orders while aiming for the resistance area of 1.3606-1.3626. Take Profit in this case will be up to 120 points. 2) Sellers have seized the initiative in the market and have excellent chances to continue moving down. Thus, we recommend selling the pound/dollar pair while aiming for the support level of 1.3274 and the 1.3160 -1.3184 area if the price manages to overcome the Kijun-sen line (1.3441). Take Profit in this case can range from 70 to 160 points. Forecast and trading signals for EUR/USD Explanations for illustrations: Support and Resistance Levels are the levels that serve as targets when buying or selling the pair. You can place Take Profit near these levels. Kijun-sen and Senkou Span B lines are lines of the Ichimoku indicator transferred to the hourly timeframe from the 4-hour one. Support and resistance areas are areas from which the price has repeatedly rebounded off. Yellow lines are trend lines, trend channels and any other technical patterns. Indicator 1 on the COT charts is the size of the net position of each category of traders. Indicator 2 on the COT charts is the size of the net position for the "non-commercial" group. The material has been provided by InstaForex Company - www.instaforex.com |
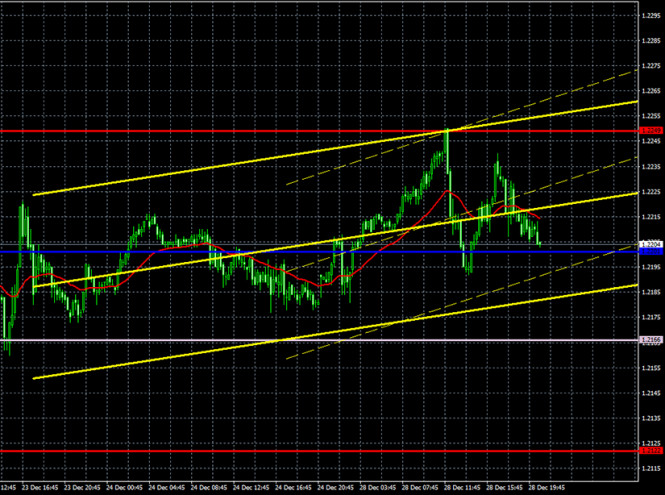
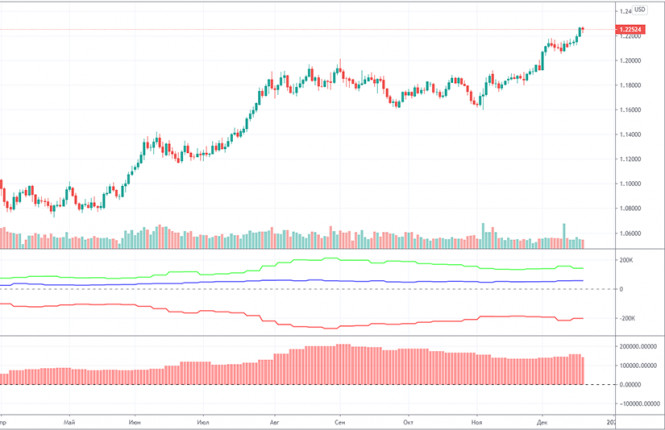
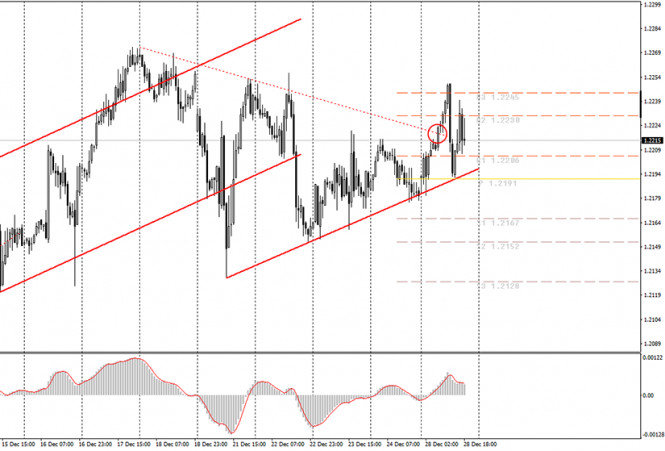
| Posted: 28 Dec 2020 07:05 PM PST EUR/USD 15M The technical picture is more than eloquent in the 15-minute timeframe. The lowest upward slope of both linear regression channels and the absence of surpassing the 1.2249 level. At any moment, the pair can move down and break the remaining upward trend line on the hourly timeframe. EUR/USD 1H The EUR/USD pair could not maintain the downward trend on the hourly timeframe on Monday, December 28, but it kept the upward trend. Recall that the pair was stuck between two trend lines yesterday that sought to reach each other. As a result, traders managed to overcome the upper one, although we can not conclude that there is a clear upward trend at this time. If you look at the entire movement supported by the upward trend line in its entirety, you can clearly see that buyers are unable to overcome the resistance level of 1.2249. Thus, the pair's entire movement looks more like a flat than a trend at this time. At the same time, the upward trend remains in the long term, since we also have a rising channel at our disposal. The lines of the Ichimoku, Senkou Span B and Kijun-sen are currently not valid, since, again, the movement is more like a flat. Thus, we advise you to be cautious with any signals on the pre-New Year week, since false ones are possible. COT report The EUR/USD pair increased by 30 points during the last reporting week (December 8-14). Recall that over the past few weeks, the Commitment of Traders (COT) reports have shown an increase in the net position of non-commercial traders. That is, the mood of professional players became more bullish, although before that they were already preparing for a massive sell off of the euro for several months. The non-commercial group closed 5,200 Buy-contracts (longs) and opened 10,800 Sell-contracts (shorts) in the last reporting week. That is, the net position decreased by 16,000, which is quite a lot. Professional players are looking into selling the euro. And if we take the long-term perspective into account, then non-commercial traders continue to lean towards selling the euro. The single currency has been growing for a full nine months. All this time, it has been extremely difficult for the dollar to even adjust. Therefore, the euro is now overbought, and very much so. As for the indicators, they show the same decrease in the net position of non-commercial traders. The green line of the first indicator began to move again to meet the red line (net position of commercial traders), which, we recall, is a signal of the end of the trend. Therefore, we still expect the end of the euro's growth, but at the same time, we remind you that until there are technical signals about the end of the upward trend, it is not recommended to trade down. The new COT report was supposed to be released on Friday, December 25, but it was postponed to Monday due to the celebration of Christmas. No important event or macroeconomic report for the euro or dollar on Monday. Thus, it is somewhat surprising that the pair's volatility has slightly increased compared to Thursday. The only news of the day was Donald Trump's signing of the 2021 budget, which also includes a $900 billion stimulus package for the economy. Thus, the United States managed to avoid another shutdown. Nothing interesting happening in the European Union and America right now. Moreover, traders are not even waiting for any important information. Everything is moving smoothly towards the New Year and most politicians have already left for the New Year and Christmas holidays. Or they are preparing to do it. In any case, no major events and actions planned for the coming days. Hence the fundamental background, unless something extraordinary happens, will be nonexistent this week. We have two trading ideas for December 29: 1) Buyers are trying to get the initiative back into their own hands. They managed to stay above the trendline, so they have a chance to rise towards the resistance level of 1.2249. And if the pair manages to surpass it - to the 1.2316 level. Take Profit in this case can range from 30 to 90 points. Rebounding from the Kijun-sen line or the trend line can be used as a signal. However, with the same success, the pair's quotes may be below the upward trend line. 2) Bears remain very weak at this time and have failed to surpass the weak upward trend line. But they let the bulls above their trend line. Thus, you are advised to open short positions if the bears manage to overcome the lower line of the rising channel while aiming for the support levels of 1.2122 and 1.2062. Take Profit in this case can range from 20 to 80 points. Forecast and trading signals for GBP/USD Explanations for illustrations: Support and Resistance Levels are the levels that serve as targets when buying or selling the pair. You can place Take Profit near these levels. Kijun-sen and Senkou Span B lines are lines of the Ichimoku indicator transferred to the hourly timeframe from the 4-hour one. Support and resistance areas are areas from which the price has repeatedly rebounded off. Yellow lines are trend lines, trend channels and any other technical patterns. Indicator 1 on the COT charts is the size of the net position of each category of traders. Indicator 2 on the COT charts is the size of the net position for the "non-commercial" group. The material has been provided by InstaForex Company - www.instaforex.com |
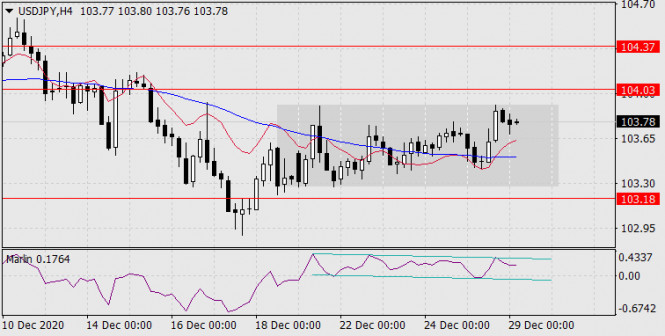
| Forecast for USD/JPY on December 29, 2020 Posted: 28 Dec 2020 06:55 PM PST USD/JPY The Japanese Yen has fallen into a horizontal trend. It is indicated by a gray rectangle on the four-hour scale chart. The range fits between the target levels of 103.18 and 104.03.
The Marlin oscillator wedge has transformed into an inclined channel. At the moment, the oscillator line is unfolding from its upper border but for a signal a short-term fall, it is necessary to exit the channel downwards. To do this, the price should go below yesterday's low of 103.41. This is already below the Kruzenshtern line.
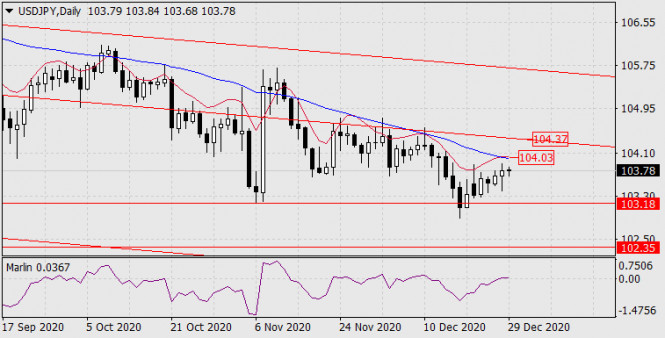
On the daily chart, Marlin shows the intention to turn around from the border with the territory of growth. The trend is still in a downward direction. We are waiting for developments-- the situation is not trade. The material has been provided by InstaForex Company - www.instaforex.com |
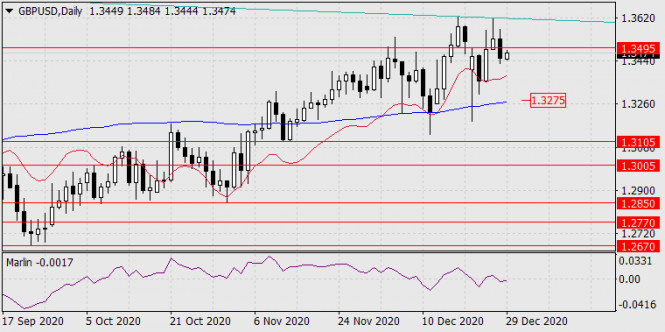
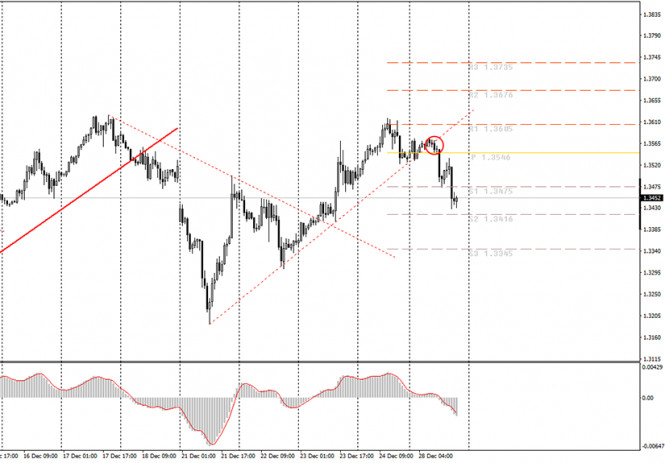
| Forecast for GBP/USD on December 29, 2020 Posted: 28 Dec 2020 06:55 PM PST GBP/USD The British pound lost 83 points yesterday. This has significantly shifted the technical picture to a declining scenario, but small confirmations are still lacking. The Marlin oscillator on the daily scale entered the territory of a declining trend. In order to consolidate under the signal-target level of 1.3495, today should be closed below it. The first target of 1.3275 will become more tangible.
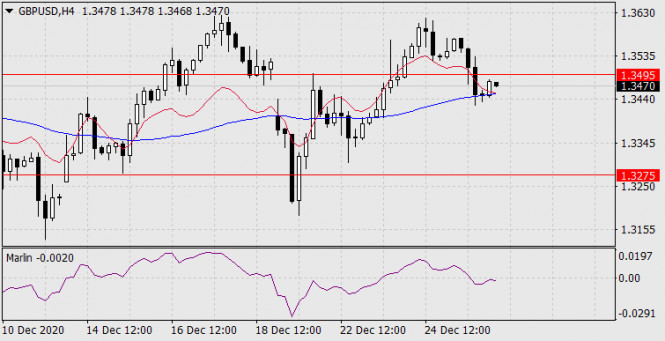
On the four-hour chart, yesterday's decline stopped at the MACD line. The Marlin oscillator managed to enter negative territory. With the price moving below the MACD line, which corresponds to yesterday's low (1.3428), the target of 1.3275 will work.
|
| Posted: 28 Dec 2020 06:15 PM PST 4-hour timeframe
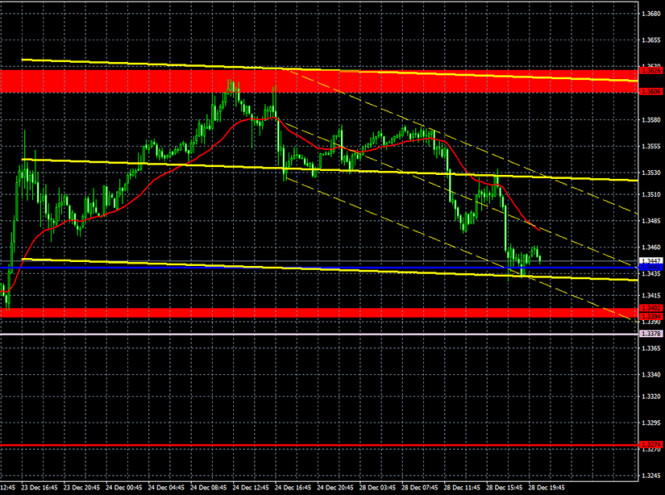
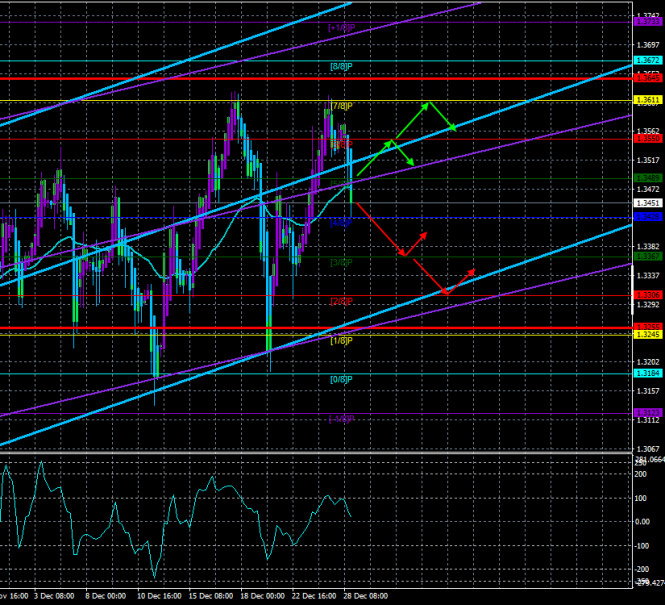
Technical details: Higher linear regression channel: direction - upward. Lower linear regression channel: direction - upward. Moving average (20; smoothed) - sideways. CCI: 4.5667 The British currency paired with the US dollar on the first trading day of the week began a new round of downward movement within the "highly volatile swing", in which it has been for more than a month. This time, the quotes reached the Murray level of "7/8"-1.3611 again last Thursday, bounced off it, and began a new round of downward movement. If you look closely, in recent weeks, any round of movement is at least 300 points, and they alternate. Thus, formally, the upward trend is now maintained. Simply because the price is still near its 2.5-year highs. However, this trend is very difficult to work out – the corrections are too deep. Thus, traders should clearly understand that now is not the most favorable time for trading on the pound/dollar pair, although the probability of a downward trend beginning at this time is very high. However, to do this, you need to wait at least for the price to consolidate below the moving average line. Secure anchoring. Then it will be possible to count on the fall of the pound quotes by another 150-200 points. And then it will be seen whether this is a new trend or not. Meanwhile, the ambassadors of all 27 EU member states approved the "temporary application" of the agreement on trade relations with the UK. We talked about this option even earlier, since it was the only one to have time to "ratify" the agreement and continue to trade with each other on free terms. Already today, all EU ambassadors must sign the relevant document, and the EU Parliament will meet in the new year to ratify the agreement. Meanwhile, while the UK and the EU are euphoric about the success of the negotiations, many experts and analysts are skeptical about the concluded trade deal. First, as we said a few months ago, the deal is not a panacea for Britain. The contraction of the British economy due to Brexit will still happen. The deal will only smooth out the negative effect of the "divorce" with the EU, but will not remove it completely. Second, the Bank of England expects GDP to fall by 1% in the first quarter. Third, we expect UK GDP to fall by several percent in the fourth quarter due to a repeated lockdown in November and the country's isolation due to a new strain of coronavirus in December. Fourthly, many experts believe that a deal with the EU will have a positive effect in the short term, but in the long term, it will not be too beneficial for London. Naturally, Boris Johnson has already boasted several times to the whole world that London has managed to conclude a profitable trade agreement that will not infringe on the sovereignty and independence of Britain. However, only practice will show what a trade agreement is. And we will witness this in a few days. After all, do not forget that even if the free trade regime is maintained, the borders between Britain and the EU will appear. This means that there will be customs checks, changes in the processing of documents, there will be delays at the borders and ports. Further, the UK is a country whose prosperity depends more on the services sector, especially financial services, than on manufacturing and fishing. However, there are practically no points in the agreement concerning this sphere. That is, from the first of January, many British companies that provide certain services will be cut off from the European market. Naturally, this does not mean that now British companies from the service sector will not be able to do business with European partners and customers. This only means that their activities "for export" will be complicated. Further, a lot will depend on how the UK will now establish its trade relations with other countries. Simply put, Boris Johnson got the freedom he dreamed of, and then? Will he be able to use it for the good of the country? A deal has been struck with the EU, but the EU is not the only country in the world that the British want to trade with. In general, so far the British economy is likely to continue to suffer in the short term, but in the long term - everything will depend on the UK government. As for the British pound, we still believe that it should start a new downward trend. It is unclear what will happen during New Year's week, but all factors still speak in favor of the fact that a new strong downward movement should begin. We still remind you that to trade down, you need to wait for the formation of sell signals from the "Linear Regression Channels" trading system or technical indicators that you use in trading.
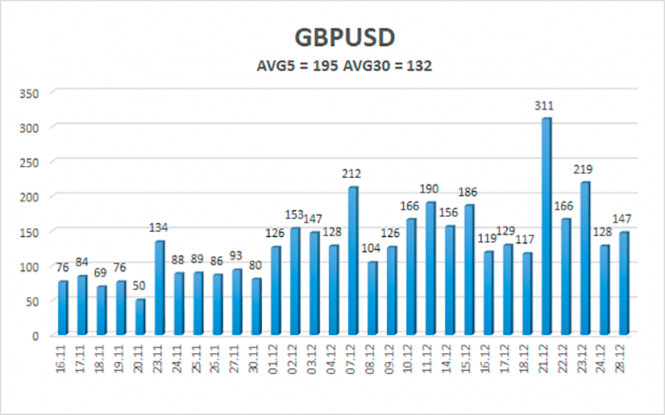
The average volatility of the GBP/USD pair is currently 195 points per day. For the pound/dollar pair, this value is "high". On Tuesday, December 29, thus, we expect movement inside the channel, limited by the levels of 1.3255 and 1.3645. The reversal of the Heiken Ashi indicator upward signals a new round of upward movement within the "swing". Nearest support levels: S1 – 1.3428 S2 – 1.3367 S3 – 1.3306 Nearest resistance levels: R1 – 1.3489 R2 – 1.3550 R3 – 1.3611 Trading recommendations: The GBP/USD pair on the 4-hour timeframe is now in a new round of downward movement. Thus, today it is recommended to open short positions with targets of 1.3367 and 1.3306 if the pair breaks the moving average. It is recommended to trade the pair again for an increase with the target of 1.3611 if the price is fixed and bounces off the moving average. In general, the "swing" continues now. Not a good time to trade. The material has been provided by InstaForex Company - www.instaforex.com |
| Posted: 28 Dec 2020 06:15 PM PST 4-hour timeframe
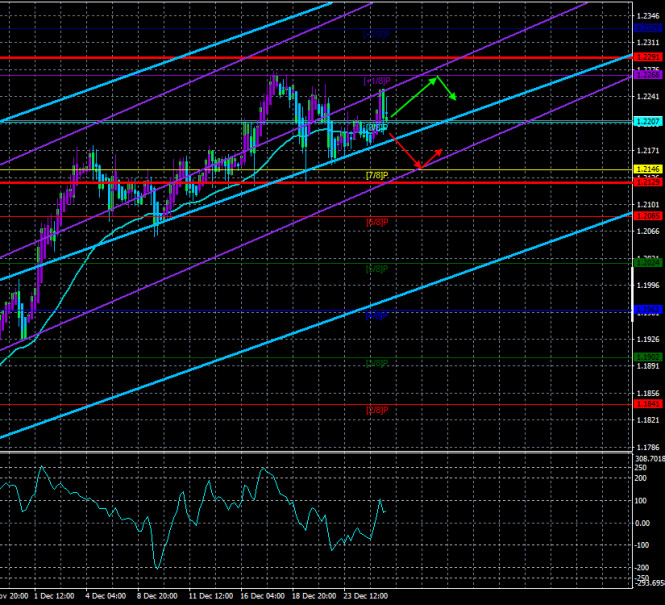
Technical details: Higher linear regression channel: direction - upward. Lower linear regression channel: direction - upward. Moving average (20; smoothed) - sideways. CCI: 46.6659 The EUR/USD currency pair was trading very actively on Monday, although it cannot be said that the volatility was high. On this day, there were no important news and macroeconomic publications in the world, as for the second week in a row, the markets are in holiday mode. Last week the world was preparing for a Catholic Christmas, this week it is preparing for the New Year. Thus, the calendar of macroeconomic events is empty, and the authorities of many countries of the world are already going on vacation. This, of course, does not mean that the pair's quotes will now stand in one place and will not move. By and large, the pair can move on New Year's week as you like. There may be minimal volatility, flat, and quite volatile "swings". The market can be "thin", where the action of any major player can lead to a serious change in the pair's exchange rate. Thus, first of all, caution is required from traders during New Year's week. From the news, oddly enough, there is even something to pay attention to. Late on Monday, Donald Trump signed a package of measures to stimulate the US economy, which is included in the general budget for 2021. If Donald did not take this step, then on December 29, a new "shutdown" would have begun in the United States. Far from being the most embarrassing event under President Trump. "Shutdowns" under Trump have already happened and it was under him that the longest break in the work of public services was recorded due to lack of funding. 35 days. From our point of view, the "shutdowns" are yet another proof of Trump's incompetence as president. In essence, a "shutdown" is an inability to agree on a budget for the next year. Democrats and Republicans can't agree among themselves, so at some point, the budget remains unsigned and uncoordinated, and funding for public services stops. It is precisely because Trump does not know how to negotiate with anyone, especially with the Democrats, that such things happen. And any "shutdown" is damage to the economy. The last "shutdown" in 2019 caused $ 11 billion in damage to the American economy. However, this time it did not come to a new "shutdown". At the last moment, Trump put his signature and saved himself from an even greater drop in political ratings. If Trump is going to run for president in 2024, then he needs to think not only about how to annoy Joe Biden but also about not losing the remnants of his popularity over the next 4 years. Trump is not the only member of the Republican Party and in 4 years he will be 78 years old. Yes, Biden is now the same age. But that does not mean that Republicans will want to nominate Trump again from their party. In general, Trump signed the budget, so Americans will now receive 600 "coronavirus" dollars, and the American unemployed - "coronavirus allowances" for $ 300 a week. Earlier, Trump called such figures of assistance to Americans "shameful", but in the end, still signed the bill. According to media reports, Trump changed his decision after a conversation with 11 senators, who asked the president to either veto the 2021 budget or sign it. Trump agreed to sign it but still expects that payments to the American population will be increased in a new, separate bill. Already on Monday, the US Congress will vote on a separate package of stimulus measures, which involves increasing one-time payments to $ 2,000 per person (now $ 600). The US currency did not react very strongly to this event. Quotes of the euro/dollar pair continue to trade around 2.5-year highs, so now it is even impossible to conclude a correction. It seems that at any moment the pair can resume the upward movement and easily update the current highs. It was not possible to do this on Monday, however, it may be possible on Tuesday. For the US dollar, it is now difficult to think of anything else bad. The dollar is already down 13 cents in 2020. It seems to be not too much, but we still return to the question of the reasons for this decline. One can assume that what we have seen in the last 9 months is a banal correction within the framework of a long-term downward trend that began back in 2008. It was then that the prolonged fall of the European currency began from the level of $ 1.60. Thus, 13 cents up is not so much in the context of years and decades. However, from our point of view, the currency can not become more expensive by 10-15 cents simply for technical reasons. The euro/dollar pair is not prone to such "bubbles" as oil, for example. Therefore, we continue to expect the formation of a new downward trend. However, we also remind you that any fundamental hypothesis must be confirmed by technical signals. Until a downward trend is technically formed, it is not recommended to trade down.
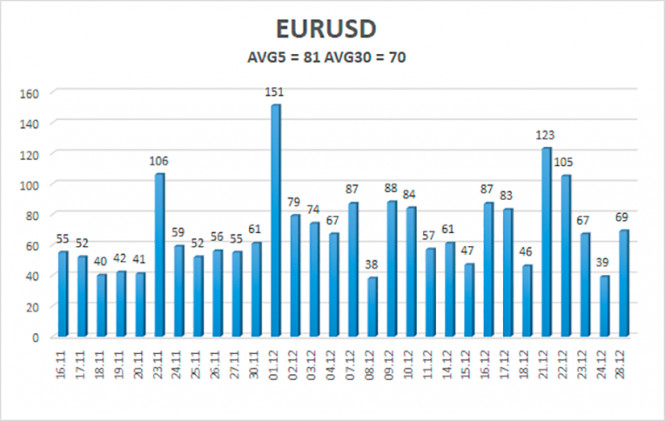
The volatility of the euro/dollar currency pair as of December 28 is 81 points and is characterized as "average". Thus, we expect the pair to move today between the levels of 1.2129 and 1.2291. The reversal of the Heiken Ashi indicator to the top signals a new round of upward movement. Nearest support levels: S1 – 1.2207 S2 – 1.2146 S3 – 1.2085 Nearest resistance levels: R1 – 1.2268 R2 – 1.2329 Trading recommendations: The EUR/USD pair has started a new round of upward movement. Thus, today it is recommended to open new long positions with a target of 1.2268 if the price bounces off the moving average. It is recommended to consider sell orders if the pair is again fixed below the moving average with a target of 1.2146. Now the pair shows signs of flat and "swing". The material has been provided by InstaForex Company - www.instaforex.com |
| Posted: 28 Dec 2020 01:39 PM PST Hourly chart of the GBP/USD pair
The GBP/USD pair crossed the upward trend line in the morning, which created a sell signal. Yesterday we marked 1.3471 and 1.3373 as target levels, the first of which was both reached and surpassed. Thus, if novice traders took profit near it, they could earn around 75 points. The sell signal is still relevant and those who have not yet closed the sale are now in profit of about 100 points. A new downward trend has formed for the pound/dollar pair, and the price was unable to update and/or overcome the previous local high of 1.3624. Thus, chances that a downward trend will be created in the short term has increased. We now expect the pair to fall to the $1.32 area. In order to be able to consider short positions again, you need to wait for the pair to correct and form a new sell signal. However, the pound may continue to move down without a correction. We still recommend being content with the profit you could get up to now. Fundamentally, there is absolutely nothing to say now. The trade deal has been agreed upon between the UK and the European Union, but now there is little to do - it needs to be ratified by both sides. The British Parliament will deal with this issue on December 30 and, no doubt, will approve the deal. The European Parliament will vote for ratification after the New Year. In the meantime, the European Council has approved the so-called "provisional application", which allows the entry into force of an international agreement without ratification by the European Parliament. The fall of the British currency is now, from our perspective, fundamentally justified. The pound has been rising for a long time on the basis of only positive expectations on the London-Brussels talks. Now is the time to pay back your debts. The deal is good, but it does not remove all of the UK's economic woes. We estimate that the UK economy will lose about 2% of GDP in the fourth quarter, while the US will grow by a few percent. The British economy may lose around 1% in the first quarter of 2021, the Bank of England ascertains. Thus, not only is the pound overbought, but all forecasts speak in favor of the fact that the economy will contract. Well, technically, we have a signal for a downward trend. No major macroeconomic reports or other events scheduled for Tuesday, December 29th. Thus, there will be no fundamental background, which does not mean the absence of movement for the pound/dollar pair. Possible scenarios on December 29: 1) Buy orders have lost their relevance, since the price settled below the trend line. And so, the bulls have released the initiative and now we need to wait for a new upward trend in order to be able to trade up. Such a trend is unlikely to appear the next day. 2) Selling has now become relevant, but today the pair has already fallen by more than 100 points. Thus, the best solution would be to close short positions and wait for a new sell signal from MACD. You can also continue to keep sell orders open with targets at 1.3416 and 1.3345 until the MACD indicator turns up. On the chart: Support and Resistance Levels are the Levels that serve as targets when buying or selling the pair. You can place Take Profit near these levels. Red lines are the channels or trend lines that display the current trend and show in which direction it is better to trade now. Up/down arrows show where you should sell or buy after reaching or breaking through particular levels. The MACD indicator consists of a histogram and a signal line. When they cross, this is a signal to enter the market. It is recommended to use this indicator in combination with trend lines (channels and trend lines). Important announcements and economic reports that you can always find in the news calendar can seriously influence the trajectory of a currency pair. Therefore, at the time of their release, we recommended trading as carefully as possible or exit the market in order to avoid a sharp price reversal. Beginners on Forex should remember that not every single trade has to be profitable. The development of a clear strategy and money management are the key to success in trading over a long period of time. The material has been provided by InstaForex Company - www.instaforex.com |
| Posted: 28 Dec 2020 01:39 PM PST Hourly chart of the EUR/USD pair
The EUR/USD pair rose by 60 points at night and in the morning, then dropped by the same amount for two hours in the afternoon, afterwards it calmed down and stabilized around the 1.2220 level. Since the pair's quotes settled above the downward trend line during the day (which is now indicated by a dotted line), novice traders could open long positions in order to get the price to settle above this area. We mentioned the 1.2254 level as a target. The price fell short by around 4 points and significantly dropped. Thus, novice traders could earn 20-25 points today, but they could also incur losses if they did not exit long positions in time. However, it was impossible to predict the drop in quotes at lunchtime. No important news that could support the dollar at that time. We warned that the holidays are not the best time to trade. The price can trade in any way, and it will be extremely difficult to predict its behavior. At the same time, we have the rising trend line at our disposal, which is now the only one in the chart. The price rebounded off it five times in total, but it is very difficult to say that an upward trend has now formed. Thus, formally, long positions have now become relevant at least until the price settles below the trend line. No macroeconomic report from the European Union and the United States on Monday, December 28. And, in principle, there was no news, which is absolutely not surprising for the holiday period. Donald Trump signed the 2021 budget in America, which also includes a $900 billion stimulus package. However, this is not the kind of news that could affect the movement of the euro/dollar pair. In fact, this package can only exert additional pressure on the dollar, since it is not clear where the United States government will take almost a trillion dollars from. It is one thing to raise money, if you just print - then the supply of the US dollar in the foreign exchange market will grow and its rate may sink even more. The US consumer confidence indicator will be published on Tuesday, which, you can be sure, will not have any impact on the pair's movement. Most likely, the "swing" will continue, which is to move in different directions. Or flat. Possible scenarios on December 29: 1) Long positions have become relevant at the moment, since the pair surpassed the downward trend line, and the upward trend has been preserved. Thus, formally, we should now wait for the MACD indicator to discharge and create a new buy signal from it, afterwards you should consider opening new long positions while aiming for 1.2230 and 1.2245. Rebounding from the trend line can be used as a buy signal. But at the same time, there is a high probability that the pair will continue to move in different directions. 2) Trading for a fall does not seem appropriate now. In order to be able to re-examine sell orders, the price needs to settle below the rising trend line. In this case, you can open short positions while aiming for 1.2167 and 1.2152. On the chart: Support and Resistance Levels are the Levels that serve as targets when buying or selling the pair. You can place Take Profit near these levels. Red lines are the channels or trend lines that display the current trend and show in which direction it is better to trade now. Up/down arrows show where you should sell or buy after reaching or breaking through particular levels. The MACD indicator (14,22,3) consists of a histogram and a signal line. When they cross, this is a signal to enter the market. It is recommended to use this indicator in combination with trend lines (channels and trend lines). Important announcements and economic reports that you can always find in the news calendar can seriously influence the trajectory of a currency pair. Therefore, at the time of their release, we recommended trading as carefully as possible or exit the market in order to avoid a sharp price reversal. Beginners on Forex should remember that not every single trade has to be profitable. The development of a clear strategy and money management are the key to success in trading over a long period of time. The material has been provided by InstaForex Company - www.instaforex.com |
| Evening review of EURUSD on 28.12. Euro keeps growing Posted: 28 Dec 2020 01:39 PM PST
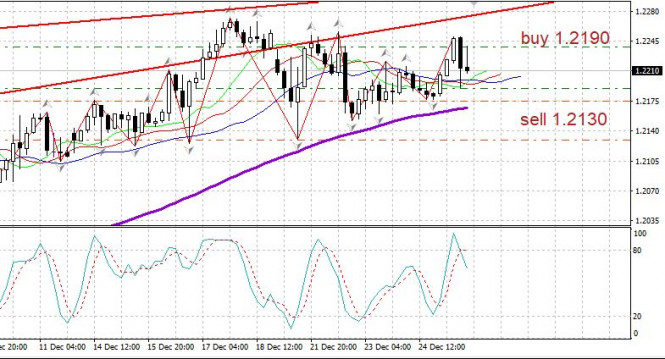
EURUSD - The euro opened with growth, followed by a sharp decline - but then it rebounded. We keep buying the euro from 1.2190. Sell from 1.2130. The material has been provided by InstaForex Company - www.instaforex.com |
| USD turns bearish immediately after sudden growth. EUR/USD took the chance for a rebound Posted: 28 Dec 2020 08:20 AM PST
On the eve of Christmas, investors again turned to the US dollar, which was in high demand due to the possible exit of Britain from the European Union under a "tough" scenario and uncertainty around the adoption of the next package of fiscal incentives in the United States. This allowed the USD to move away from the lows for two and a half years, reached earlier in the area of 89.7 points, and become the strongest currency among the main competitors at the end of last week. However, on Monday, the pressure on the protective greenback returned, as the threats that had previously troubled market participants receded into the background. The risk appetite was spurred by reports that US President Donald Trump has finally approved the state budget for 2021, which includes a $900 billion economic aid package in response to the pandemic. Investors welcomed the move as it restored unemployment benefits to millions of Americans and averted a federal government shutdown of the world's largest economy. Against this background, global stock indexes rose, managing to recoup recent losses, while the greenback was forced to partially abandon its previous gains. From the March highs of around 103 points, the US dollar has already retreated by more than 13%, falling to 90 points. This year, low interest rates, as well as large-scale fiscal and monetary stimulus in the United States, primarily contributed to the fall in the USD. Most experts agree that the greenback will continue to weaken. According to them, investors will abandon this "safe haven" against the background of mass vaccination against COVID-19, as well as the further easing of the Fed's monetary policy. In addition, the United States has long been experiencing a budget deficit, and the depreciation of the US dollar, according to analysts, will have a positive impact on the attractiveness of national assets. Taking advantage of the bearish market sentiment towards the US dollar, the EUR/USD pair tried to develop a rebound, pushing off from the weekly upward trend line in the area of 1.2185. However, the pair's rally quickly fizzled out near the 1.2250 level, which remains a strong resistance for now. In general, the main currency pair is ready to test again the highs for two and a half years, noted earlier in December in the area of 1.2270-1.2275. From here, the bulls will open the road to 1,2300, 1,2340, and 1,2400. Meanwhile, the inability of the latter to protect the above-mentioned upward trend line in the area of 1.2185 may provoke sales, which will throw the pair in the direction of 1.2130. Further drawdown will cancel out the bullish forecast and clear the way for a decline to 1.2060 and further to 1.2000. The material has been provided by InstaForex Company - www.instaforex.com |
| December 28, 2020 : GBP/USD Intraday technical analysis and trade recommendations. Posted: 28 Dec 2020 07:47 AM PST
|
| December 28, 2020 : EUR/USD Intraday technical analysis and trade recommendations. Posted: 28 Dec 2020 07:30 AM PST
|
| December 28, 2020 : EUR/USD daily technical review and trade recommendations. Posted: 28 Dec 2020 07:16 AM PST
Shortly after, the EUR/USD pair has demonstrated a quick upside movement.The pair has targeted the price levels around 1.1990 initially which exerted considerable bearish pressure bringing the pair back towards 1.1920 which constituted a temporary KEY-Zone for the EUR/USD pair.That's why, another episode of upside movement was expressed towards 1.2160 where a false breakout above the price level of 1.2200 was regarded as a considerable bearish reversal signal.Two weeks ago, a short-term reversal pattern has been demonstrated around 1.2265. Intraday downside retracement to the downside was expected to occur. However, the EUR/USD pair has failed to pursue towards lower price levels.On the other hand, Bearish closure below the mentioned price zone of 1.2200 - 1.2170 is needed to turn the intermediate outlook for the pair into bearish and enhance a quick bearish decline towards 1.2040 then 1.1920.Trade Recommendations :-Conservative traders are advised to look for SELL Positions around higher price levels near 1.2250-1.2270. Exit level should be placed above 1.2300. Target levels should be located around 1.2200, 1.2170 then 1.2120 The material has been provided by InstaForex Company - www.instaforex.com |
| USDCAD rejected at back test of resistance and previous support zone Posted: 28 Dec 2020 06:34 AM PST USDCAD is trading around 1.2828. Trend remains bearish as price continues making lower lows and lower highs. Price recently reached the 1.2960.and got rejected. This was once support and is now resistance. Trend is bearish as long as price is below this level.
USDCAD back tested the broken support area of 1.2950-1.2960 and got rejected last week. This week starts on a negative note. Price has potential to move to lower lows below 1.2685 as long as price does not break above the red rectangle. Short-term support is found at 1.2795 and next at 1.2750. Resistance is found at 1.2930-1.2960 area. Bulls need to recapture this level in order to reverse the medium-term bearish trend. The material has been provided by InstaForex Company - www.instaforex.com |
| GBP/USD analysis on December 28. EU representatives: there should be a trade deal with the UK Posted: 28 Dec 2020 06:30 AM PST
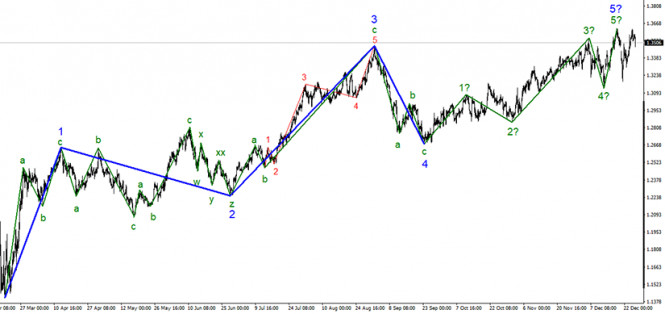
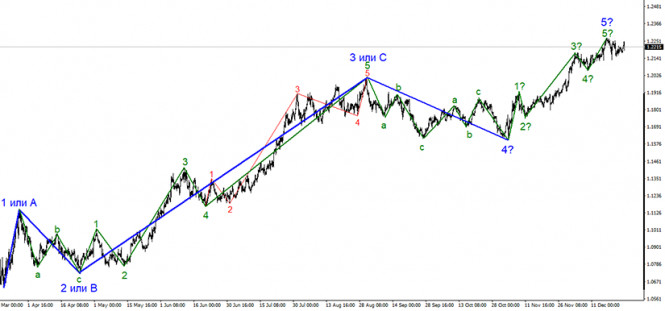
The section of the trend, which originates on September 23, finally took a five-wave form. Moreover, the view is quite complete. Of course, wave counting can be complicated, however, at the moment, everything looks like a complete wave structure. Even the increase in the price of the instrument in the last week is still interpreted as a corrective wave b as part of a new downward correction structure of waves. However, a successful attempt to break the maximum of the expected wave 5-5 will indicate the readiness of the markets for new purchases of the British.
On the lower chart, the wave marking also looks quite convincing and also allows for the option in which the entire section of the trend will take a more complex form. At the moment, the pair's quotes have risen to the maximum of the previous wave, which is the top point of the entire upward trend section, if the current wave marking is correct and does not require adjustments. If a downward reversal occurs without a successful attempt to break the expected wave 5-5, then the waves after December 17 can be interpreted as waves a and b, therefore, I will expect to build a wave C with targets below the minimum of the expected wave a. The UK Parliament will meet for an emergency meeting on December 30 to vote on this day for the trade deal, which Michel Barnier and David Frost managed to agree after all. The European Parliament will not vote this year, as it simply does not have time to read the document, which has more than 1,200 pages. Thus, the Committee of Permanent Representatives of the European Union approved today the temporary application of the deal from January 1. This means that the UK and the EU will continue to trade "freely" with each other after December 31, although the European Parliament will not have time to ratify the agreement. It is noted that the ambassadors of all 27 EU countries unanimously voted "for" this decision. "We have finally reached an agreement. It was a long and tortuous road, but we managed to get a good deal," said European Commission President Ursula von der Leyen. Thus, the British economy will not collapse in 2021 due to a sharp and powerful drop in trade with the European Union. And the British now, when it's time for it to increase in price, began building a new corrective wave. By and large, after the moment when London and Brussels announced an agreement, the pound sterling no longer rose in price. Many analysts foresaw this option, as in recent months, demand for the British pound remained very high due to market expectations of a deal. My wave marking now also warns about the readiness to build at least one new descending wave with targets located below the 32nd figure. General conclusions and recommendations: The pound/dollar instrument has presumably started building a new downward trend section. Thus, I currently recommend selling the pound/dollar instrument for each MACD signal "down" with targets located around 32nd and 31st figures, within the expected first (global) wave of a new downward trend section. A successful attempt to break the maximum of the wave 5-5 will indicate the readiness of traders for new purchases of the British and cancel the option of building a new downward trend. The material has been provided by InstaForex Company - www.instaforex.com |
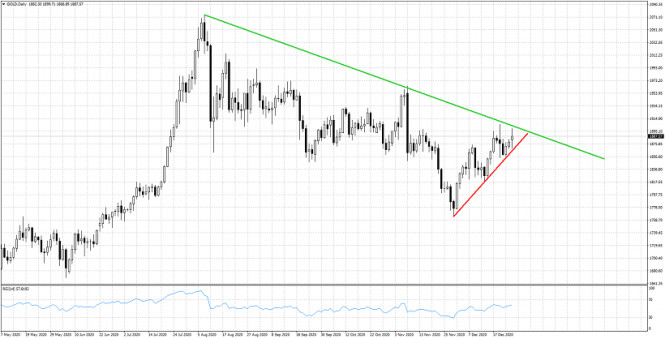
| Gold bulls face important resistance Posted: 28 Dec 2020 06:24 AM PST Gold price is challenging the important resistance area around $1,900. Short-term trend remains bullish as price is making higher highs and higher lows after the $1,763 low. Support trend lines remain intact. So far price has respected support trend line.
Gold price is challenging the upper channel boundary. A rejection here could lead to another turn lower towards the lower channel boundary. So far there is no indication of a rejection or reversal. As explained above, key support is found at $1,865 and bulls must defend this level. Now it is not the time to be very optimistic as price is very close to key resistance. It is not time be bullish. If resistance is broken then we turn bullish. Now we are at least neutral, if not bearish. The material has been provided by InstaForex Company - www.instaforex.com |
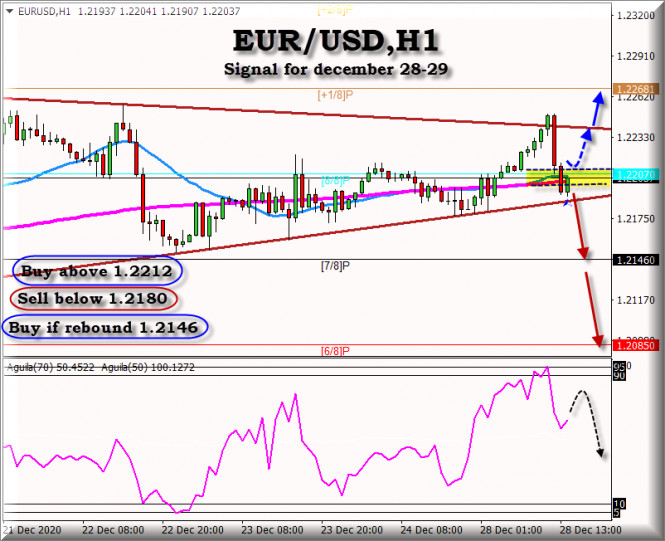
| Trading Signal for EUR/USD for December 28 - 29, 2020: Key Level at 1.2207 Posted: 28 Dec 2020 06:18 AM PST The EUR/USD pair has been oscillating between the two converging trend lines, which have formed the symmetrical triangle pattern. The pair broke above the top of this line in today's European session, but then quickly pulled back to the 1.2200 support. So, in case of another bullish breakout through the triangle above today's high at 1.2250, we could expect the testing of the1.2275 region of the +1/8 of murray and 1.2335 +2/8 of murray. Conversely, any significant pullback towards the zone of 1.2210 could still be seen as a buying opportunity and remain limited near the triangle support around the area of 1.2185. Furthermore, a subsequent drop below 1.2180 could trigger some technical selling and accelerate the slide towards the 1.2145 congestion zone, the 7/8 murray, that should act as a key point for short-term long deals on the EUR/USD pair. EUR/USD still maintains its upward potential on 1-hour charts, given that it is being supported by the eagle indicator, which is showing a bullish bias in the early American session. However, if it fails to hit a new high, we could expect a technical correction to the 1.2145 support zone. On the chart below, we have highlighted a yellow area which indicates the strength of the market. If the EUR/USD pair is trading above this area, we have buying opportunities while if it is trading below, we will have short opportunities. On December 28, the market sentiment shows that there are 62% of traders who are selling this pair. We also noticed a small decrease which is likely to be a technical correction for the next few days.
Trading tip for EUR/USD for December 28 – 29 Buy above 1,2212 (SMA 21) with take profit 1.2245 and 1.2269, stop loss below 1.2185. Sell below (EMA 200 and SMA 21) around 1.2180, with take profit at 1.2146 (7/8 of murray) and 1.2085, stop loss above 1.2215. Buy if the pair rebounds around 1.2145 (7/8), with take profit at 1.2207 (8/8 of murray) and 1.2249, stop loss below 1.2110. The material has been provided by InstaForex Company - www.instaforex.com |
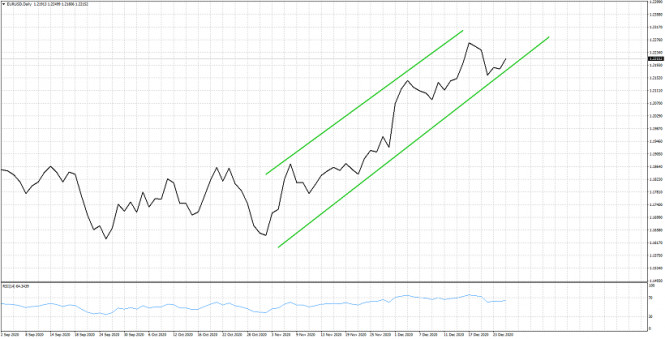
| EURUSD remains inside bullish channel Posted: 28 Dec 2020 06:13 AM PST EURUSD is back again above 1.22 and still inside the green upward sloping bullish channel since late October. Trend remains bullish. Price continues making higher highs and higher lows. As long as price is above 1.2150 bulls remain in control.
EURUSD continues to respect the lower channel boundary. As long as price is above 1.2150 we remain bullish. Support by the channel is provided at 1.2165-75. Bulls need to respect this level and stay above it. Breaking below and out of the channel could bring additional pressure on the price and could lead to a larger pull back. So far no sign of reversal. The material has been provided by InstaForex Company - www.instaforex.com |
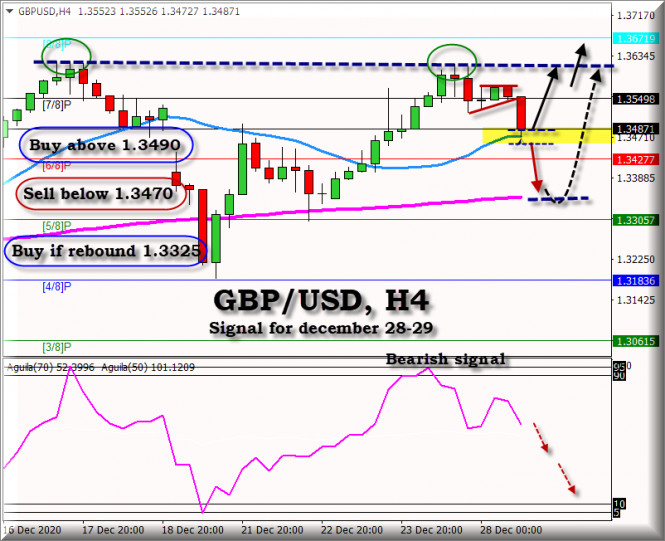
| Trading Signal for GBP/USD for December 28 - 29, 2020 Posted: 28 Dec 2020 06:13 AM PST In the early US session, the GBP/USD pair is trading above the 21-day SMA, just at that level of 1.3471 where we saw a rebound of the GBP/USD pair. Now it serves as good support, and we hope that the pair may gain a new upside momentum above this zone. Last week, the GBP/USD pair left a double top at 1.3620. Now it will have to face this level again and break through it to reach the high of the 1.3690 area of 8/8 of murray and 1.3793 +1/8 of murray. If the GBP/USD pair trades below the 21-day SMA on the 4-hour chart, the market could push the price down to the support of 1.3325, the area of the 200 EMA. So, if we see that the pair falls below 1.3470, this will be a good selling opportunity. Since it is the final week of the Brexit deal, we recommend buying at support levels, given that the markets expect a good bullish rally when the Brexit deal is finalized. The market sentiment for this morning of December 28 shows that 51% of traders are selling the GBP/USD pair. This is a sign that we could expect a drop to the 1.32 area in the next few days. The eagle indicator is also showing bearish signal.
Trading tip for GBP/USD for December 28 – 29 Buy above 1.3490 (SMA 21) with take profit at 1.3549 and 1.3620, stop loss below 1.3460 Sell below 1.3470 (SMA 21), with take profit at 1.3427 (6/8) and 1.3325, stop loss above 1.3505. Buy if the price rebounds at 1.3325 (EMA 200), with take profit 1.3427 and 1.3670, stop loss below 1.3290. The material has been provided by InstaForex Company - www.instaforex.com |
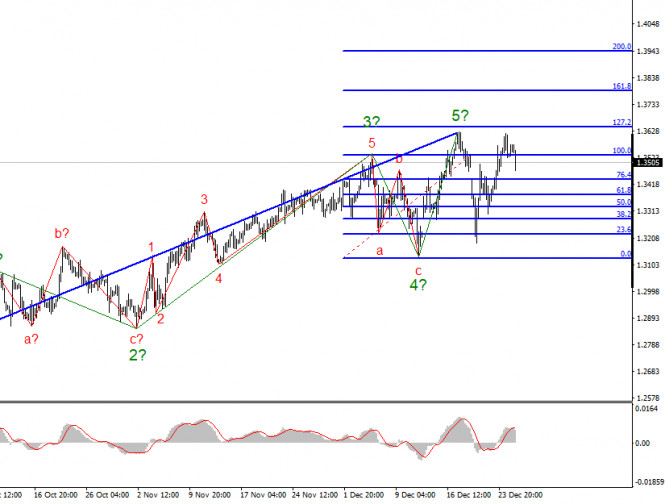
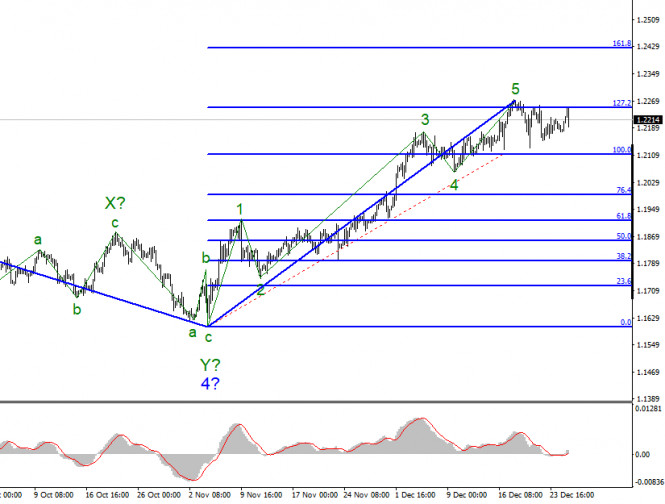
| Posted: 28 Dec 2020 06:02 AM PST The wave pattern of the EUR/USD pair indicates the ongoing formation of an ascending section of the trend. However, we can assume that the uptrend has been already completed. Thus, I think that a new descending section is being formed at the moment which may turn out to be a corrective three-wave pattern. At the same time, a successful attempt to break through the high of the expected wave 5 in 5 will indicate the start of a bullish trend in the market. As a result, the uptrend section may become more complex. The wave pattern on a smaller time frame also signals a possible completion of the uptrend. The internal wave layout of the supposed wave 5 looks quite convincing. So now, at least a three-wave descending pattern can be built. If this is true, then the quotes will continue to decline in the long term to the targets located near the 19th area and below. Three unsuccessful attempts to break through the 127.2% level suggest that the pair is set to start a downward movement soon. The week ahead of New Year's Eve started with active trading. Since the morning session, the euro/dollar pair has moved up by 60 pips, but then retreated by the same amount. So, the instrument was trading quite actively on Monday. However, the wave pattern that has been formed after December 18, creates a mixed picture. In the following week, the pair has neither resumed the construction of the uptrend nor has it begun the formation of a new downtrend. Over the past week, markets are uncertain about how to trade the instrument. That is why it has been trading sideways. The news background is very weak right now, as the Christmas week and the upcoming New Year holidays are doing their bit. This week, market participants do not expect any macroeconomic reports. At the same time, quite important news is coming from the US where the country was once again on the edge of a shutdown. Finally, Donald Trump has singed the spending bill for 2021 which also includes a long-awaited $900 billion coronavirus relief package. This fiscal stimulus is aimed at supporting the county's economy and its citizens. Notably, Democrats and Republicans have not been able to agree on the bill since early August this year. At first, Trump refused to approve this budget plan and demanded a number of amendments. But later he gave in, as several members of the House of Representatives appealed to the president with a request to either sign the law or veto it. Donald Trump would have been fully responsible for the rejection of the bill which would have affected his already low political rating. So, the US leader decided to sign the bill. This means that all government services will avoid the shutdown and American citizens and businesses will finally receive financial aid from the government. Conclusion and trading tips The euro/dollar pair has supposedly completed the formation of an ascending trend section. Thus, I recommend selling the instrument with the targets located near the 20 and 19 areas following every new sell signal from the MACD indicator. At the same time, the wave layout of the uptrend section may become more complex and take on a more extended form. For this, the pair needs to break through the 1.2270 mark, which is only 80 pips away from the current price level. The material has been provided by InstaForex Company - www.instaforex.com |
| EUR/USD Accelerates Its Sell-Off Posted: 28 Dec 2020 05:17 AM PST EUR/USD is trading in the red zone and has almost erased today's gains due to USDX's rebound. Technically, the pair showed some overbought signs, but it is premature to talk about a corrective phase. The lack of important data and events could help the greenback to recover versus the euro. The pair could develop a corrective phase, only if the US Dollar Index resumes its current bounce back. EUR/USD Bearish Reversal Favored!
EUR/USD failed to retest the upper median line and now, it is trading around the1.2200 psychological level again. It was rejected by the R1 (1.2247) level, a bearish closure under the Pivot Point (1.2188) could bring more sellers into the game. The price is trapped between the 1.2271 and 1.2125 levels, so a valid breakout from this pattern brings a great trading opportunity. Trading Conclusion!Buy from above 1.2271 with a potential upside target at 1.24. Sell after a valid breakdown from below 1.2125 level. The material has been provided by InstaForex Company - www.instaforex.com |
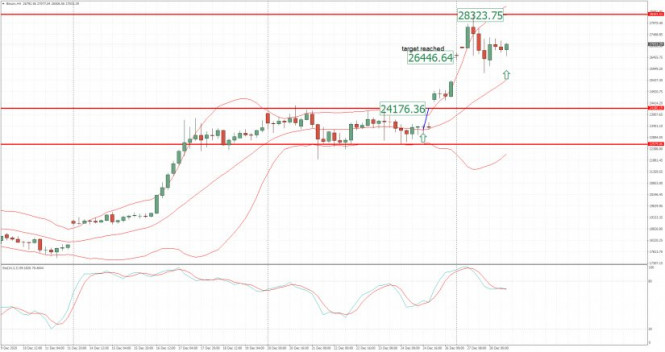
| Posted: 28 Dec 2020 05:02 AM PST Further Development
Analyzing the current trading chart of BTTC, I found that BTC reached our Friday's targets at the price of $24,176 and $26,500. The strong up cycle is still active on the BTC and my advice is to watch for buying opportunities for the potential re-test of the $28,300. Based on the 4H time-frame, I see potential bullish flag pattern in creation, which is good sign for continuation. Key Levels: Resistance: $28,300 Support level: $25,785 The material has been provided by InstaForex Company - www.instaforex.com |
| Posted: 28 Dec 2020 04:54 AM PST UK's Gove: If AstraZeneca vaccine rollout goes well, we'll be in a place to lift restrictions quickly Gove building up further optimism going into the new yearThe UK is widely expected to approve the AstraZeneca/Oxford vaccine in the coming days, with the rollout then set to begin in the first week of January. The announcement is expected some time this week, as early as tomorrow so watch out for that. While I wouldn't doubt the optimism as more vaccines are rolled out, I would take Gove's remarks with a pinch of salt. Up until Christmas eve, there has been just over 600,000 people that have been vaccinated in the UK. While the AstraZeneca/Oxford vaccine may be easier to store/transport and is cheaper, it doesn't take away the fact that it is still going to take a long while before we see the impact of the vaccines on the health crisis in general. Further Development
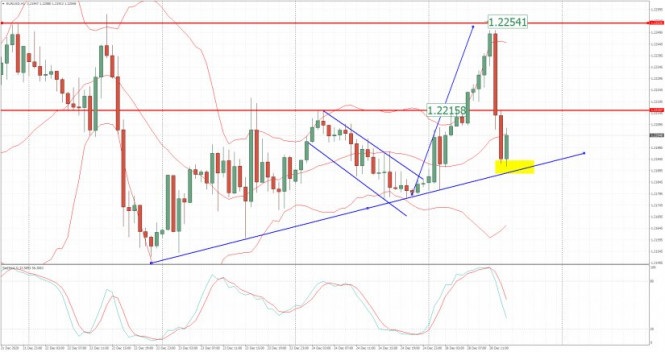
Analyzing the current trading chart of GBP/USD, I found that EUR reached our Friday's target at 1,2250 but then rejected strongly. Anyway, the rising trend line is still active and I would watch for buying opportunities on the dips with potential for re-test of tithe 1,2215 and 1,2250. 1-Day relative strength performance Finviz
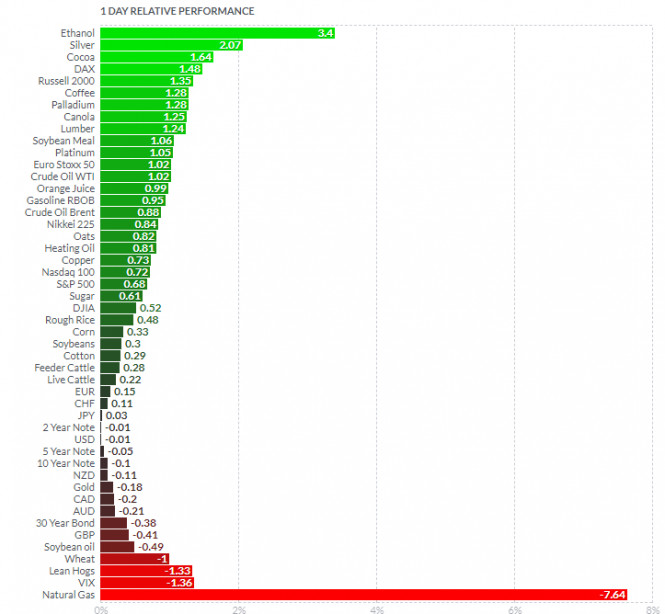
Based on the graph above I found that on the top of the list we got Silver and Ethanol today and on the bottom Natural Gas and VIX. Key Levels: Resistance: 1,2215 and 1,2250 Support level: 1,2180 The material has been provided by InstaForex Company - www.instaforex.com |
| Posted: 28 Dec 2020 04:49 AM PST EU ambassadors approve provisional application of Brexit trade deal Green light for : EU Ambassadors have unanimously approved the provisional application of the EU-UK Trade and Cooperation Agreement as of January 1, 2021. Based on the graph above I found that on the top of the list we got Silver and Ethanol today and on the bottom Natural Gas and VIX. Gold is slightly negative today... Key Levels: Resistance: $1,896 and $1,907 Support level: $1,868 The material has been provided by InstaForex Company - www.instaforex.com |
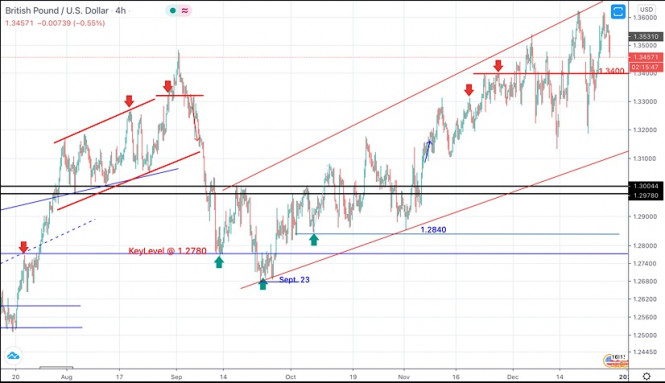 In December, the price levels of (1.3380-1.3400) have prevented further bullish movement for the past few weeks.Bearish target was targeted around 1.3300. However, the pair has failed to pursue towards lower targets.Instead, a bullish spike was expressed towards 1.3480-1.3500 where the upper limit of the depicted movement channel has previously provided temporary bearish pressure on the pair.Shortly after, another bullish spike has recently been demonstrated towards 1.3600 where the upper limit applied considerable bearish rejection again.Recently, the GBPUSD pair looked overbought while consolidating above the key-level of 1.3400.As expected, bearish reversal was recently initiated around 1.3600. A quick bearish decline was demonstrated towards 1.3200.Intermediate-term outlook could turn into bearish provided that the pair maintains movement below 1.3400. However, the pair has failed to maintain bearish decline below 1.3200.Instead, bullish persistence above 1.3400 invalidates the bearish scenario for the short-term. Another bullish movement may be expressed towards 1.3700 (the channel's upper limit) where bearish rejection should be anticipated.
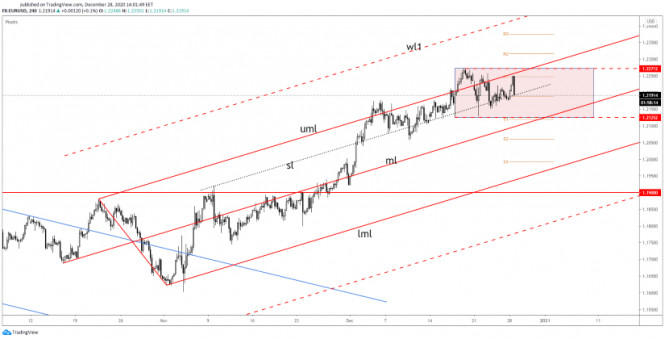
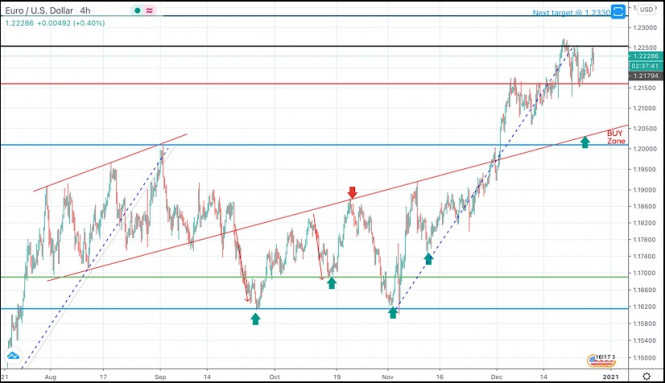 Recently, the EURUSD pair was trapped below the previous key-level (1.2000) until bullish breakout occured to the upside recently in December.Further quick bullish advancement was expressed towards 1.2150 just as expected after failing to find sufficient bearish pressure at retesting of the backside of the broken channel around 1.1970-1.2000 which corresponds roughly to Fibonacci Level of 0%.Recently, the pair looked overbought while approaching the price levels of 1.2250 (138% Fibonacci Level).That's why, conservative traders were advised to look either for SELL Positions or low risk BUY trades around lower price levels.Bearish closure and persistence below 1.2160 then 1.2000 is needed to abort the ongoing bullish momentum to initiate a bearish movement at least towards 1.1860 and 1.1770.Otherwise, the intermediate-outlook for the pair would remain bullish at least towards 1.2330 where 150% Fibonacci Level is located.The price zone around 1.2000-1.1975 remains a Demand Zone to offer bullish SUPPORT for the EURUSD pair if any bearish pullback occurs.
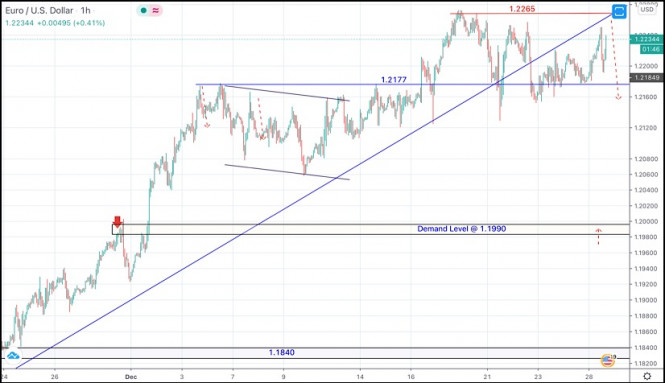 By the end of November, Signs of BUYING Pressure have been initiated around the depicted price zone of 1.1800-1.1840.
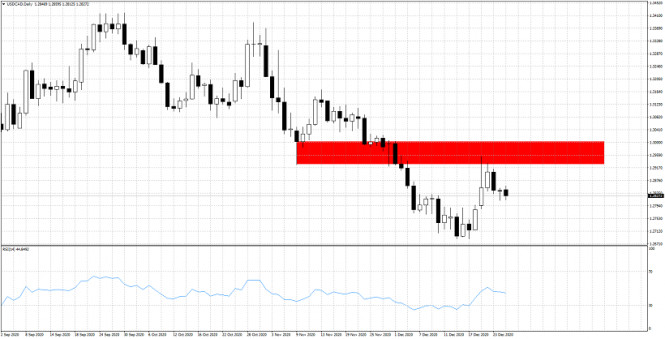
| You are subscribed to email updates from Forex analysis review. To stop receiving these emails, you may unsubscribe now. | Email delivery powered by Google |
| Google, 1600 Amphitheatre Parkway, Mountain View, CA 94043, United States | |


Comments