Forex analysis review
Forex analysis review |
- February 11, 2021 : EUR/USD daily technical review and trading opportunities.
- February 11, 2021 : EUR/USD Intraday technical analysis and trading plan.
- February 11, 2021 : GBP/USD Intraday technical analysis and significant key-levels.
- Bitcoin fresh sell-off in cards
- GBP/USD deeper drop invalidated, upside continuation to be activated
- Bitcoin: Threats of rising inflation and Fed's aggressive expectations
- EUR/USD analysis on February 11. The wave markup gets confused. The market failed to react clearly to the US inflation report.
- US imminent all-consuming inflation is most important help for buying bitcoin
- Technical analysis of GBP/USD for February 12, 2022
- Bitcoin hits monthly high, prepares for a bullish breakout
- Technical analysis of EUR/USD for February 12, 2022
- Jamaica plans to launch a digital currency
- Crypto paychecks gain favor among employees, says Deel
- India is the next major electric car market
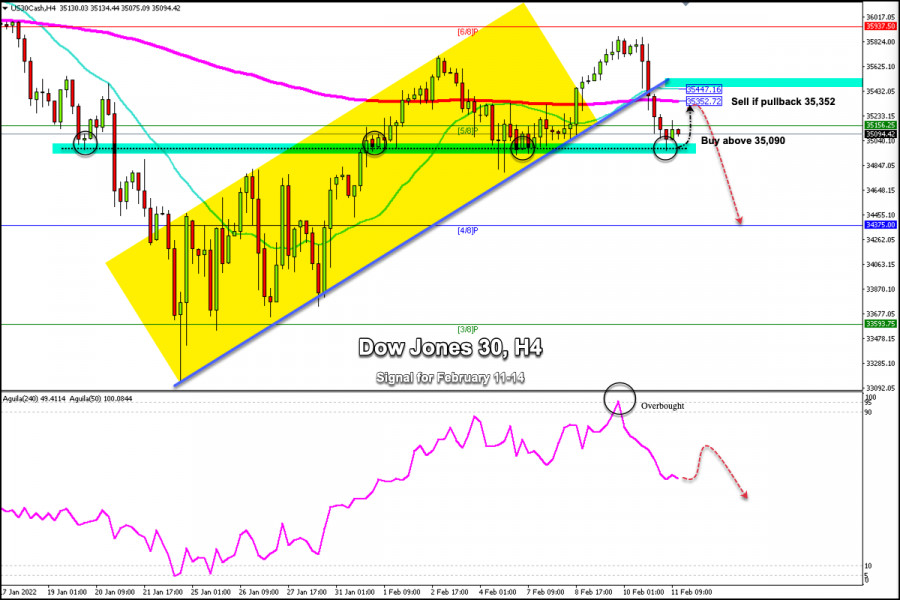
- Trading signals for Dow Jones-30 (#INDU) on February 11-14, 2022: sell in case of pullback towards 35,352 (200 EMA - 21 SMA)
- EUR/USD: Dollar strengthens amid Christine Lagarde's statements
- Trading signals for AUD/USD on February 11-14, 2022: sell below 0.7158 (21 SMA - 200 EMA)
- EUR/USD: Euro parries
- Bitcoin not to set new record in 2022 due to Fed's policy?
- Data on inflation in the United States collapsed the cryptocurrency market
- EUR/USD: Who will cope faster with inflation, the Fed or the ECB?
- Weekly Gold analysis.
- Can Bitcoin continue higher towards $54,000?
- EURUSD tests cloud support.
- BA stock price challenges bearish channel boundaries.
| February 11, 2021 : EUR/USD daily technical review and trading opportunities. Posted: 11 Feb 2022 01:46 PM PST
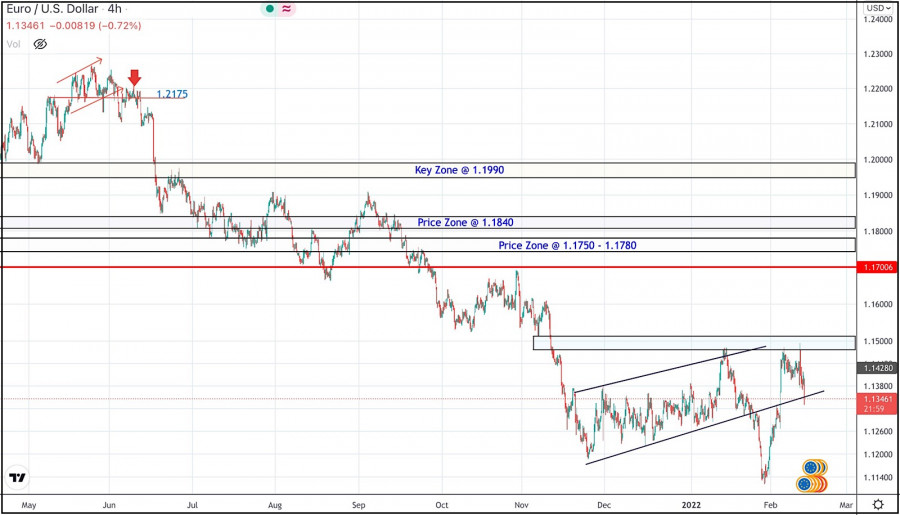
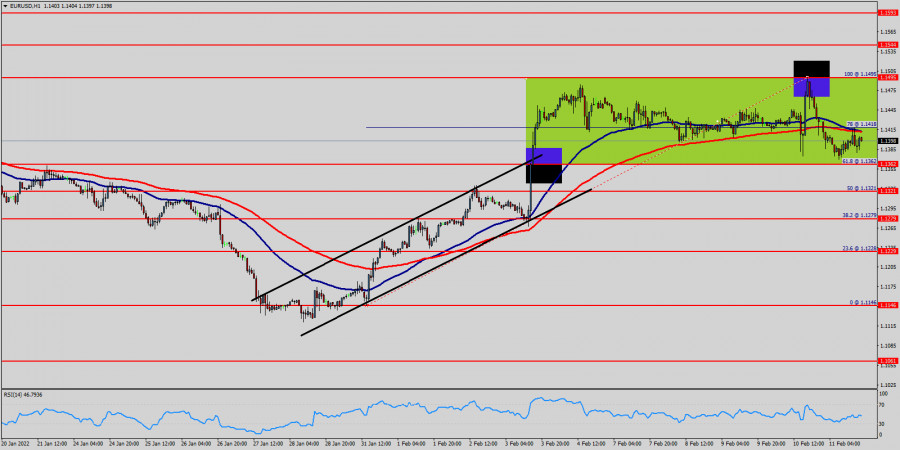
During the past few weeks, the EURUSD pair has been trapped within a consolidation range between the price levels of 1.1700 and 1.1900. In late September, Re-closure below the price level of 1.1700 has initiated another downside movement towards 1.1540. Price levels around 1.1700 managed to hold prices for a short period of time before another price decline towards 1.1200. Since then, the EURUSD has been moving-up within the depicted movement channel until bearish breakout occurred by the end of last week's consolidations. Last week, the price zone of 1.1350 failed to offer sufficient bearish rejection that's why it was bypassed. On the other hand, the price zone around 1.1500 applied significant SELLING pressure and a possible SELL Entry was offered upon the previous ascending movement. The material has been provided by InstaForex Company - www.instaforex.com |
| February 11, 2021 : EUR/USD Intraday technical analysis and trading plan. Posted: 11 Feb 2022 01:45 PM PST
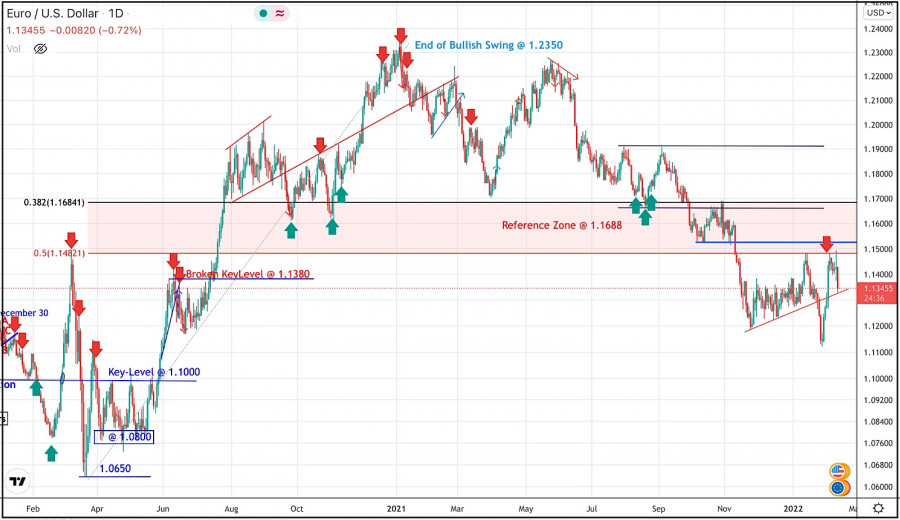
The bullish swing that originated around 1.1650 in August, failed to push higher than the price level of 1.1900. That's why, another bearish pullback towards 1.1650 was executed. However, extensive bearish decline has pushed the EURUSD pair towards 1.1600 and lower levels was reached. Shortly after, significant bullish recovery has originated upon testing the price level of 1.1570. The recent bullish pullback towards 1.1650-1.1680 was expected to offer bearish rejection and a valid SELL Entry. Significant bearish decline brought the EURUSD pair again towards 1.1550 levels which stood as an Intraday Support zone. Hence, sideway movement was demonstrated until quick bearish decline occurred towards 1.1200. Please note that the current bullish movement above 1.1300-1.1350 should be considered as an early exit signal to offset any SELL trades. On the other hand, the price levels around 1.1520 stood as a reference zone that can provide a valid SELL Entry when bullish momentum fades away The material has been provided by InstaForex Company - www.instaforex.com |
| February 11, 2021 : GBP/USD Intraday technical analysis and significant key-levels. Posted: 11 Feb 2022 01:42 PM PST
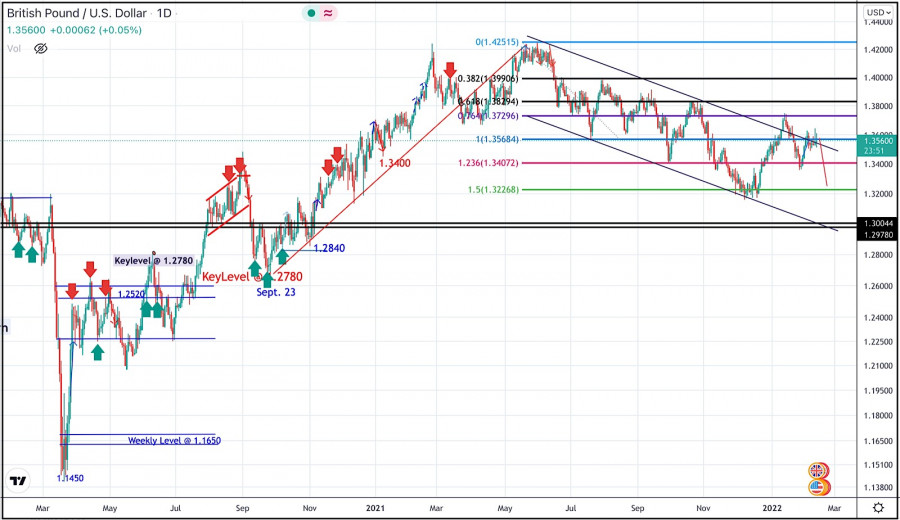
The GBPUSD pair has been moving within the depicted bearish channel since July. Bearish extension took place towards 1.3220 where the lower limit of the current movement channel came to meet with Fibonacci level. Conservative traders should have taken BUY trades around 1.3200 price levels as suggested in previous articles. Recent bullish breakout off the depicted bearish channel has occurred few days ago. However, BUYERS were watching the price levels of 1.3730 to have some profits off their trades. Moreover, the price level of 1.3720 stood as a key-resistance which offered bearish rejection on last Thursday. Shortly after, the short-term outlook turned bearish when bearish decline below 1.3570 occurred earlier last week. As mentioned before, bearish decline below 1.3570 enhanced the bearish side of the market towards 1.3400 which brought the pair back towards 1.3570 for retesting. Moreover, the current bullish pullback towards 1.3570 should be considered for SELL trades as it corresponds to the upper limit of the ongoing bearish channel. The material has been provided by InstaForex Company - www.instaforex.com |
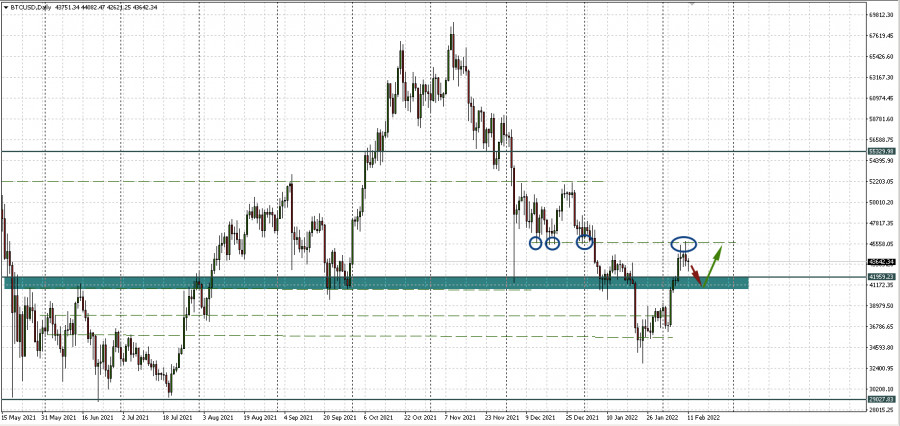
| Bitcoin fresh sell-off in cards Posted: 11 Feb 2022 09:43 AM PST The price of Bitcoin was trading in the red at the time of writing. The price action signaled that the buyers are exhausted and that the sellers could drag it lower in the short term. It was trading at 43,563 far above today's low of 42,625. In the short term, it could only test and retest the immediate upside obstacles before dropping again. BTC/USD registered a 3.15% growth from 42,625 today's low to 43,969 daily high. In the last 24 hours, Bitcoin is down by 3.61% but it is up by 9.40% in the last 7 days. BTC/USD further growth invalidated
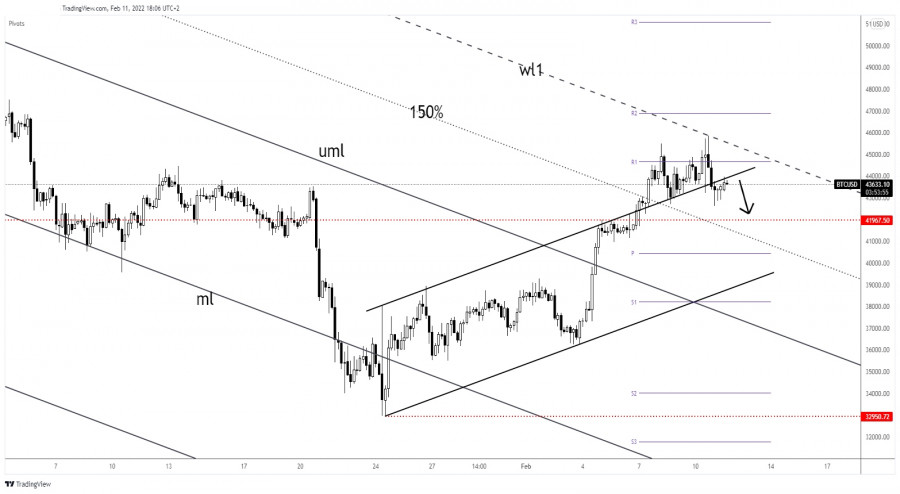
Technically, the pair retested the channel's upside line. As long as it stays below it, the rate could come back down. 43,000 psychological level stands as an immediate downside obstacle. As you can see on the H4 chart, the price found resistance at the first warning line (WL1) of the descending pitchfork. Its false breakout above the weekly R1 (44,656.31) signaled that the buyers are exhausted. It could come back to test and retest the 41,967 downside obstacle and the 150% Fibonacci line. BTC/USD outlookIn the short term, the bias is bearish after dropping below the up channel's upside line. After its massive growth, a temporary decline is natural. A temporary drop could bring new buying opportunities. Moving sideways and making a valid breakout above the warning line (wl1) could activate an upside continuation. The material has been provided by InstaForex Company - www.instaforex.com |
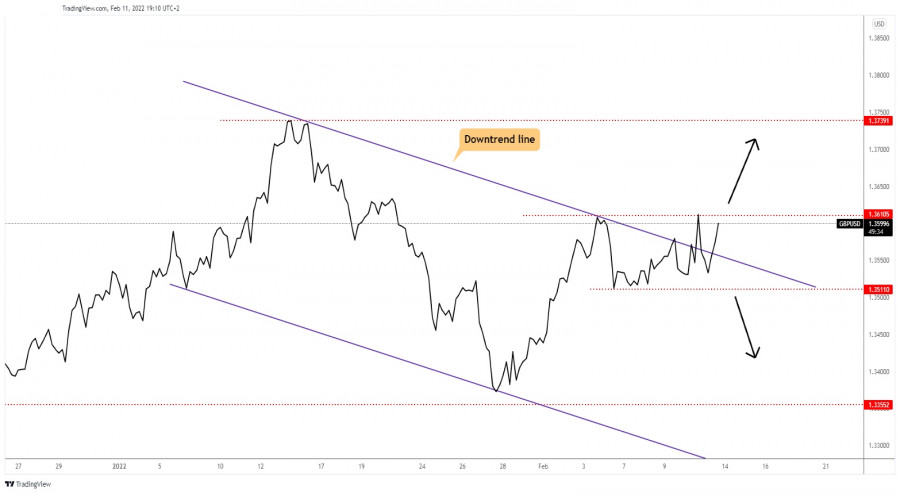
| GBP/USD deeper drop invalidated, upside continuation to be activated Posted: 11 Feb 2022 09:42 AM PST
GBP/USD strong growthThe GBP/USD pair failed to stay under the downtrend line signaling that the downside movement is over and that the buyers could push the rate towards new highs. As you already know from my analysis, GBP/USD could extend its growth if it jumps above the downtrend line and if it passes above 1.3610 former high. A deeper drop would have been confirmed by a breakdown (drop) below the 1.3511 former low. GBP/USD trading conclusionJumping and stabilizing above 1.3610 could confirm further growth and could bring new buying opportunities. 1.3700 psychological level and 1.3739 represent potential upside targets. The material has been provided by InstaForex Company - www.instaforex.com |
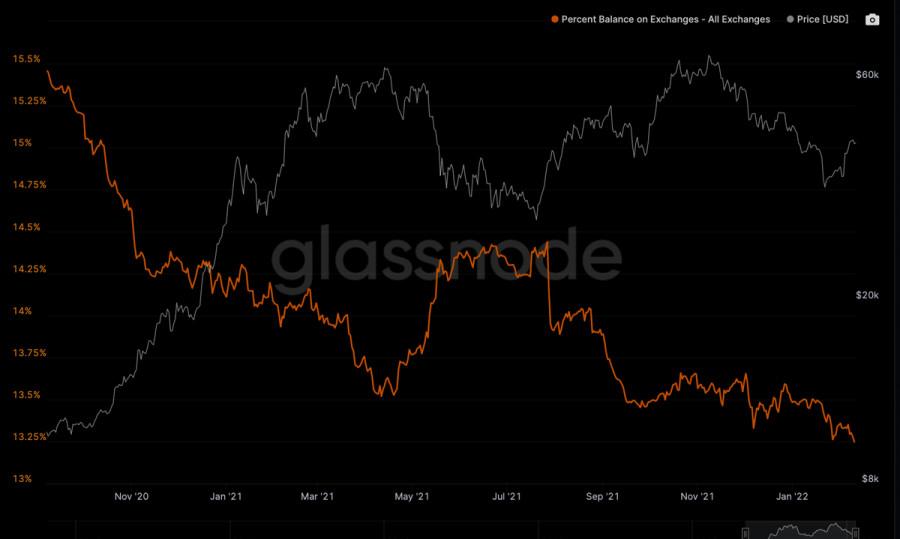
| Bitcoin: Threats of rising inflation and Fed's aggressive expectations Posted: 11 Feb 2022 09:38 AM PST As expected, bitcoin, like the US stocks with which it now correlates, was spooked by the US inflation data. Thursday's report showed that the consumer price index (CPI) rose to 7.5% in January, which was better than expected. With such inflation, the Fed needs to act quickly and aggressively. And the question now is whether they will raise the rate immediately by 0.5% in March. Despite the fact that the opinions of FOMC members differ in terms of the degree of aggressiveness regarding monetary tightening, the market is forming stronger and stronger expectations. After the inflation report, there was even talk of a possible emergency rate hike without waiting for the March meeting. Bitcoin and inflation: what's the connection?Bitcoin, which consolidated under the level of 45,744.38, nevertheless bounced down from it, which can now return the main cryptocurrency to the area of $40,000 per coin. The prospects for aggressive tightening may reduce interest in risky assets, including the cryptocurrency market. However, it is worth watching the market expectations more than the facts themselves now. Moreover, there is still time before the March meeting. During such a period, the technique works perfectly - it remains to focus on the levels, especially since they are worked out very clearly. Holders are calm, speculators are worriedIn the meantime, a new portion of network statistics was brought up with the already familiar arguments that crypto whales are now calm on the market. They are not nervous, but are buying more on drawdowns, waiting for the resumption of the growth of bitcoin. According to a report from the popular network data provider Glassnode, the earliest investors in the main cryptocurrency with wallets that are more than ten years old do not sell their BTC. The number of wallets that were last active more than ten years ago, that is, back in 2012 and earlier, has increased significantly. The number of bitcoins stored in them reached an all-time high of 2,386,849.127 coins. While many old-school investors are still sitting in their bitcoins, new long-term holders are jumping on the bandwagon. The reason for this is the wider adoption of BTC, as well as the fact that many Wall Street firms and wealthy individuals, even famous billionaires such as Paul Tudor Jones, Mark Cuban, Robert Kiyosaki, and Elon Musk, have begun to consider Bitcoin as a store of value. Long-term holders are known in the crypto community as "diamond hands": no matter what coin they hold, they hold it tight. On the other hand, the so-called "paper hands" or investors who came into crypto to make a quick buck or are scared out of fear of missing out (FUD) continue to sell their BTC. For example, additional data from Glassnode shows that the number of wallets holding more than 100 BTC has fallen to a five-year low of 15,650.
|
| Posted: 11 Feb 2022 09:21 AM PST
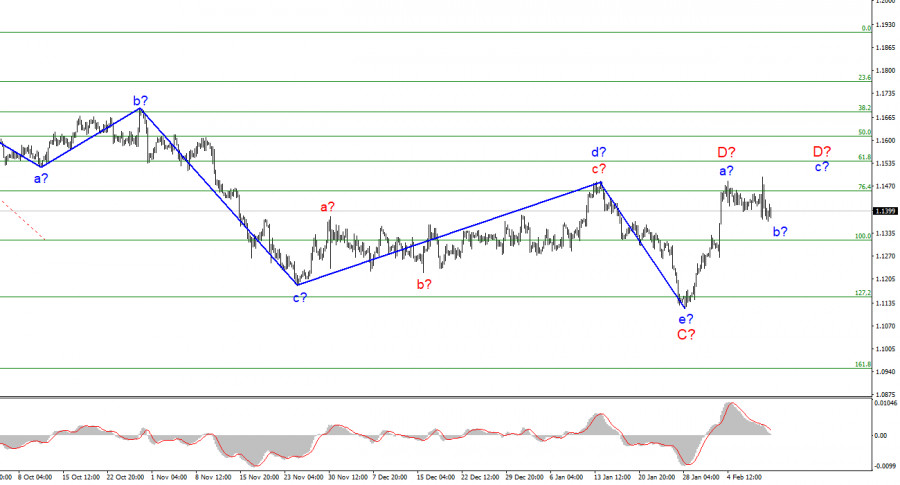
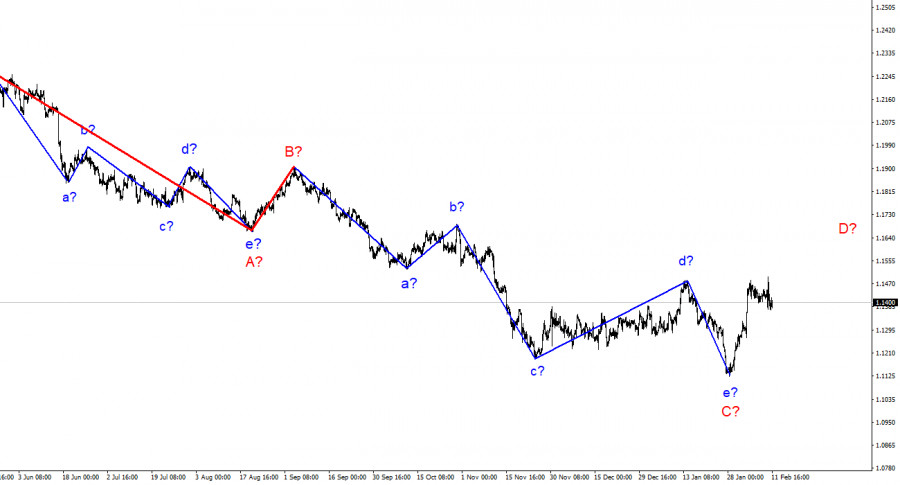
The wave marking of the 4-hour chart for the euro/dollar instrument has undergone certain changes and now it no longer looks as unambiguous as before. Last week, there was a strong increase in quotes, so the wave e-C was recognized as completed. Therefore, the current upward wave is either D or 1. Attempts to break through the 1.1455 mark, which corresponds to 76.4% Fibonacci, were unsuccessful, which indicates the possible completion of the construction of an upward wave. The internal wave structure of this wave is quite complex. It can be interpreted as an unfinished wave D, or it can be interpreted as a completed wave D and the first waves as part of a new descending wave E. The US inflation report confused the cards, as the reaction to it was violent and did not quite fit into the current wave markup, which implied an increase in demand for the dollar. However, yesterday, the instrument grew quite a lot, and now the upward wave looks ambiguous. The wave marking is confused, there is hope for the 1.1455 mark. The euro/dollar instrument fell by 25 basis points on Friday and generally moved very weakly. The decline in the quotes of the instrument began yesterday evening after the instrument rose by 115 points from the low of the day. This is the reaction to the inflation report, which continues to accelerate in the US. Since the wave marking is now seriously confused, I consider the 1.1455 mark as the key one. Two unsuccessful breakout attempts indicate that the market is not ready for further purchases of the euro currency. And, in fairness, it should be noted that the news background now also does not speak in favor of the growth of the value of the euro currency. At the moment, almost everything rests on the monetary policy of the Fed and the ECB. And here everything remains unchanged, no matter what economic reports come out. The situation is aggravated for the euro currency by the fact that the European Commission lowered forecasts for economic growth for 2022 and raised the inflation forecast. And the ECB, in turn, has not given any signals about its readiness to raise rates this year. We get the following situation: the economy in the Eurozone will slow down, and inflation will grow even without an increase in the ECB interest rate. The ECB cannot raise the rate, as this will further slow down the European economy. There are no other methods of influencing inflation. The economy can only be stimulated by lowering rates or expanding the QE program. This year, the ECB plans to end the QE program to stop the growth of inflation. There is nowhere to lower rates further: they are already negative. A stalemate for the ECB. And with such a news background, the market is unlikely to increase demand for the euro currency. Therefore, I am waiting for the construction of a new downward wave E. General conclusions. Based on the analysis, I conclude that the construction of the descending wave C is completed. However, wave D can already be completed too. If so, now is a good time to sell the European currency. At least with a target located near the 1.1314 mark. Another upward wave can be built inside wave D. And if the current wave is recognized not as D, but as 1 as part of a new upward trend segment, then a successful attempt to break the 1.1455 mark should be made. Thus, now there are cautious sales based on MACD signals.
On a larger scale, it can be seen that the construction of the proposed D wave has now begun. This wave can be shortened or three-wave. Considering that all the previous waves were not too large and approximately the same in size, the same can be expected from the current wave. There are reasons to assume that wave D has already been completed, but a further increase in quotes will force us to reconsider this assumption. The material has been provided by InstaForex Company - www.instaforex.com |
| US imminent all-consuming inflation is most important help for buying bitcoin Posted: 11 Feb 2022 09:19 AM PST
The upcoming all-consuming inflation in the United States of America is the most important help for buying bitcoin now. Crypto enthusiasts still consider Bitcoin the most powerful inflation hedge against fiat money. Digifox founder Nicholas Merten is sure that inflation will be huge. He believes that within 3 years the dollar can cost 2 times less, and this is only with emerging inflation. The US Bureau of Labor Statistics in its latest statement reported a 70% increase in the consumer price index (CPI). The producer price index (PPI) is the most widely used indicator of inflation. With this development, the rising CPI, as well as the panic on the world stage, now is the best entry point to buy bitcoin. Bitcoin is the gold of the 21st century and now is the last opportunity to buy it to secure your hard-earned funds. Binance CEO Changpeng Zhao, aka CZ, also noted that during the upcoming inflation, only Binance Coin and Bitcoin will not be affected by it. Another well-known crypto investor and Bitcoin whale Anthony Pompliano is sure that Bitcoin is the best investment. Pompliano quoted the famous American economist Milton Friedman as saying, "Inflation is taxation without legislation." And during major inflations, the price of fiat falls as supply rises. Bitcoin is the only lifeline as it is the best hedge asset against inflation due to the limited number of bitcoins, namely 18.9 million in circulation. The material has been provided by InstaForex Company - www.instaforex.com |
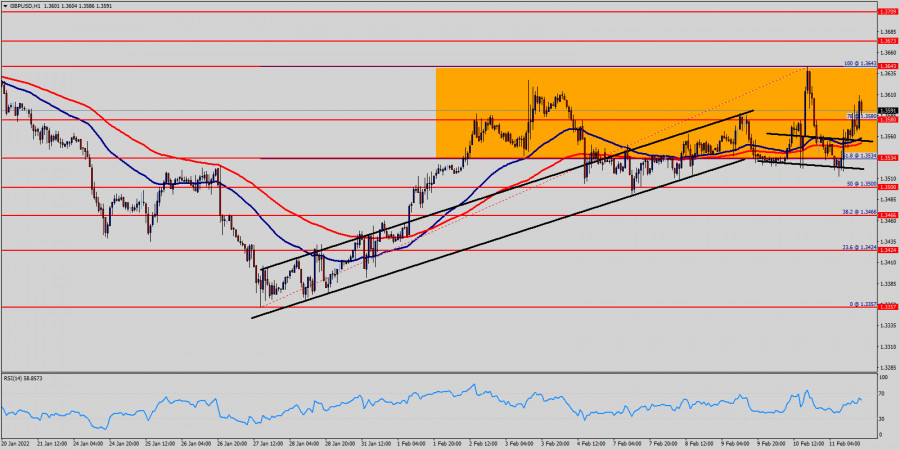
| Technical analysis of GBP/USD for February 12, 2022 Posted: 11 Feb 2022 09:17 AM PST
The GBP/USD pair is going to continue to rise from the level of 1.3580 in the long term. It should be noted that the support is established at the level of 1.3534 which represents the 61.8% Fibonacci retracement level on the H1 chart. It should be noted that volatility is very high for that the GBP/USD pair is still moving between 1.3540 and 1.3673 in coming hours. Furthermore, the price has been set above the strong support at the levels of 1.3534 and 1.3580, which coincides with the 61.8% and 78% Fibonacci retracement level respectively. Consequently, the first support is set at the level of 1.3580 (horizontal green red). The price is likely to form a double bottom in the same time frame. Accordingly, the GBP/USD pair is showing signs of strength following a breakout of the highest level of 1.3580. So, buy above the level of 1.3580 with the first target at 1.3643 in order to test the daily resistance 1 and further to 1.3673. Also, it might be noted that the level of 1.3673 is a good place to take profit because it will form a new double top. On the other hand, in case a reversal takes place and the GBP/USD pair breaks through the support level of 1.3534, a further decline to 1.3466 can occur which would indicate a bearish market. The material has been provided by InstaForex Company - www.instaforex.com |
| Bitcoin hits monthly high, prepares for a bullish breakout Posted: 11 Feb 2022 08:59 AM PST Bitcoin hit a monthly high for the second time in a week amid January reporting of rising inflation. Subsequently, the cryptocurrency rolled back to the local support zone and continued to accumulate volumes. Following BTC, the altcoin market also fell but judging by on-chain metrics and the general mood, the crypto market is completing the formation of a corrective structure in order to resume the upward movement. Over the past week, Bitcoin has touched the $45.9k resistance level twice. At the same time, the price feels confident at the local support level of $42.4k. Despite the presence of bullish momentum, BTC/USD quotes are increasingly being squeezed into a narrow area of $42.4k–$45.9k. Any squeeze entails going outside the range, and in order to complete the corrective structure, Bitcoin needs to make a downward exit outside the channel. We are still talking about the technical analysis figure of the inverted "head and shoulders," since as of February 11, this is the main signal for the upward movement of the cryptocurrency. In addition, a decline to the $40k-$42k area is necessary for Bitcoin to recover, as the main technical metrics are in the overbought zone. The stochastic oscillator continues to move above the green zone, which is a direct consequence of the local overheating of bitcoin. At the same time, it is important to note that the MACD continues to move in the green zone, and the RSI shows bullish signals around 60, which is the optimal mark for an upward movement. With this in mind, the conclusion suggests itself that BTC will keep the flat direction within the framework of consolidation, which will enable altcoins to catch up to key positions, before the price rise and Bitcoin dominance. Considering the scenario in which the asset moves flat, I want to highlight three main reasons for the approach of a powerful bullish momentum. The first reason is fundamental, and lies in the active actions of big capital. Over the past month and a half, institutional investors have accumulated $10 billion worth of BTC. Taking into account the price buy-off that has started, the consolidation stage is coming to an end.
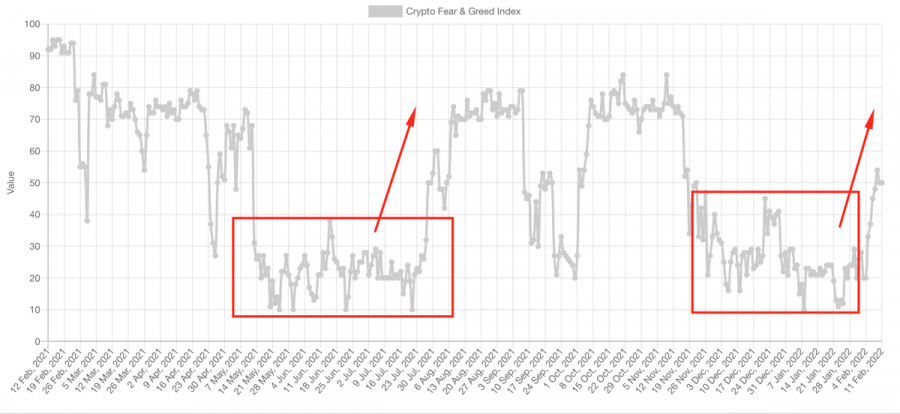
At the same time, the market is still scared, despite the neutrality of the index of fear and greed. This is expressed in the ratio of long and short positions, where the bears significantly dominate. Considering the behavior of the market with a large bias in one of the sides, a strong upward momentum awaits us, which will collect liquidity from the shortists in the $46k–$44k range. And the third reason for the approaching bullish momentum is the historical performance of the fear and greed index. Analyzing the movement of the metric in the summer of 2021, one can detect the achievement of the mark of extreme fear. We observed a similar picture in December-January. Now the metric has recovered to the level of 50, and according to the dynamics of the price movement of the index in the summer of 2021, we are waiting for a movement towards the greed area, and, accordingly, an increase in the price.
|
| Technical analysis of EUR/USD for February 12, 2022 Posted: 11 Feb 2022 08:43 AM PST
The trend of EUR/USD pair movement was controversial as it took place in a narrow sideways channel, the market showed signs of instability. Amid the previous events, the price is still moving between the levels of 1.1495 and 1.1362. Also, the daily resistance and support are seen at the levels of 1.1495 and 1.1362 respectively. Therefore, it is recommended to be cautious while placing orders in this area. Thus, we need to wait until the sideways channel has completed. Yesterday, the market moved from its top at 1.1495 and continued to drop towards the bottom of 1.1370. Today, in the one-hour chart, the current rise will remain within a framework of correction. However, if the pair fails to pass through the level of 1.1495, the market will indicate a bearish opportunity below the strong resistance level of 1.1495 (the level of 1.1495 coincides with the double top too). Since there is nothing new in this market, it is not bullish yet. Sell deals are recommended below the level of 1.1495 with the first target at 1.1362. If the trend breaks the support level of 1.1362, the pair is likely to move downwards continuing the development of a bearish trend to the level 1.1321 in order to test the daily support 2 (horizontal red line). On the contrary, if a breakout takes place at the resistance level of 1.1495 (the double top), then this scenario may become invalidated. The material has been provided by InstaForex Company - www.instaforex.com |
| Jamaica plans to launch a digital currency Posted: 11 Feb 2022 08:38 AM PST The Prime Minister of Jamaica, Andrew Holness, posted a tweet that the country is moving to launch its electronic currency. The launch is scheduled for this year. "The Bank of Jamaica will issue our digital Jamaican dollar in 2022 after a successful pilot project in 2021," the Prime Minister wrote, repeating a speech delivered by the Governor-General of the island. Jamaica plans to launch a digital currency "This will serve as the basis for the digital payments architecture of Jamaica and will contribute to expanding access to financial services, increasing the speed of transactions while reducing the cost of banking services for Jamaicans," Holness believes. In January, Holness shared the news that the introduction of the central bank's digital currency, or CBDC, will occur in the first quarter of 2022, but the exact date has not yet been set. In this rush of digitalization, Jamaica joins the Bahamas and the Eastern Caribbean Central Bank in creating digital fiat money. Unlike decentralized cryptocurrencies such as bitcoin and ether, CBDCs are government-backed digital versions of the local currency. Of course, electronic fiat currencies lack many advantages of tokens, but their format can still speed up calculations, thereby bringing an additional bonus to the country's economy. There remains the issue of cyber-reliability of stored funds, and here, it seems, the Central Banks of individual countries are only at the beginning of their journey. The material has been provided by InstaForex Company - www.instaforex.com |
| Crypto paychecks gain favor among employees, says Deel Posted: 11 Feb 2022 08:37 AM PST According to global payrolls and hiring company Deel, employees around the world prefer to be paid in cryptocurrencies, although they are still a small minority, a research report notes. |
| India is the next major electric car market Posted: 11 Feb 2022 07:33 AM PST Ford Motor Co said on Friday it was exploring the possibility of using one of its factories in India to produce electric vehicles for export. Most recently, the American automaker announced that it would stop selling cars in India. India is the next major electric car market Last year, Ford stopped selling in the domestic Indian market but retained two of its plants in the country.
The automaker did not allow idle production facilities and applied for incentives under an Indian scheme worth $ 3.5 billion for clean-fuel vehicles. Their proposal has been approved by the government, the company said in its latest message. The Indian government has confirmed the news. Ford Motor Co, Suzuki Motor Corp, and Hyundai Motor will be among the twenty companies that will be eligible for benefits under the $ 3.5 billion Indian scheme to stimulate the production of environmentally-friendly vehicles. Last year, the federal cabinet approved a plan according to which the automotive sector will be granted benefits for five years to increase the production of electric vehicles and vehicles powered by hydrogen fuel and their components. The scheme is also part of Prime Minister Narendra Modi's government plan to reduce fuel import costs and reduce pollution by encouraging local production of environmentally friendly cars. The Ministry of Heavy Industry said it had approved applications from 20 companies, including Kia Motors, Tata Motors, Mahindra & Mahindra, and Softbank-Group. Tata Motors said it intends to "shape India's automotive landscape with intelligent and sustainable mobility solutions." Suzuki, Hyundai, Kia, Mahindra, and Ola did not immediately respond to a request for comment. A total of 115 automakers and auto parts manufacturers have applied for benefits. The government will announce the final list of manufacturers of automotive components later. Incentives will range from 8% to 18% of the sale value of cars or components and will be given to companies if they meet certain conditions, such as minimum investment for five years and 10% sales growth each year. Well, this makes some sense. Electricity in India is still relatively cheap. This makes electric cars an attractive means of transportation for Indians, especially against the backdrop of rising fuel prices around the world. Recall that Ford decided to stop selling cars in India last year due to the low demand for vehicles provoked by the pandemic. Electric cars by themselves occupy only a small part of the Indian car market, and with a wide drop in sales throughout the industry, production has become unprofitable for many large concerns. Nevertheless, automakers seem to have weighed the risks of the omicron strain, planning an early economic recovery, and accordingly, demand for their products. In addition, benefits from the government under this program serve as an additional incentive. From the point of view of investors, government contracts have always been the basis for the stability of company stock prices, so if you choose players within the sector, it makes sense to pay attention to these companies, which are already actively expanding their market shares. In addition, the infrastructure serving electric vehicles will also develop, which means that new money will flow to India. The material has been provided by InstaForex Company - www.instaforex.com |
| Posted: 11 Feb 2022 07:26 AM PST
Dow Jones-30 Industrial Average (#INDU) is bouncing after reaching the key support of 35,000 points that represents the psychological level. In the next few hours,the index is likely to continue its upward movement towards the 200 EMA located at 35,352 or towards the 21 SMA at 35,447. Inflation data from the United States put downward pressure on the stock market, registering negative numbers in all the Wall Street indices. In the medium term, the Dow Jones index is expected to continue its downward movement so that it could fall to the level of 34,000 points. In the short term, we expect a pullback towards the level of 35,352 in the next few hours to sell with targets at the psychological level of 35,000 and towards 4/8 Murray located at 34,375. On February 11, the eagle indicator has reached the 95-point zone, which represents an extremely overbought level. It is likely that will be a technical rebound in the next few hours to resume its downward movement. Our trading plan is to buy the Dow Jones-30 at current levels as long as it remains above 35,000 points. An alternative scenario is to wait for a pullback towards the 200 EMA at 35,352 to sell with targets towards 4/8 Murray at 34,375. Support and Resistance Levels for February 11 - 14, 2022 Resistance (3) 35,937 Resistance (2) 35,709 Resistance (1) 35,394 ---------------------------- Support (1) 34,932 Support (2) 34,637 Support (3) 34,375 *********************************************************** Scenario Timeframe H4 Recommendation: Buy above Entry Point 35,000 Take Profit 35,156; 35,352 Stop Loss 34,920 Murray Levels 35,937 (6/8), 35,156(5/8), 34,375 (4/8), 33,593 (3/8) Alternative scenario Timeframe H4 Recommendation: sell if it pullback Entry Point 35,352 Take Profit 35,000; 34,375 Stop Loss 35,450 *************************************************************************** The material has been provided by InstaForex Company - www.instaforex.com |
| EUR/USD: Dollar strengthens amid Christine Lagarde's statements Posted: 11 Feb 2022 06:58 AM PST
High inflation demands the Fed and the ECB to take a tougher stance, fighting rising prices Currently, interest rate hikes by more than 160 basis points in the US and by 50 basis points in the EU are expected by the end of the year. The ECB last raised interest rates in 2011 at the height of the supply shock and debt crisis, which is now considered a political mistake. As for the Fed, it is trying to avoid a repeat of the so-called 2013 tantrum, then widely seen as a communication error. Investors express concerns about the prospect of tighter Fed's policy. Besides, it has led to rising government bond yields and declining stock prices in the United States. Since the beginning of 2022, the yield on 10-year Treasuries has jumped more than 35% and the S&P 500 Index has lost about 5%. The day before, the 10-year Treasury yield reached 2%, the highest level in two and a half years. However, the broad market index fell by 1.8% due to unfavourable statistics, indicating a new 40-year record of inflation, which jumped in January to 7.5% with the forecast of 7.3%. At the same time, consumer prices rose by 0.6% last month. Higher food prices (+0.8% month-on-month, 6.7% year-on-year) and services (+0.6% month-on-month, +4.6% year-on-year) contributed significantly to the acceleration of inflation in January. This suggests that inflation is increasingly spreading deeper into the economy, forcing investors to further revise their portfolios to account for the Fed action, which could be more aggressive. Markets now estimate a 94% chance of a 50 basis point increase in the federal funds rate in March, compared to 33.7% a week ago.
Earlier, Fed policymakers have largely resisted the idea of a half-point rate hike, which they have not used since May 2000. St. Louis Fed Chairman James Bullard believes such a move would be a reasonable response to an unexpected inflation shock. Strategists at Societe Generale said that the strong January inflation report again underscored the need for urgent action by the Fed. They added that the market was beginning to assess a much more aggressive way of rate hikes. Experts at BofA Global Research, who said they backed the Fed's hawkish call to raise rates seven times this year, shared the same view. They said that the January consumer price index report was another wake-up call for the US central bank. Specialists noted that inflation was increasingly widespread in the US. Some experts, however, believe the Fed will maintain its gradual approach to tightening monetary policy despite higher-than-expected inflation. RBC Capital Markets officials said that they hoped that the Fed's response function was not so sensitive to these kinds of mistakes due to rising inflation. According to BlackRock experts, the Fed needs to adjust its policy quickly, but not necessarily too much in the aggregate amount, as it would create significant risk for the markets and the economy. They said that the Fed had to aggressively move policy away from overly favorable conditions. Experts noted that implementing that turnaround would be a real challenge for FOMC officials.
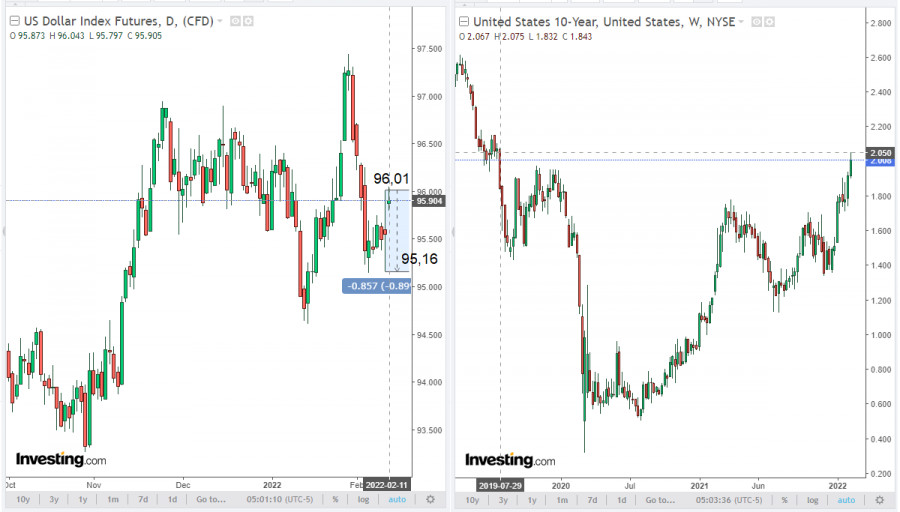
Richmond Fed President Thomas Barkin said on Thursday that they would focus on the outcome by March. Moreover, he stressed that he would have to be confident if he decided to raise the interest rate by 50 basis points. National Securities analysts believe high volatility in the US stock market is likely to persist until the Fed's March meeting, and traders will calm down when the regulator proceeds with a rate hike and outlines its future plans in detail. Henderson Investors said that the upward inflation trend was currently causing concern in the stock market as it could indicate a more aggressive Fed's policy. They reported that markets might remain volatile in the coming months until either inflation stabilized or the market became convinced that the Fed was taking the necessary measures. The current market environment is likely to be favourable for the dollar. The greenback outperformed its major rivals on Thursday amid falling stock indices and rising treasury yields. Meanwhile, the EUR/USD quickly lost its positive momentum after reaching a three-month high at 1.1494 and ended yesterday's trading near 1.1430. The renewed strength of the greenback ahead of the weekend continues to put pressure on the pair and it is trying to overcome bearish trend on Friday, trading just below 1.1400. The USD index has been rising for the second session in a row, though a strong move above 96.00 looks strange to the dollar bulls. The levels of 97.44 (high of 2022 on January 28) and 97.80 (high of June 30, 2020) are further north. Higher-than-expected US inflation for January allowed the greenback to strengthen, but not as much as might have been expected. Experts think the reason for it was an extremely aggressive bullish positioning by large speculators in US currency futures. According to the Commodity Futures Trading Commission (CFTC), last week it declined slightly, but still remains in the area of two-year highs and does not allow the dollar to grow strongly. Moreover, the Commonwealth Bank of Australia authorities noted that not only the Fed's policy was hawkish. CBA strategists said that at least some FOMC members were focused on urgency. They added that the Fed was not the only central bank facing that inflationary conundrum. CBA strategists believe last week's hawkish turnaround at the ECB could limit the dollar's rise, eliminating risks for the euro. Following the ECB's January meeting, its head Christine Lagarde acknowledged inflation risks and refused to rule out a rate hike this year. Informed sources told Reuters that some members of the ECB's Governing Council had planned to make policy changes at the previous week's meeting.
However, this week the ECB officials tried to ease market expectations that the regulator would soon stop buying bonds and raise interest rates by 50 basis points in the eurozone by December. ECB Chief Economist Philip Lane said on Thursday that inflation in the eurozone would weaken without significant ECB policy tightening as pandemic-related bottlenecks in goods as well as labor were removed. He reported that as the bottlenecks would be resolved, price pressures should ease and inflation should return to its trend without the need for a substantial adjustment in monetary policy. Lane added that monetary policy drove domestic demand, tightening it in response to an external supply shock would mean that the economy would face two adverse shocks at the same time. ECB President Christine Lagarde said on Friday that raising the ECB's key interest rate at that stage would not reduce record high inflation in the eurozone and would only hurt the economy. She stressed that raising interest rates would not solve any of the current problems. Lagarde was confident that inflation would decline in 2022. She added that they were closer to target levels, enabling them to phase out some monetary measures. Lagarde stated that they did not want to hamper economic recovery. Lagarde's comments, along with the continued strengthening of the dollar, put pressure on the EUR/USD pair. As long as the pair remains below 1.1400, it could continue to fall to 1.1350. Below that level, support is at 1.1320 and 1.1300. Rabobank experts believe the market was likely to be too aggressive in pricing in ECB policy tightening in a one-year perspective. Besides, it makes the euro vulnerable, especially if the market starts to revise its estimates. The bank officials stated that long positions on the US currency were likely to continue to limit the upside potential of the dollar in the coming months. However, they noted that the US inflation cycle was much stronger than in the eurozone and they did not expect the dollar's bullish trend to end. Rabobank experts added that they had predicted that the EUR/USD pair would fall to 1,000 by mid-year when the Fed's policy tightening began. But they moderately revised that forecast to 1,1100 amid the ECB's hawkish policy change, and put the euro's recovery into their medium-term forecasts. Currently, experts forecasted EUR/USD at 1.1500 for the year compared to their previous forecast of 1.1200. The material has been provided by InstaForex Company - www.instaforex.com |
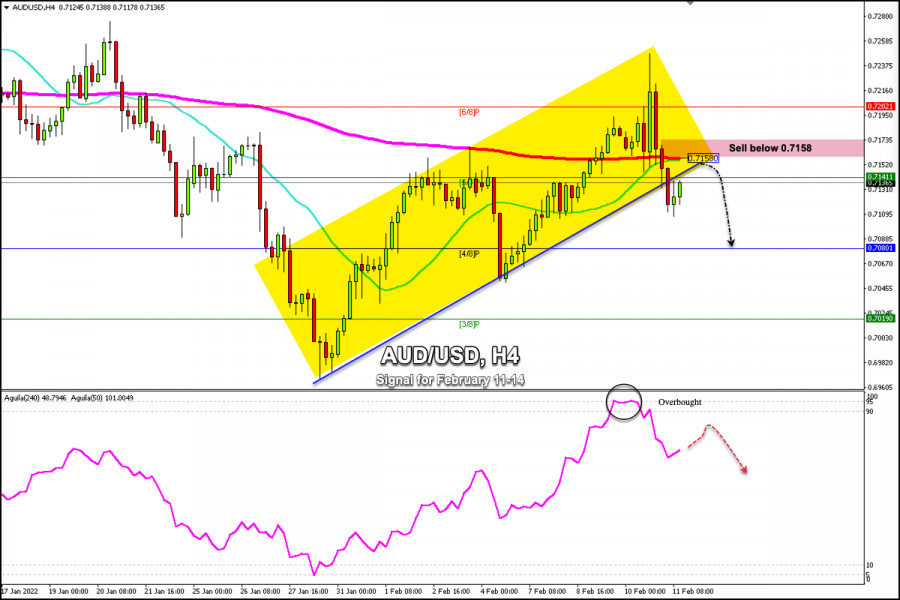
| Trading signals for AUD/USD on February 11-14, 2022: sell below 0.7158 (21 SMA - 200 EMA) Posted: 11 Feb 2022 06:32 AM PST
AUD/USD pair is trading just below the level 0.7158 (200 EMA) after reaching a low of 0.7108 in the European session. The US Consumer Price Index (CPI) increased more than expected in January, reaching the strongest level of 7.5% in five decades. This data gave strong volatility to the Australian dollar reaching the high of 0.7247. Currently, we can see that the AUD has broken the uptrend channel and is bouncing towards the resistance zone of 200 EMA and 21 SMA which has now become a strong resistance. If the Aussie consolidates below the 200 EMA in the next few hours, it could resume its bearish move towards the support 4/8 Murray at 0.7080. Conversely, a daily close above 0.7170 could continue its uptrend towards 6/8 Murray and up to yesterday's high of 0.7247. The technical reading of the eagle indicator shows that it has reached the overbought level in the zone 95-point. This is a clear sign that the AUD/USD pair could have a correction in the coming days towards the psychological level of 0.70. Our trading plan for the next few hours is to wait for a pullback towards 0.7158 and a consolidation below this level to sell. Targets will be at 0.7081 (4/8) and 0.7019 (3/8). The eagle indicator supports our bearish strategy. Support and Resistance Levels for February 11 - 14, 2022 Resistance (3) 0.7256 Resistance (2) 0.7202 Resistance (1) 0.7165 ---------------------------- Support (1) 0.7125 Support (2) 0.7075 Support (3) 0.7019 *********************************************************** Scenario Timeframe H4 Recommendation: sell below Entry Point 0.7158 Take Profit 0.7080; 0.7019 Stop Loss 0.7195 Murray Levels 0.7202(6/8), 0,7141(5/8), 0.7080 (4/8), 0.7019 (3/8) *************************************************************************** The material has been provided by InstaForex Company - www.instaforex.com |
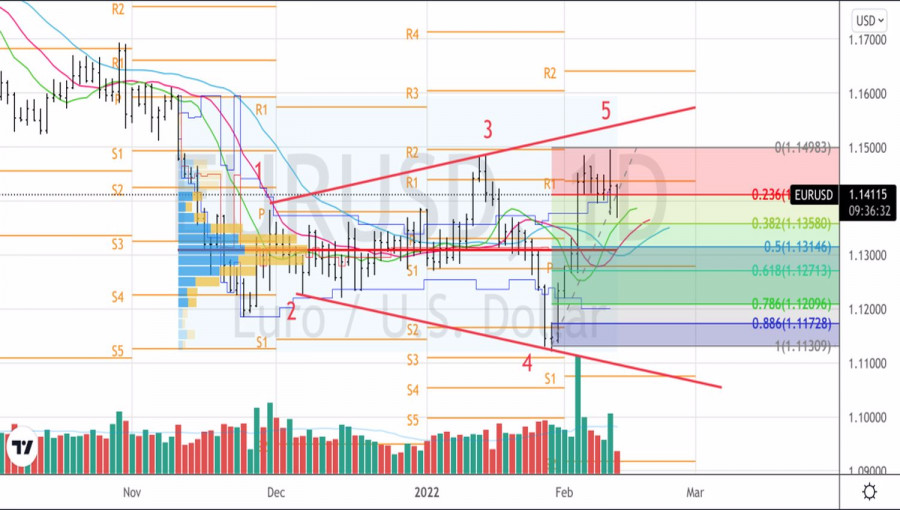
| Posted: 11 Feb 2022 06:27 AM PST Despite the turmoil caused by the release of data on US employment and the labor market, Forex continues to discuss the "hawkish" shift of the European Central Bank. ECB President Christine Lagarde has received a lot of criticism. Allegedly, she went along with a small minority of supporters of monetary tightening, which her predecessor, Mario Draghi, would never have allowed. The European Central Bank is allegedly at risk of making another political mistake, as in 2011, when a debt crisis erupted in the eurozone after raising rates. Whatever it was, the "bulls" on EURUSD saw a red rag in front of their noses, which allowed the euro to resist the pressure of impressive data from the US. Lagarde's speeches following the February meeting of the Governing Council are more like excuses. First, she said that the ECB intends to act gradually, then she said that a premature tightening of monetary policy could undermine the recovery of the monetary bloc's GDP. Unlike the US economy, the eurozone is far from overheating, so the European Central Bank may not be in a hurry to make decisions. All this, of course, is true, but the situation is now fundamentally different from the one that took place in 2011, when the ECB, by raising rates, provoked a sharp increase in bond yields in the euro area. Eurozone debt market reaction to ECB monetary tightening
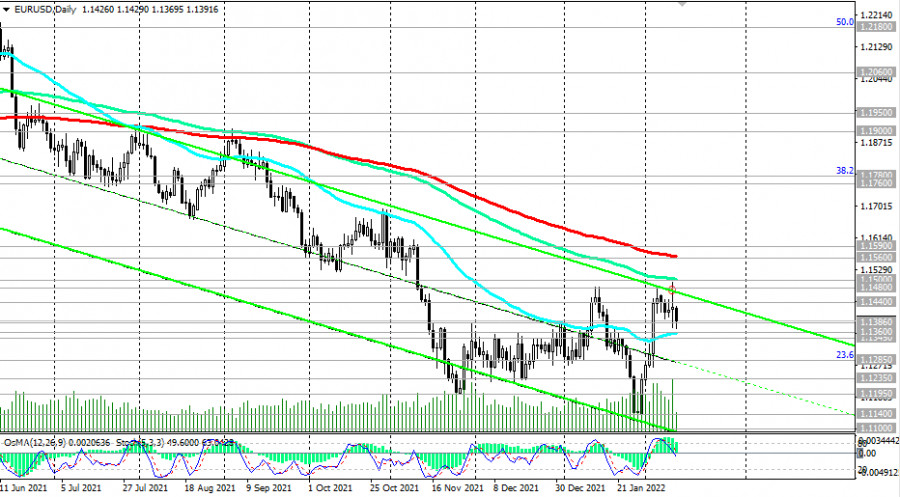
Take, for example, Italy, which seems to be almost a powder keg in the event of the start of the process of monetary restriction. Its public debt-to-GDP ratio has indeed risen from 130% to 150% due to the pandemic, but if we discard all the bonds held by the Eurosystem, it will return to levels seen during the 2012 crisis. Thanks to ultra-low debt rates, Rome pays for them record low amounts. At the same time, according to the analysis of Nordea Markets, even the growth of 7-year yields by 60 basis points will not increase borrowing costs. Italy is now much more prepared to tighten its monetary policy than before. Of course, the Fed with its 6 or 7 monetary restrictions, which the derivatives market and Goldman Sachs are talking about, looks intimidating. Expectations of a rise in the federal funds rate to 1.75%–2% by the end of 2022 have already triggered a rally in the yield of 10-year US Treasury bonds to the highest level since August 2019. Nevertheless, many bullish factors for the US dollar are already in price. In order to be convinced of this, it is enough to look at the reaction of EURUSD to the American statistics. Wouldn't an unexpected rise in non-agricultural employment of more than 400,000 and inflation of up to 7.5% under normal conditions lead to the capitulation of the bulls? In reality, the market simply sold the fact, and the euro continued to trade near 1.14. Technically, the Expanding Wedge pattern is still active on the EURUSD daily chart. Point 5 has finally formed, and now the inability of the "bears" to storm the support at 1.1412, 1.136, and 1.1315 will be a sign of their weakness and the basis for buying the pair. EURUSD, Daily chart
|
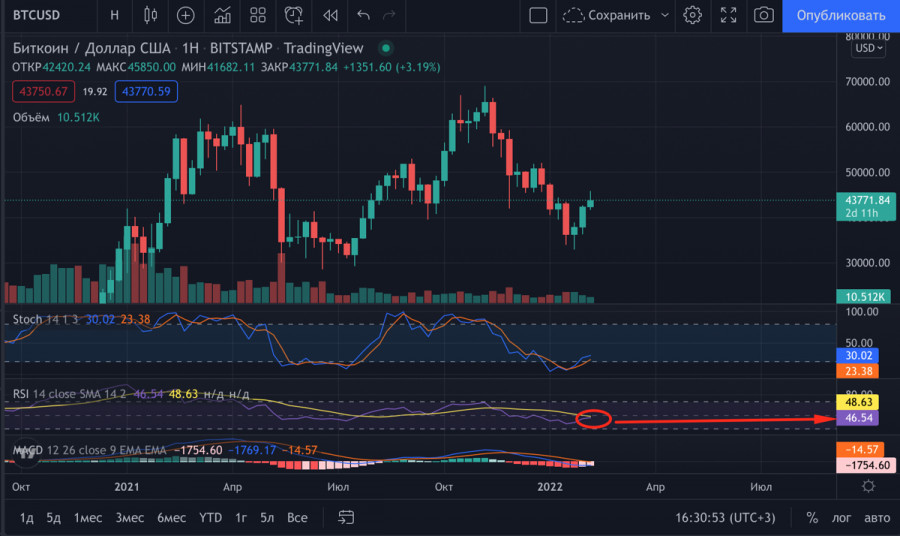
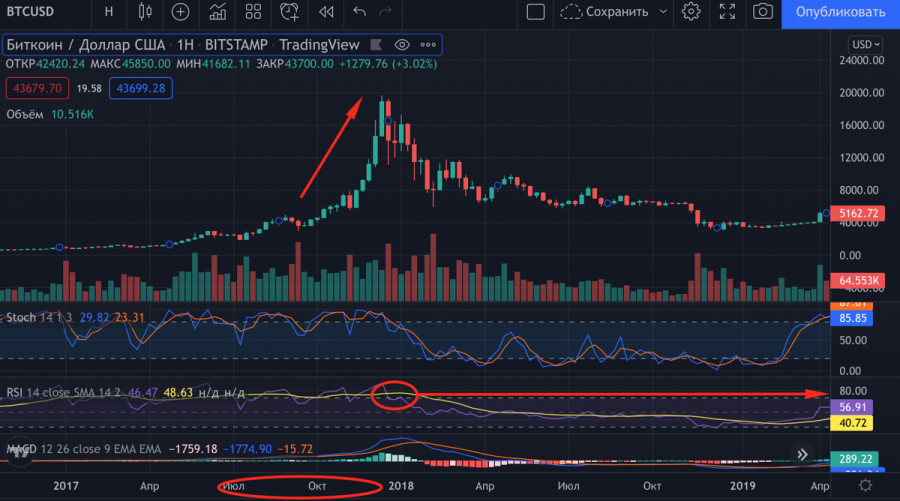
| Bitcoin not to set new record in 2022 due to Fed's policy? Posted: 11 Feb 2022 06:16 AM PST A month ago, the cryptocurrency market was shocked as bitcoin dropped below $35,000. Currently, the asset is trading around $44,000, and investors have resumed active trading in the digital coin. Despite this fact, the cryptocurrency community is confident that 2022 will be a challenging year for the cryptocurrency industry. Apart from widespread regulation of local markets by states, investors are concerned about the Fed's policy. The biggest increase in inflation in 30 years has forced the Fed to roll back its stimulus program. The regulator is also planning to raise its key interest rate to reduce inflation. Stock markets had expected such a statement from the Fed, however, reacted by falling. The Fed's next meeting and first rate hike is scheduled for spring 2022. This suggests that risky assets have little time to recover. The Fed's policy tightening will provoke an outflow of investment from high-risk industries and increase volatility. A similar view was expressed by CEO of Prosper Trading Academy Scott Bauer. The entrepreneur believes that bitcoin's price movement will depend on the US monetary policy and inflation growth. However, Bauer rules out that the cryptocurrency will manage to reach a new all-time record and will fluctuate within the range of $30,000-$50,000 in 2022. If Bauer's position is considered from a technical point of view, cryptocurrency's weekly time frame can be analyzed. On the 1W chart, the upward trend of BTC/USD quotes movement is broken. Moreover, the RSI technical indicator is at 46 points, indicating a bear market. For example, let's compare the index during the bull market in 2017. At that time, the metric did not fall below 60, which corresponds to a bullish trend.
This assumption may be true if the cryptocurrency has completed a five-wave growth pattern. In that case, the current bull cycle has already set a historical high at $69,000. Besides, bitcoin's recovery movement can be considered a common flat movement over a wide range of $30,000-$50,000.
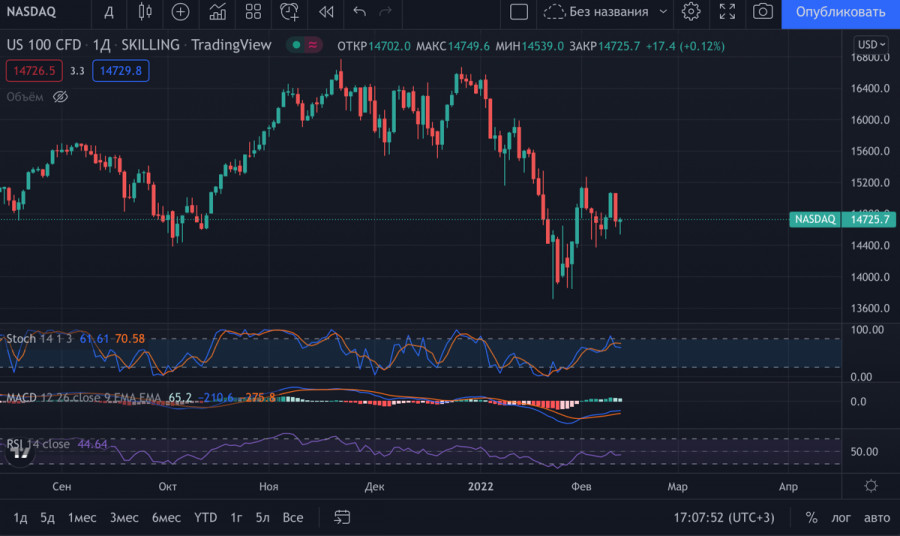
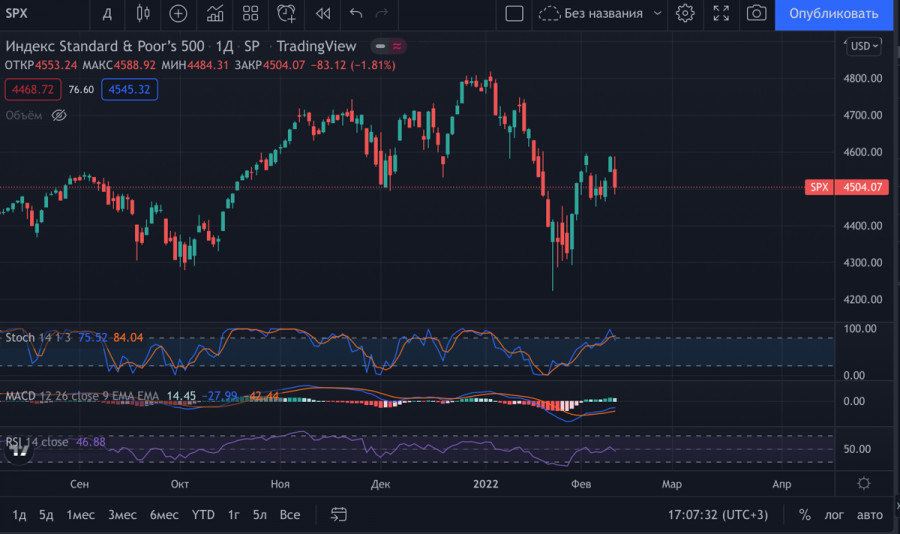
Experts at JPMorgan expressed a similar view, based on the fact that bitcoin has become closer to classic financial instruments. The bank's officials cited the drop in BTC quotes following the NASDAQ and SPX as evidence of dependence on technology companies. The increased correlation with these indices makes cryptocurrency more sensitive to the Fed's policy and risky investments. Therefore, JPMorgan believes that the cryptocurrency industry and specifically bitcoin will face periods of increased volatility due to monetary policy normalization.
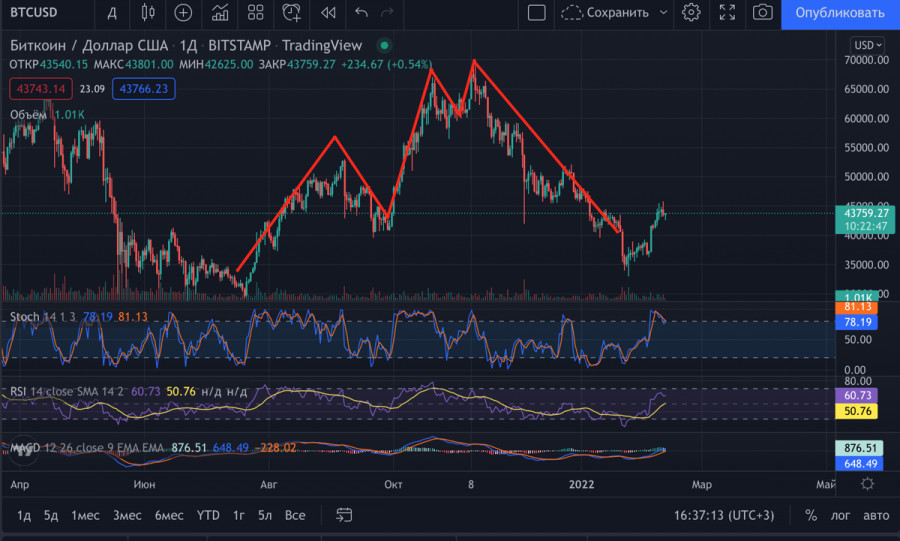
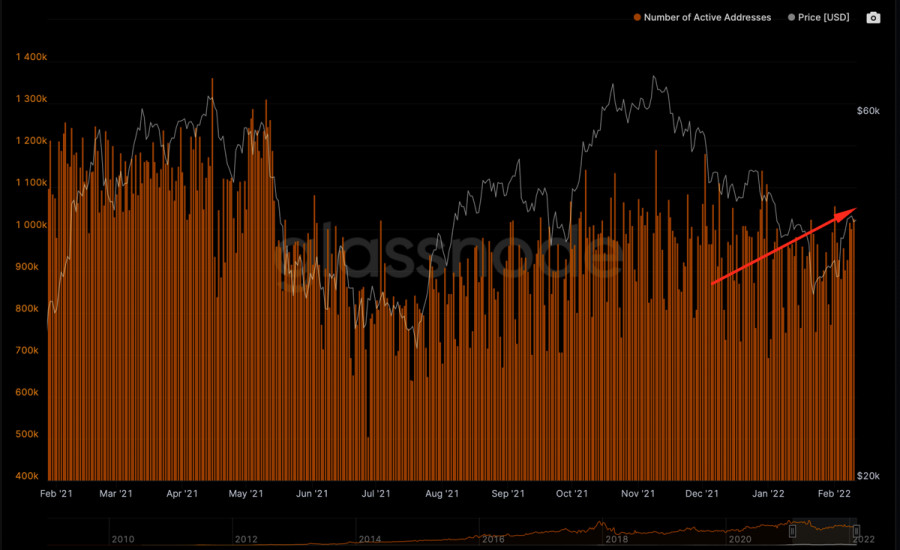
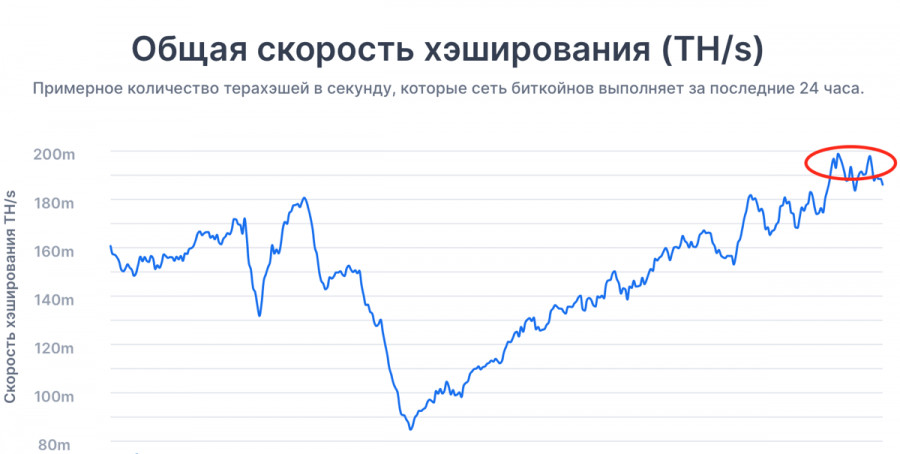
Despite pessimistic forecasts, BTC is likely to be within a recovery period and a formation of the final fifth wave of growth. This scenario is relevant in case the fourth bearish wave had a complex two-level corrective structure. The positive scenario is confirmed by statistical data. Santiment reported that addresses with balances from 1000 BTC had accumulated 220,000 digital coins during 1.5 months of correction. The cryptocurrency's hashrate is setting new performance records, and large companies are accumulating investment volumes.
Moreover, the figures of technical analysis indicate the potential of BTC price movement at least to the area of $56,000. The number of active addresses continues to grow and the number of coins held by "weak hands" has reached a minimum, which suggests that the probability of panic selling is decreasing. All these factors indicate that the major cryptocurrency will manage to set a new historical record before the next Fed meeting.
|
| Data on inflation in the United States collapsed the cryptocurrency market Posted: 11 Feb 2022 05:50 AM PST On Friday, the value of the main virtual asset has already lost more than $ 2,000 from Thursday's maximum figures. Currently, the BTC is trading at $43,518. According to the statistics of the popular Internet platform CoinGecko, which fixes prices for virtual assets, the capitalization of bitcoin is $ 821 billion. The decline of Bitcoin occurs simultaneously with the fall of risky assets against the background of the publication of data on the record level of inflation in the United States since 1982. In addition, investors in the crypto market are concerned about the prospects of an increase in the base interest rate by the US Federal Reserve sooner than expected.
During the trading session the day before, the behavior of the BTC was characterized by high volatility. So, at the beginning of the day, digital gold soared to the highs of a month ago - above $ 45,800 but later began to decline sharply along with the key indices of the US stock market. Bitcoin showed the maximum correlation about the American stock index S & P 500. The leading altcoins of the crypto market willingly adopted the trend of the main virtual asset and began to decline spectacularly, so at the time of writing, the XRP and Solana coins had already lost more than 6% of their value over the past 24 hours. Despite this, altcoin XRP is still trading 32% higher than a week ago - at $ 0.8146. A drop of the token below $ 0.78 will be an incentive for a deeper correction, which can quickly push XRP back to the round level of $ 0.75. If the value of the altcoin turns out to be below the $ 0.60 mark, in the near future the coin risks collapsing by 50% - up to $ 0.3. As for the forecasts of crypto experts regarding Solana, things are even worse here. Analysts are confident that without strong positive news for the global virtual asset market, Solana will continue to decline in price even faster than BTC and other leading cryptocurrencies. The unpredictable behavior of the digital coin market forces experts to make the most unexpected predictions about its future. On the eve of the chief strategist of the financial company, Stifel Financial Corp. Barry Bannister said that in 2023 Bitcoin risks collapsing to $ 10,000 against the backdrop of decisive steps by the US Federal Reserve. Bannister argues that traditionally, against the background of the weak monetary policy of the Federal Reserve, the BTC is growing. When the regulator's policy is tightened - the value of digital gold falls. At the same time, the expert is confident that the March tightening of the Fed's monetary policy will have a negligible effect on the crypto market in 2022. However, next year, Bannister believes, the Fed may go too far - stimulate bearish sentiment in the markets to provoke a collapse of bitcoin. The material has been provided by InstaForex Company - www.instaforex.com |
| EUR/USD: Who will cope faster with inflation, the Fed or the ECB? Posted: 11 Feb 2022 05:27 AM PST Markets reacted quite violently to yesterday's publication of inflationary indicators for the US. Immediately after it, the dollar strengthened sharply, but then moved to a decline. With intraday volatility of 85 points, the DXY dollar index returned to its opening levels by the end of yesterday's trading day, and the yield on 10-year US government bonds reached a new high yesterday since August 2019, exceeding 2.00%.
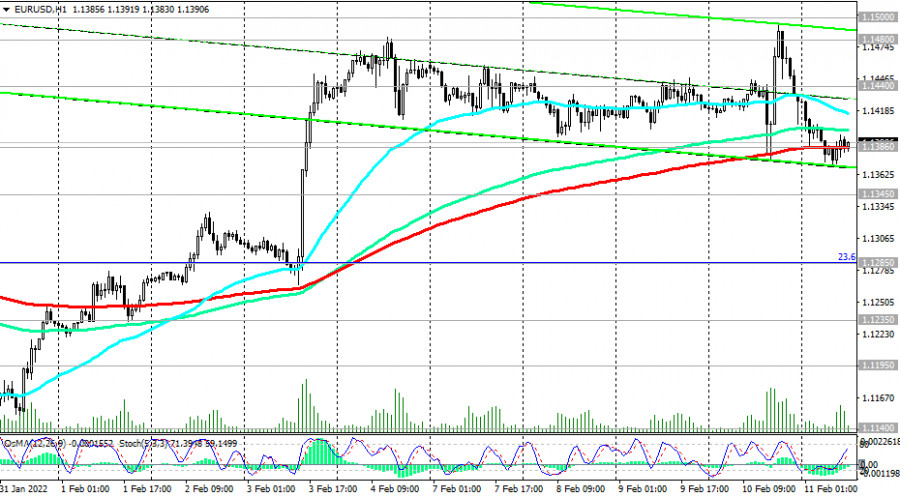
It is characteristic, however, that futures for the dollar index (DXY) opened today's trading day with a gap up, and futures for the main US stock indices again moved down. According to the US Department of Labor on Thursday, the consumer price index (CPI) in January rose by 0.6% and by 7.5% in annual terms. The data beat out forecasts that had expected a 7.2% YoY increase in CPI after rising 7.0% in December. This is the 8th month in a row that the annual inflation rate has exceeded 5%, nearly 4 times the Fed's target of 2%. The US inflation data released on Thursday, which may affect the pace and scale of the Fed's interest rate hike, has significantly increased market uncertainty. Along with the acceleration of inflation, investors' concern is growing that the Fed may not be able to cope with the rate of inflation, and this threatens hyperinflation, which can have a catastrophic effect on both the dollar and the prospects for the entire American economy. On the eve of yesterday's publication, two members of the Fed's leadership made statements regarding the prospects for the Fed's monetary policy. Cleveland Federal Reserve President Loretta Mester said that decisions on a new rate hike can be expected from any Fed meeting this year, but noted that if prices start to decline, the number of rate increases could be reduced. Atlanta Federal Reserve President Raphael Bostic also confirmed that he expects three or four rate hikes this year, and everything will depend on the market reaction to the actions of the central bank. Although both of them said that the first March increase is likely to be small (+0.25%), many economists suggest that the Fed will act more aggressively, and the March increase could be +0.50% or even +0.75%. Thus, as we noted above, after yesterday's publication of the CPI indices, the uncertainty on the market has increased. Still, many economists believe that the dollar has a lot of upside potential, especially against the currencies of countries whose central banks are unlikely to raise interest rates quickly. This primarily applies to the ECB. In January, annual inflation in the Eurozone was 5.1%, while inflation in the UK in December was 5.4%, and in the US 7%. The accelerating rise in inflation in the Eurozone seems to have come as a surprise to the ECB and fueled speculation that the ECB may be forced to hike interest rates sharply to curb inflation. Economists attribute higher inflation to crisis-related factors such as supply problems and significant price increases as a result of the economic recovery, as well as high energy prices. However, ECB President Christine Lagarde signaled earlier this week that there is a danger of tightening monetary policy too quickly even as Eurozone inflation remains high. Economists expect the ECB to make its first rate hike (by 25 basis points) in December. Pressure on the euro's position is also exerted by weak data released at the beginning of the week from Germany, whose economy is the locomotive of the entire European economy. According to these data, the volume of industrial production in December decreased by 0.3% (forecasts suggested an increase of 0.4%). In annual terms, the rate of decline in production accelerated from -2.2% to -4.1%, which also turned out to be worse than the forecast of a drop of -2.4%. Thus, the divergence of the curves that reflect the dynamics of the monetary policies of the Fed and the ECB will increase over time. And this is one of the most important factors in favor of further strengthening of the USD, if, of course, the Fed manages to quickly cope with accelerating inflation as a result of these actions. Today, market participants will pay attention to the publication (at 15:00 GMT) of the preliminary index of consumer confidence from the University of Michigan. This indicator reflects the confidence of American consumers in the economic development of the country. A high level indicates economic growth, while a low level indicates stagnation. Previous indicator values: 67.2 in January 2022, 70.6 in December, 67.4 in November, 71.7 in October, 72.8 in September 2021. An increase in the indicator will strengthen the USD, and a decrease in the value will weaken the dollar. The data shows uneven recovery of this indicator, which is negative for the USD. Data worse than previous values may have a negative impact on the dollar in the short term. However, the relative growth of the indicator (according to the forecast, the value of 67.5 is expected) should support the dollar quotes, including in the EUR/USD pair, which is trading near 1.1390 at the time of publication of this article, just above the important short-term support level of 1.1386. Its breakdown will be a signal for the resumption of short positions.
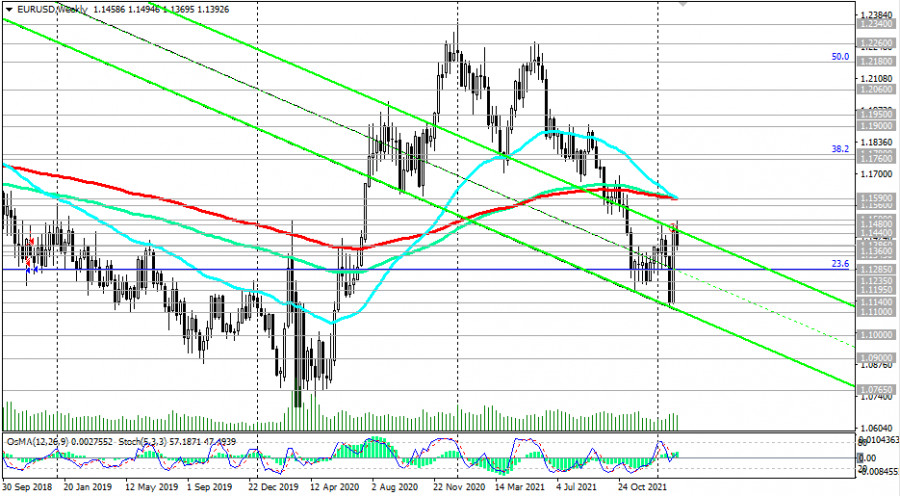
Technical analysis and trading recommendations EUR/USD failed to develop an upward trend above the resistance levels of 1.1480, 1.1500 (144 EMA on the daily chart). Today the pair is falling again, moving inside the descending channel on the daily chart. A sell signal will be a breakdown of the important short-term support level 1.1386 (200 EMA on the 1-hour chart). The immediate downside targets are at support levels 1.1360 (50 EMA on the daily chart), 1.1345 (200 EMA on the 4-hour chart).
Their breakdown will strengthen the downward dynamics and send EUR/USD towards 1.1140 (local and January lows), 1.1100 (lower limit of the downward channel on the weekly chart). In an alternative scenario, EUR/USD will again attempt to grow towards the key resistance levels of 1.1560 (200 EMA on the daily chart), 1.1590 (200 EMA on the weekly chart). In turn, their breakdown may return EUR/USD to the zone of a long-term bull market with the prospect of growth to the resistance levels of 1.1760 (200 EMA on the monthly chart), 1.1780 (38.2% Fibonacci level of the upward correction in the wave of the pair's decline from the level of 1.3870, which began in May 2014, to 1.0500).
In our main scenario, the growth of EUR/USD will still be limited by the resistance levels of 1.1500, 1.1560, 1.1590, while short positions remain preferable. Support levels: 1.1386, 1.1360, 1.1345, 1.1285, 1.1235, 1.1195, 1.1174, 1.1100, 1.1000, 1.0900, 1.0730 Resistance levels: 1.1440, 1.1480, 1.1500, 1.1560, 1.1590 Trading Recommendations Sell in the market. Stop Loss 1.1450. Take-Profit 1.1360, 1.1345, 1.1285, 1.1235, 1.1195, 1.1174, 1.1100, 1.1000, 1.0900, 1.0730 Buy Stop 1.1450. Stop Loss 1.1365. Take-Profit 1.1480, 1.1500, 1.1560, 1.1590 The material has been provided by InstaForex Company - www.instaforex.com |
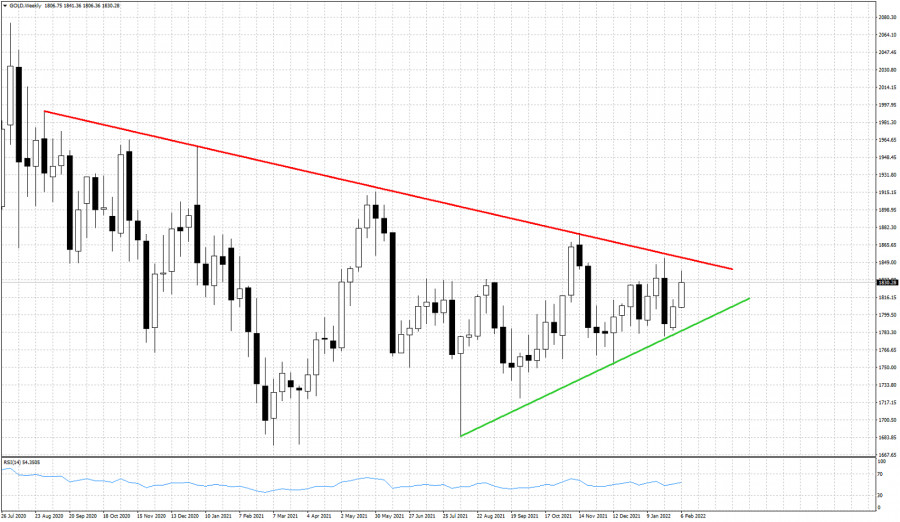
| Posted: 11 Feb 2022 05:26 AM PST Gold price is higher for the second week on a row. Price remains trapped inside the long-term triangle pattern. Short-term trend is bullish and as we mentioned in previous posts, Gold has potential to reach $1,860.
Green line - support Gold price is positive for the second week. Price is moving towards our $1,850-60 target where we also find the red downward sloping resistance trend line. As long as Gold is below $1,850-60, we remain cautious as another move back towards the green support line will be highly probable. On the contrary, inability to break above the red resistance trend line will lead to a move towards the green support. Short-term trend is controlled by bulls. Medium-term trend is neutral as there is no real progress with Gold price. The material has been provided by InstaForex Company - www.instaforex.com |
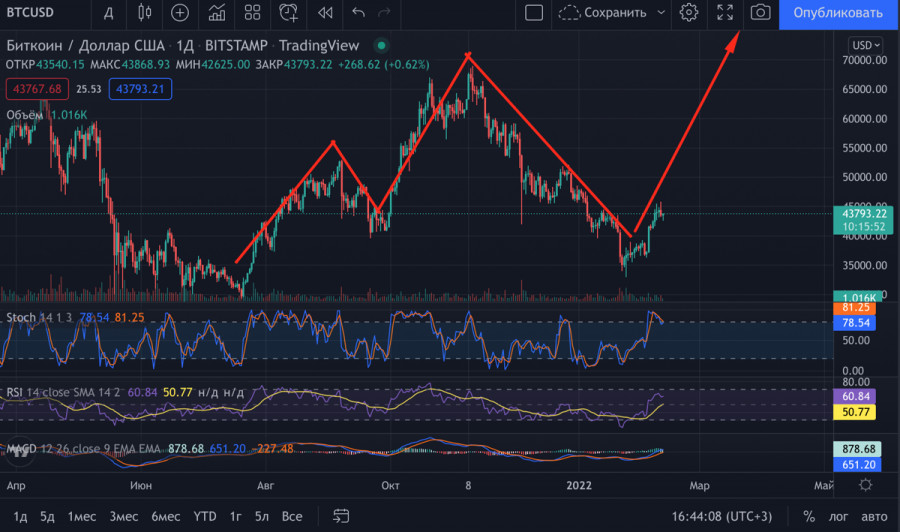
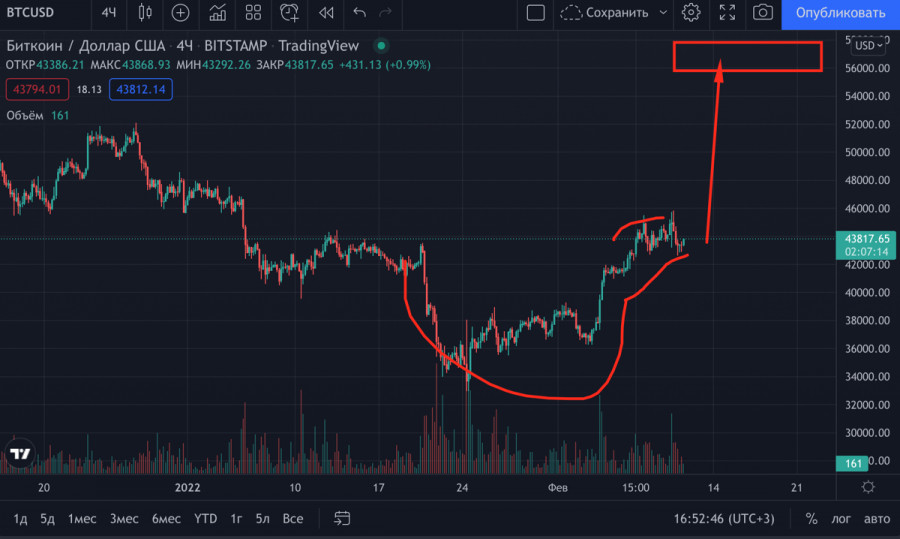
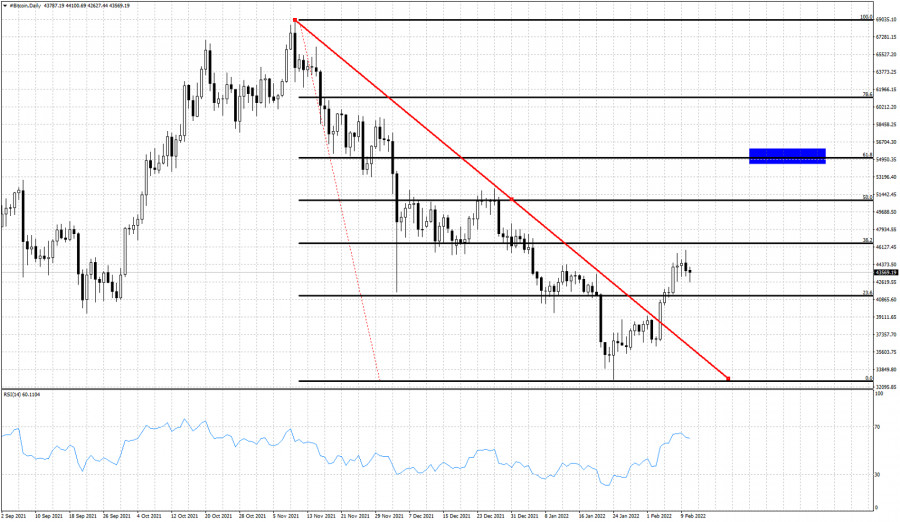
| Can Bitcoin continue higher towards $54,000? Posted: 11 Feb 2022 05:20 AM PST Bitcoin is currently trading just above $43,000. Bitcoin price has broken above the resistance trend line and is making higher highs and higher lows. Bitcoin has so far retraced 38% of the entire decline relative to its all time highs.
Black lines - Fibonacci retracements Blue rectangle -potential target Bitcoin has most probably completed the decline from its all time highs. Resistance is found at the 38% Fibonacci retracement at $46,550. Breaking above this level is key for the short-term trend in Bitcoin. Breaking above it, will give us a new bullish signal. The next upside target is at $54,000. The next big test for bulls is there. The material has been provided by InstaForex Company - www.instaforex.com |
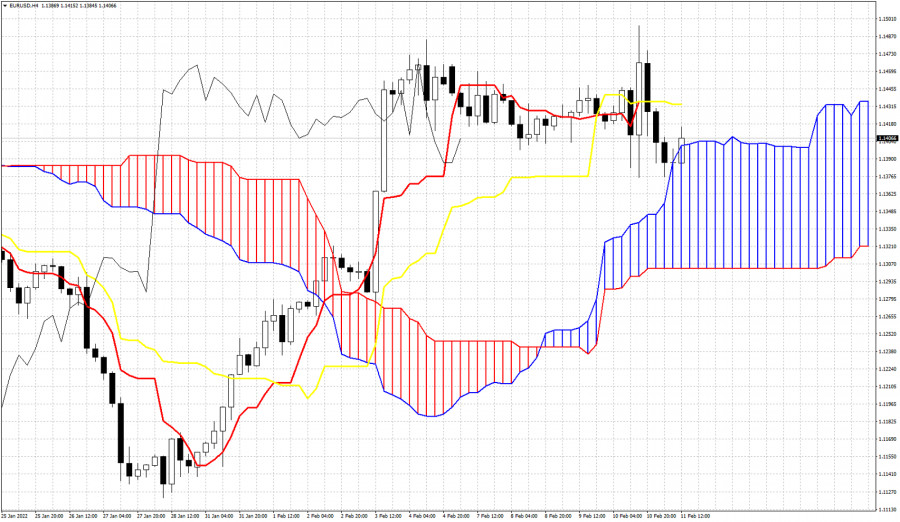
| Posted: 11 Feb 2022 05:16 AM PST EURUSD had a volatile day yesterday with price falling towards 1.1375 and then moving to new higher highs at 1.1495. However bulls were not strong enough to keep prices that high and eventually EURUSD rolled over back to 1.1427.
|
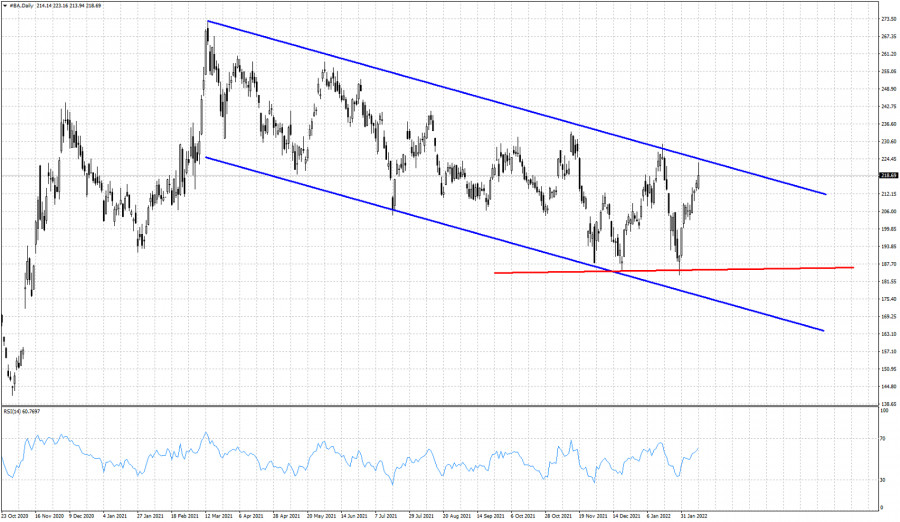
| BA stock price challenges bearish channel boundaries. Posted: 11 Feb 2022 05:12 AM PST BA stock price has been sliding lower since March of 2021 when it was trading around $272, Since then price has been making lower lows and lower highs inside a downward sloping channel. Price has now reached as low as $185 almost three times producing a key support level.
Red line- horizontal support BA stock price has almost created a triple bottom around $185. After testing the red support line for the third time, BA stock price bounced strongly higher towards $223. Price is now challenging the upper channel boundary which is key resistance. Since March of 2021 price has been making lower lows and lower highs. There is no confirmation of a major reversal, but a break above the bearish channel would certainly be the first step towards that direction. The material has been provided by InstaForex Company - www.instaforex.com |


| You are subscribed to email updates from Forex analysis review. To stop receiving these emails, you may unsubscribe now. | Email delivery powered by Google |
| Google, 1600 Amphitheatre Parkway, Mountain View, CA 94043, United States | |


Comments