Forex analysis review
Forex analysis review |
- USD/JPY tries to confirm its breakout
- Gold in buy zone
- UK Consumer Confidence plunges
- Litecoin's bullish pattern
- February 25, 2021 : EUR/USD daily technical review and trading opportunities.
- February 25, 2021 : EUR/USD Intraday technical analysis and trading plan.
- February 25, 2021 : GBP/USD Intraday technical analysis and significant key-levels.
- Technical analysis of GBP/USD for February 25, 2022
- USD/JPY aggressive reversal
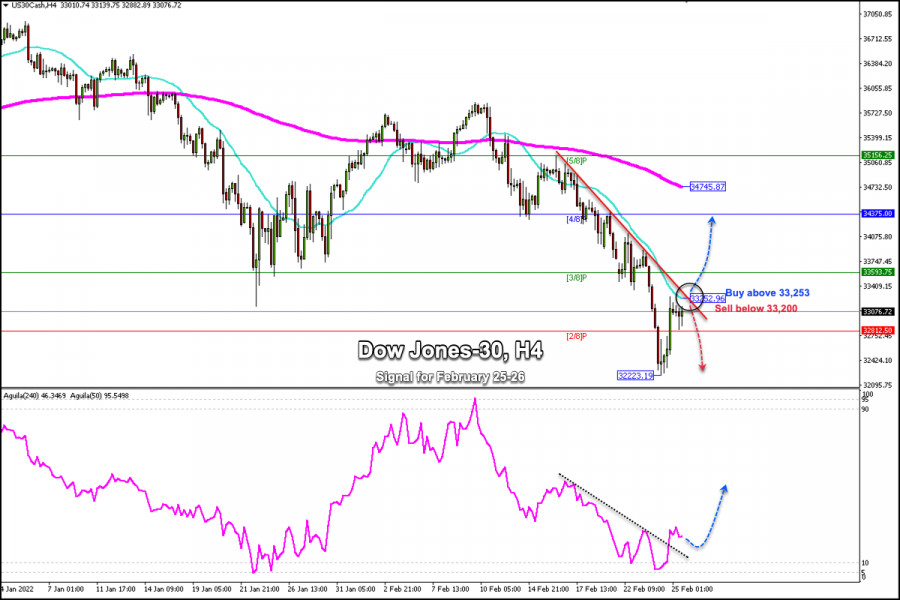
- Trading signals for Dow Jones-30 (#INDU) on February 25-28, 2022: buy above 33,253 (3/8 Murray - 21 SMA)
- BA stock price respects key support again.
- Ethereum challenges cloud resistance once again.
- The Dollar index made new highs, but.....
- Ichimoku cloud indicator analysis on Gold for February 25, 2022.
- Major bearish divergence in EURUSD.
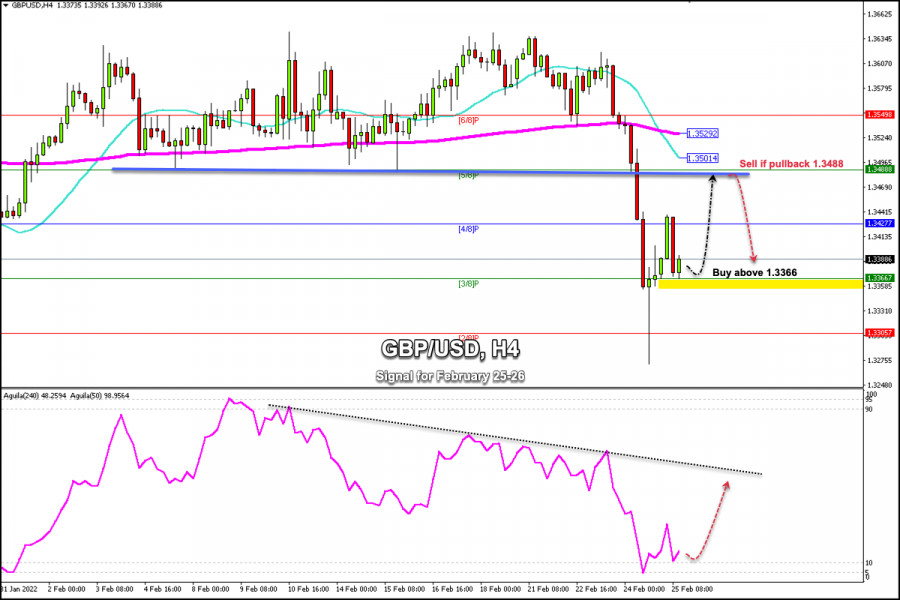
- Trading signals for GBP/USD on February 25-28, 2022: buy above 1.3366 (3/8 Murray)
- Worries about Ukraine crisis bring down futures
- EUR/USD: US dollar cools down and euro may feel pressure again
- GBP/USD: the plan for the American session on February 25 (analysis of morning deals). The pound was quickly sold off after
- Stocks in Europe intensify drop
- Technical analysis of AUD/USD for February 25, 2022
- EU GDP may drop by 0.3%-0.4% due to Ukraine war
- US Premarket on February 25: China accuses US of invading Ukraine
- Asia-Pacific stock indices mostly up
- Crypto market advances amid war in Eastern Europe, but future prospects cloudy
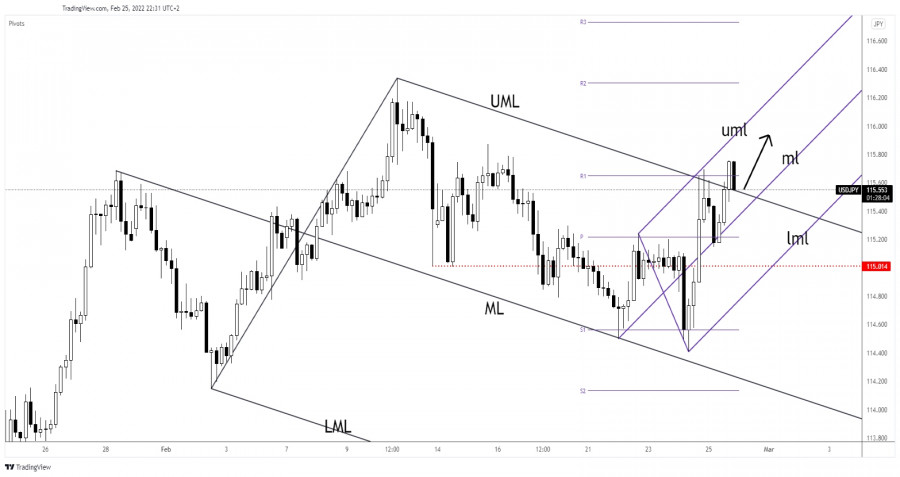
| USD/JPY tries to confirm its breakout Posted: 25 Feb 2022 01:07 PM PST The USD/JPY pair is dropping at the time of writing as the USD is punished by the DXY drop while the Yen is boosted by the Japanese Yen Futures growth. The pair is trading at 115.53 level at the time of writing. The currency pair is making a strong rally today, but it remains to see if it will stabilize above the broken resistance area. Fundamentally, the USD received a helping hand from the US economic data. As you already know, the Revised UoM Consumer Sentiment increased unexpectedly from 61.7 points to 62.8, Core PCE Price Index came in line with expectations, while the Durable Goods Orders and the Core Durable Goods Orders reported better than expected data. Also, Personal Spending and Personal Income beat expectations which could be good for the USD. USD/JPY Leg higher!
As you can see on the h4 chart, the USD/JPY pair rallied after registering only a false breakdown through the confluence area formed at the intersection between the weekly pivot point of 115.21 with the median line (ml) of the ascending pitchfork. In the short term, it has retreated a little to test and retest the immediate downside obstacles before jumping higher. The price has managed to jump above the descending pitchfork's upper median line (UML) which represents a dynamic resistance. It still represents an upside obstacle as the rate could invalidate the breakout. In my opinion, staying above the UML may announce an upside continuation. The bias is bullish as long as it stays above the ascending pitchfork's median line (ml). USD/JPY Prediction!Validating its breakout above the upper median line (UML) may signal further growth within the ascending pitchfork's body. A new higher high, a bullish closure above 115.76 could bring new buying opportunities with a potential upside target at 116.33 higher high. Invalidating its breakout through the UML may announce a new downwards movement. The material has been provided by InstaForex Company - www.instaforex.com |
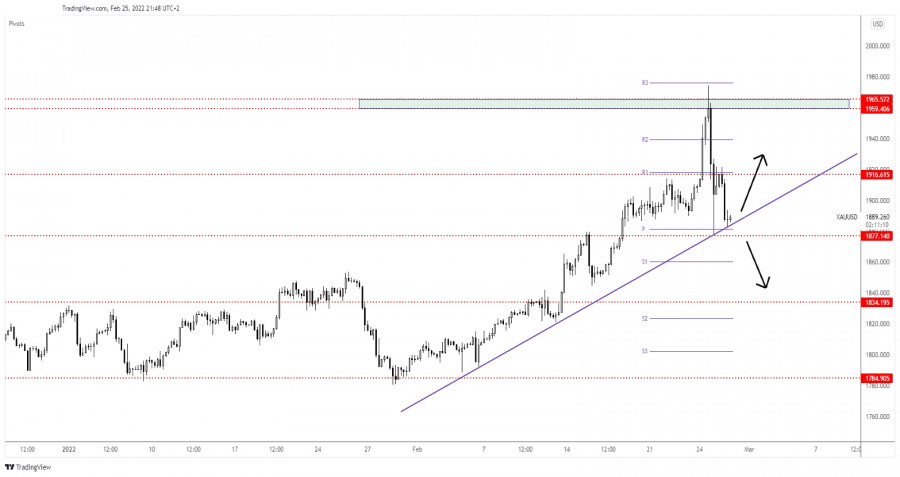
| Posted: 25 Feb 2022 12:27 PM PST The price of gold plunged in the short term after registering a new higher high of 1,974.48. Still, the retreat could be only a temporary one. The bias remains bullish, so the yellow metal could turn to the upside anytime as long as it stays above the immediate uptrend line. Today, XAU/USD erased the temporary gains also because the US data came in better than expected. The Core PCE Price Index rose by 0.5% matching expectations, Durable Goods Orders increased by 1.6% versus 1.1% expected, while the Core Durable Goods Orders reported a 0.7% growth versus 0.4% expected. Furthermore, Personal Income, Personal Spending, and the Revised UoM Consumer Sentiment came in better than expected as well. XAU/USD correction could be over
As you can see on the H4 chart, XAU/USD found resistance at the 1,959 - 1,965 area. It has dropped in the short term and found strong demand and support on the uptrend line. In the short term, the price has rebounded, but the bullish momentum was stopped by 1,916. Now, it has slipped lower to retest the uptrend line and eventually the weekly pivot point of 1,881. XAU/USD outlookGold could develop a new leg higher as long as it stays above the uptrend line. Testing and retesting this dynamic support could bring new long opportunities. Also, registering false breakdowns or developing a strong bullish engulfing could announce a new leg higher. Only a valid breakdown below the uptrend line and below the 1,877 could invalidate a new swing higher and could announce a deeper drop. The material has been provided by InstaForex Company - www.instaforex.com |
| UK Consumer Confidence plunges Posted: 25 Feb 2022 12:01 PM PST The survey results released on Friday, February 25th, revealed that consumer confidence in the United Kingdom plunged to the lowest levels throughout the pandemic period. Experts note that the British consumers express worried about galloping inflation, as well as higher taxes and interest rates. UK consumer confidence hits record lows |
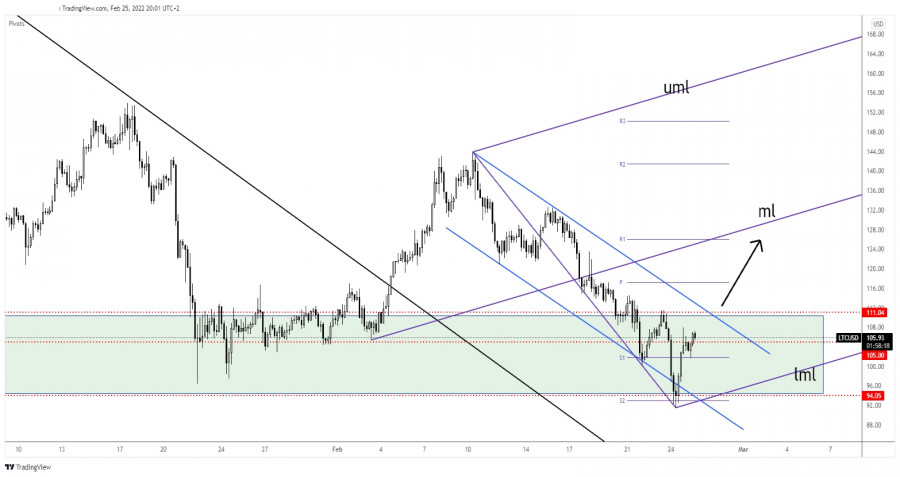
| Posted: 25 Feb 2022 11:42 AM PST Litecoin bounced back after reaching the 91.52 level. Now, it's trading at 106.05 at the time of writing. The price action developed a potential bullish reversal pattern, Still, we'll have to wait for strong confirmation before taking action. LTC/USD is up by 17.26% from yesterday's low of 91.52 to today's high of 107.32. In the short term, the bias remains bearish as long as it stays under the immediate resistance levels. In the short term, Litecoin rallied after the price of Bitcoin turned to the upside. LTC/USD Within A Demand Zone!
LTC/USD dropped within a down-channel pattern. As you can see, it has registered only a false breakdown below 94.05 static support and through the channel's downside line. Now, it has registered strong growth and it's almost to reach the downtrend line. Personally, I've drawn an ascending pitchfork hoping that I'll catch a new leg higher. Still, only a valid breakout above the downtrend line may announce a larger growth and could bring new long opportunities. LTC/USD Prediction!The downtrend line and the 111.04 represent near-term resistance levels. Actually, we have a strong confluence area at the intersection between these levels. A valid breakout through this confluence area may announce an upside continuation and could bring new long opportunities with a first potential target at the median line (ml). The material has been provided by InstaForex Company - www.instaforex.com |
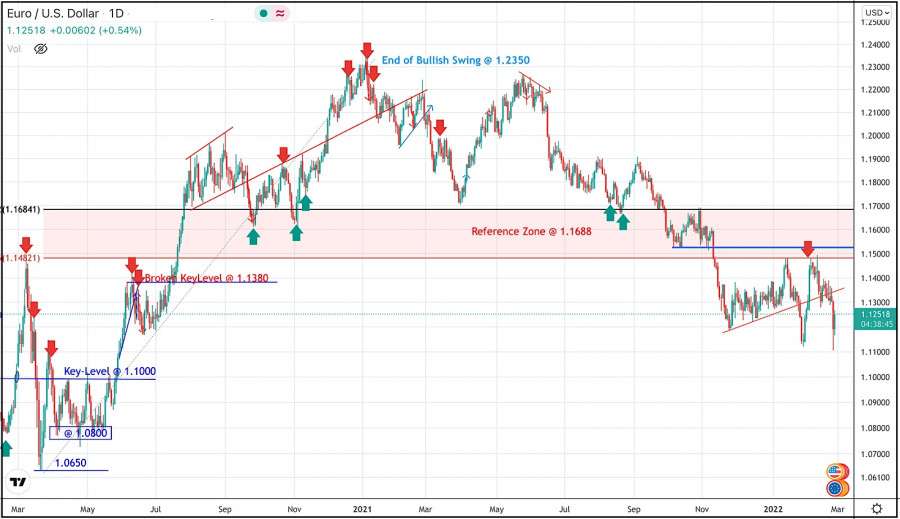
| February 25, 2021 : EUR/USD daily technical review and trading opportunities. Posted: 25 Feb 2022 09:36 AM PST
During the past few weeks, the EURUSD pair has been trapped within a consolidation range between the price levels of 1.1700 and 1.1900. In late September, Re-closure below the price level of 1.1700 has initiated another downside movement towards 1.1540. Price levels around 1.1700 managed to hold prices for a short period of time before another price decline towards 1.1200. Since then, the EURUSD has been moving-up within the depicted movement channel until bearish breakout occurred by the end of last week's consolidations. Few weeks ago, the price zone of 1.1350 failed to offer sufficient bearish rejection that's why it was bypassed. On the other hand, the price zone around 1.1500 applied significant SELLING pressure and a possible SELL Entry was offered upon the previous ascending movement. Estimated downside target is located around 1.1145. The material has been provided by InstaForex Company - www.instaforex.com |
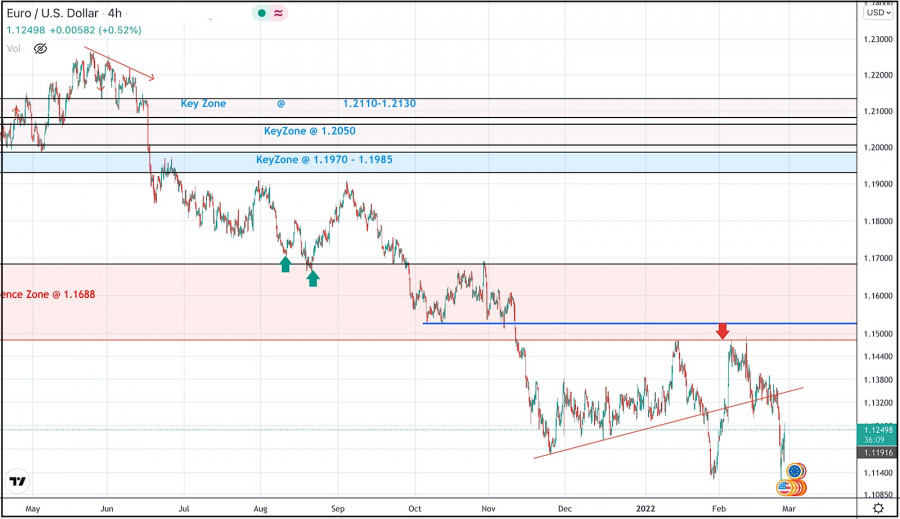
| February 25, 2021 : EUR/USD Intraday technical analysis and trading plan. Posted: 25 Feb 2022 09:33 AM PST
The bullish swing that originated around 1.1650 in August, failed to push higher than the price level of 1.1900. That's why, another bearish pullback towards 1.1650 was executed. However, extensive bearish decline has pushed the EURUSD pair towards 1.1600 and lower levels was reached. Shortly after, significant bullish recovery has originated upon testing the price level of 1.1570. The recent bullish pullback towards 1.1650-1.1680 was expected to offer bearish rejection and a valid SELL Entry. Significant bearish decline brought the EURUSD pair again towards 1.1550 levels which stood as an Intraday Support zone. Hence, sideway movement was demonstrated until quick bearish decline occurred towards 1.1200 where another sideway channel was established. Please note that the current bullish movement above 1.1300-1.1350 should be considered as a sign of bullish strength in the meanwhile. On the other hand, the price levels around 1.1520 stands as a reference zone that provides a valid SELL Entry when bullish momentum fades away. Bearish decline below 1.1300 should be considered as a bearish continuation sign. If so, downside movement should be expected to proceed towards 1.1000. The material has been provided by InstaForex Company - www.instaforex.com |
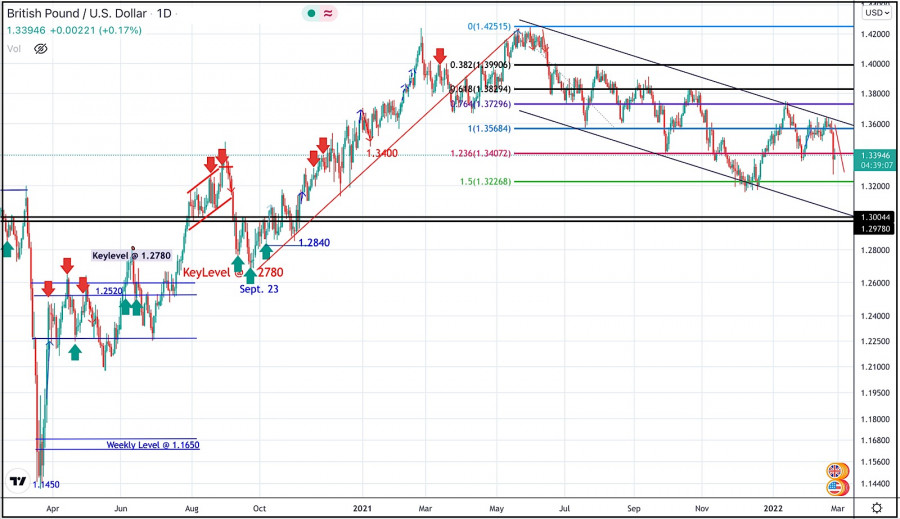
| February 25, 2021 : GBP/USD Intraday technical analysis and significant key-levels. Posted: 25 Feb 2022 09:32 AM PST
The GBPUSD pair has been moving within the depicted bearish channel since July. Bearish extension took place towards 1.3220 where the lower limit of the current movement channel came to meet with Fibonacci level. Conservative traders should have taken BUY trades around 1.3200 price levels as suggested in previous articles. Recent bullish breakout off the depicted bearish channel has occurred few days ago. However, BUYERS were watching the price levels of 1.3730 to have some profits off their trades. Moreover, the price level of 1.3720 stood as a key-resistance which offered significant bearish rejection recently. Shortly after, the short-term outlook turned bearish when the market went below 1.3600. This enhanced the bearish side of the market towards 1.3400 which brought the pair back towards 1.3600 for another re-test. Hence, the recent bullish pullback towards 1.3600 should have been considered for SELL trades as it corresponded to the upper limit of the ongoing bearish channel. Next bearish target is located around 1.3230. On the other hand, please note that any bullish breakout above 1.3700 should be considered as exit signal. The material has been provided by InstaForex Company - www.instaforex.com |
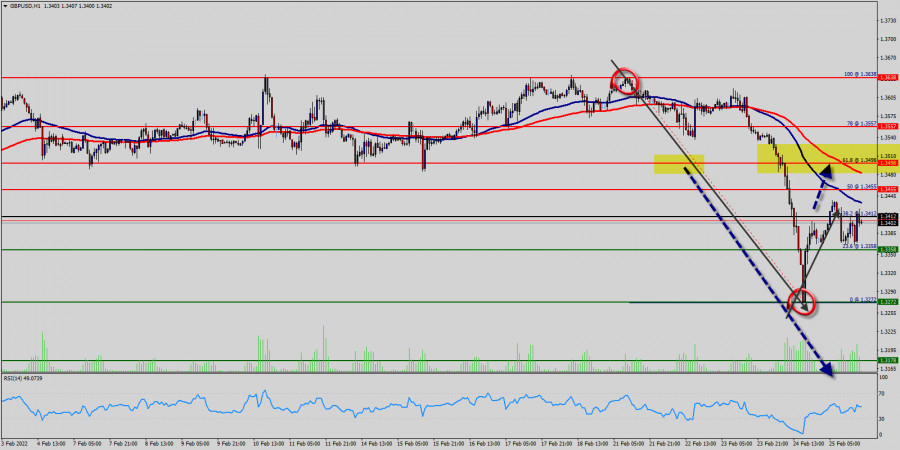
| Technical analysis of GBP/USD for February 25, 2022 Posted: 25 Feb 2022 09:16 AM PST
The GBP/USD pair continues to move upwards from the level of 1.3272. Yesterday, the pair rose from the level of 1.3272 to a top around 1.3412. Today, the first resistance level is seen at 1.3455 followed by 1.3498, while daily support 1 is seen at 1.3358 (23.6% Fibonacci retracement). According to the previous events, the GBP/USD pair is still moving between the levels of 1.3412 and 1.3358; so we expect a range of 54 pips. Furthermore, if the trend is able to break out through the first resistance level at 1.3455, we should see the pair climbing towards the golden ratio (1.3498) to test it. Therefore, buy above the level of 1.3358 with the first target at 1.3412 in order to test the daily resistance 1 and further to 1.3455. Also, it might be noted that the level of 1.3498 is a good place to take profit because it will form a new double top. On the other hand, in case a reversal takes place and the GBP/USD pair breaks through the support level of 1.3358, a further decline to 1.3272 can occur which would indicate a bearish market. The material has been provided by InstaForex Company - www.instaforex.com |
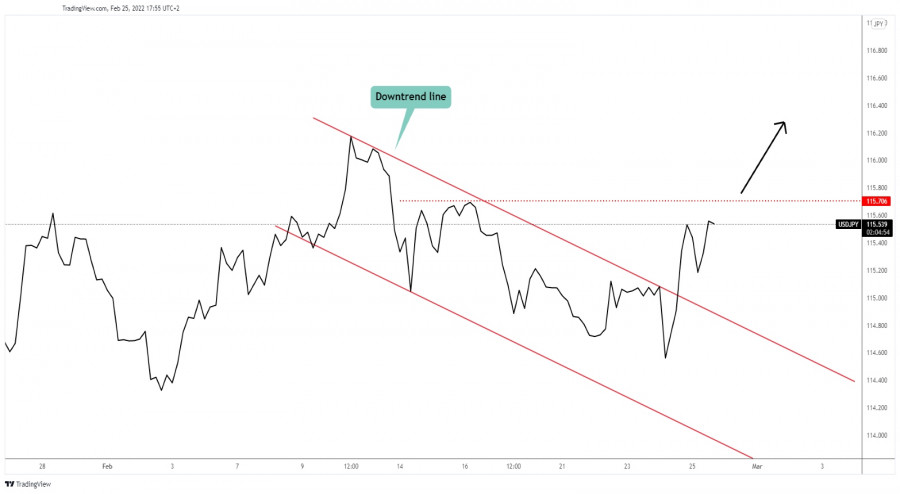
| Posted: 25 Feb 2022 08:45 AM PST
USD/JPY Channel Breakout!The USD/JPY pair signaled that the downside movement could be only a temporary one after failing to reach and retest the channel's downside line. Escaping from the down channel signaled that the downside movement is over and that the price could develop an upside reversal. 115.70 former high represents an upside obstacle. Passing and stabilizing above it may announce an upside continuation. As you can see on the H4 chart, the rate registered an aggressive breakout through the downtrend line. It has retreated a little but it has failed to retest the broken line signaling strong buyers. USD/JPY Trading Conclusion!The price action signaled that the downside movement is over, jumping and staying above 115.70 could confirm further growth and could bring new buying opportunities. The material has been provided by InstaForex Company - www.instaforex.com |
| Posted: 25 Feb 2022 07:45 AM PST
Headlines about the Ukraine crisis send stock markets lower. The Dow Jones-30 reached a low of 32,223. Currently, it has recovered over 1,000 points and is approaching the 21 SMA at 33.253 and the top of the downtrend channel. The main trend is bearish according to the daily swing chart. However, momentum is trending higher, following the formation of Thursday's closing price reversal bottom (32,223). A trade through 33,300 (21 SMA) will change the secondary trend to up. A move through 32,200 will negate the closing price reversal bottom and signal a resumption of the downtrend. A sharp break and a consolidation on the 4-hour chart above 33,250 could help the recovery of the Dow Jones and could reach 3/8 Murray at 33,550 and even 4/8 Murray at 34,375. The recovery of the Dow Jones-30 could be considered a price correction to then resume its main downtrend. As the price of the Dow approaches the 200 EMA located at 34,7450, it will be an opportunity to sell with targets towards 33,600 and up to 32,250. Our trading plan for the next few hours is to buy the Dow Jones-30 above 32,250 (21 SMA) with targets towards 33,400. The eagle indicator is showing a positive signal and a recovery of the industrial index is likely to occur in the coming days. Support and Resistance Levels for February 25 - 28, 2022 Resistance (3) 33,917 Resistance (2) 33,685 Resistance (1) 33,517 ---------------------------- Support (1) 33,812 Support (2) 32,518 Support (3) 32,031 *********************************************************** Scenario Timeframe H4 Recommendation: buy above Entry Point 33,253 Take Profit 33,593; 35,375 Stop Loss 33,170 Murray Levels 35,156 (5/8), 34,375(4/8) 33,593(3/8), 32,812(2/8) *************************************************************************** The material has been provided by InstaForex Company - www.instaforex.com |
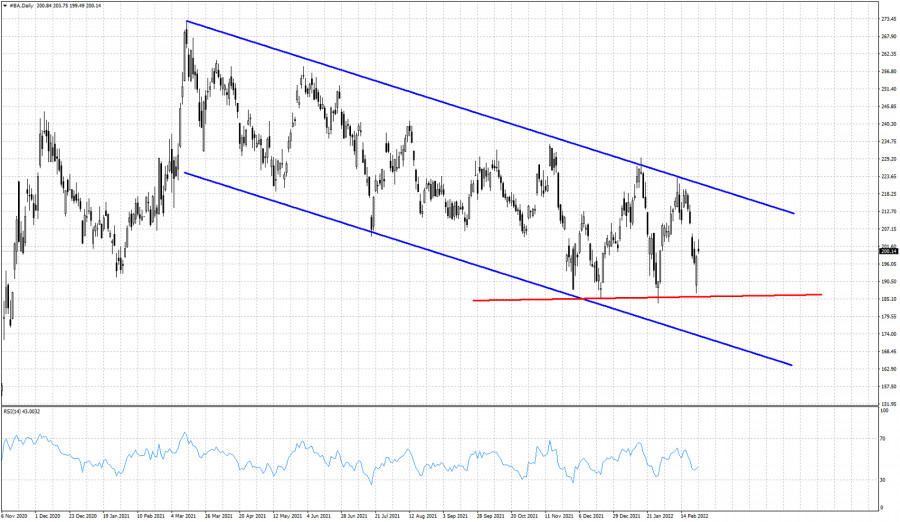
| BA stock price respects key support again. Posted: 25 Feb 2022 07:36 AM PST BA stock price fell towards the major horizontal support yesterday at $185.50. Price made a low at $186,85 and then bounced strongly higher towards $198. This was the fourth time price reached this support area and bounced higher.
Blue lines - bearish channel Red line -horizontal supprot BA stock price got rejected at the upper channel resistance this week and turned lower. Price tested the red horizontal support and so far it seems that it continues to respect it. Staying above it is key for the trend. Failure to stay above it, will push price towards $174 at least. Holding above it, will open the way for another test of the channel resistance at $220. The material has been provided by InstaForex Company - www.instaforex.com |
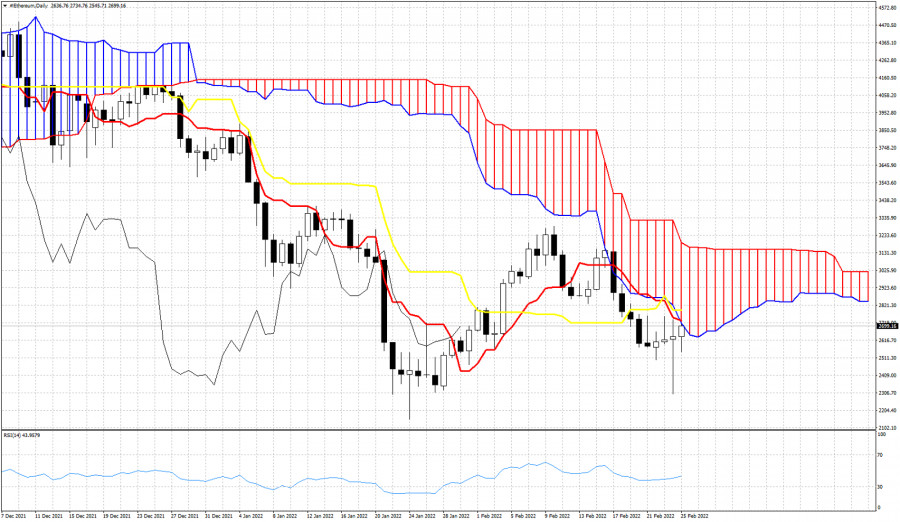
| Ethereum challenges cloud resistance once again. Posted: 25 Feb 2022 07:27 AM PST Ethereum price is bouncing higher after making a low around $2,300. The January low remains intact. However price remains below the Ichimoku cloud in the Daily chart, thus trend according to this indicator remains bearish.
Ethereum is trading below the Kumo (cloud) and below both the tenkan-sen (Red line indicator) and the kijun-sen (yellow line indicator). Both indicators provide resistance at $2,730 and $2,790 respectively. A rejection at current levels will push price back towards today lows or even lower. There are hopes of a reversal but we have no such a signal. First signal would be for price to enter the cloud and break above the kijun-sen. The material has been provided by InstaForex Company - www.instaforex.com |
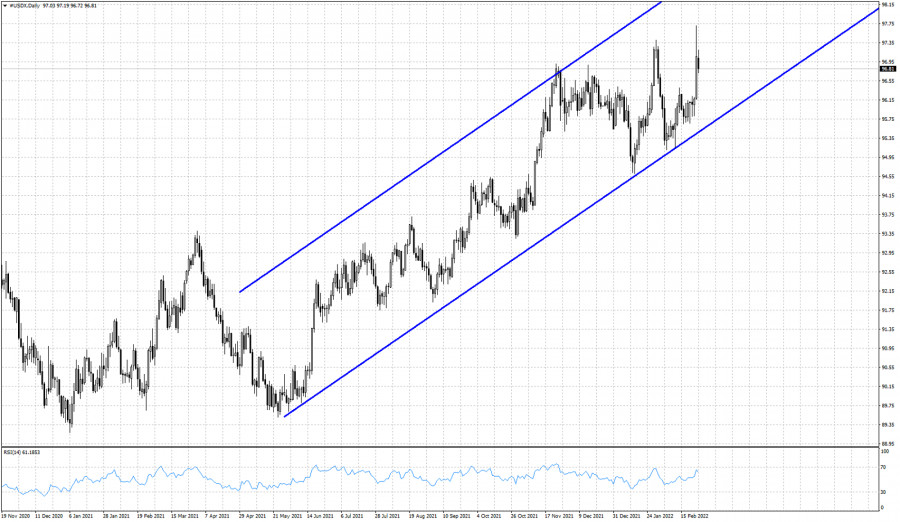
| The Dollar index made new highs, but..... Posted: 25 Feb 2022 07:11 AM PST The Dollar index made new higher highs yesterday but the RSI did not follow. The RSI provided the second bearish divergence and this is an important sign of weakness. The Dollar index continues to trade inside the bullish shor-term channel.
The Dollar index has support at 95.50. As long as price is above this level, bulls remain in control of the trend. So far the index has respected the channel support and continues to make higher highs and higher lows. The chances of a reversal have increased, specially after the new bearish divergence, but so far we have no such sign. Bulls continue to consider every pull back as a buying opportunity. The material has been provided by InstaForex Company - www.instaforex.com |
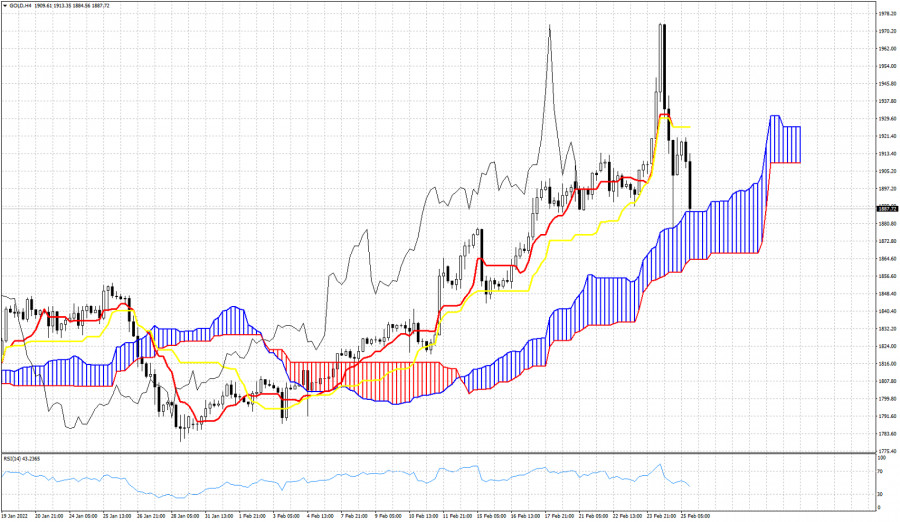
| Ichimoku cloud indicator analysis on Gold for February 25, 2022. Posted: 25 Feb 2022 06:52 AM PST Gold's price has made a strong reversal since yesterday when price spiked to $1,973. Gold is currently trading below $1,900. Was yesterday's spike a trap? Gold price is now challenging key cloud support and if broken we should expect a bigger reversal.
|
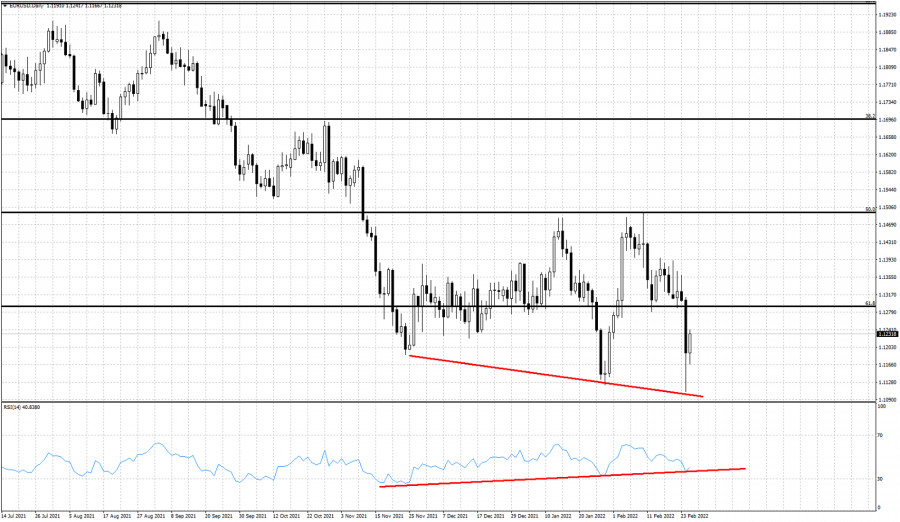
| Major bearish divergence in EURUSD. Posted: 25 Feb 2022 06:44 AM PST EURUSD made new lower lows at 1.1107 yesterday. Today price is above 1.12 and the RSI has provided us with another bullish divergence as it did not make new lower lows. This is not a reversal signal but a sign that the downtrend is weakening. Bears should be cautious.
Black lines- Fibonacci retracements If EURUSD bulls manage to recapture 1.1390-1.1410 area, we should expect a major reversal to the upside. There are increased chances that a major low is in the process of being realized at current levels. EURUSD has the potential to turn higher from current levels and start a new upward move at least towards 1.17-1.18. So far we have indications that the downward pressures are weakening. Trading around the 61.8% Fibonacci retracement increases the chances of such a reversal happening over the next few days. The material has been provided by InstaForex Company - www.instaforex.com |
| Trading signals for GBP/USD on February 25-28, 2022: buy above 1.3366 (3/8 Murray) Posted: 25 Feb 2022 06:29 AM PST
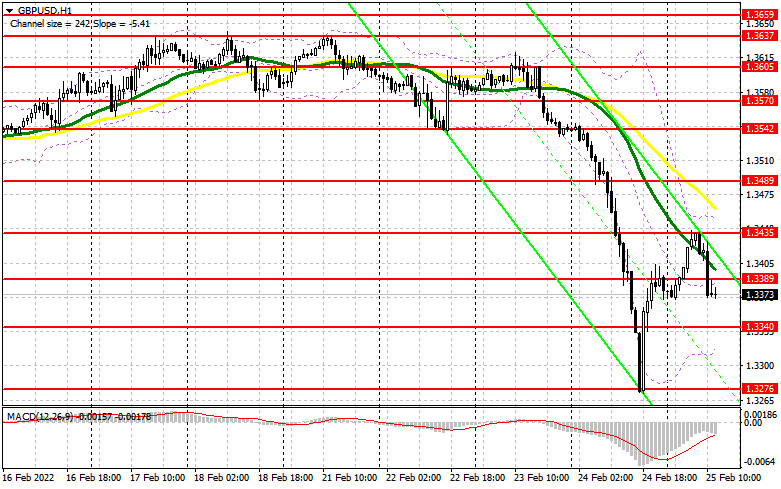
GBP/USD started to rise after falling to its lowest level of 2022 below 1.3300. The latest news suggests that Russia is preparing to take a step towards Kiev. A Russian attempt to overthrow the Ukrainian government could further weigh on sentiment and cause the GBP/USD pair to fall to the psychological level of 1.3000. The dollar index (USDX) is trading at its highest level since late January, suggesting that the greenback is capitalizing on safe-haven money flows. USDX after reaching 97.71 is making a technical correction and is likely to drop below 96.87. This will give GBP/USD bullish strength and could rally to the top of the channel that was broken at 1.3488. On the 4-hour chart, we can see that the British pound is consolidating around 1.3368. As long as it remains trading above this level, there is a chance of a recovery of GBP/USD with targets at 4/8 Murray and up to 5/8 Murray at 1.3488. Conversely, a break below 1.3350 could accelerate the move down towards the low of 1.3260. The eagle indicator has reached the oversold zone and it is likely that in the next few hours the British pound will find a technical correction towards SMA 21 located at 1.3501. According to the H4 chart, the GBP/USD trend remains bearish and as long as it remains below the 200 EMA located at 1.3529 there is a chance that any technical bounce will be seen as an opportunity to continue selling. Support and Resistance Levels for February 25 - 28, 2022 Resistance (3) 1.3488 Resistance (2) 1.3427 Resistance (1) 1.3396 ---------------------------- Support (1) 1.3342 Support (2) 1.3305 Support (3) 1.3245 *********************************************************** Scenario Timeframe H4 Recommendation: buy above Entry Point 1.3366 Take Profit 1.3427; 1.3488 Stop Loss 1.3310 Murray Levels 1.3549 (6/8), 1.3488(5/8) 1.3427(4/8), 1.3366(3/8) *************************************************************************** The material has been provided by InstaForex Company - www.instaforex.com |
| Worries about Ukraine crisis bring down futures Posted: 25 Feb 2022 05:29 AM PST U.S. stock indexes were set for a weaker open on Friday, a day after staging a dramatic late rally, as developments around a raging war in Ukraine kept investors on edge. After Russian troops invaded Ukraine, the U.S. government, the European Union and several other countries imposed sanctions against Russia aimed at limiting its ability to do business in major currencies. The coordinated response helped dampen risk sentiment in the previous session, causing Wall Street to rise sharply, leading the Nasdaq up 3 percent after a weak opening. "It is too early to assume that the sanctions will force Russia to back down, or that any other nation will not get involved," said Charalambos Pissouros, head of research at JFD Group. "Thus, we prefer to treat yesterday's recovery in risk assets as a corrective rebound and we see decent chances for another leg south." Morgan Stanley and Microsoft Corp fell around 1% each in premarket trading to lead losses among big banks and megacap growth names. Oil majors Exxon Mobil and Chevron Corp slipped about 0.7%, tracking crude prices. Defense stocks Lockheed Martin Corp, Northrop Grumman Corp and L3Harris Technologies Inc all rose more than 1%. At 06:19 a.m. ET, Dow e-minis were down 286 points, or 0.86%, S&P 500 e-minis were down 38 points, or 0.89%, and Nasdaq 100 e-minis were down 113.25 points, or 0.81%. Key indices posted their third straight weekly decline as geopolitical tensions dealt a severe blow to investors already worried about the Federal Reserve's aggressive plans to tighten policy. The material has been provided by InstaForex Company - www.instaforex.com |
| EUR/USD: US dollar cools down and euro may feel pressure again Posted: 25 Feb 2022 05:18 AM PST
Markets are gradually recovering from the shock caused by worsening geopolitical tensions. The greenback stopped growing, reaching its high since June 2020 near 97.70 yesterday. The euro is attempting to rebound from its lowest level since May 2020, seen at $1,1106 on Thursday. Meanwhile, US stock futures are showing moderate intraday losses today, indicating cautious market sentiment. Traders continue to monitor the situation in Eastern Europe, as well as assess further prospects for monetary policy in the US and the euro area. Investors were fleeing to safe havens and this trend dominated financial markets yesterday. As a result, the US dollar rose to multi-month highs before decreasing at the end of the US session. The EUR/USD pair recouped almost half of its losses, falling earlier from the level of 1.1305, near which it closed on Wednesday. Major US stock indicators have also removed short-term oversold conditions. The main Wall Street indices turned to the upside by the end of the trading session on Thursday, offsetting the fall that reached 2.5-3% during the session, and finished yesterday's trading session with an increase of 0.3-3.3%. As the West refrained from banning SWIFT and targeting the energy sector in the first package of sanctions against Russia, fears of a global economic slowdown eased, allowing the EUR/USD pair to recover.
However, experts warn that the situation is evolving, risking to trigger shocks in commodity and energy prices in the coming days. In such a case, the US dollar, as a protective asset, may show its potential, and the single currency may come under pressure again. In addition, Washington and Brussels may impose additional sanctions on Moscow. If that happens, risk aversion will return to the markets before the weekend. Moody's experts see the events around Ukraine as serious risks for the global economic outlook. They estimate a 55% chance of a quick resolution of the conflict and see a 30% chance of its stalling while considering both scenarios. Moody's reported that the GDP of the G20 countries would expand by 4.3% in 2022 and by 3.2% in 2023. If the conflict drags on, the rate of increase in the index by the end of this year will be below 1%, in the case of a quick end to the conflict - less than 3%. ING strategists believe that the current situation remains favorable for the US dollar, as the world's attention is still focused on the war in Europe. The greenback has understandably gained an advantage this week and may retest the highest level since June 2020 at 97.70. "We suspect investors will want to hold on tight to their dollars. Also helping the dollar seems to be the Federal Reserve story, where FOMC members still seem happy to speculate over a 25bp or 50bp rate hike at the 16 March meeting. Here, the pricing of the Fed terminal rate (in two years) is just 5bp off its recent highs. We continue to favor the dollar over Europe and favor the DXY returning to yesterday's spike high near 97.70," they noted.
President of the Federal Reserve Bank of Richmond Richard Barkin said on Thursday that Russia's invasion of a neighboring country is taking the global economy into uncharted territory, and the Fed needs to assess how that might affect its plans to raise its key interest rate next month. "The logic for that is underlying demand is strong. The labor market is tight. And inflation has been high and broadening. We are going to have to see whether this Ukrainian situation changes that narrative. And I just think time will tell," he said. He also added that the interaction between the US and Russian economies is not very significant, and an escalation of the conflict between Moscow and Kyiv would rather affect Europe. Cleveland Federal Reserve President Loretta Mester noted the situation in Ukraine could influence the pace of the Fed's key interest rate hike in March, but not the timing of its increase. Mester said that barring an "unexpected turn in the economy," she still supports kicking off a series of interest-rate hikes in March and continuing the hikes in the following months. "The unfolding situation in Ukraine for the medium-run economic outlook in the US will also be a consideration in determining the appropriate pace at which to remove accommodation," Mester added. While the money market now estimates the chance of an immediate 50 basis point March federal funds rate hike at 34% against 20% last week, some FOMC officials such as James Bullard and Michelle Bowman hinted that even if geopolitical tensions escalate, they may vote for a hawkish move. Yesterday, Christopher Waller, a member of the Board of Governors of the Federal Reserve, joined them in calling for a one percentage point increase in the key rate by midyear. He suggested starting with a half a percentage point increase in March if statistics in the coming weeks continue to point to an "extremely hot" economy. Waller would like to see the Fed's benchmark rate, now between zero and 0.25%, increased to a range of 1% to 1.25% by early summer. Thus, apart from developments around Ukraine, the Fed's rate decision will ultimately depend on incoming data. We are talking about the February US inflation report, which will be released on March 10, as well as the NFP release, which will be published next Friday. While some Fed officials said that heightened tensions in Eastern Europe are likely to slow but not stop interest rate hikes coming, several ECB policymakers, even those considered hawks, said that the situation in Ukraine could make the ECB slow its easing of stimulus measures. Bank of Greece Governor Yannis Stournaras believes that the European Central Bank should continue to buy bonds at least until the end of the year to mitigate the effects of the conflict in Ukraine. Governor of Austria's central bank Robert Holzmann said that the events in Ukraine could delay the ECB's withdrawal from stimulus measures. Isabelle Schnabel, the ECB's board member, said that the "war shock" clouded the outlook for the economy just as inflation was picking up in the euro area and allowed the ECB to cancel its stimulus measures. Having touched a multi-month low at 1.1106, the EUR/USD pair was able to rebound. Nevertheless, another drop to 1.1100 is possible, OCBC Bank analysts believe. "Headlines will take over for this session, and the risk into next week is a further escalation over the weekend. Thus, the pair may not be out of the woods just yet, and a retest of 1.1100 cannot be ruled out. Further out, the question is whether this conflict will upend the ECB's and other central banks' playbook, and spark a more structural change in overall trajectory for the pair. We hold our horses for that for now," the analysts said. After Russia launched a military special operation in Ukraine, it caused sharp fluctuations in the currency market. The EUR/USD pair showed one of the largest one-day declines in months, approaching the level of 1.1100. An additional drop towards 1.1000 is still possible shortly, MUFG economists believe. The experts of Bloomberg Economics offered 3 scenarios and evaluated the impact of the Russian-Ukrainian conflict on economic growth and monetary policy on both sides of the Atlantic. In the best-case scenario, a quick cessation of hostilities prevents further inflation spiral in the commodity market, supports the recovery of the US and European economies, as a result of which the Fed and the ECB will have to make adjustments to their plans, rather than abandon them. A slightly more negative scenario is a prolonged conflict, causing tougher Western sanctions against Russia and disruption of oil and gas exports, which means an even bigger shock to the energy sector and a serious blow to the global market. This will rule out the ECB rate hike this year and slow down monetary policy tightening by the Fed. Finally, in the worst-case scenario, everyone will suffer: both Russia because of Western sanctions, and Europe, which will not wait for gas supplies, provoking a recession in Europe, while in the United States financial conditions will become much tougher, economic growth in the country will slow down, and the Fed will have to wait with a hawkish policy, which will take a markedly more dovish sentiment. On Friday, the US currency is trading almost 0.9% below the multi-month highs reached yesterday at 97.70. Nevertheless, the greenback continues to be in demand amid continued uncertainty around Ukraine, leaving the EUR/USD pair under pressure. Societe Generale strategists expect the pair to incur additional losses if it breaks through 1.1120. "A bounce is not ruled out, however, a descending trend line at 1.1330 - 1.1345 could cap. Crossing this would be essential for a retest of 1.1485. In the event 1.1120 gets violated, there would be a risk of next leg of downtrend towards projections of 1.1080 - 1.1040," they said. The material has been provided by InstaForex Company - www.instaforex.com |
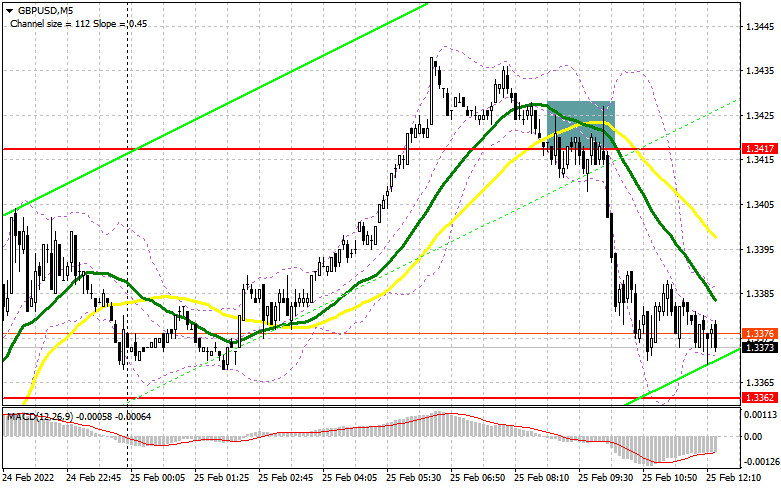
| Posted: 25 Feb 2022 05:12 AM PST To open long positions on GBP/USD, you need: In my morning forecast, I paid attention to the level of 1.3417 and recommended making decisions on entering the market. Let's look at the 5-minute chart and figure out what happened. A sharp rise above this range even before the opening of the European session seemed to be able to continue the upward potential of the pair, but, as we can see, no people were willing to continue buying the pound. A false breakdown and a return under 1.3417, followed by a test of this range from the bottom up, led to the formation of a sell signal for the pound, which resulted in a large sale and brought about 40 points of profit. We never reached the designated target in the area of 1.3362. Therefore, for the second half of the day, the technical picture has changed a little. And what were the entry points for the euro this morning?
The American session is very important since it is during that 12-hour ultimatum put forward by Russia on the acceptance of several demands by the Ukrainian authorities. Most likely, official Kyiv will not make concessions, which will lead to another military aggression by the Russian army. This will catalyze building up short positions on the pound and buying safe-haven assets, which can now be attributed to the US dollar. In the afternoon, several important fundamental statistics on the American economy are released, which can also become a catalyst for increasing short positions in the continuation of the bear market, so I advise you not to rush with purchases. The key task of the bulls will be to protect the 1.3340 support, as its breakdown will only increase pressure on the pair and open a direct path to yesterday's lows. The best option, of course, will be purchases in case of a false breakdown at the level of 1.3340. However, immediately after that, active growth of the pair should occur. If it is not there, and the pound continues to hover around the level of 1.3340, I advise you to postpone long positions to a minimum of 1.3276. Only the formation of a false breakdown there will give an entry point to long positions. You can buy the pound immediately on a rebound from 1.3232, or even lower - from a minimum of 1.3173, counting on a correction of 20-25 points within a day. To stop the bearish trend, bulls need to try to close the day above 1.3389, which was formed at the end of the first half of the day, which will not be so easy to do. A breakthrough and a test of this range after very weak data on changes in the level of spending and income of the US population for the worse, as well as after a decrease in the volume of orders for durable goods, can turn everything upside down. This will lead to the formation of a new buy signal and then to a possible increase in the area of 1.3435 – the maximum of today. A more distant target will be the 1.3489 area, where I recommend fixing the profits. To open short positions on GBP/USD, you need: Bears continue to control the market and their main task is to close the trading week below 1.3389. This will create even more technical problems for traders who yesterday were counting on a quick "comeback" of the pound after the failure to a minimum of 1.3276. The intensification of military operations on the territory of Ukraine will lead to a new wave of decline in the pair. The formation of a false breakout at 1.3389 forms an excellent entry point into short positions, followed by a decline and a breakdown of the 1.3340 support. The lack of activity on the part of buyers there, as well as a breakdown and a reverse test of this level from the bottom up, will give an additional entry point into short positions to fall to 1.3276 and 1.3232. A more distant target will be the 1.3173 area, where I recommend fixing the profits. If the pair grows during the American session, as well as weak sellers' activity at 1.3389, where the moving averages playing on the side of bears are held, it is best to postpone sales. The demolition of 1.3389 may lead to a sharp increase in the pound. In this case, I advise you to sell GBP/USD immediately for a rebound from 1.3435, or even higher - around 1.3489, counting on a correction within the day by 20-25 points.
The COT reports (Commitment of Traders) for February 15 recorded a sharp increase in long positions and a reduction in short ones. This led to the return of the delta of its positive value. Although the results of the Bank of England meeting did not come as a surprise, clear hints from the regulator on a more aggressive tightening of the monetary policy fueled the appetite for risks from major players. If it were not for the ongoing conflict between Russia and Ukraine, which has reached a new level, one could count on a more active recovery of the pound. In the meantime, further demand for risky assets is questionable. Given that the British economy is currently going through hard times and at any moment the pace of economic growth may seriously slow down, an increase in rates may harm the pace of recovery in the near future. However, optimism is inspired by the recent good report on retail sales, which implies strong growth in the indicator. The fact that inflation in January remained at the same levels and practically did not change year-on-year may affect the plans of the Bank of England, which will moderate the pace of policy tightening. Further geopolitical events around Russia and Ukraine, as well as the decisive actions of the Federal Reserve System regarding future interest rates in March of this year - all this will continue to put pressure on buyers of the pound. Some traders expect that the US Central Bank may resort to more aggressive actions and raise rates by 0.5% at once, rather than by 0.25% - this will become a kind of bullish signal for the US dollar. The COT report for February 15 indicated that long non-commercial positions increased from 44,709 to the level of 50,151, while short non-commercial positions decreased from the level of 53,254 to the level of 47,914. This led to an increase in the non-commercial net position from -8,545 to 2,247. The weekly closing price remained unchanged at 1.3532 versus 1.3537. Signals of indicators: Moving averages Trading is below 30 and 50 daily moving averages, which indicates a bear market. Note. The period and prices of moving averages are considered by the author on the hourly chart H1 and differ from the general definition of the classic daily moving averages on the daily chart D1. Bollinger Bands In the case of growth, the upper limit of the indicator around 1.3435 will act as resistance. Description of indicators
|
| Stocks in Europe intensify drop Posted: 25 Feb 2022 05:02 AM PST At the close of trading on Thursday, all three key European stock exchanges reported declines of more than 3%. Investors were actively risk averse amid escalating military conflict in Western Europe. As a result, the STOXX Europe 600 index of Europe's leading companies fell by 3.3% to 438.99 points. The main outsiders in the stock index components were securities of Russia's leading silver producer Polymetal International, which lost 37.8% of its value. Shares in Raiffeisen Bank International AG dropped by 23.1%, Bank Polska Kasa Opieki S.A. lost 14.5%, and Commerzbank AG declined by 13.1%. The British FTSE 100 shed 3.9% to 7,207.01 points on Thursday, the French CAC 40 slipped by 3.83% to 6,521.05 points and the German DAX was down 4% to 1,4052.1 points.
Finnish tyre maker Nokian Renkaat Oyj is down by 15%. German energy company Uniper SE dropped by 14% and Polish online retailer Allegro.eu SA lost 13.8%. Deutsche Bank AG, Germany's largest financial conglomerate, saw its shares decline by 12.5%, German tyre and car component maker Continental AG sank by 7.5%, while car giants BMW and Porsche lost 7.2% in value. Evraz Plc, a metals and mining company, declined by 30.4% and Russian gold mining holding Petropavlovsk dropped by 27%. Europe's banking and automotive sectors suffered the biggest losses on Thursday, dropping by 8.2% and 6% respectively. Meanwhile, the oil and gas sector fell by just 0.3% as the global price of oil rose to its highest level since 2014. The foreign policy issue was in the focus of European stock market participants the day before. On Thursday morning, Russian President Vladimir Putin announced the launch of a special military operation in Ukraine. In response, the Western countries have threatened Russia with harsh sanctions. Ukraine has imposed martial law. According to European Commission chief Ursula von der Leyen, the new package of sanctions against Russia will be aimed at severely restricting its access to capital markets. Also, on Thursday, a number of major European companies reported their financial results for previous periods. For example, British luxury carmaker Rolls-Royce managed to reduce its pre-tax loss last year. In addition, Rolls-Royce management revealed plans for CEO Warren East to step down at the end of 2022. The value of the company's shares plummeted by 13%. Italian car tyre maker Pirelli & C SpA's shares fell by 10.4% despite the company increasing its net profit 7.5 times in 2021. Telecommunications company Deutsche Telekom AG dropped by 5.4% in the fourth quarter. In the fourth quarter, the company's net profit declined by 72%. This figure was worse than preliminary market forecasts. Anheuser-Busch InBev, a global brewer, lost 1.4% of its market capitalisation, despite strong earnings in the previous quarter. Anheuser-Busch InBev's net income and revenue rose above analysts' preliminary scenarios. The material has been provided by InstaForex Company - www.instaforex.com |
| Technical analysis of AUD/USD for February 25, 2022 Posted: 25 Feb 2022 04:27 AM PST
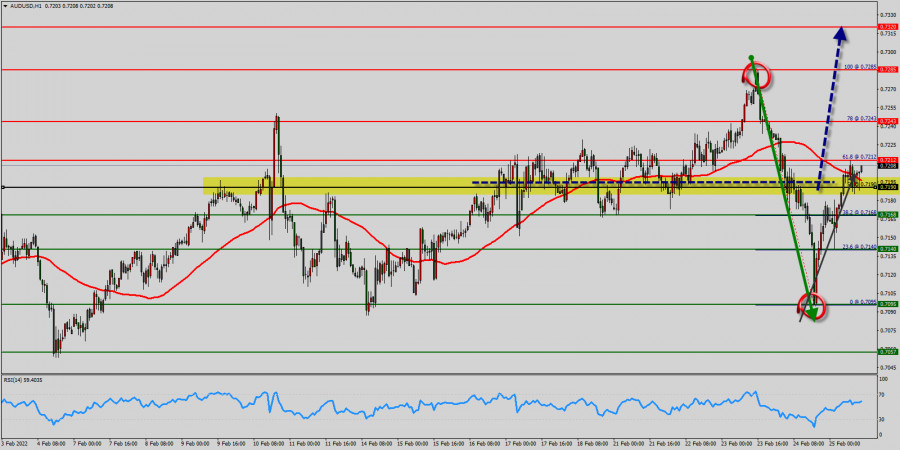
The AUD/USD pair broke resistance at 0.7168 which turned into strong support yesterday. This level coincides with 38.2% of Fibonacci retracement which is expected to act as major support today. Equally important, the RSI is still signaling that the trend is upward, while the moving average (100) is headed to the upside. Accordingly, the bullish outlook remains the same as long as the EMA 100 is pointing to the uptrend. This suggests that the pair will probably go above the daily pivot point (0.7168) in the coming hours. The AUD/USD pair will demonstrate strength following a breakout of the high at 0.7190. Consequently, the market is likely to show signs of a bullish trend. In other words, buy orders are recommended above 0.7190 with the first target at 0.7243. Then, the pair is likely to begin an ascending movement to 0.7243 mark and further to 0.7285 level - doube top. The level of 0.7285 will act as strong resistance, and the double top is already set at 0.7285. On the other hand, the daily strong support is seen at 0.7140. If the AUD/USD pair is able to break out the level of 0.7140, the market will decline further to 0.7095 (daily support 2). The material has been provided by InstaForex Company - www.instaforex.com |
| EU GDP may drop by 0.3%-0.4% due to Ukraine war Posted: 25 Feb 2022 04:25 AM PST At the meeting in Paris, Philip Lane made an assumption that the conflict in Ukraine may cut eurozone economic growth by 0.3%-0.4%. The announcement was made just a few hours after the outbreak of hostilities in Ukraine. This is the " middle scenario " of the economic situation. Lane presented a tougher scenario as well, under which GDP might fall by almost 1%, and a light version, when the current situation has no impact on the monetary block. But this scenario is considered unlikely. All these forecasts are quite vague, so Lane says he will give a more precise estimate at the March 10 meeting, at which the ECB is to make a decision on the future of its stimulus program. Lane did not present new inflation forecasts, but he told delegates at the meeting that the 2022 outlook will be significantly increased, with a hint that estimates at the end of the horizon could still be below the ECB's target level of 2%. The ECB's forecast horizon currently extends to 2024. The material has been provided by InstaForex Company - www.instaforex.com |
| US Premarket on February 25: China accuses US of invading Ukraine Posted: 25 Feb 2022 04:23 AM PST US stock index futures opened slightly lower after yesterday's sharp upward rally. It caused a gap down overlap, as well as exponential growth of the stock market. Today, trading started in the red zone as investors assessed the risks associated with Russia's invasion of Ukraine. The Dow Jones Industrial Average futures fell by 292 points, or 0.84%.The S&P 500 futures also declined by 0.86%, while the Nasdaq 100 futures went down 0.77%.
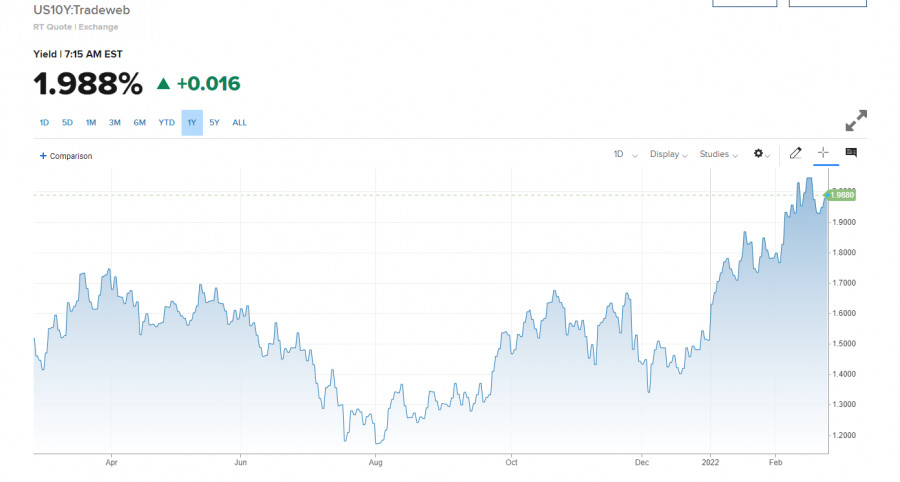
The fact that investors and traders have already partly accepted the military conflict is evidenced by both the sharp decline in safe haven assets and the drop in the commodity market. Commodity prices fell: natural gas futures went down 2.3% to $4.53. West Texas Intermediate crude oil declined, trading at $92.59 a barrel. Brent crude oil is trading at $98.81. Government bond yields were mixed, with the benchmark 10-year Treasury note most recently yielding 1.96%, down 1.2 basis points for the session. The Dow Jones index gained about 90 points yesterday, having lost 859 points at the beginning of the trading session. The Nasdaq Composite Technology Index went up 3.3%, demonstrating a sharp recovery after falling nearly 3.5% earlier in the day. Notably, yesterday President Joe Biden imposed new economic sanctions against Russia. According to Biden, the US also authorized the deployment of additional troops to Germany so that NATO allies could bolster defenses in the EU. China blames US China's Assistant Foreign Minister Hua Chunying was asked by reporters several times whether she would call Russia's attacks an invasion. However, she repeatedly avoided giving a definite answer. Consequently, Hua did not directly represent the view of the Chinese authorities that the US was to blame for the current situation in Ukraine. Nevertheless, she implied this fact clearly. Hua stressed that Russia is an "independent major country" that could act on its own. "China is closely following the development of the situation. What you are seeing today is not what we have wished to see. We hope all parties can go back to dialogue and negotiation," China's Assistant Foreign Minister added. It was reported that Chinese Foreign Minister Wang Yi had a call with Russian Foreign Minister Sergei Lavrov. Wang said that China had always respected each country's sovereignty. According to official data, the Ukraine issue is complex. Wang called for the use of dialogue. However, he did not mention Beijing's previous official position about the need for all parties to maintain restraint. Stock market volatility will likely increase in the near future and remain high for quite a long period. However, all events will occur over the weekend, when the markets will be closed.
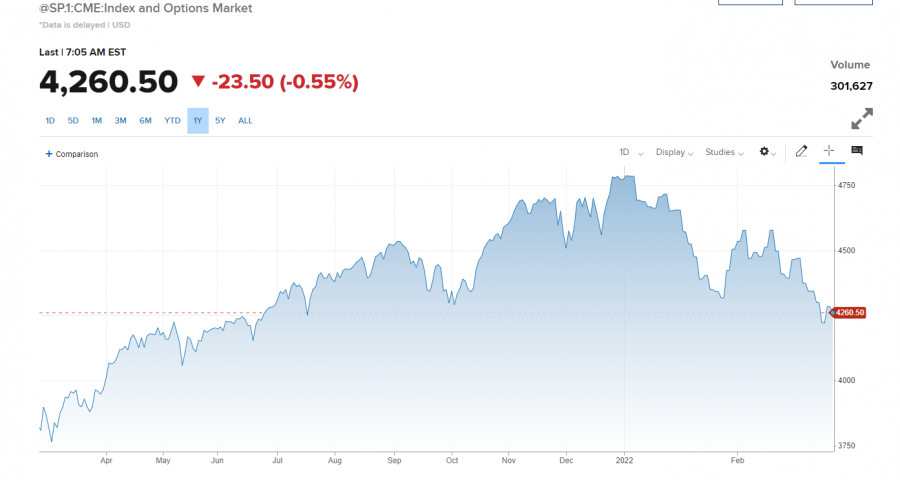
Technical picture of S&P500 Yesterday, the index rose sharply, causing changes. Today, the bulls will try to hold above $4,292. If they fail, the pressure on the trading instrument will increase, resulting in the decline to the area of $4,233. A breakout of this range will intensify the pressure on the index and resume the bear market with the prospect of updating the lows of $4,175 and $4,113. A fast retracement above $4,292 and fixation in this range would stimulate recovery of the market. However, the outcome of today's session is unclear. In case of growth, new sales at $4,341 and $4,378 are likely. The situation will mainly depend on further development of the military conflict in Ukraine and a possible dialogue between the presidents of the two countries. The material has been provided by InstaForex Company - www.instaforex.com |
| Asia-Pacific stock indices mostly up Posted: 25 Feb 2022 04:21 AM PST
Asia-Pacific stock indices were mostly up in Friday's trading session as part of a correction after yesterday's significant decline. The Shanghai Composite added 0.54% and the Shenzhen Composite gained 1.02%, while Hong Kong's Hang Seng Index was down by 0.1%. The Korean KOSPI rose by 1.11%, the Japanese Nikkei 225 gained 1.66% and the Australian S&P/ASX 200 added 0.12%. During Thursday's trading the main indices of the Asian region showed a significant decline (by 1.5-3.2%). The US and European stock indices also dropped in the course of trading. This happened as a result of the deployment of Russian troops on the territory of Ukraine, namely in the DNR and LNR, which the Russian president had recognized as independent the day before. This Russian special operation was condemned by European countries, the US and other states, which imposed a number of sanctions against the Russian Federation. Nevertheless, US indicators ended yesterday's trading with positive dynamics. For instance, the tech-heavy NASDAQ added 3%, which in turn supported Asian indicators. According to experts, this sharp turn in investor sentiment is due to the fact that due to the worsening global political situation, the US Federal Reserve will not sharply tighten monetary policy, in particular they will not raise rates. In the meantime, the Chinese central bank is striving to support the national economy. In order to preserve liquidity 760 billion renminbi were injected during the current week, almost half of that amount in one day. It is a record for the past two years. The regulator also kept the interest rate at 2.1%. However, the country's shares are down. PetroChina Co., Ltd. fell by 3.5%, China Resources Land, Ltd. dropped by 3.2% and HSBC Holdings PLC declined by 3.1%. In Japan the stock market selling, which had been going on all week, came to an end today. Following the rise in US indicators, the Japanese tech sector also showed an increase. Among the Nikkei 225 components, Advantest Corp. gained 7.2%, Kawasaki Kisen Kaisha Ltd. climbed by 7.1% and SCREEN Holdings Co, Ltd. added 5.7%. Toyota Motor Corp. also showed a slight increase by 0.7%., while shares of Honda Motor Co. lost 0.1%. KOSPI's gains boosted the price of shares of such companies as Samsung Electronics Co, Ltd. (+0.8%), Hyundai Motor Co. (+0.8%) and Kia Corp. (+0,8%). Despite a slight rise in the Australian S&P/ASX 200, BHP shares were down by 0.2% and Rio Tinto fell by 0.6%. The material has been provided by InstaForex Company - www.instaforex.com |
| Crypto market advances amid war in Eastern Europe, but future prospects cloudy Posted: 25 Feb 2022 03:59 AM PST On Thursday, BTC closed in positive territory, gaining 11% and reaching $39,800. Earlier, BTC slumped to the low of late January - $34,300. At the moment of writing, the cryptocurrency was trading at $38,627. In November 2021, the leading digital asset reached an all-time high, surpassing $69,000. Since then, BTC has lost 45%. Major altcoins also went up alongside bitcoin. Yesterday, Ethereum rose by 12% to $2,600, Binance Coin added 8% to $360, and XRP gained 10% to $0.69. According to CoinGecko, the cryptomarket's total market cap has increased by 10% to $1.8 trillion. Bitcoin's market cap is now $668 billion.
BTC made gains early on Monday amid the ongoing war in Ukraine. Russia invaded Ukraine after Russian President Putin had recognized the independence of self-proclaimed Donetsk and Lugansk People's Republics. He labelled the Russian action against Ukraine "a special military operation in the Donbass". In response, Western nations threatened to impose heavy sanctions on Russia. According to the head of European Commission Ursula von der Layen, the new sanctions package will seriously limit Russia's access to capital markets. Due to the cryptomarket's unpredictable course, outlooks are mixed. According to analyst Benjamin Cohen, BTC would slump by 50% in the next few months. Cohen pointed out that BTC has very often returned to 200-week MA during the correction phase. It is currently near $20,000. Arthur Hayes, founder of BitMEX, also sees bitcoin dive to $20,000. He does not expect the key support level at $28,000-30,000 to be as strong as other investors think. Sam Bankman-Fried, CEO of FTX, said the crypto market could likely rise steadily as geopolitical tension in Eastern Europe undermines the traditional financial system. The material has been provided by InstaForex Company - www.instaforex.com |


| You are subscribed to email updates from Forex analysis review. To stop receiving these emails, you may unsubscribe now. | Email delivery powered by Google |
| Google, 1600 Amphitheatre Parkway, Mountain View, CA 94043, United States | |


Comments