Forex analysis review
Forex analysis review |
- February 18, 2021 : EUR/USD daily technical review and trading opportunities.
- February 18, 2021 : EUR/USD Intraday technical analysis and trading plan.
- February 18, 2021 : GBP/USD Intraday technical analysis and significant key-levels.
- Morgan Stanley sees ETH investments much riskier than BTC
- US banks fear inflation, asset price deflation and recession
- GBP/USD sell-off starts as 1.3627 resistance holds
- EUR/USD deeper drop expected
- Technical analysis of BTC/USD for February 18, 2022
- Bitcoin upside invalidated
- Bitcoin breaks $40,000, however Pantera Capital believes cryptocurrency market bottoms out: is it true?
- Trading signals for Bitcoin (BTC/USD) on February 18-21, 2022: buy in case of rebound at $40,000 (5/8)
- To be or not to be? Russian authorities debate on cryptocurrency
- Technical analysis of USD/CAD for February 18, 2022
- Trading signals for EUR/USD on February 18-21, 2022: sell below 1.1352 (200 EMA - 2/8)
- An insight into the first half of the year. Forecasts for risky assets
- Euro plays Russian roulette
- Analysis of Gold for February 18,.2022 - Watch for downside rotation on the Gold
- Video market update for February 18,,2022
- NZD/USD: on the eve of the RBNZ meeting
- The weakness of the dollar is determined by the expectations of US statistical data, but the bottom will be reached soon
- BTC analysis for February 18,.2022 - Downside contunation in the play
- USD/JPY analysis for February 18, 2022 - Potential completion of ABC downside correction
- Trading recommendations for novice traders. Outlook for GBP/USD on February 18.
- Technical analysis of GBP/USD for February 18, 2022
- Investors flee from risky assets and prefer gold: how does this relate to Fed's report and what will happen to BTC next?
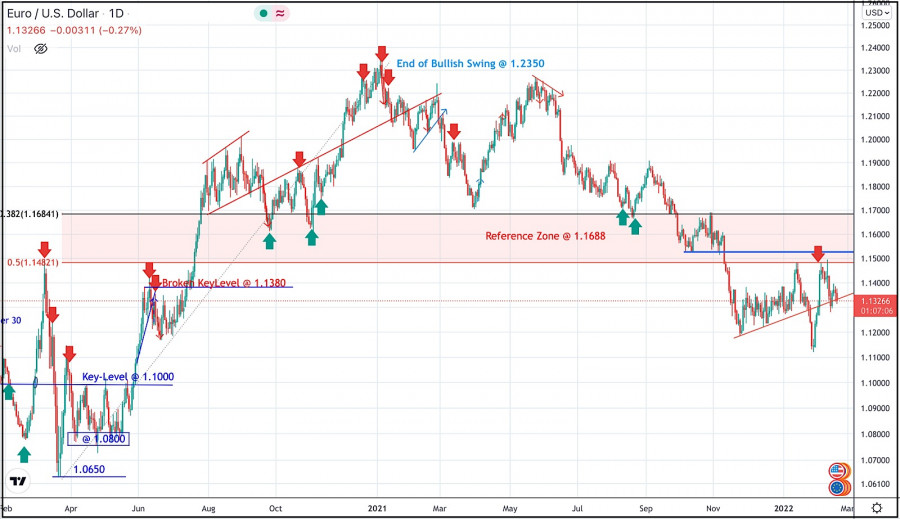
| February 18, 2021 : EUR/USD daily technical review and trading opportunities. Posted: 18 Feb 2022 12:59 PM PST
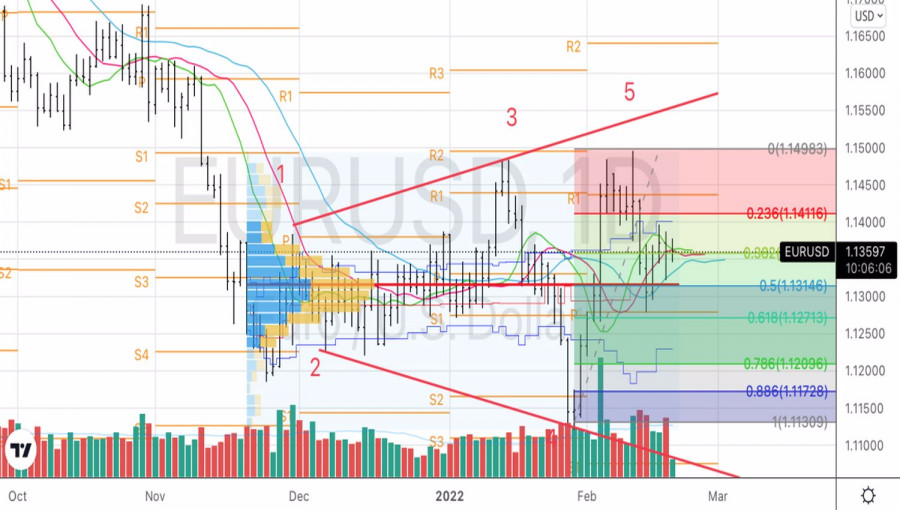
During the past few weeks, the EURUSD pair has been trapped within a consolidation range between the price levels of 1.1700 and 1.1900. In late September, Re-closure below the price level of 1.1700 has initiated another downside movement towards 1.1540. Price levels around 1.1700 managed to hold prices for a short period of time before another price decline towards 1.1200. Since then, the EURUSD has been moving-up within the depicted movement channel until bearish breakout occurred by the end of last week's consolidations. Few weeks ago, the price zone of 1.1350 failed to offer sufficient bearish rejection that's why it was bypassed. On the other hand, the price zone around 1.1500 applied significant SELLING pressure and a possible SELL Entry was offered upon the previous ascending movement. Estimated downside target is located around 1.1145. The material has been provided by InstaForex Company - www.instaforex.com |
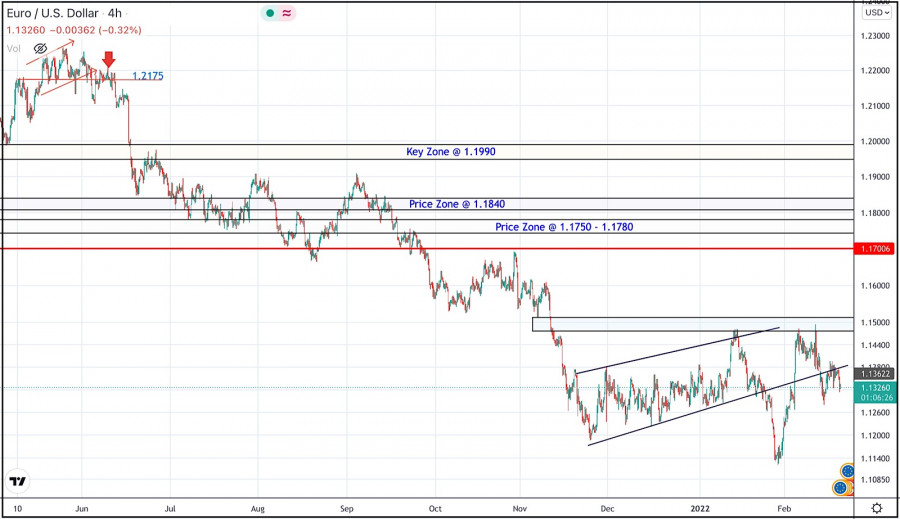
| February 18, 2021 : EUR/USD Intraday technical analysis and trading plan. Posted: 18 Feb 2022 12:58 PM PST
The bullish swing that originated around 1.1650 in August, failed to push higher than the price level of 1.1900. That's why, another bearish pullback towards 1.1650 was executed. However, extensive bearish decline has pushed the EURUSD pair towards 1.1600 and lower levels was reached. Shortly after, significant bullish recovery has originated upon testing the price level of 1.1570. The recent bullish pullback towards 1.1650-1.1680 was expected to offer bearish rejection and a valid SELL Entry. Significant bearish decline brought the EURUSD pair again towards 1.1550 levels which stood as an Intraday Support zone. Hence, sideway movement was demonstrated until quick bearish decline occurred towards 1.1200 where another sideway channel was established. Please note that the current bullish movement above 1.1300-1.1350 should be considered as a sign of bullish strength in the meanwhile. On the other hand, the price levels around 1.1520 stands as a reference zone that provides a valid SELL Entry when bullish momentum fades away. Bearish decline below 1.1300 should be considered as a bearish continuation sign. If so, downside movement should be expected to proceed towards 1.1000. The material has been provided by InstaForex Company - www.instaforex.com |
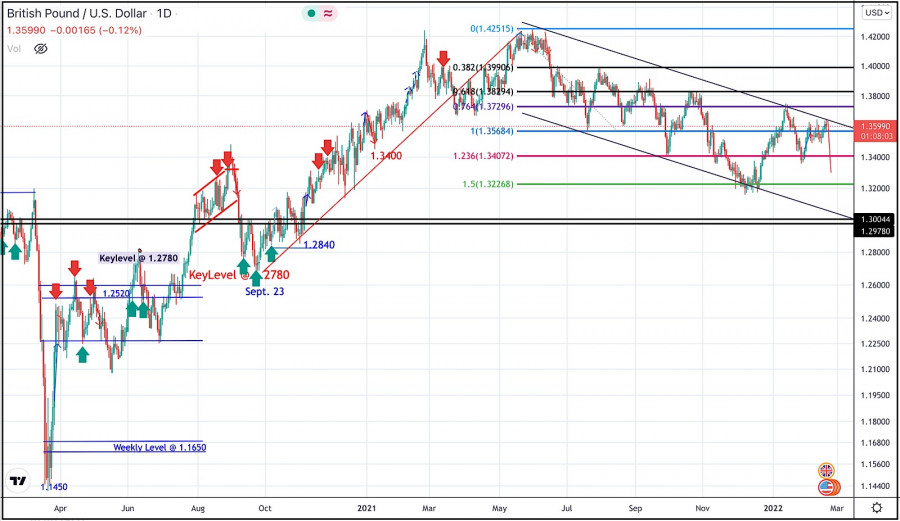
| February 18, 2021 : GBP/USD Intraday technical analysis and significant key-levels. Posted: 18 Feb 2022 12:57 PM PST
The GBPUSD pair has been moving within the depicted bearish channel since July. Bearish extension took place towards 1.3220 where the lower limit of the current movement channel came to meet with Fibonacci level. Conservative traders should have taken BUY trades around 1.3200 price levels as suggested in previous articles. Recent bullish breakout off the depicted bearish channel has occurred few days ago. However, BUYERS were watching the price levels of 1.3730 to have some profits off their trades. Moreover, the price level of 1.3720 stood as a key-resistance which offered significant bearish rejection recently. Shortly after, the short-term outlook turned bearish when the market went below 1.3600. This enhanced the bearish side of the market towards 1.3400 which brought the pair back towards 1.3600 for retesting. Hence, the current bullish pullback towards 1.3600 should be considered for SELL trades as it corresponds to the upper limit of the ongoing bearish channel. Any bullish breakout above 1.3700 should be considered as exit signal. The material has been provided by InstaForex Company - www.instaforex.com |
| Morgan Stanley sees ETH investments much riskier than BTC Posted: 18 Feb 2022 10:43 AM PST
Ethereum is a much riskier investment tool than Bitcoin according to Morgan Stanley analysts who expressed their opinion about the prospects of the two biggest cryptocurrencies. Morgan Stanley sees ETH investments as riskier ones because it expects Ethereum to weaken and lose the battle against other blockchains such as BNB Chain, Solana, Cardano. In the latest Wealth Management report, the bank noted that putting money in Ethereum is a financial threat unlike investments in digital gold. The competitive struggle between dominating blockchains is getting tougher. Such projects as Solana, Cardano, or BNB Chain can turn out to be stronger than Ethereum, so the latter one may suffer big losses. Ethereum loses many points to its competitors: its scalability is poor, its blockchain is outdated, and the service is quite costly for new users. Moreover, Ethereum is less decentralized compared to Bitcoin. The report by Morgan Stanley also suggests that Ethereum risks losing the smart-contracts market share as other platforms such as Solana and Cardano offer more convenient and fast solutions for investors. Exorbitant commissions in the Ethereum blockchain scare new users off working on this platform. This fact also poses a risk to future demand and ETH scalability. As of February 18th, ETH quotes declined again to 2,800 USD. Ethereum is unlikely to attract new investors unless it issues a new proof-of-stake protocol and updates the platform to version 2.0. Moreover, it risks losing its existing users who may opt for Solana or Cardano. The material has been provided by InstaForex Company - www.instaforex.com |
| US banks fear inflation, asset price deflation and recession Posted: 18 Feb 2022 10:16 AM PST Wall Street's biggest banks sounded a warning over the year ahead on Thursday, citing high inflation, credit concerns, asset price depreciation and companies postponing deals due to market uncertainty. |
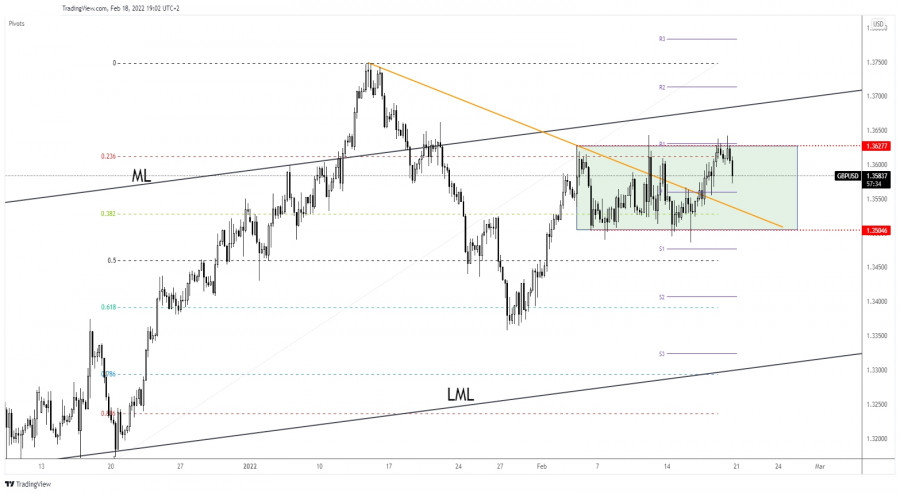
| GBP/USD sell-off starts as 1.3627 resistance holds Posted: 18 Feb 2022 09:47 AM PST GBP/USD plunges at the time of writing as the Dollar Index has managed to rebound. As you already know from my analysis, when DXY grows, the USD appreciates versus its rivals. The currency pair climbed as high as 1.3642 today where it has found resistance. Surprisingly or not, the pound drops despite the fact that the UK Retail Sales rose by 1.9% versus 1.1% growth expected. On the other hand, the US data came in mixed. The Existing Home Sales indicator was reported at 6.50M versus 6.10M expected, while the CB Leading Index dropped by 0.3%. GBP/USD range pattern
Technically, the pair moves sideways between 1.3504 and 1.3627 levels. As you can see, the rate registered only false breakouts through 1.3627 static resistance and now it has turned to the downside. In the short term, the pair could extend its sideways movement. Only a valid breakout from the current range could bring great trading opportunities and a clear direction. GBP/USD Outlook!A temporary drop followed by a valid breakout through the 1.3627 could announce an upside continuation. After its false breakouts, GBP/USD could come back down towards the former downtrend line and towards the range's support of 1.304. A valid breakdown through this level could bring new selling opportunities. The material has been provided by InstaForex Company - www.instaforex.com |
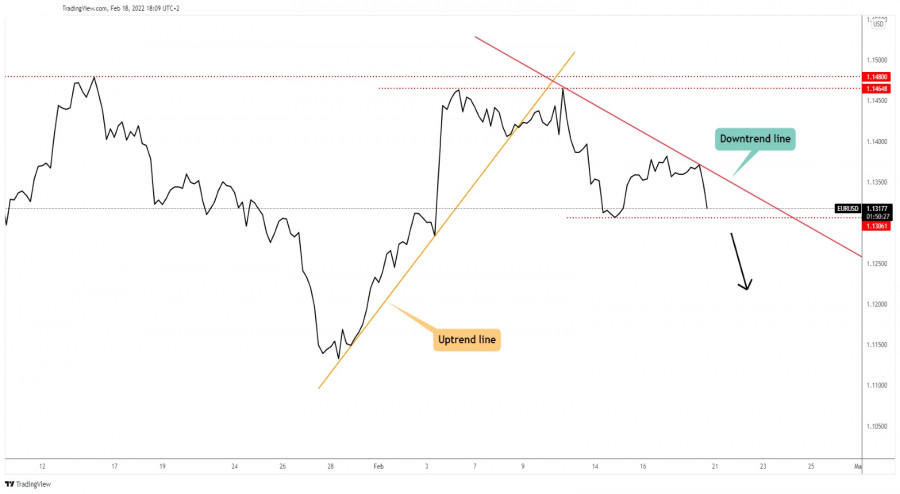
| Posted: 18 Feb 2022 08:51 AM PST
EUR/USD new downtrendThe EUR/USD pair was dropping at the time of writing. As you already know from my previous analysis, the currency pair could decline deeper despite temporary rebounds. Personally, I've drawn a downtrend line. As long as EUR/USD stays under this line, it could drop deeper towards new lows. The 1.1306 former low stands as a static downside obstacle. If the price drops and stabilizes below, it could announce a downside continuation. EUR/USD trading conclusionA larger downside movement could be confirmed if EUR/USD drops and stays below 1.1306 former low. This is seen as a selling opportunity as well. The material has been provided by InstaForex Company - www.instaforex.com |
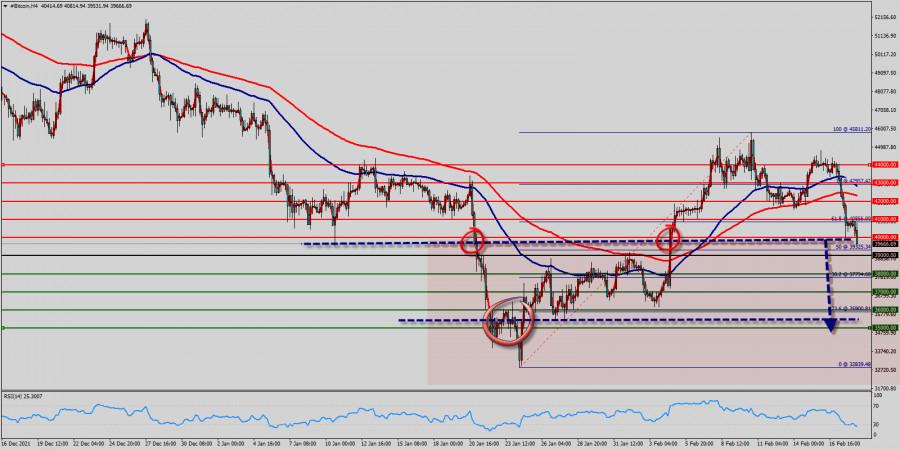
| Technical analysis of BTC/USD for February 18, 2022 Posted: 18 Feb 2022 08:26 AM PST
BTC/USD increased within a down channel from the prices of $42,000 and $41,000 since a week. The bears must break through $40,000 in order to resume the downtrend. After finding asks reach to $40,000, bitcoin price recovered below $42,000 and $41,000. Initial Bitcoin support level lies near the $40,000 price ($39,325 : 50% of Fibonacci retracement levels). A decent breakout and follow-down move below $40,000 could open the gate for a push towards the $37,794 price ($37,794 : 38.2% of Fibonacci retracement levels). The main resistance remains near the area of $42,000 and $41,000. Also it should be noted that Bitcoin and cryptocurrencies unite as the bears lose their momentum. The market is indicating a bearish opportunity below the above-mentioned resistance levels, for that the bearish outlook remains the same as long as the 100 EMA is headed to the downside. Signals : Sell orders are recommended below the area of $42,000 and $41,000 with the first target at the level of $37,794 ; and continue towards $35,000. On the other hand, if Bitcoin fails to break out through the support level of $40,000; the market will rise further to the level of $45,811 (weekly resistance, double top, the last bullish wave - high price : $45,811 - 100% of Fibonacci retracement levels). The material has been provided by InstaForex Company - www.instaforex.com |
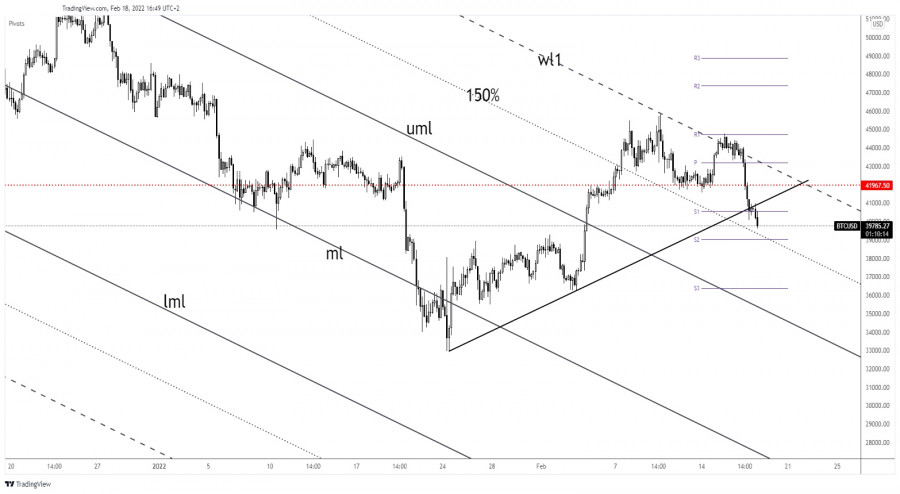
| Posted: 18 Feb 2022 08:05 AM PST Bitcoin drops like a rock at the time of writing after failing to activate further growth. It's traded at 40,465 level above 39,626 today's low. BTC/USD dropped by 11.52% from 44,785 Tuesday's high to 39,626 daily low. Unfortunately, the price action signaled exhausted buyers and a potential downside movement. In the last 24 hours, BTC/USD is down by 4.71% and by 8.57% in the last 7 days. Bitcoin's sell-off forced the altcoins to drop as well. BTC/USD could bring new selling opportunities if it comes back to test and retest the immediate resistance levels. BTC/USD Uptrend Line Breakout!
BTC/USD found resistance at the first warning line (wl1) of the descending pitchfork. It has ignored the 41,967 static support and the uptrend line signaling that the upside movement ended. As you can see, BTC/USD is almost to reach the 150% Fibonacci line which represents dynamic support. So, coming back to test and retest the uptrend line and the warning line (wl1) could announce a larger drop. BTC/USD Outlook!Bitcoin registered a valid breakdown below the uptrend line signaling that the swing higher ended. As long as it stays below the warning line (wl1), BTC/USD could move towards new lows. A valid breakdown below the 150% Fibonacci line could announce and activate a sharp drop. Technically, the breakdown below the uptrend line could be seen as a short opportunity. The material has been provided by InstaForex Company - www.instaforex.com |
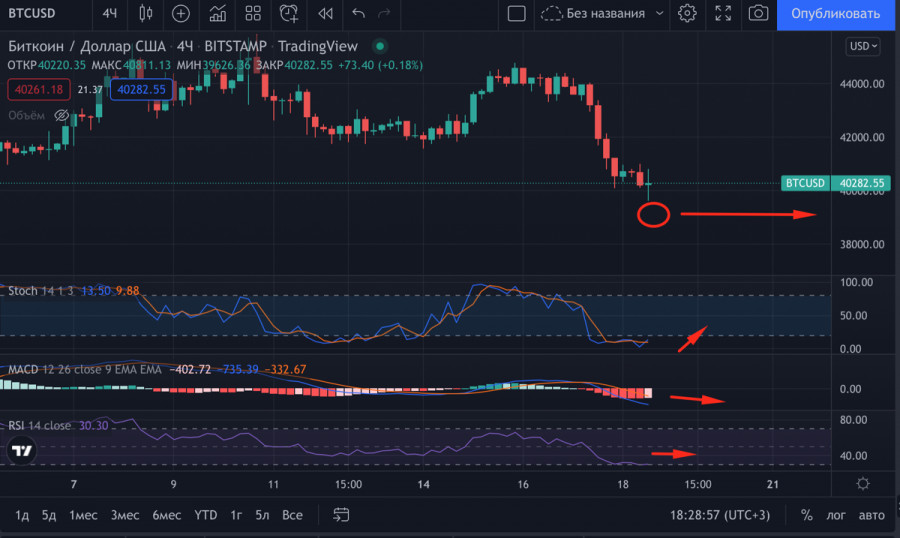
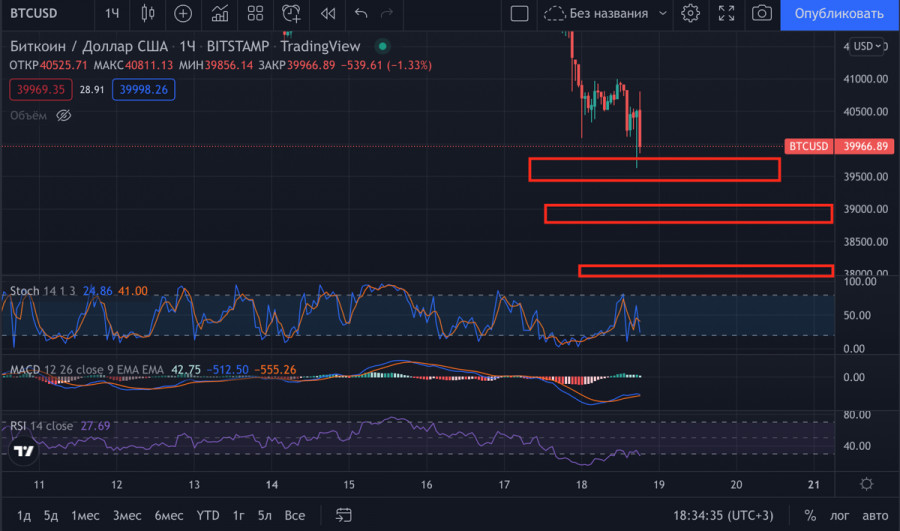
| Posted: 18 Feb 2022 08:03 AM PST Today, the cryptocurrency market made a slight pullback, triggered by the tense geopolitical situation and the numerous references to digital assets in the Fed report. Bitcoin managed to find the support at $40,000 and stop the fall of the whole cryptocurrency market. However, at the beginning of the American trading session, the asset began to decline again and broke the level of $40,000. As of 17:30, the coin reached the local low of $39,700. Subsequently, buyers displaced the bears and the price again climbed to $40,000. The technical indicators show some signs of bullish weakness as the RSI is approaching the 40 mark on the four-hour chart, though it was much higher. This fact indicates an increase in selling due to the start of the American trading session.
At the same time, the stochastic has reversed, forming a bullish cross on the 4H timeframe. This indicates the appearance of a buyer, who is trying to defend the boundary of $40,000. However, the price will likely continue to decline today. The nearest target levels are $39,600, $39,000 and $38,200. Doubts about bitcoin to hold the level of $40,000 are due to the general market sentiment. Investors prefer the US dollar and gold during increased global volatility.
Although the trading day is not over, it is possible to draw several major conclusions. The figure of technical analysis Head & Shoulders, mentioned by traders, was broken during the breakout of $41,000. The price failed to break the level of the shoulders, indicating that the current pattern, as well as the target of $56,000 are not relevant. The second important conclusion is related to the investors' sentiment. During the last two weeks the investors' actions are significantly affected by the macroeconomic situation. This fact suggests that large direct investments in cryptocurrencies and bitcoin are unlikely in the next few weeks. Precious metals and safer financial instruments will become top priority. At the same time, there is an outflow of funds from altcoins and their conversion into stable coins like USTD or USDC. Taking into account these facts, it is possible to assume that the main cryptocurrencies will update their local lows.
Moreover, Pantera Capital executives are confident that the cryptocurrency market has already bottomed out and a dramatic decline is unlikely. Investment Director Joey Krug said that cryptocurrencies showed a high level of correlation with the classic markets for nearly 70 days and then they gradually became volatile. Therefore, the entrepreneur is confident that the cryptocurrency market will resume its growth in a few weeks. Joey Krug's position is supported by the historical context of the market, which makes it undeniable. At the same time, the current macroeconomic situation has a more profound impact on investors' behavior, and its scale is unprecedented. Besides, in a few weeks, on March 16, the Fed will hold a meeting to raise the key interest rate. The rate hike can be negative for the market. However, short-term pessimism is possible. Therefore, the forecast of Panter Capital executives is true, adjusted for the global situation and the Fed policy. Overall, the situation in the cryptocurrency market is complicated. Major coins are declining following bitcoin, which in turn follows stock indices. Taking into account the external factors, the situation will not change dramatically in the near future. Besides, another pessimistic scenario is most likely in the cryptocurrency market. The material has been provided by InstaForex Company - www.instaforex.com |
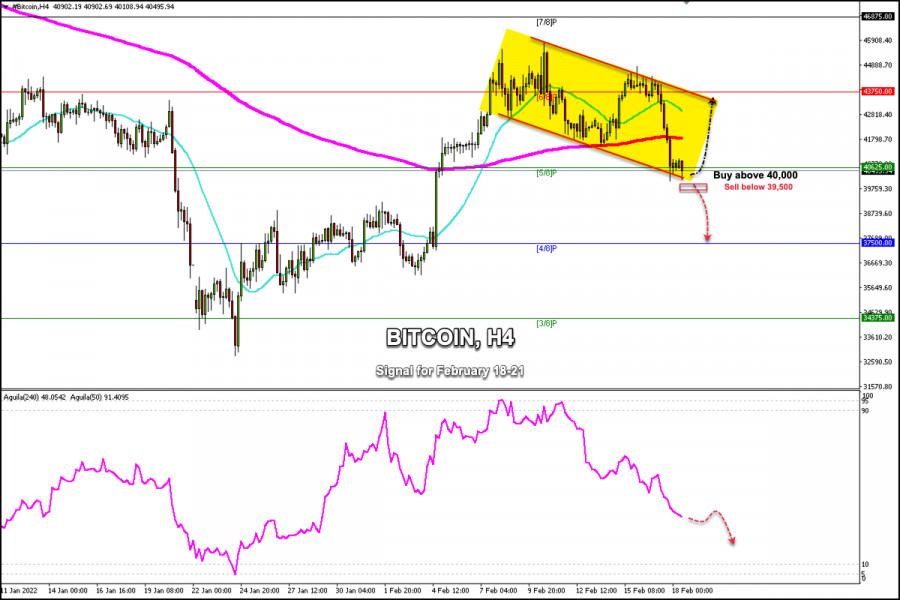
| Posted: 18 Feb 2022 07:56 AM PST
Bitcoin price is consolidating around 5/8 Murray and below the 200 EMA and below the 21 SMA with a slightly bearish bias. Since February 10, BTC has formed a downtrend channel when it reached the high of 45,811. Since then, it continues with a technical correction and is now approaching the psychological level of $40,000. Bitcoin price is currently correcting after failing to break through the 200 EMA on the daily chart located at 46,330. Bitcoin price made a 40% gain between Jan 24 and Feb 10 and tested the weekly supply zone that stretches from 45,500 (7/8) to 51,860 (8/8). This led BTC to drop forming a bearish channel on the 4-hour chart. The recent rejection at the weekly resistance zone is likely to push BTC lower to the demand zone. A daily close below 39,500 will cause an acceleration to the downside towards 4/8 Murray at 37,500 and drop as low as 34,375. The eagle indicator is giving a negative signal and the downward pressure is likely to continue in the coming days. On the other hand, a technical bounce above the psychological level of 40,000 could ease the decline. Our trading plan for the next few hours is to wait for a technical bounce around the psychological level $40,000 to buy with targets at 41,798 and 43,500 below Murray's 6/8. Support and Resistance Levels for February 18 - 21, 2022 Resistance (3) 43,750 Resistance (2) 43,157 Resistance (1) 41,661 ---------------------------- Support (1) 40,503 Support (2) 38,768 Support (3) 37,500 *********************************************************** Scenario Timeframe H4 Recommendation: buy if rebound Entry Point 40,000 Take Profit 41,798; 43,500 Stop Loss 39,300 Murray Levels 43,750 (6/8), 40,625(5/8), 37,500 (4/8), 34,375(3/8) *************************************************************************** The material has been provided by InstaForex Company - www.instaforex.com |
| To be or not to be? Russian authorities debate on cryptocurrency Posted: 18 Feb 2022 07:43 AM PST The Bank of Russia's initiative to restrict cryptocurrency trading and mining, as it could lead to financial instability, caused a hot dispute. The Ministry of Finance is among those who disagree. Nevertheless, a compromise has not yet come to light. According to Anton Siluanov, Minister of Finance, he believes that the controversy will be resolved and the bill to regulate cryptocurrencies will be approved by the end of the year. He also mentioned that the Ministry of Finance offers to identify crypto traders, thus making this business more clear and honest. However, this point is quite controversial, as one of the advantages of cryptocurrencies is their anonymity, which is lost with providing law enforcement with data of money transactions. In its turn, the Central Bank disagrees with the proposal of the Ministry of Finance on legalization and stands firm on the position of a complete ban on cryptocurrency operations. The bank has previously blamed speculative demand for the rapid growth of cryptocurrencies and warned of potential bubbles in the market. The material has been provided by InstaForex Company - www.instaforex.com |
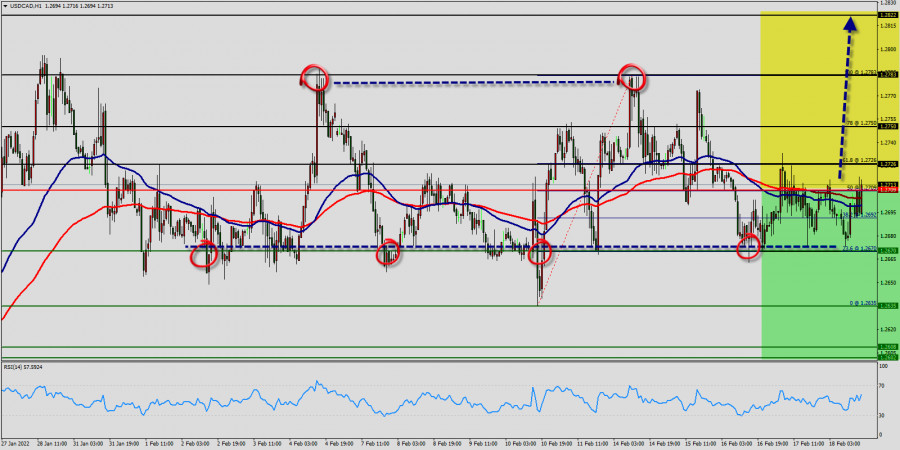
| Technical analysis of USD/CAD for February 18, 2022 Posted: 18 Feb 2022 07:37 AM PST
The USD/CAD pair movement was debatable as it took place in a narrow sideways channel for a while. The market showed signs of instability. Amid the previous events, the price is still moving between the levels of 1.2670 and 1.2750. The daily resistance and support are seen at the levels of 1.2750 and 1.2670 respectively. In consequence, it is recommended to be cautious while placing orders in this area. Thus, we should wait until the sideways channel has completed. On the H1 chart, the price spot of 1.2783 or/and 1.2750 remains a significant resistance zone. Therefore, there is a possibility that the USD/CAD pair will move to the downside and the fall structure does not look corrective. Resistance is seen at the level of 1.2750 today. So, sell below 1.2750 with the first target at 1.2670 to test yesterday's bottom. In overall, we still prefer the bearish scenario as long as the price is below the level of 1.2750. Furthermore, if the USD/CAD pair is able to break out the bottom at 1.2670, the market will decline further to 1.2635. However, it would also be sage to consider where to place a stop loss; this should be set above the second resistance of 1.2822. The material has been provided by InstaForex Company - www.instaforex.com |
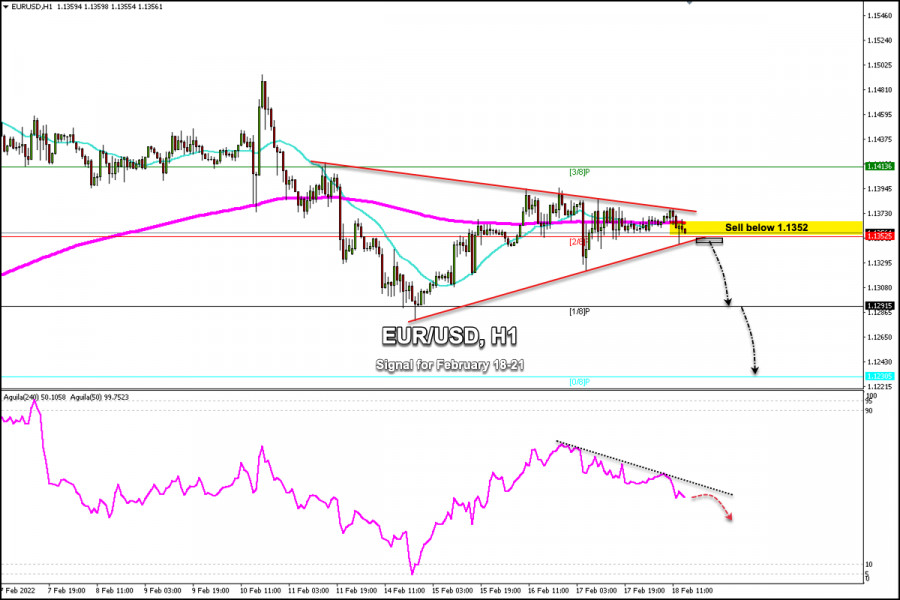
| Trading signals for EUR/USD on February 18-21, 2022: sell below 1.1352 (200 EMA - 2/8) Posted: 18 Feb 2022 07:29 AM PST
The EUR/USD pair is trading within a rising wedge below the 200 EMA with a slight bearish bias. During these last few days, the Euro was trading in a range of 1.1350-1.1400 versus the US dollar. A sharp break above one of these levels could determine its next short-term direction. Further escalation of geopolitical tensions could make it difficult for EUR/USD to rise above 3/8 Murray (1.1413). At the same time, a negative change in risk sentiment could provide a boost to the dollar that could push EUR/USD lower, falling towards the support 1/8 Murray at 1.1291 and reaching 0/8 Murray at 1.1230. On the upside, 1.1413 will be your next resistance to challenge. A daily close above 3/8 could accelerate the move higher towards 4/8 Murray at 1.1494. The market sentiment for EUR/USD shows that there are 48.75% of traders who are buying the pair. This is a mixed signal and the euro is likely to continue trading between the range zone of 1.1291 (1/8) to 1.1416 (3/8) in the coming days. Our trading plan for the next few hours is wait for a sharp break below 1.1352 and below 2/8 Murray with targets at 1.1291 and 1.1230. The eagle indicator supports our bearish strategy as it is giving a negative signal. Support and Resistance Levels for February 18 - 21, 2022 Resistance (3) 1.1449 Resistance (2) 1.1413 Resistance (1) 1.1389 ---------------------------- Support (1) 1.1352 Support (2) 1.1291 Support (3) 1.1262 *********************************************************** Scenario Timeframe H4 Recommendation: sell below Entry Point 1.1352 Take Profit 1.1291; 1.1230 Stop Loss 1.1387 Murray Levels 1.1413 (3/8), 1.1352(2/8), 1.1291 (1/8), 1.1230(0/8) *************************************************************************** The material has been provided by InstaForex Company - www.instaforex.com |
| An insight into the first half of the year. Forecasts for risky assets Posted: 18 Feb 2022 07:09 AM PST With the uncertainty in the monetary policy framework, one should be ready for volatility in risky assets through the first half of the year, and then for equity gains in the second half of the year. Some experts believe markets will adapt to a rate hike, but it will take more time to embrace quantitative tightening because of the withdrawal of monetary stimulus. As of December 2020, GIAM had €470 billion ($534 billion) in assets. It is expected things regarding the actions of central banks will get more stable by the second half of the year. From this perspective, asset managers consider it worth buying value stocks (energy, banks, the ones that will benefit from economic rebounding after the pandemic, etc.) as well as long-dated bonds, as yields from these types of assets are rising as well. However, you need to be careful and examine the market thoroughly, as increased volatility puts pressure on spreads on high-yield and investment grade debts. Kevin Headland, co-chief investment strategist at Manulife Investment Management, said it was important to consider central banks were not "raising rates from 'normal' levels to combat an overheated economy or runaway inflation". According to the minutes of the Jan. 25-26 policy meeting, Fed officials are not set on any particular pace of rate hikes. The Fed is expected to manage demand-side risks with a cycle of rate hikes, as U.S. inflation expectations are very high. Experts think that in this case the central bank will raise rates much faster than before. The material has been provided by InstaForex Company - www.instaforex.com |
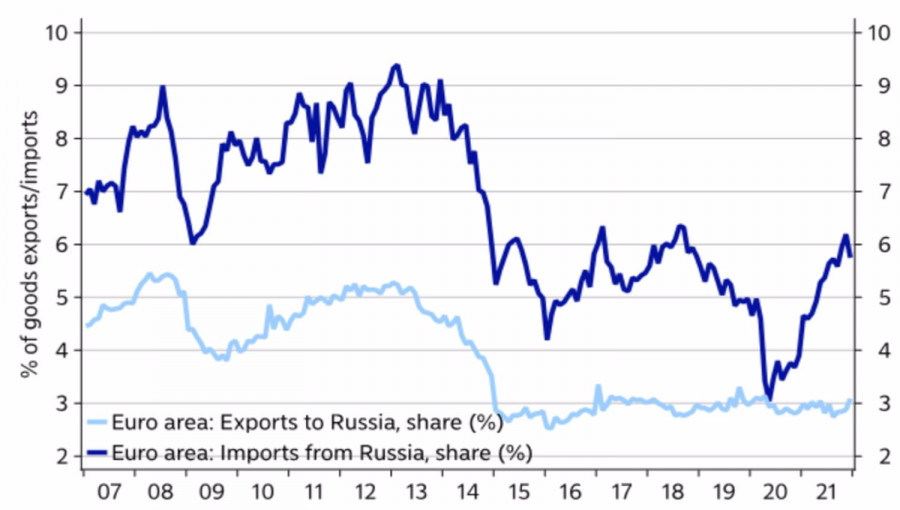
| Posted: 18 Feb 2022 06:04 AM PST As long as the financial markets continue to play Russian roulette, EURUSD bulls cannot take advantage of the trump card that Christine Lagarde gave them after the February meeting of the ECB. And even though Lagarde, after her historic speech at a press conference, has already spoken several times about patience, investors cannot be deceived. They sensed the hawkish shift of the European Central Bank and are ready to buy the euro. Alas, but so far the "bulls" on the main currency pair are hindered by events in Eastern Europe. Despite the fact that the share of Russian exports and imports in the structure of foreign trade of the eurozone is negligible, the currency bloc and Europe as a whole are highly dependent on gas supplies from this country. At the same time, the start of hostilities in Ukraine should be regarded as a double-edged sword for the euro. On the one hand, the higher the cost of blue fuel rises, the stronger the energy crisis will hit the economy of the currency bloc. Its slower dynamics compared to the US will contribute to the flow of capital from the Eurozone to the Americas, which will ultimately result in a fall in EURUSD. Dynamics of the share of foreign trade of the eurozone with Russia
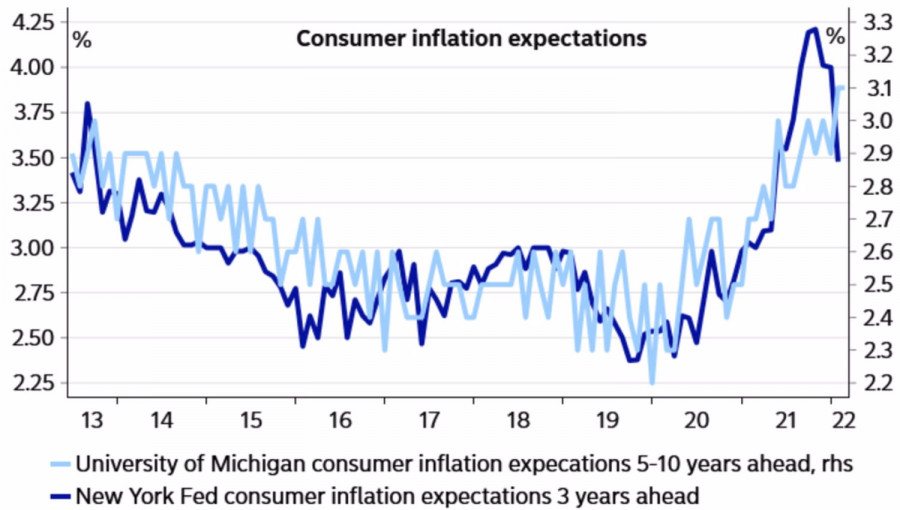
On the other hand, the higher the cost of gas, the higher the inflation in the euro area. And even though historically, central banks did not pay attention to energy prices when making decisions on monetary policy adjustments, today the situation is different. A further rise in CPI will increase inflationary expectations, making high inflation a self-fulfilling prophecy. The Fed realized this a long time ago, so FOMC officials armed themselves with hawkish rhetoric. The latter helped bring down inflationary expectations in the US. Dynamics of inflation expectations in the USA
No matter how the colleagues from Washington go in Frankfurt, which will be a weighty argument in favor of strengthening the euro. ECB Chief Economist Philip Lane is already saying eurozone consumer prices are unlikely to fall below 2% over the next two years and talks about normalizing the ECB's monetary policy. Yes, the words "patience" and "consistency" slip through his speech, but the very fact that a person who was previously confident in reducing inflation to 1.7%-1.8% in 2023 has now changed his position plays into the hands of "bulls" on EURUSD. The focus of investors in the week to February 25 will be the talks between the US and Russia on the situation in Eastern Europe, as well as a massive block of macroeconomic statistics for the euro area, including business activity from Markit and business climate from IFO. The euro clearly needs a fresh driver to continue the upward campaign, and the combination of the de-escalation of the Russian-Ukrainian conflict and the positive from the economy of the currency bloc can create a tailwind for the bulls in the main pair. Technically, on the daily chart, EURUSD continues to win back the Broadening Wedge pattern. The reason for buying the euro against the US dollar will be a confident assault on resistance at 1.1395 (local maximum), 1.1415 (23.6% Fibonacci retracement from wave 4-5), and 1.1435 (pivot level), as well as a rebound from support at 1.1315 and 1.1275 (50% and 61.8% Fibonacci from wave 4-5). EURUSD, Daily chart
|
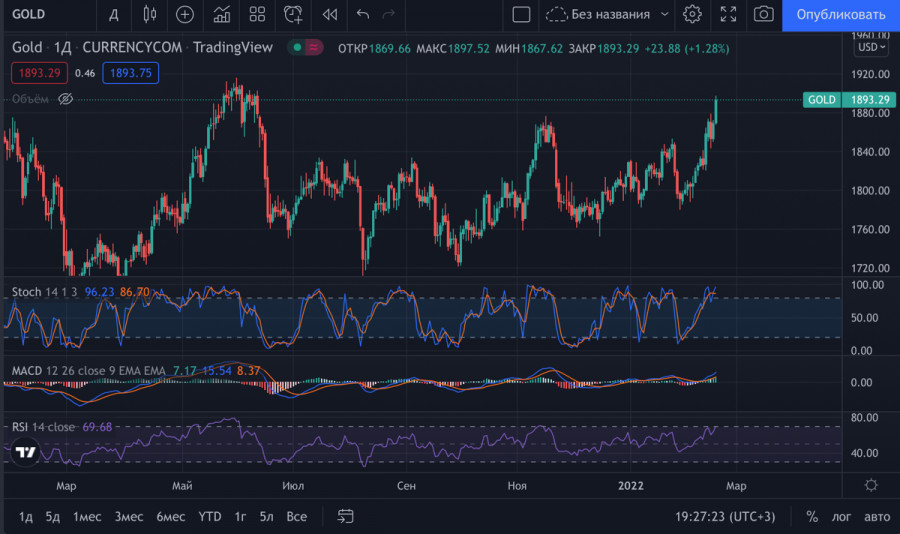
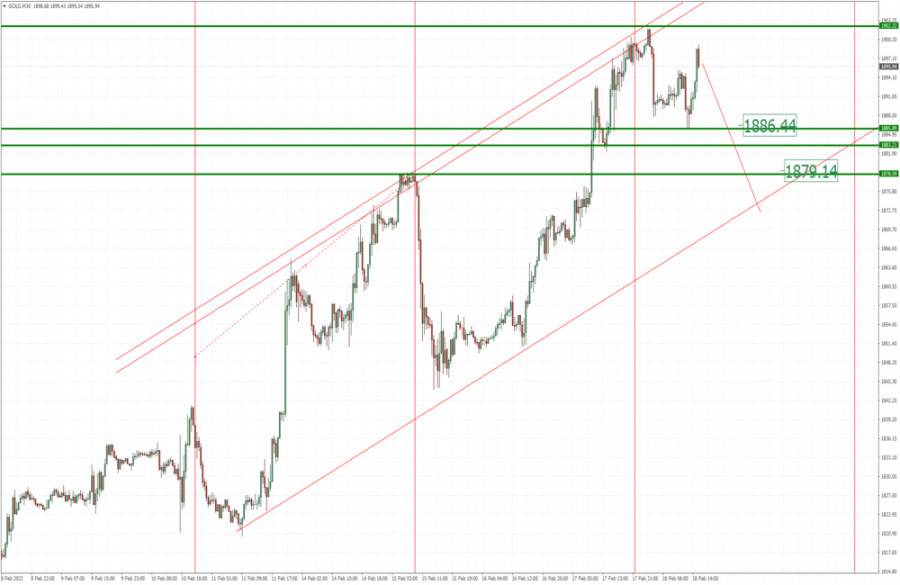
| Analysis of Gold for February 18,.2022 - Watch for downside rotation on the Gold Posted: 18 Feb 2022 06:00 AM PST Technical analysis:
Gold has been trading upside this morning but I see potential for the downside correction towards lower references. Trading recommendation: Due to potential overbought condition and extreme high reading, I see potential for the downside correction and rotation. My advice is to watch for selling opportunities with the downside objectives at $1,886 and $1,879. Resistance is set at the price of $1,901 The material has been provided by InstaForex Company - www.instaforex.com |
| Video market update for February 18,,2022 Posted: 18 Feb 2022 05:54 AM PST Watch for upside opportunities on the USD/JPY....The material has been provided by InstaForex Company - www.instaforex.com |
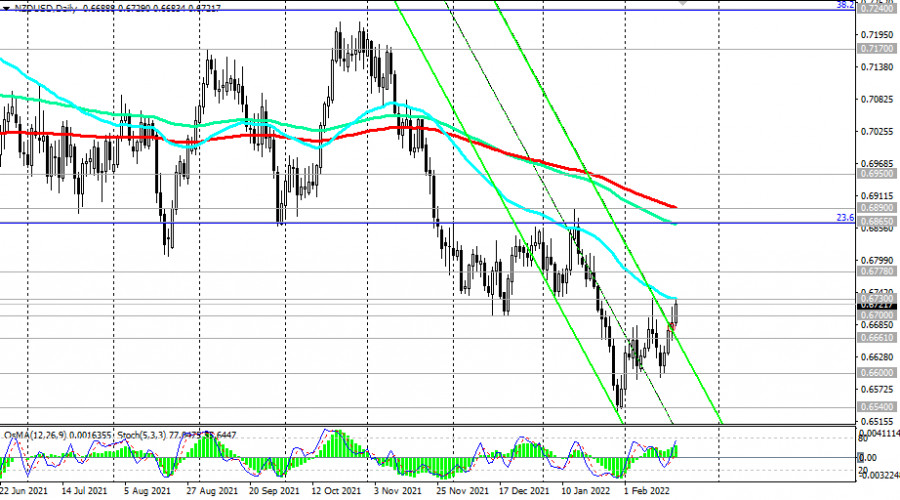
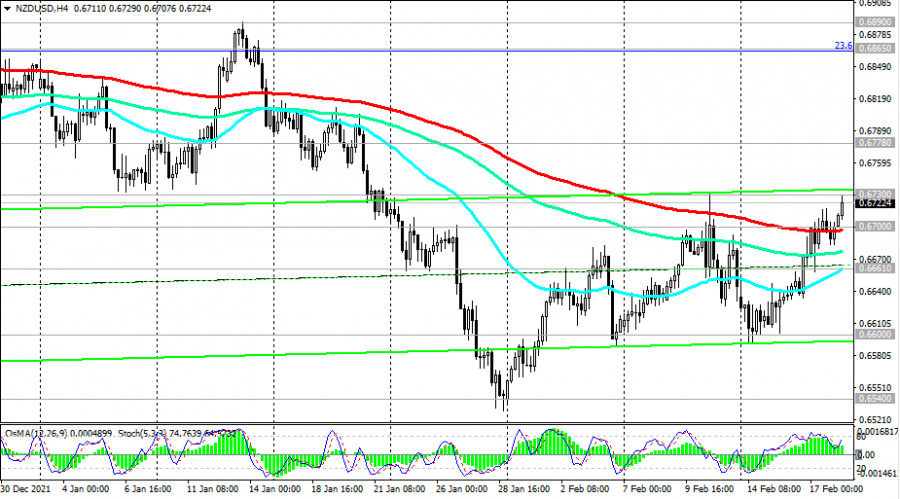
| NZD/USD: on the eve of the RBNZ meeting Posted: 18 Feb 2022 05:12 AM PST Following the meetings held in October and November, the Reserve Bank of New Zealand (for the first time in 7 years) raised the key interest rate to 0.50%, and then to 0.75%. The rate was raised to ease inflation and curb rapidly rising house prices. Earlier, the RBNZ stated that the economy no longer needs the current level of monetary stimulus. Despite the interest rate hike, the New Zealand dollar weakened, including against the US dollar, after the publication of the Reserve Bank of New Zealand's forecast for the short-term interest rate, which did not meet market expectations. RBNZ executives said at the time that they now intend to take a wait-and-see attitude to assess the impact on the economy from the interest rate decision, and this seems to have disappointed investors. Usually, an increase in the interest rate has a positive effect on the quotes of the national currency. However, in this case, the market reaction was the opposite. The NZD declined shortly after the publication of the RBNZ's decision to raise the interest rate. The conclusion is that this increase was already embedded in prices, and the restrained position of the RBNZ management regarding the future prospects of monetary policy disappointed investors. The bank predicted that the rate would peak at 2.6% by the end of 2023 (the previous forecast of the Central Bank assumed that the rate would reach 2.1% by the beginning of 2024). Nevertheless, the forecast turned out to be weaker than expected by the market expectations reflected in the quotes, against the background of various risks and uncertainty of economic prospects. The New Zealand dollar is also negatively affected by the dynamics of the country's GDP. There was a drop in GDP in the 3rd quarter by -3.7% (after an increase of +2.8% in the 2nd quarter of 2021). Data for the 4th quarter will be published in mid-March 2022, and here, too, economists do not expect strong growth.
The NZD/USD pair has been mostly declining for the previous 3 months and at the end of January, it reached a local 16-month low near the 0.6530 mark. However, this month the NZD/USD is growing, including due to the weakening of the US dollar. The minutes of the Fed's January meeting published earlier this week weakened expectations of a more aggressive tightening of the US central bank's policy. After last week, the US Department of Labor reported another increase in consumer inflation in the country (the consumer price index (CPI) in January increased by +7.5% (in annual terms) after an increase of 7.0% in December). Talk intensified that Fed officials could raise the interest rate at the March meeting by 50 basis points at once. Some market participants and economists even assumed that the Fed's interest rate would be raised another 5-7 times this year. However, the minutes of the meeting of the Open Market Committee does not confirm this: they only repeat that decisions to tighten policy will be considered from meeting to meeting. Nevertheless, the intrigue around the actions of the Fed remains, and before the next meeting on March 15-16, its leaders still have enough time to make further adjustments to their plans for monetary policy. On Thursday, Fed officials and FOMC members James Bullard and Loretta Mester spoke in favor of tougher measures. Bullard is in favor of raising the key rate by 1 percentage point by July, as well as starting to reduce the Fed's asset portfolio, which is close to $9 trillion, in the 2nd quarter. Although, other members of the Fed leadership do not share his opinion. Minneapolis Fed President Neel Kashkari said, "If we raise rates too aggressively, we risk a sharp slowdown in the economy, plunge it into a recession, and possibly return it to where it was before the pandemic, when inflation was too weak." At the time of writing, the NZD/USD pair is trading near the 0.6721 mark, coming close to the strong resistance level of 0.6730. The pair received support yesterday after the publication of weak data from the US on the dynamics of claims for unemployment benefits. The number of initial applications in the previous reporting week increased to 248K (against the forecast of 219Kand the previous value of 225K). While the views of the Fed leadership regarding the pace of interest rate increases are divided, the RBNZ leadership is pursuing a more transparent policy. Next week the next meeting of the RBNZ will take place, during which, as expected, its interest rate will be raised again to 1.0%. Thus, the RBNZ is becoming a leader in the process of tightening monetary policy among other major world central banks, and this can become a strong and main driver for strengthening the NZD in the next few weeks, although here too much will depend on the current economic situation in the country and in the world. As a reminder, the decision of the RBNZ on the interest rate will be published on Wednesday at 01:00 (GMT). Technical analysis and trading recommendations
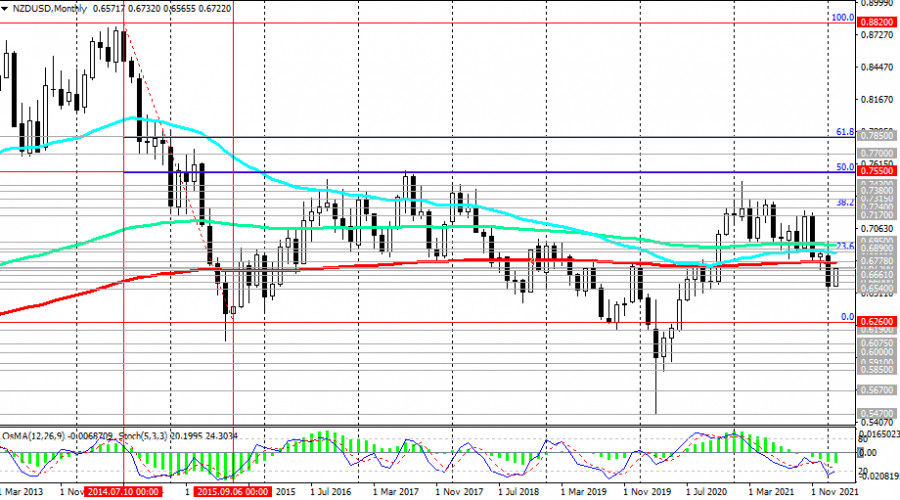
Despite the growth observed since the beginning of this month, NZD/USD remains in the bear market zone, trading below the key resistance levels of 0.6865 (200 EMA on the weekly chart and the 23.6% Fibonacci retracement level in the global wave of the pair's decline from the level of 0.8820), 0.6890 (200 EMA on the daily chart).
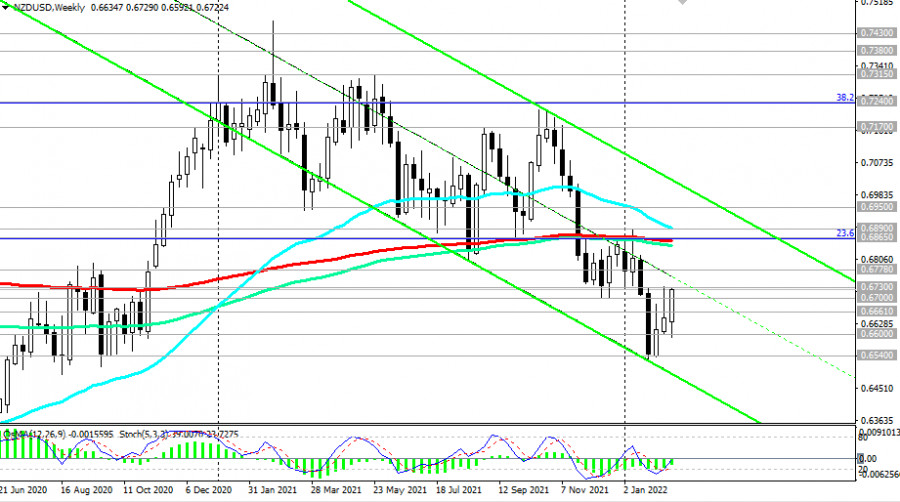
In January, NZD/USD hit a new 16-month low at 0.6540. However, there was no further decline, and the pair corrected, breaking through the important resistance level 0.6700 (200 EMA on the 4-hour chart and December lows) and coming close to the resistance level 0.6730 (50 EMA on the daily chart).
The zone of levels 0.6700 and 0.6730 is a fairly strong resistance zone, for the breakdown of which and further growth, the NZD/USD pair will need solid grounds and fairly strong drivers. Until Wednesday, when the RBNZ meeting takes place, they are unlikely to appear, unless, of course, sellers of the US dollar want to lower its quotes in the thin market on Monday, when US banks and exchanges will be closed on the occasion of Presidents Day. In this case, and after the meeting of the RBNZ on Wednesday, the NZD/USD has the prospect of growth towards the key resistance levels of 0.6865, 0.6890. In an alternative scenario, and after the breakdown of the support level of 0.6700, NZD/USD will head towards the local support levels of 0.6600, 0.6540 with the prospect of a deeper decline within the descending channel on the weekly chart. In the current situation, the determining factor in the dynamics of NZD/USD is likely to be the course of the monetary policy of the central banks of the United States and New Zealand. And, most likely, the conditional "scale" will tilt towards the currency of the country whose central bank takes a tougher stance. In general, the downward dynamics of NZD/USD is still prevailing. Support levels: 0.6700, 0.6661, 0.6600, 0.6540, 0.6500 Resistance levels: 0.6730, 0.6780, 0.6865, 0.6890, 0.6950, 0.7100, 0.7170, 0.7240, 0.7315, 0.7380, 0.7430, 0.7550, 0.7600 Trading recommendations Sell Stop 0.6680. Stop-Loss 0.6735. Take-Profit 0.6660, 0.6600, 0.6540, 0.6500, 0.6260 Buy Stop 0.6735. Stop-Loss 0.6680. Take-Profit 0.6780, 0.6865, 0.6890, 0.6950, 0.7100, 0.7170, 0.7240, 0.7315, 0.7380, 0.7430, 0.7550, 0.7600 The material has been provided by InstaForex Company - www.instaforex.com |
| Posted: 18 Feb 2022 05:12 AM PST
The US dollar is in a tight spot on Friday. On the one hand, the US currency has enough reasons for confident growth, but on the other hand, its growth is quite limited. Paired with the euro, the greenback was losing ground, which was facilitated by the expectations of the release of statistical data from the United States by investors. By the time this material was prepared, the EUR/USD pair had risen to the level of 1.1362. At this moment, the USD/JPY pair rose to 115.19. The dollar exchange rate against a basket of six major currencies was trading 0.1% lower today in the morning, at 95.740. However, in the second half, the dollar index found the strength to grow and pulled up to 95.80. One of the reasons for the dollar's uncertainty is the publication of data on the number of real estate purchase and sale transactions on the secondary market in the United States. According to most analysts, in January, this indicator decreased by 1% compared to the results of December, that is, it reached the level of 6.1 million. Another reason is the unexpected risk sentiment in the forex space, formed due to some weakening of geopolitical tensions. So, on Thursday, US Secretary of State Antony Blinken said at a meeting of the UN Security Council that he had sent a letter to Russian Foreign Minister Sergey Lavrov with an offer to meet next week. Lavrov responded to this proposal with a counter-proposal to hold a personal meeting closer to the end of next week. This news about the holding of diplomatic negotiations was received by the market with a degree of optimism. However, it is fair to say that the situation around Ukraine remains extremely tense. A new portion of alarm arose after on Thursday the Ukrainian government forces and the unrecognized republics in eastern Ukraine suddenly began to accuse each other of violating the ceasefire. Western European countries and the United States have expressed fears that Russia may use this almost decade-old conflict as a pretext for war. The Russian authorities, in turn, said on Thursday that they were very concerned about the intensification of the conflict in Ukraine and could not help but monitor the situation there. The bidders will leave for the weekend with a lot of questions and a very blurry picture of geopolitical tensions. It is this continuing uncertainty around the ongoing diplomatic negotiations that should serve as support for the dollar. Based on this, we expect any weakness of the dollar only in the very short term. The US currency index has almost no chance of breaking 95.50 in the near future Today, the markets will hear speeches by Charles Evans, Christopher Waller, John Williams, and Lael Brainard. Recall that yesterday James Bullard once again reminded me of the importance of raising interest rates in the United States. If today's speakers also advocate for a faster tightening of the PEPP, then the markets will return to speculation about a 50 basis point rate hike in March. Yet in the last few days, this prospect has been partially and gradually fading away. The material has been provided by InstaForex Company - www.instaforex.com |
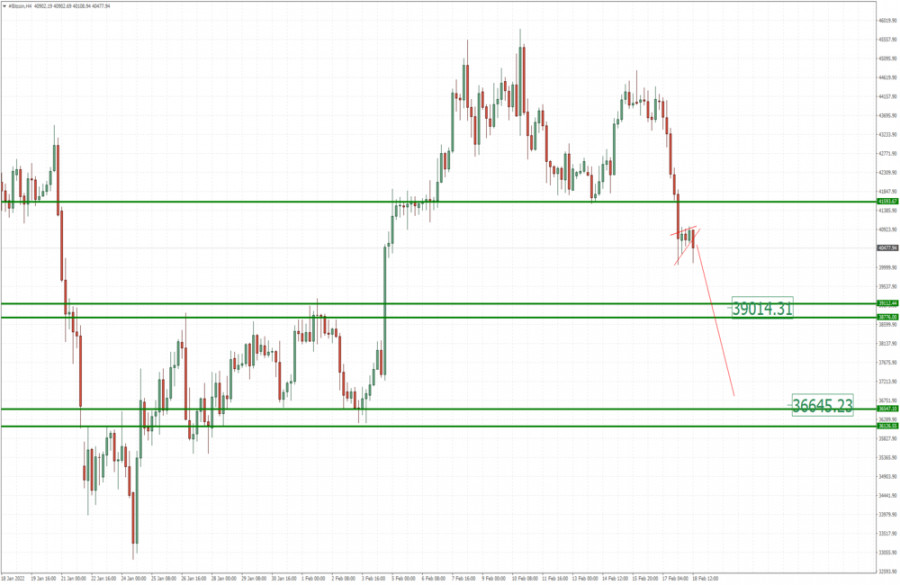
| BTC analysis for February 18,.2022 - Downside contunation in the play Posted: 18 Feb 2022 05:07 AM PST Technical analysis:
BTC/USD has been trading downside as I expected yesterday. The price reached first downside objective at $41,600 but I still see potential for further downside. Trading recommendation: Due to strong downside momentum and breakout of support in the background, I see potential for another drop on BTC. My advice is to watch for selling opportunities on the intraday rallies and continuation al pattern with downside objectives at $39,000 and $36,650. Second downside wave is still in development, which is another confirmation for further downside. Resistance is set at $41,600 The material has been provided by InstaForex Company - www.instaforex.com |
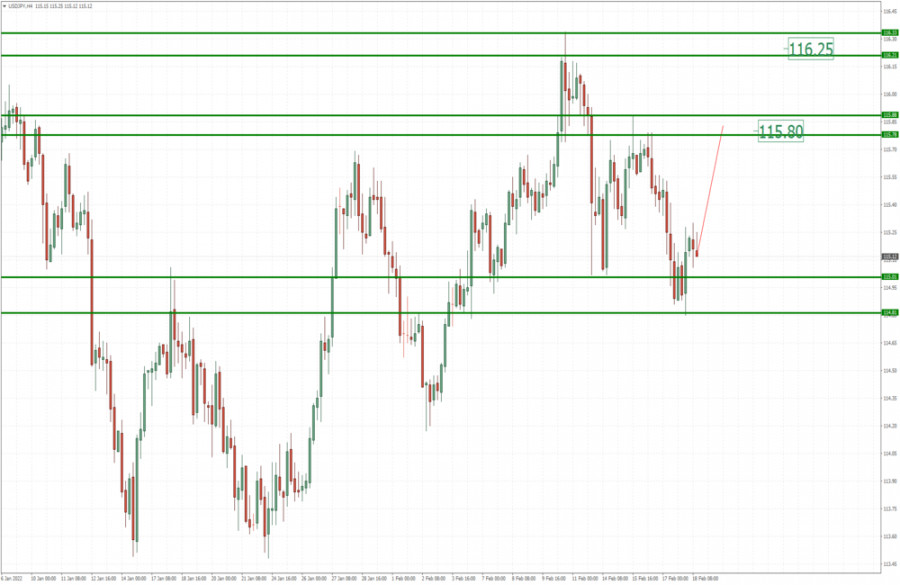
| USD/JPY analysis for February 18, 2022 - Potential completion of ABC downside correction Posted: 18 Feb 2022 04:53 AM PST Technical analysis:
USD./JPY has been trading downside in the background but I see potential completion for the ABC correction. Trading recommendation: Due to potential completion of the ABC completion in the background and the rally this morning ,I expect further upside movement. My advice is to watch for buying opportunities on the intraday dips with the potential upside objectives at 115,80 and 116,25. Short-term trend is bullish and that is another confirmation for furhter rise.... Support level is set at 114,80 The material has been provided by InstaForex Company - www.instaforex.com |
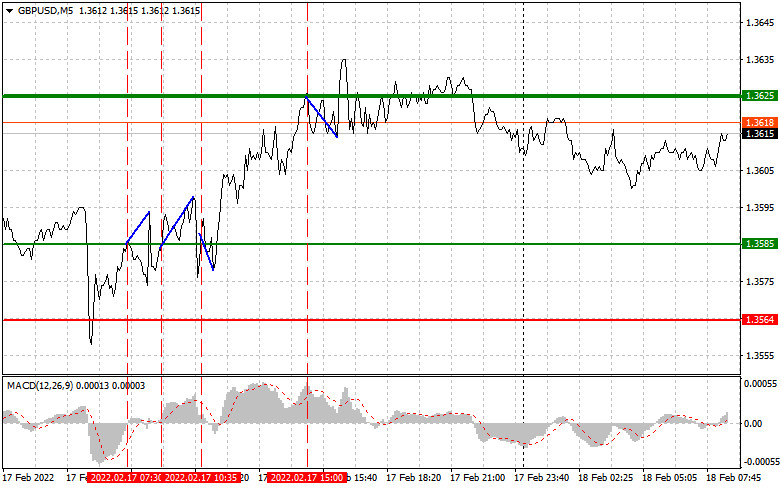
| Trading recommendations for novice traders. Outlook for GBP/USD on February 18. Posted: 18 Feb 2022 04:14 AM PST Analysis of the pound/dollar pair Yesterday, there were a lot of points to enter the market. The pair tested 1.3585 for the first time when the MACD indicator just began its upward movement from the zero level. Some time later, the pair tested this level again. Such movements of the price could have provided good signals to buy the pound sterling to continue the bullish rally seen this week. However, the lack of important statistical reports at the first part of the day prevented traders from using the signals. As a result, the pair inched up by 10-15 pips. In the middle of the European session, traders noticed a sell signal. When the price tested 1.3585, the MAD indicator was in the overbought area. However, sell orders from 1.3625 were not successful.
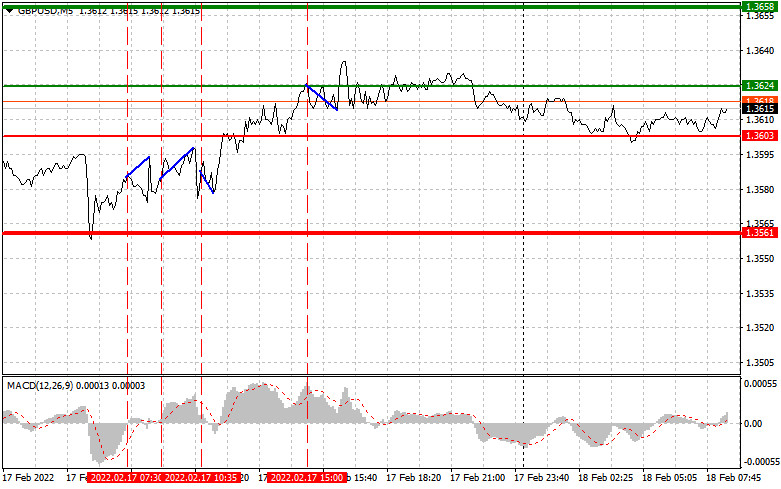
The US reports published yesterday failed to boost the US dollar and just capped the rise in the pound/dollar pair. Today, the market situation could be more attractive. The UK is going to disclose its retail sales data for January. The report is expected to push the British pound considerably higher. That is why it is recommended to follow scenario №1 and open buy positions. Strong data will point to the economic recovery. This is a really positive factor for the pound sterling especially amid the key interest rate hike. In the second part of the day, there will be no important news. The US will publish data on existing home sales and CB leading index. However, the reports will hardly influence the market situation since they are of minor importance. Meanwhile, speeches provided by John C. Williams and Lael Brainard may cause high volatility, thus leading to the sell-off of the pound/dollar pair during the US trade. Buy signals Scenario 1: today, it is possible to buy the British pound when the price reaches the entry point at 1.3624 (a green line) with the target at 1.3658 (a thick green line). When the price touches 1.3658, it is better to close buy positions and open sell orders, expecting a change of 15-20 pips. The pound sterling may show a rise only amid a jump in retail sales. Importantly, before opening buy positions make sure that the MACD indicator is above the zero level and is just starting rising from it. Scenario 2: It is also possible to buy the pound sterling if it hits the level of 1.3603. At this moment, the MACD indicator should be in the oversold zone. This may cap the downward potential of the pair and cause the market reversal. The pair may climb to 1.3624 and 1.3658. Sell signals Scenario 1: today, traders may sell the British pound if the price touches 1.3603 (a red line), thus causing a rapid drop. The key target will be located at 1.3561, where it is better to leave the market and open buy positions, expecting an increase of 15-20 pips. Weak retail sales figures and hawkish announcements made by the US Fed could become good reasons to sell the British pound. Before opening sell orders, make sure that the MACD indicator is below the zero line and is just starting falling from it. Scenario 2: it is also possible to sell the pound sterling if the price touches 1.3624. At this moment, the MACD indicator should be in the overbought zone to cap the upward potential of the pair. This, in turn, may lead to the market reversal. The pair may slide to 1.3603 and 1.3561.
What we see on the trading charts: A thin green line is the entry price at which you can buy a trading instrument. A thick green line is the estimated price where you can place a take-profit order or lock in profits by yourself, since the price will hardly go above this level. A thin red line is the entry price at which you can sell the trading instrument. A thick red line is the estimated price where you can place a take-profit order or lock in profits by yourself, since the price is unlikely to decline further. The MACD indicator. When entering the market, it is important to take into account overbought and oversold zones. Beginning traders should be very cautious when making decisions to enter the market. It is better to open positions ahead of the publication of important reports in order to avoid price fluctuations. If you decide to enter the market amid the news release, place stop orders to minimize losses. Otherwise, you may lose all your funds, especially if you do not use money management and trade big volumes. Please remember that successful trading requires an accurate trading plan similar to the one described above. Knee-jerk decisions made amid the current market situation is a losing strategy of an intraday trader. The material has been provided by InstaForex Company - www.instaforex.com |
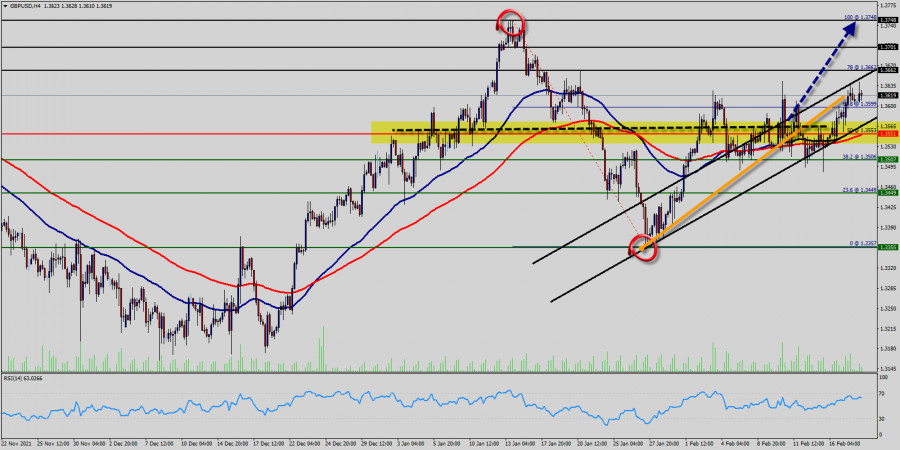
| Technical analysis of GBP/USD for February 18, 2022 Posted: 18 Feb 2022 04:13 AM PST
The GBP/USD pair continues to move upwards from the level of 1.3551. Today, the first support level is currently seen at 1.3551, the price is moving in a bullish channel now. Furthermore, the price has been set above the strong support at the level of 1.3551, which coincides with the 50% Fibonacci retracement level. This support has been rejected three times confirming the veracity of an uptrend. According to the previous events, we expect the GBP/USD pair to trade between 1.3551 and 1.3748. So, the support stands at 1.3551, while daily resistance is found at 1.3748. Therefore, the market is likely to show signs of a bullish trend around the spot of 1.3551. In other words, buy orders are recommended above the spot of 1.3551 with the first target at the level of 1.3636; and continue towards 1.3748. However, if the GBP/USD pair fails to break through the resistance level of 1.3636 today, the market will decline further to 1.3507 (S1). The spot of 1.3507 remains a significant support zone. Thus, the trend is still bullish as long as the level of 1.3507 is not breached. The material has been provided by InstaForex Company - www.instaforex.com |
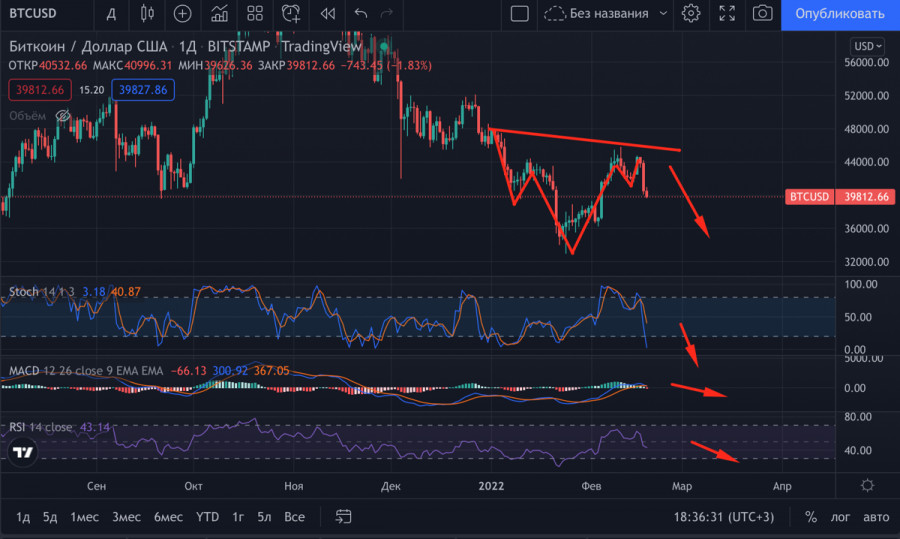
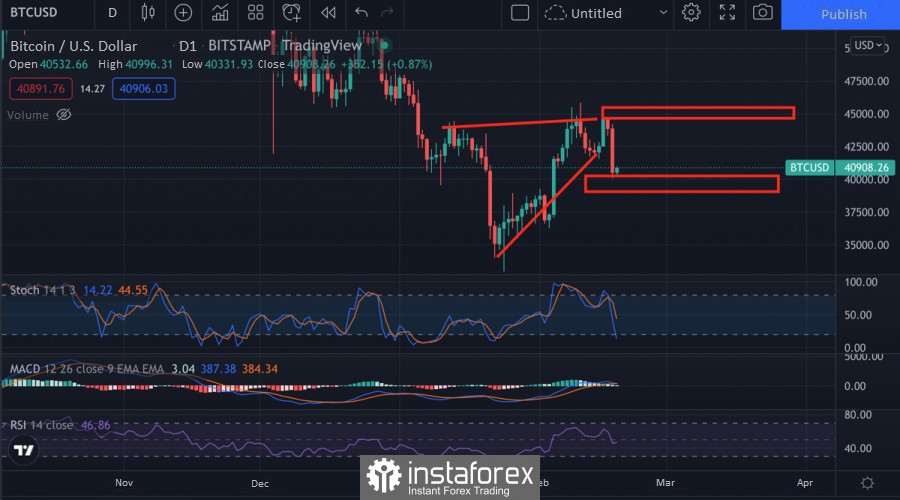
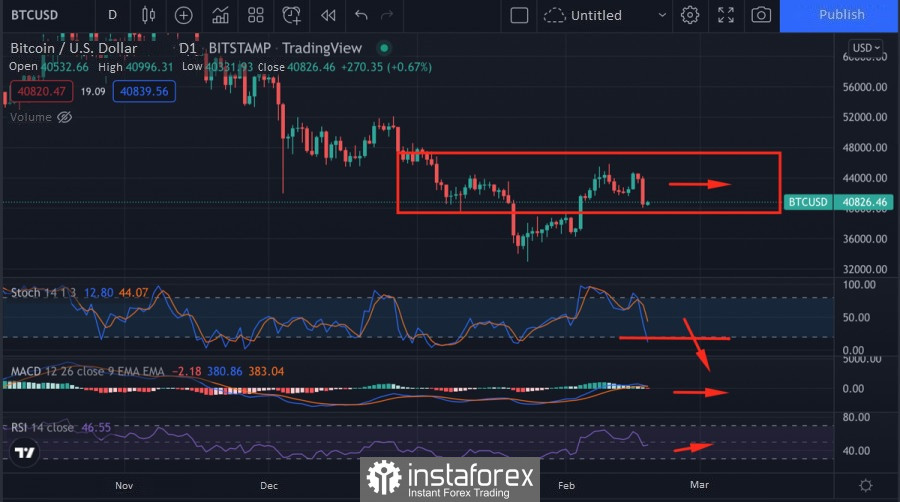
| Posted: 18 Feb 2022 04:07 AM PST On February 17, Bitcoin was close to the upper limit of the narrow range of $42k–$44.5k fluctuations. The price was pressed for the whole week, but as a result, the exit outside the area took place in a downward direction. As a result, the asset has fallen in price by 5% over the past day and pulled the rest of the coins with it. As a result, the total capitalization of the crypto market decreased by 4%, to $1.87 trillion. What happened?It would be wrong to blame everything on Bitcoin, given the general tense situation in the world, which is reflected in all markets, including cryptocurrency. Under such conditions, the sluggish attempt of the bulls to break the wedge up looked obviously losing. Sellers stepped up as the price approached the $45k mark. The selling cascade eventually brought the price down to the $40k support level.
As a result, the cryptocurrency moved into a wider range of $40k–$44k. Technical indicators indicate weak support for buyers: the stochastic oscillator left the bullish zone with a sharp downward impulse, which indicates strong positions for sellers. At the same time, the RSI started to recover, which indicates protection of the $40k level. But with such buying activity, you can count on a long consolidation flat from bitcoin in the near future.
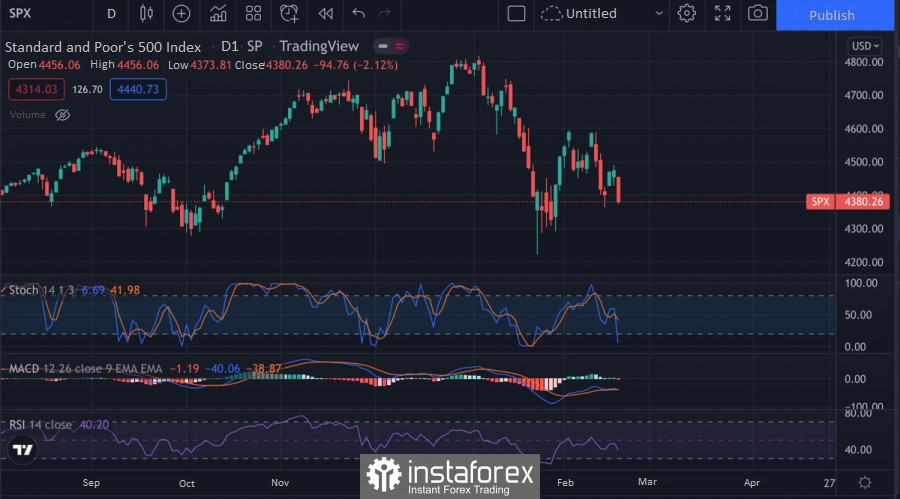
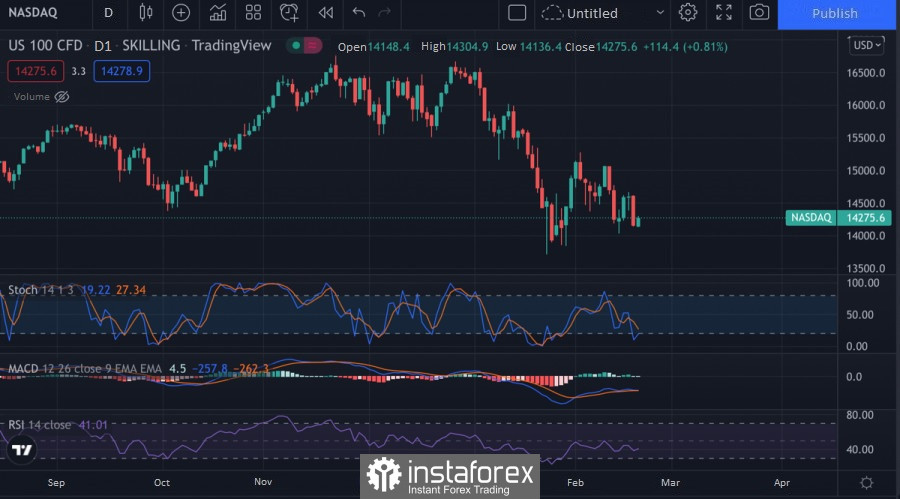
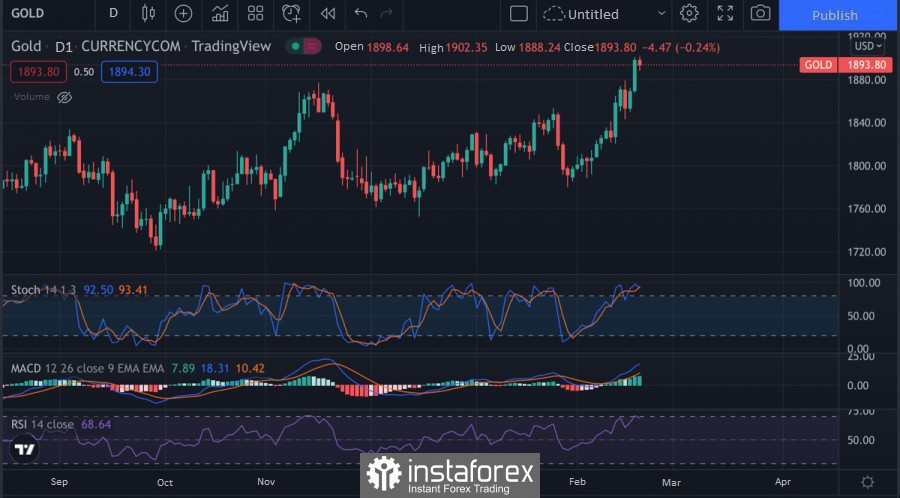
Possible reasonsAs bitcoin was recognized as a class asset, its dependence on the US dollar began to increase. This provoked a painful perception by the market of all the decisions of the Fed. On February 17, it became known that the report following the Fed meeting at the end of January said that cryptocurrencies are a threat to financial stability. Fed members noted that, combined with increased volatility, the capitalization of the cryptocurrency market has a negative impact on other sectors of the economy. Considering that the last time the regulator mentioned cryptocurrencies was in the summer of 2021, Powell's policy will be largely aimed at stabilizing the cryptocurrency industry. The second important reason for the possible decline of Bitcoin and the cryptocurrency market was its co-dependence on stock indices. SPX and NASDAQ also posted sharp declines on February 17. At the same time, gold has updated its local maximum and remains around $2.8k. The combination of these facts may indicate increased fear of investors against the background of the aggravation of the situation in Eastern Europe, where the likelihood of an escalation of the conflict is still high. Participants do not want to take action and intend to save their capital against the backdrop of global tension, so they buy gold.
What will happen next?Nothing critical has happened and the cryptocurrency market will begin to recover to local support zones. I assume a sideways movement on all major assets with a gradual consolidation above key local levels. At the same time, it should be taken into account that the fundamental background may provoke investors to make another active withdrawal of funds from high-risk assets. As of February 18, there is no intelligible dynamics of the movement of the cryptocurrency market, stagnation occurs, and therefore it is necessary to consider all options, including a likely decline to local lows. The material has been provided by InstaForex Company - www.instaforex.com |


| You are subscribed to email updates from Forex analysis review. To stop receiving these emails, you may unsubscribe now. | Email delivery powered by Google |
| Google, 1600 Amphitheatre Parkway, Mountain View, CA 94043, United States | |


Comments