Forex analysis review
Forex analysis review |
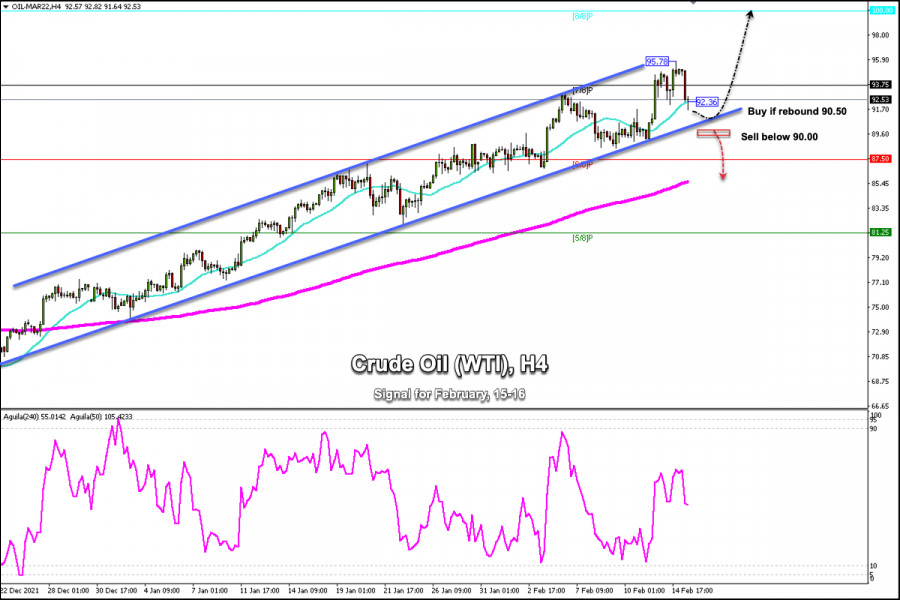
- Trading signals for Crude Oil (WTI - #CL) on February 15-16, 2022: buy in case of rebound towards 90.50 (uptrend channel)
- Bitcoin: PlanB announced new long-term outlook; Is S2F model still working?
- Video market update for February 15,,2022
- Oil starts to depreciate amid weakening geopolitical tensions
- BTC analysis for February 15,.2022 - Buyers in control
- EUR/USD analysis for February 15, 2022 - Rejection of key resistance trendline
- Analysis of Gold for February 15,.2022 - Strong downside momentum and potential for test of $1.820
- US premarket on February 15: Russian forces pull back and tensions drop
- GBP/USD: Labor Market and Inflation Rate
- ECB changes stance on tapering
- GBP/USD: plan for US session on February 15 (analysis of morning trades). Buyers of pound hit another resistance at 1.3565
- EUR/USD: the plan for the American session on February 15 (analysis of morning deals). Euro buyers continue to push the pair
- Stock rally halted over geopolitical tensions
- Nasdaq has become more volatile than Bitcoin
- India calls for a ban on cryptocurrencies
- Royal Mint sees record demand for gold
- EUR/USD analysis on February 15, 2022. James Bullard calls for 1.00% rate hike by July 1
- GBP/USD analysis on February 15, 2022. GBP up amid strong data form UK
- Rate hikes and bond market crisis: BTC to become main investment haven for large firms
- Technical analysis recommendations of EUR/USD and GBP/USD on February 15, 2022
- Ambitious plans, betting against USD
- Gold is a safe-haven asset for all portfolios
- Daily Video Analysis: XAUUSD, H4 Buy On Weakness
- Forex forecast 02/15/2022 AUD/USD, USD/JPY, GBP/JPY, EUR/JPY and Bitcoin from Sebastian Seliga
- Demand for risk remains low. The Fed continues to use hawkish rhetoric. Overview USD, NZD, and AUD
| Posted: 15 Feb 2022 07:53 AM PST
Oil prices are falling sharply while equity markets are rising in parallel, following Russia's announcement that some troops are returning to their bases. WTI was negatively affected as it had made gains in the face of escalating tensions between Russia and Ukraine. The slightest chance of a conflict could affect the strength of crude and push the price towards the 85.00 support level. Crude oil price is making a correction after reaching a high of 95.78. It is currently trading above the 21 SMA and bearish pressure is likely to continue towards the bottom of the uptrend channel formed since December 2021. A technical bounce around the uptrend channel will give us the opportunity to buy crude again above the psychological level of 90.50. Conversely, in case of a break below the key level of 90.00, we could expect a drop towards the 200 EMA located at 85.61. Below 90.00 will be a good opportunity to sell crude with targets towards 93.25 and 85.60. A daily close below the 21 SMA could be a sign of a trend reversal and the start of a short-term bearish sequence. Our trading plan for the next few hours is to wait for a technical bounce around the 90.50 level. It will be an opportunity to buy with targets at 92.50 (SMA 21) and up to the all-time high of 95.78. Support and Resistance Levels for February 15 - 16, 2022 Resistance (3) 96.13 Resistance (2) 93.75 Resistance (1) 92.27 ---------------------------- Support (1) 90.52 Support (2) 87.50 Support (3) 86.04 *********************************************************** The material has been provided by InstaForex Company - www.instaforex.com |
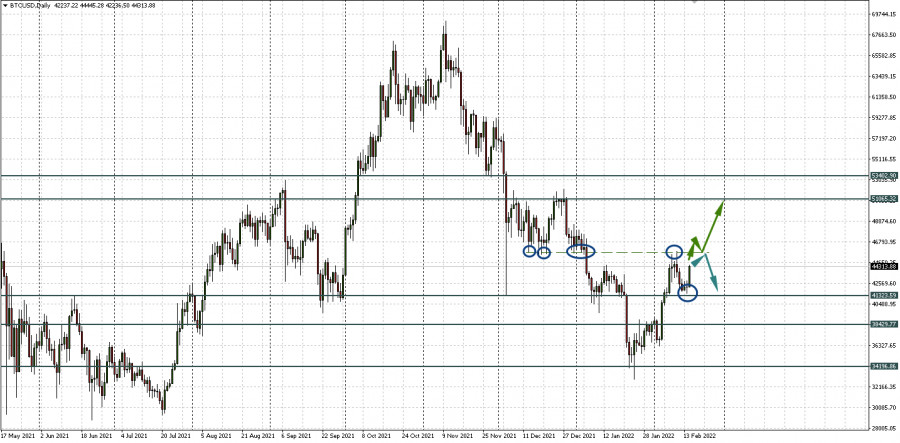
| Bitcoin: PlanB announced new long-term outlook; Is S2F model still working? Posted: 15 Feb 2022 06:35 AM PST Renowned crypto analyst PlanB is confident that BTC will hit $100,000 but does not undertake to set a clear time frame. Forecast after failureAt the end of last year, the reputation of PlanB, the creator of the Stock-2-Flow (S2F) model, an analyst in a highly unpredictable cryptocurrency ecosystem, was shaken. Not only did bitcoin not hit $100,000 before the end of the year, it also fell from its all-time high of $69,000. However, ignoring the recent failures of its price forecasts for the main cryptocurrency, PlanB shared a new tweet, talking about the huge potential of the digital currency to reach the price of $100,000. But probably by the end of the year. Where do these targets come from?The current price prediction is probably based on data obtained from a combination of S2F and logarithmic regression. The $100,000 target price is more than 226% of the current $44,144 near which Bitcoin trades on Tuesday. However, the crypto community reacts ambiguously to PlanB's forecasts. For example, Spencer Schiff, son of popular Bitcoin critic Peter Schiff, noted that PlanB may be trying to predict the future by looking in the rearview mirror. His point is that PlanB's BTC forecast for this year should be slightly more than the $100,000 he was expecting last year. Caution in forecastsIn response, PlanB said he was trying to keep his forecasts low by sharing data on gold, which has an S2F of roughly 50 and a market capitalization of $10 trillion. He also pointed to the real estate industry, whose S2F ratio is pegged at 100 with a market valuation of over $100 trillion. As a result, PlanB summed up his findings by saying that he would be very surprised if the market value of Bitcoin after the next halving is lower than that of gold, given that BTC S2F is 100+. Does PlanB's S2F model still work?PlanB's S2F model rose to prominence in its early days, which gave a lot of accurate forecasts and price flows. The major crash came last year when Bitcoin ended the year on a bearish note, while many market participants expected the cryptocurrency to hit the $100,000 mark. But the forecast based on this model failed. PlanB also presented a pessimistic and an optimistic scenario for BTC at the end of last year. He expected the main cryptocurrency to end the year at $98,000 and $135,000. But none of these predictions came true. Trust in PlanB and its model is rapidly declining. Many urged the analyst to provide a more flexible time frame to carefully observe the S2F data and allow it to be expressed over time, but PlanB refused to do so. He stated that the option available was either to retool the model to accommodate the current low prices, or to let the model run for as long as it wanted. Difficult long-term, understandable short-termLong-term forecasts for such a complex asset as cryptocurrency, in an even more uncomfortable environment of uncertainty, are not my forte. In addition, what is more important for a trader is what may happen in the near future, but here everything looks more definite. At least BTCUSD is very technical and has perfectly worked out both borders of the flat 41,323.59 - 45,744.38. Now there is a small margin of movement to this resistance. And then there are two options left: a U-turn in the corridor or going up from it. In the second case, it will be necessary to wait for consolidation above the level of 45,744.38, which will open the way for the main cryptocurrency to the next level of 51,065.32.
|
| Video market update for February 15,,2022 Posted: 15 Feb 2022 05:35 AM PST Watch for buying opportuntiies on the pullbacks... The material has been provided by InstaForex Company - www.instaforex.com |
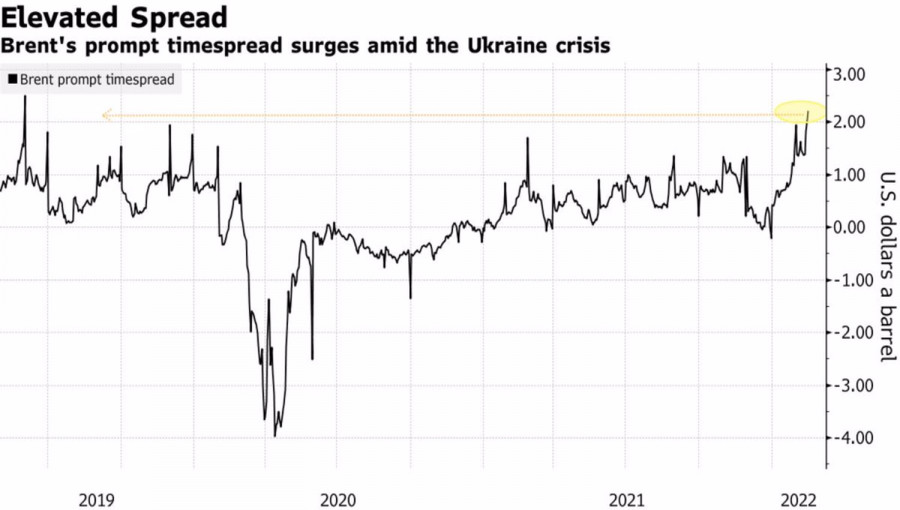
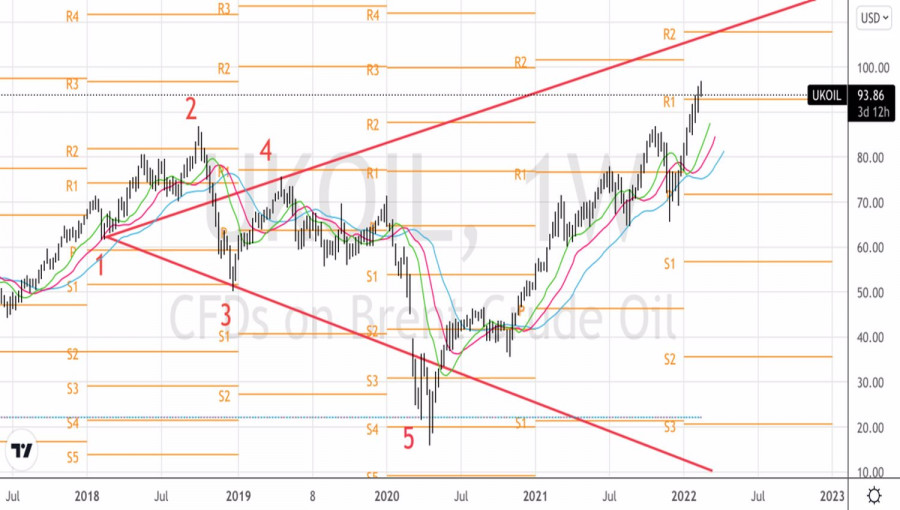
| Oil starts to depreciate amid weakening geopolitical tensions Posted: 15 Feb 2022 05:32 AM PST What seemed like a pipe dream at the beginning of 2021 is now perceived almost as a fait accompli. Alas, Brent, which has traveled a long way up, may never take the last step. The blame for this, most likely, will be Russia, which is gradually withdrawing troops from the border with Ukraine. The exercises are ending, and everything that you have come up with in the West about the invasion is nothing more than a figment of the imagination. Despite the fact that the oil market is fundamentally strong due to the ongoing growth of global demand and limited supply, geopolitics has become the main driver of the Brent rally over the past few weeks. Russia is one of the top three oil-producing countries, and the imposition of Western sanctions on the country's energy sector could exacerbate supply problems and easily push North Sea prices up to $100, $125, and even $150 a barrel. In the latter case, according to JP Morgan estimates, global inflation would jump to 7%, which would force central banks to actively raise rates and lead to a new recession in the global economy. Against such a background, one should not be surprised at the rise of Brent to 8-year peaks. For the first time since 2018, the difference between the nearest North Sea futures contracts exceeded $2 per barrel, backwardation in the oil market has not been so strong for a long time, and the demand for call options is going through the roof. They haven't been that expensive compared to puts since 2019, according to Bloomberg estimates. Spread dynamics between Brent futures contracts
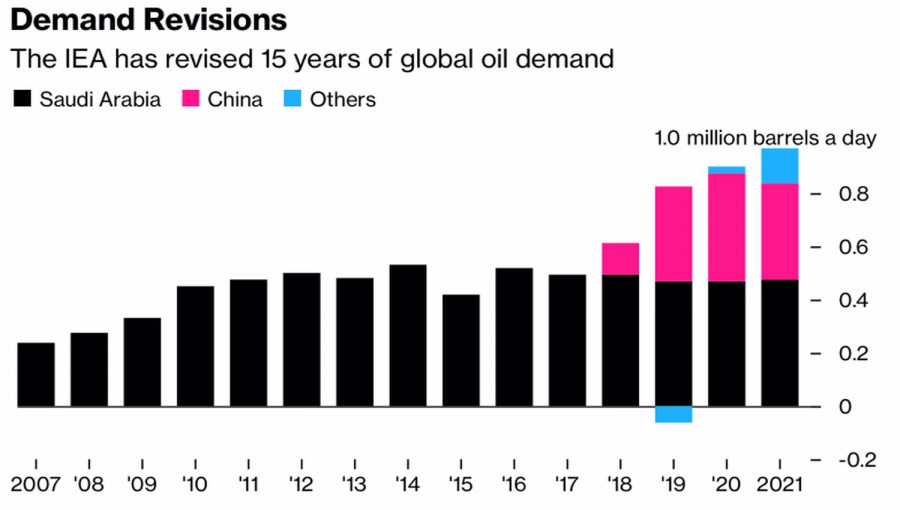
The question is, can oil reach $100 a barrel without geopolitics? At first glance, not everything is so simple. Iran is reporting to Russia significant progress in negotiations with the West on its nuclear program, which is fraught with an increase in exports from this Middle Eastern country. American manufacturers, looking at high prices, ask themselves: if not now, then when? And the Energy Information Administration reports production in the Permian Basin has risen to record levels, the latest of which exceeded 5 million b/d, for the third month in a row. The global economy is slowing down amid the depletion of fiscal and monetary stimulus. At the same time, global demand, according to revised IEA estimates, reached pre-pandemic levels already at the end of 2021 and will continue to grow. It will take about 4 months to introduce a new rig in the US, compared to 4-6 weeks previously. In addition, the owners of oil companies continue to fulfill promises to shareholders that the capital will go to dividends, and not to new developments. Dynamics of global oil demand
Against this background, it is extremely naive to talk about breaking the upward trend for Brent. It is best to expect that the reduction in geopolitical tensions in Eastern Europe will result in a correction, and buy oil on the decline. Technically, the Wolfe Waves pattern retains its relevance on the weekly chart of the North Sea variety. Its target is located near $108 per barrel. We continue to follow the "buy" recommendation, voiced at the beginning of the year. Brent, Weekly chart
|
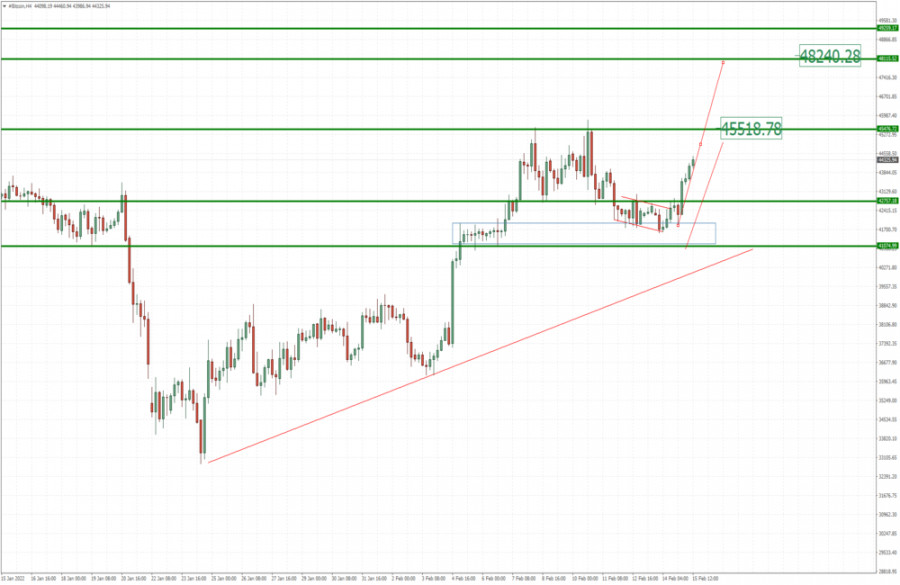
| BTC analysis for February 15,.2022 - Buyers in control Posted: 15 Feb 2022 05:22 AM PST Technical analysis:
BTC/USD has been trading upside as I expected and the price is going towards mine first upside objective at $45,520. Trading recommendation: Due to good rejection of support at $41,000 and positive momentum today, I see potential for the upside movement. Watch for buying opportunities on the pullbacks using intraday charts with the upside objectives at $45,520 and $48,250 Short-term trend is still upside, which is another confirmation for further upside continuation. Key support is set at $41,000 The material has been provided by InstaForex Company - www.instaforex.com |
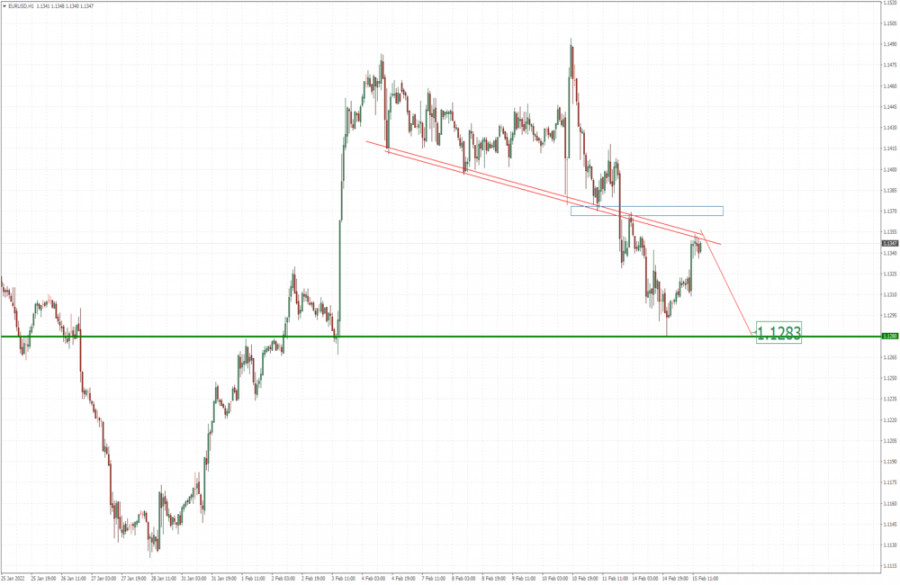
| EUR/USD analysis for February 15, 2022 - Rejection of key resistance trendline Posted: 15 Feb 2022 05:13 AM PST Technical analysis:
EUR/USD has been upside this morning but I see potential for the downside continuation due to rejection of the key trend line at 1,1355. Trading recommendation: Due to downside rejection of the key resistance trend line at 1,1355 and upside exhaustion this morning, I see potential for the downside movement. Watch for selling opportunities with the downside objective at 1,1285 Short-term trend is downside, which is another confirmation for further downside continuation. The material has been provided by InstaForex Company - www.instaforex.com |
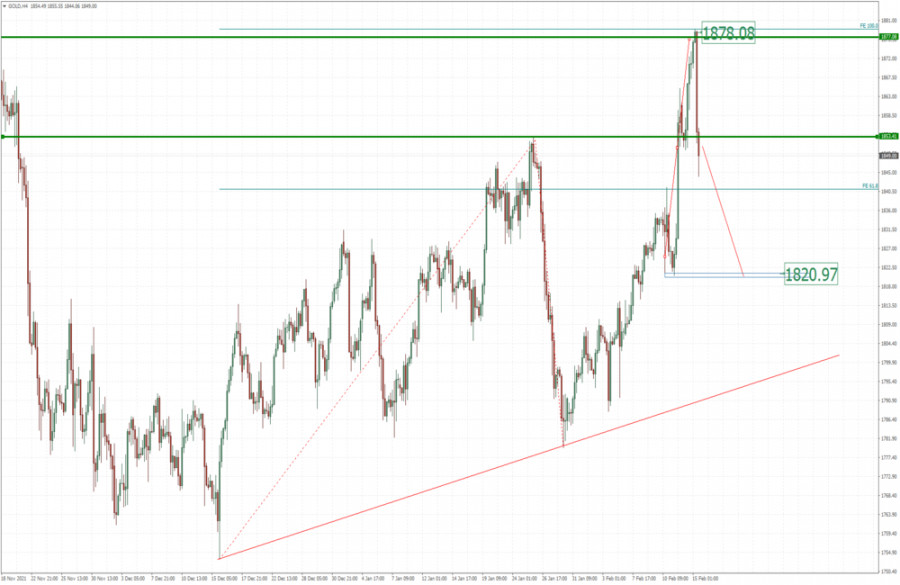
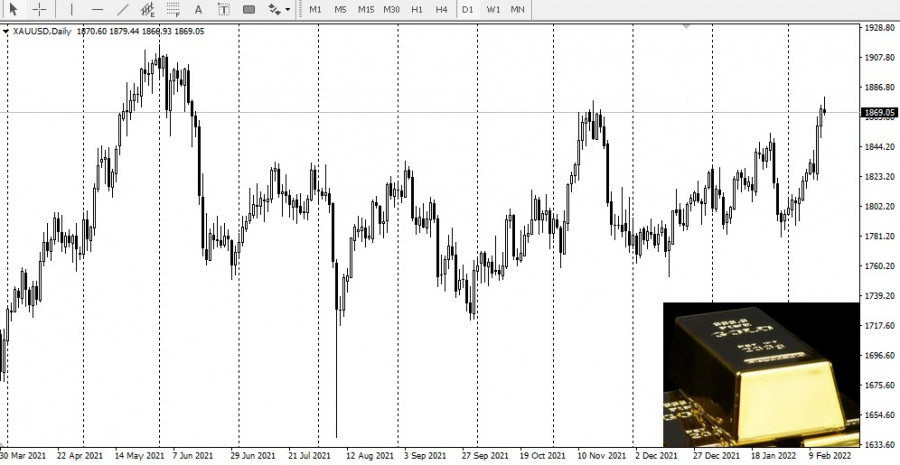
| Analysis of Gold for February 15,.2022 - Strong downside momentum and potential for test of $1.820 Posted: 15 Feb 2022 04:50 AM PST Technical analysis:
Gold has been trading upside yesterday and the price reached my upside objective at $1,878. Anyway, today there is the big drop with good volume and I see downside continuation. Trading recommendation: Due to strong downside momentum in the background and rejection of key resistance at $1,878, I see potential for the downside movement to continue. Watch for the bear opportunities with the downside objectives at $1,840 and $1,820 Intraday resistance is set at the price of $1,850 The material has been provided by InstaForex Company - www.instaforex.com |
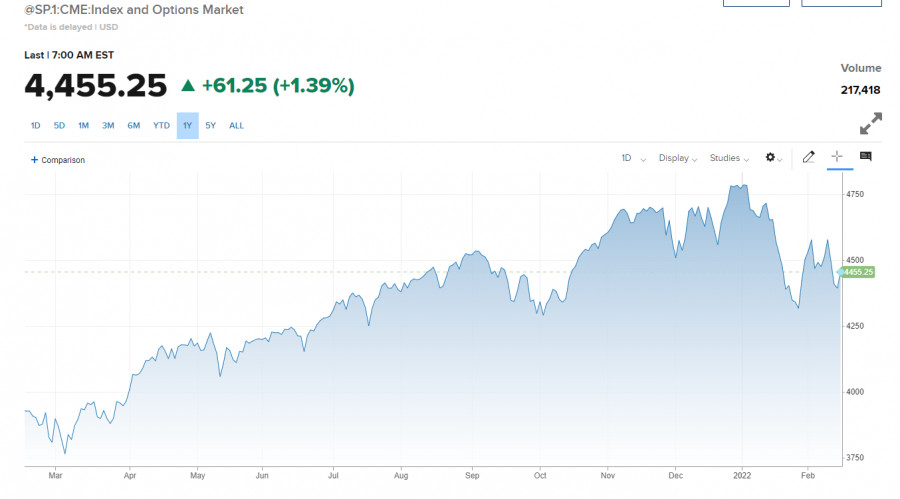
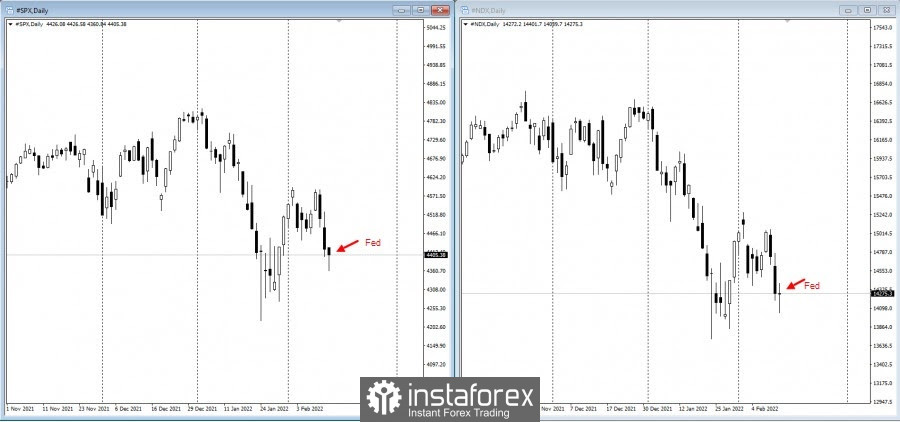
| US premarket on February 15: Russian forces pull back and tensions drop Posted: 15 Feb 2022 04:14 AM PST US stock index futures rose on Tuesday before the regular trading session opened after several experts from the US said Russia would not invade Ukraine, reducing geopolitical tensions that have been affecting the stock market lately. Today, the Ministry of Defense of the Russian Federation announced that it had started to return servicemen to their bases of deployment after exercises near the border with Ukraine were completed. Against this backdrop, Dow Jones Industrial Average futures jumped by 366 points or 1%. Futures on the S&P 500 rose by 1.4%, and futures on the Nasdaq 100 added 2%. The S&P 500 is now about 8% below its all-time high.
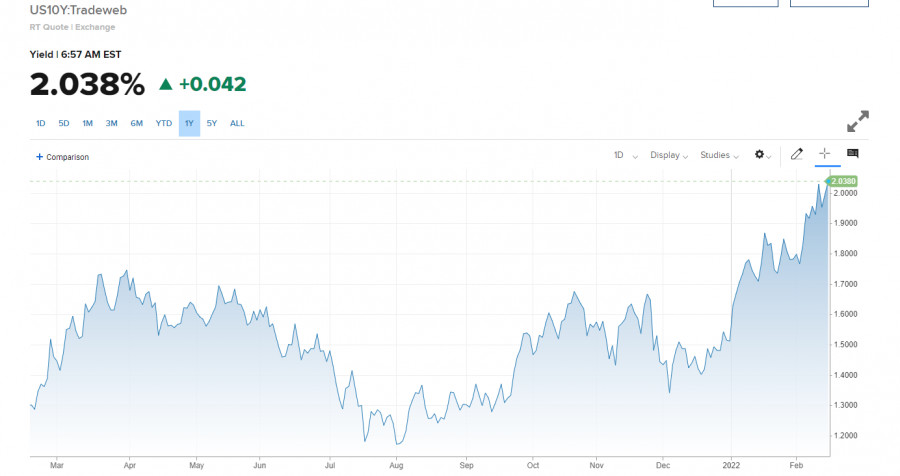
According to Defense Ministry spokesman Igor Konashenkov, the troops recently deployed in the Southern and Western Military Districts of Russia near the border with Ukraine, have completed their exercises and have already started to gradually return to their military bases and garrisons. Against this backdrop, the price of WTI fell by 3% and the yield on 10-year Treasury bonds jumped to 2.04%. Some ETFs investing in Russian companies also showed reactions to the news. The VanEck Russia ETF, a US-traded fund investing in large Russian companies, jumped by nearly 5% in the premarket.
However, the geopolitical situation is not enough for the real growth of stock markets. China supports Russia, and relations between China and the US continue to deteriorate very rapidly, which has a huge importance. It is not about a military conflict, but the turn of the Chinese economic policy towards Russia. How this will affect the US relationship with the other economic superpowers is really the question that scares investors, which will eventually have a negative impact on the economy and will obviously affect the future of stock markets. The US inflation data is also important today, namely the US producer price index for January 2022. A monthly increase of 0.5% is expected. Even if the data exceeds economists' forecasts, it is unlikely to seriously affect the indices. The high rate of inflation occurs mainly due to the effects of the pandemic. The US economy is at its high level and has excellent data, so it is only a matter of time before prices return to an acceptable range. Many economists expect inflation to reach its highs as early as the beginning of this year, after which it will begin to decline rapidly - especially with the new monetary policy from the central bank.
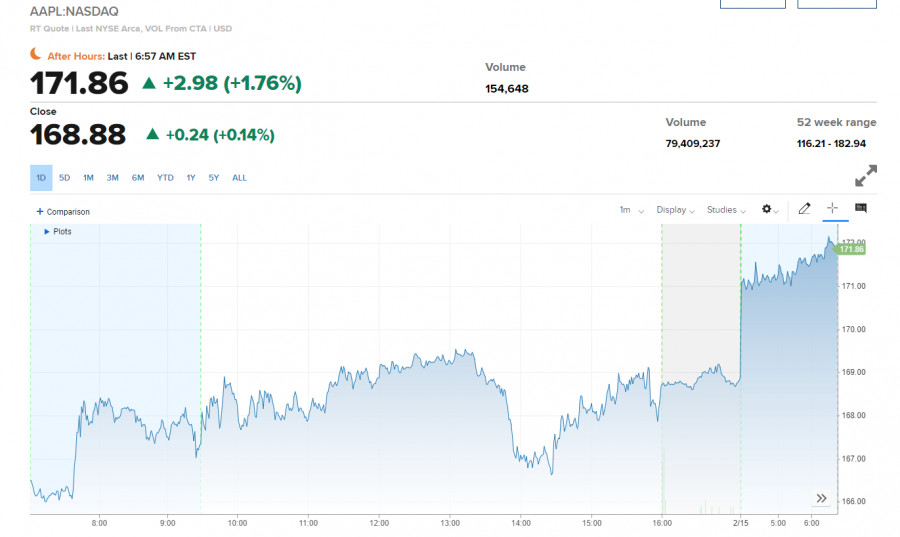
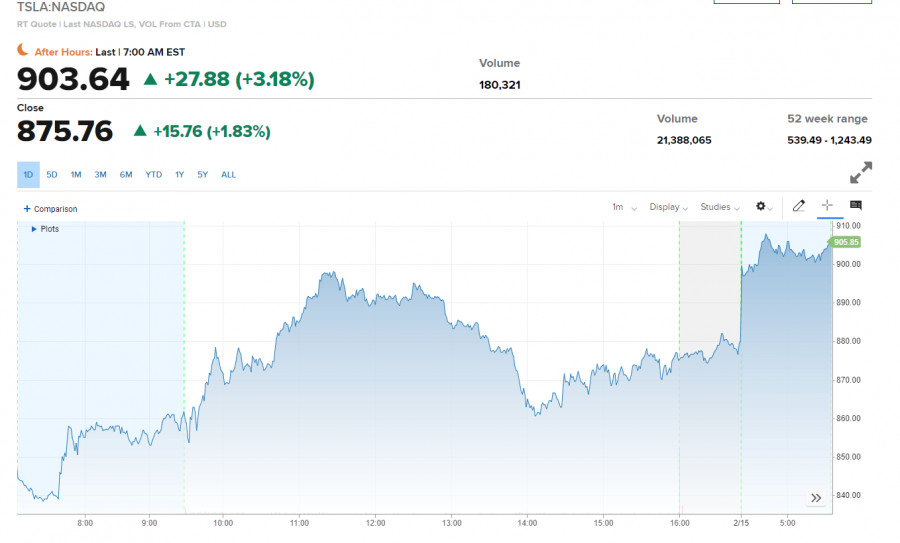
Airline and cruise companies were among top gainers today during the premarket. Energy companies suffered the biggest losses due to the drop in oil prices. Apple increased by 1.76% to 171.86, while Tesla jumped by 3.18% to 903.64 before the trading session opened. Yesterday, the Dow closed with a decline of 171.89 points, or by 0.5%. The S&P 500 dropped by 1.2%, and by the end of the day was down only by 0.4%. The Nasdaq Composite fell by 0.9% at one point before closing just below zero.
St. Louis Fed President James Bullard said that the central bank should act aggressively to curb inflation. Bullard noted that the consumer price index rose last month at the fastest annualized rate since 1982. It also prompted experts from Citigroup and Goldman Sachs to revise their 2022 rate hike forecasts to 7.0%. As for the technical picture of the S&P500 After a breakthrough of $4,449, bulls are trying to return the price above this level, as well as to keep the price above support at $4,378, which they did quite well yesterday. They were lucky that no interest rate changes were made. A breakthrough of $4,378 would put more pressure on the index and return its bearish sentiment, with the prospect of reaching the lows of $4,312 and $4,265. Bulls may try to make up for Friday's losses today. If the price reaches above $4,449, it is likely to increase appetite for risk, which will open a path to the high of $4,536. This will keep the bull market alive and bring the price back to resistance of $4,598. The material has been provided by InstaForex Company - www.instaforex.com |
| GBP/USD: Labor Market and Inflation Rate Posted: 15 Feb 2022 04:02 AM PST The Office for National Statistics (ONS) said on Tuesday that the number of jobs in the private sector of the British economy increased by 108,000 in January (against an increase of +131,000 in December), amounting to a record 29.5 million. The unemployment rate in the reporting 3-month period (October-December) remained at the same level of 4.1%, and average earnings (October-December) excluding bonuses increased by 3.7% (in annual terms) after an increase of 3.8% in September-November. The data presented indicate that the impact of the omicron strain of coronavirus on the labor market was insignificant. In the 4th quarter of 2021, UK GDP grew by 1%, despite a 0.2% contraction in the economy in December amid a wave of omicron strain. This report on the labor market raises the possibility that the Bank of England may raise its key rate in March, economists say. At the same time, they believe that the Bank of England will be able to cope with rising inflation without resorting to serious monetary tightening, despite the fact that some market participants expect six rate hikes this year. Nevertheless, despite the strong report on the labor market, the British pound reacted rather reservedly to this publication. Probably, investors are waiting for the release of the inflation report on Wednesday (07:00 GMT) in order to start correcting their positions on the pound. The consumer price index (CPI) reflects the dynamics of retail prices for a group of goods and services included in the consumer basket, being a key indicator of inflation. In the previous reporting month (December), the growth in consumer inflation amounted to +0.5% (+5.4% in annual terms). The data suggests growing inflationary pressures, which is likely to support the pound. A reading of the indicator below the forecast/previous value could provoke a weakening of the pound, as low inflation will force the Bank of England to maintain an easy monetary policy. Forecast for January: -0.4% (+5.4% in annual terms). Also on Wednesday (at 19:00 GMT) the minutes from the January Fed meeting ("FOMC minutes") will be published. At the end of the January meeting, Fed leaders confirmed the decision to accelerate the reduction in asset purchases in order to complete the QE program in March 2022 and begin raising interest rates. Fed officials plan to raise interest rates three times in 2022. However, among the leadership of the Fed, there is no consensus on this matter. For example, St. Louis Fed President and FOMC member James Bullard said on Monday that the central bank should more aggressively contain inflationary pressures, which would require raising interest rates at a faster pace. "The central bank should confirm these expectations (of the market) reflected in the (yields) of two-year Treasury bonds, and if we do not do this, it will turn out that we are not protecting the 2% inflation target and are not trying to bring inflation under control," Bullard said, adding that the Fed's leadership is now "not in a situation where you can trudge from meeting to meeting, doing a little each time." Many economists believe that the dollar has a lot of upside potential, especially against the currencies of countries whose central banks are unlikely to raise interest rates quickly. This primarily applies to the ECB. As for the Bank of England, it is worth noting that if it does not live up to market expectations in a tighter monetary policy, then the pound may come under additional pressure against the backdrop of an escalation of tension around Ukraine. The military scenario may put new pressure on the British economy, primarily due to rising energy prices, which could lead to a further reduction in household consumption and a reduction in GDP. Today, gas, petrol and diesel prices in the UK have risen, but experts are confident that the growth will continue further. The main factors that could force the Bank of England to keep rates low are weak GDP and labor market growth, as well as low consumer spending. In the event of rising inflation, British citizens will be forced to use their savings in order to maintain the level of consumption with a significant increase in prices. In the medium term, consumption could fall, in which case British GDP would come under pressure.
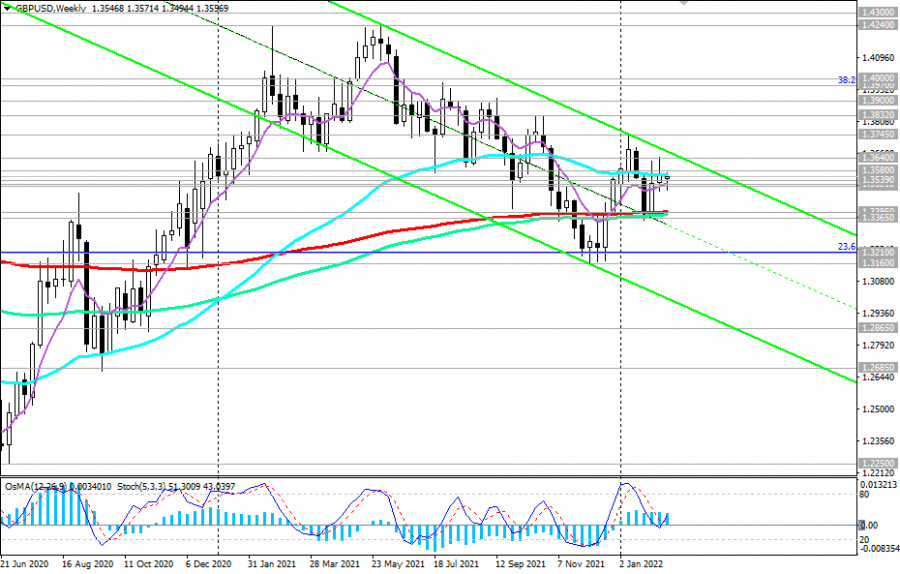
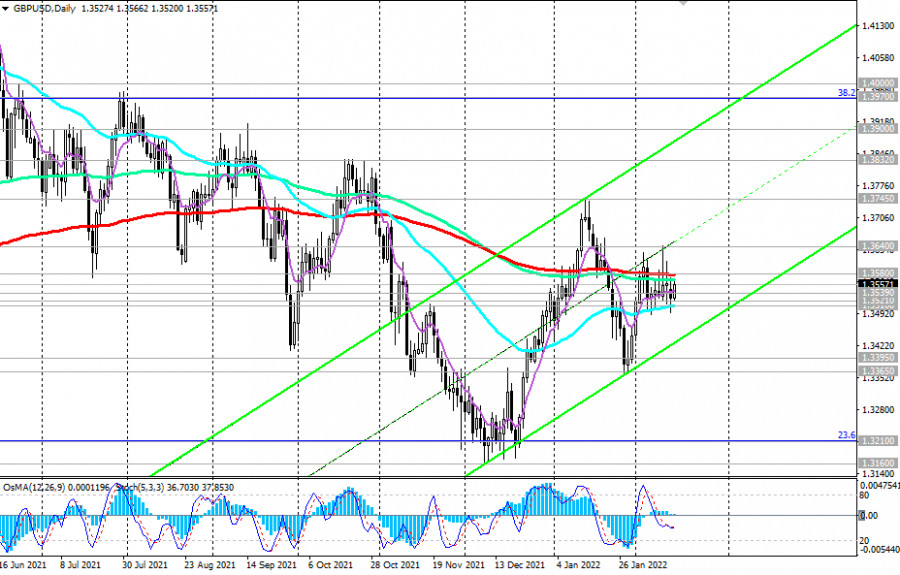
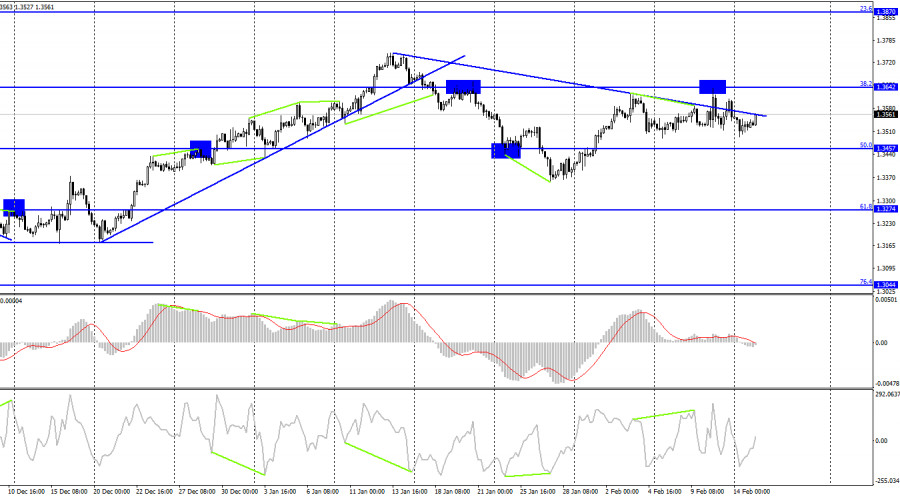
Trading recommendations At the time of writng, the GBP/USD pair is trading near the 1.3556 mark, remaining in the bear market zone below the key resistance level of 1.3580. The breakdown of support levels 1.3521, 1.3510 may become a trigger for further decline, first to the key support level 1.3395 (200 EMA on the weekly chart), and in case of its breakdown, inside the downward channel on the weekly chart.
In the event of a breakdown of the key resistance level 1.3580 (200 EMA on the daily chart), the target will be the local resistance level 1.3640 (local highs and the upper limit of the descending channel on the weekly chart).
A breakdown of the local resistance level of 1.3745 may again increase the risks of breaking the GBP/USD bearish trend, sending the pair towards the highs of 2021 and the level of 1.4200. Support levels: 1.3539, 1.3521, 1.3510, 1.3395, 1.3365, 1.3300, 1.3210, 1.3160, 1.3000, 1.2865, 1.2685 Resistance levels: 1.3580, 1.3640, 1.3700, 1.3745, 1.3832, 1.3900, 1.3970, 1.4000 Trading recommendations Sell Stop 1.3530. Stop-Loss 1.3570. Take-Profit 1.3510, 1.3395, 1.3365, 1.3300, 1.3210, 1.3160, 1.3000, 1.2865, 1.2685 Buy Stop 1.3570. Stop-Loss 1.3530. Take-Profit 1.3580, 1.3640, 1.3700, 1.3745, 1.3832, 1.3900, 1.3970, 1.4000 The material has been provided by InstaForex Company - www.instaforex.com |
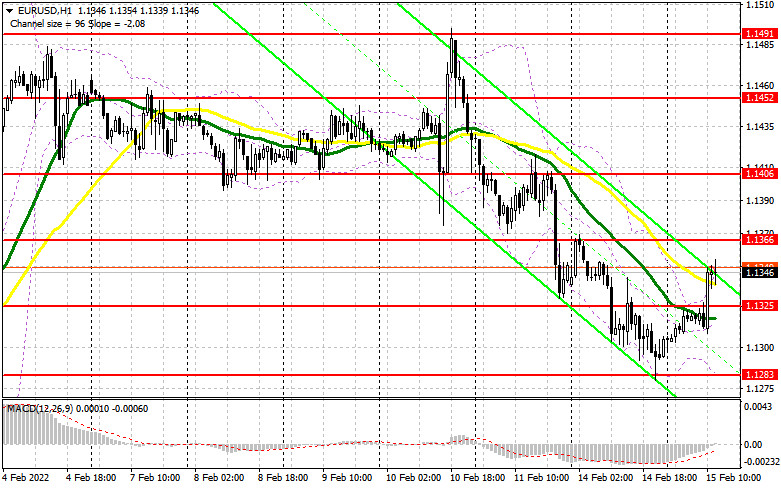
| ECB changes stance on tapering Posted: 15 Feb 2022 03:41 AM PST EUR/USD closed above 1.1300 on Monday, in part due to the Fed not disclosing the results of its unscheduled meeting yesterday. Another reason was ECB chief Christine Lagarde who, despite her harsh tone following last month's meeting, said the central bank would not rush to lift EU stimulus. "We have to be open about what we can and cannot do as a central bank," she told MEPs on Monday. "Everyone must understand that our monetary policy cannot fill pipelines with gas, clear port congestion, or train more truck drivers." With such statements, Lagarde made it clear that not everything is in the hands of the central bank. Authorities need to cope with current problems on their own, not through stimulus support programs.
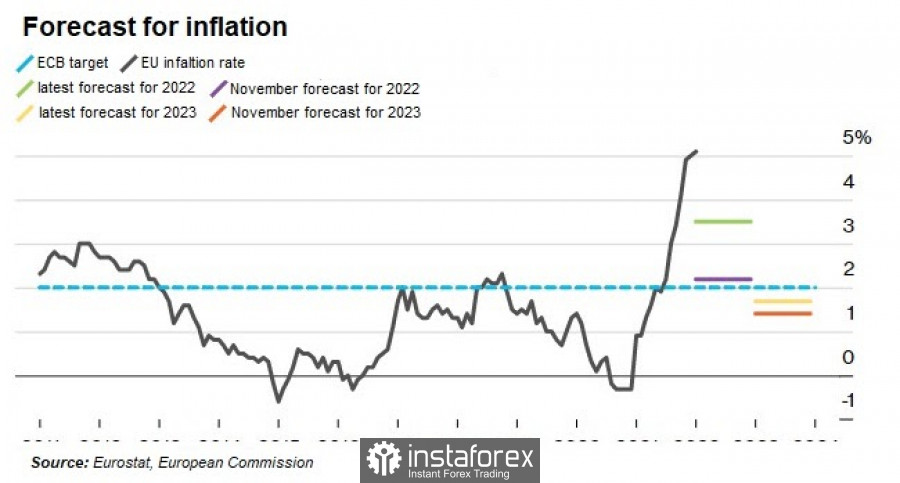
Faced with the fastest inflation in eurozone history, Lagarde has become more aggressive since the ECB meeting last month, refusing to rule out a rate hike in 2022. As such, the European Commission predicts that consumer prices will rise by 3.5% y/y in 2022 and increase by 1.7% in 2023. The ECB also announced last year that it would cut all economic support programs that functioned during the coronavirus pandemic. But last week Lagarde warned that tightening monetary policy too quickly could jeopardise Europe's economic recovery. "Any adjustment to our policy will be gradual," she said. "Our target is an inflation rate of 2% over the medium term. To do this, we will take action at the right time," she added. Lagarde's position is supported by other politicians, and several ECB officials stressed the need for a more gradual change in policy. Board of Governors member Olli Rehn even warned against a sharp reaction to short-term inflation, saying it's best to look at price forecasts for 2023 and 2024 once the current energy price surge and supply chain disruptions subside. He said the central bank should look beyond the current spike in inflation as it determines monetary policy from the position of not stifling the observed economic growth. "If we reacted sharply to inflation in the short term, we would probably stop economic growth," Ren said. Inflation in the eurozone is already above 5.0%
But even though wage growth in the euro area remains subdued and inflation is high, it is unlikely that such a discrepancy will persist for a long time. The risk also represents broader labor costs, but there are no major changes in this direction. That is why the Board of Governors meeting scheduled next month is a suitable occasion to discuss possible future adjustments. Technical analysis for EUR/USD A lot depends on 1.1340 because a breakout will lead to a further rise to 1.1380 and 1.1415. Meanwhile, a dip below the level will result in a deeper decline to 1.1270, and then to 1.1230. Technical analysis for GBP/USD A lot depends on 1.3570 because a breakdown will lead to a larger jump to 1.3605 and 1.3640. Meanwhile, a drop below 1.3495 will result in a further decrease to 1.3430 and 1.3360. The material has been provided by InstaForex Company - www.instaforex.com |
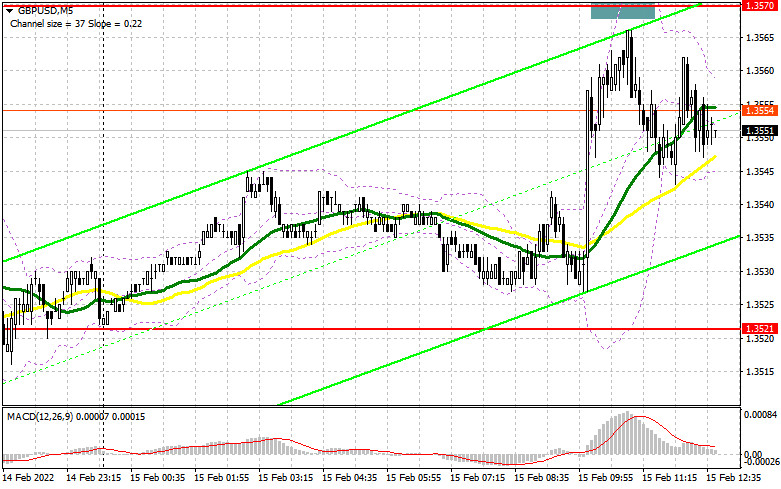
| Posted: 15 Feb 2022 03:37 AM PST To open long positions on GBP/USD, you need: In my morning forecast, I focused on the level of 1.3570 and recommended taking it into account when making decisions to enter the market. Let's observe the 5-minute chart and analyze it. Relevant data on the British labor market resulted in the pound's rise in the first half of the day as they generally were in line with economists' forecasts without negative effects from economic slowdown in the country. However, the above mentioned level of 1.3570 was not updated, about 5 points were lacking. Therefore, I did not get a false break with a good entry point to short positions. The technical picture has changed in the second half of the day. Besides, what were the euro's entry points this morning?
During the US session, the next US inflation data will be released, which may favor dollar buyers. However, currently the indicators differ significantly due to the energy market crisis, and taking into account that the data coincides with producer prices, even the most dramatic changes can hardly affect the Federal Reserve System's stance on monetary policy. All these factors are favorable for further pound's strengthening in the short term. In the second half of the day, bulls' key target will be to defend the support at 1.3530, formed in the first half of the day, as well as to assume control of the new resistance at 1.3565, which traders failed to reach during the European session. Buying from the level of 1.3530 is possible only in case of a false breakout. Besides, weak US manufacturing data, which might be slightly above economists' expectations, will favor a good entry point to long positions. A breakout and the test of 1.3565, which buyers are targeting today, and also the downward renewal of that range will form an additional buy signal with the climbing to 1.3602. A more distant target is 1.3640, where I recommend taking profit. In case the GBP/USD pair declines during the US session and bulls lack activity at the level of 1.3530, where the moving averages are, it is better not to buy risky assets. It is advisable to await the test of the next major level of 1.3496, which will be unfavorable for buyers. Formation of a false breakout there will provide an entry point into long positions against the bear market. It is possible to buy the pound immediately for a rebound from the level of 1.3465 or even lower from the low of 1.3434, counting on a 20-25 pips correction within the day. To open short positions on GBP/USD, you need: Bears are unwilling to return to the market. However, today they managed to succeed around the resistance of 1.3565. Besides, I advise traders to further focus on it. Sellers' key task is to defend this range as it is not recommended for the pound to move higher. In this case, all bears' efforts to build a downtrend and put the pound in the channel again will be ineffective. A false breakout at 1.3565 combined with US strong producer prices data provides a good entry point to the short positions. It is possible to expect the return of the bear market and the pair's decline to the support area of 1.3530. A breakout and the test of this range from the bottom to the top will give an additional entry point to short positions with the downside target of 1.3496 and 1.3465. A more distant target is the area of 1.3434, where I recommend taking profit. IF the pair rises during the US session and sellers show weak activity at 1.3565, it is better to postpone selling to the level of 1.3602. I also recommend opening short positions there in case of a false breakout. It is possible to sell the GBP/USD pair immediately for a rebound from the level 1.3640, with the goal of a downward rebound of 20-25 pips within the day.
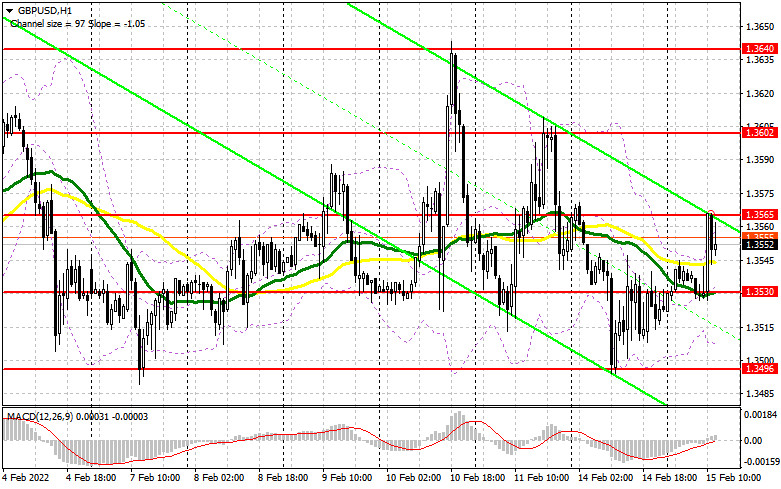
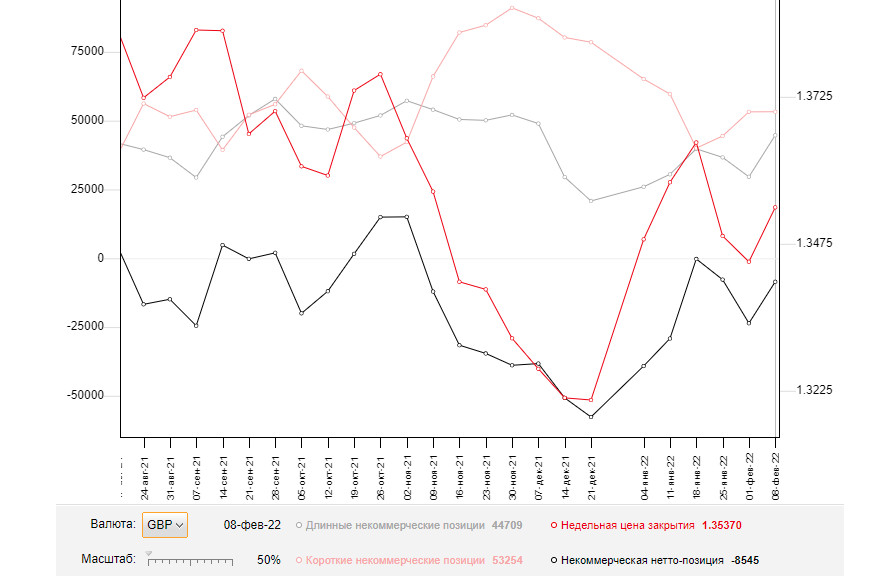
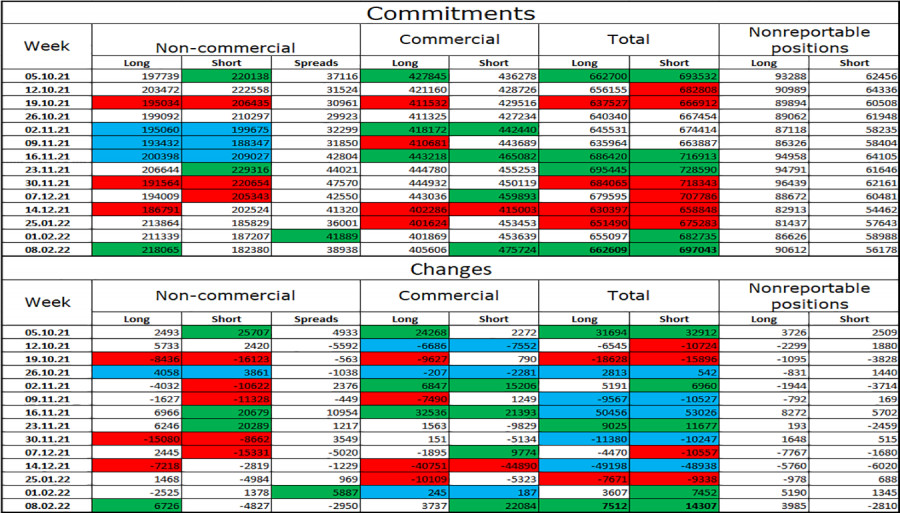
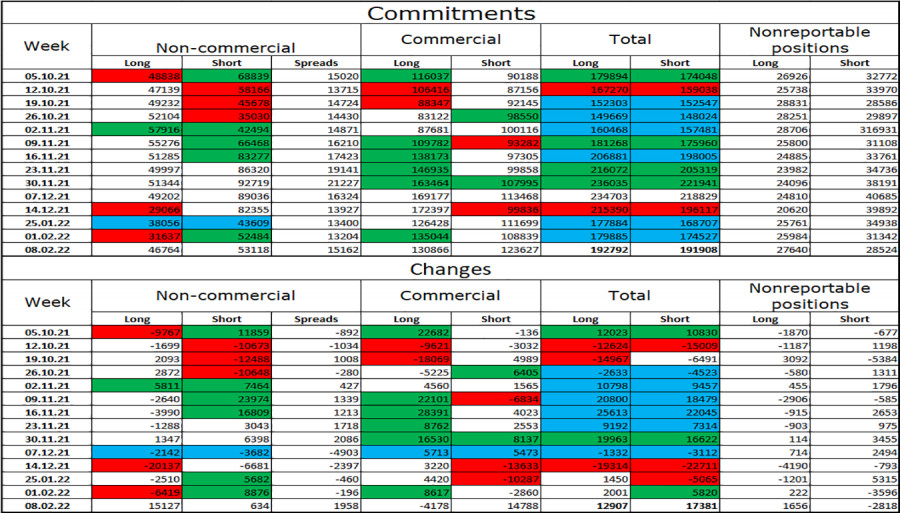
I recommend to review: The COT reports for February 8 recorded a significant increase in both short and long positions. The latter were much numerous, which led to a reduction of the negative delta. However, the negative value has remained, indicating that sellers dominate in the market. Notably, this report takes into account the outcome of the Bank of England meeting, where it was decided to raise the interest rates. However, it did not favor the pound much as it is clear that these changes were made to fight high inflation. Considering that the British economy is facing a crisis and the economic growth could slow down at any moment, raising the interest rates has not resulted in the rapid growth of the British pound. Geopolitical events around Russia and Ukraine, as well as the Federal Reserve's decisive action on future interest rates this March exert pressure on pound buyers and are an additional deterrent to the bull market for GBP/USD. Some traders expect that the US central bank may resort to more aggressive policy and raise interest rates immediately by 0.5% rather than 0.25%. In this case, it will be a bullish signal for the US dollar. The February 8 COT report indicated that long non-commercial positions rose from 29,597 to 44,709, while short non-commercial positions increased not significantly from 53,202 to 53,254. This fact led to a sharp decline in the negative nonprofit net position from -23,605 to -8,545. The weekly closing price rose from 1.3444 to 1.3537.
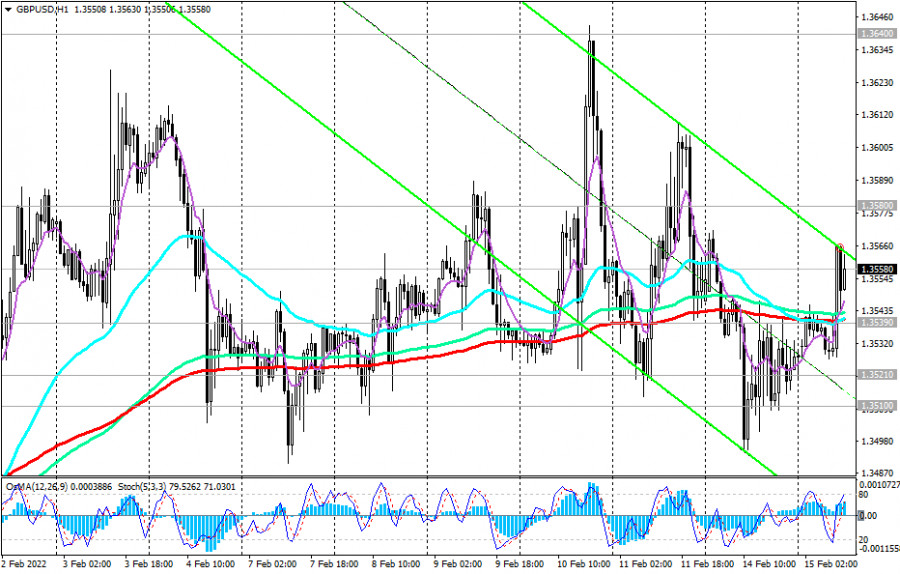
Indicator Signals: Moving averages. Trading is conducted above the 30 and 50 day moving averages, however, it does not yet indicate a break in the bearish movement. Note. The period and prices of moving averages are considered by the author on hourly chart H1 and differ from the common definition of classic daily moving averages on daily chart D1. Bollinger Bands. In the case of decline, the lower boundary around 1.3515 of the indicator will act as support. In the case of growth, the middle indicator boundary around 1.3555 will act as resistance. Description of indicators
|
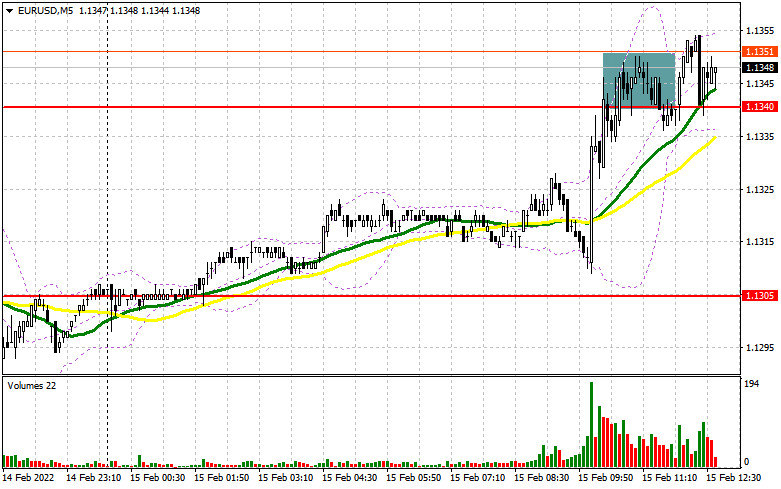
| Posted: 15 Feb 2022 03:35 AM PST To open long positions on EURUSD, you need: In my morning forecast, I paid attention to the 1.1340 level and recommended making decisions on entering the market from it. Let's look at the 5-minute chart and figure out what happened. Considering that no people were willing to buy the US dollar after yesterday's extraordinary meeting of the Fed, and let me remind you that no changes were made in interest rates - euro buyers did not miss the moment and, taking advantage of good statistics on Germany, returned the pair to the 1.1340 area. The formation of a false breakdown there led to a sell signal, but I did not wait for a major downward movement. Sometime later, a breakdown and a test of this level took place from top to bottom, which led to the formation of a signal to buy the euro - valid at the time of writing. In the afternoon, the technical picture changed. And what were the entry points for the pound this morning?
During the American session, we are waiting for the next data on inflation in the United States, which may tip the scales on the side of dollar buyers. But given the fact that the data are released at producer prices, and there is a very serious spread of indicators due to the crisis in the energy market, it is unlikely that even the most serious changes will be able to affect the attitude of the Federal Reserve System to the issue of monetary policy. The most optimal scenario for buying the euro in the afternoon will be the formation of a false breakdown in the support area of 1.1325, just below which the moving averages are playing on the side of the bulls. An equally important task of the bulls during the American session is to control the new level of 1.1366, to which the pair is now gradually approaching. A breakthrough of 1.1366, as well as a top-down test together with weak data on the Empire Manufacturing manufacturing index - all this will lead to an additional signal to buy the euro and open up the possibility of recovery to the area of 1.1406. A breakdown and a test of this level from top to bottom will open a direct road to 1.1452 and 1.1491, where I recommend fixing the profits. If the pair declines during the American session and there is no activity at 1.1325, most likely the bulls will begin to experience serious problems since the inability to catch on to 1.1325 can seriously affect the new upward correction movement of the euro. In this case, it is best to postpone purchases until 1.1283. However, I advise you to open long positions there when forming a false breakdown. You can buy the euro immediately for a rebound against the bear market from the level of 1.1235, or even lower - around 1.1200 with the aim of an upward correction of 20-25 points within the day. To open short positions on EURUSD, you need: Sellers are not in a hurry to return to the market yet, especially after the data indicating an improvement in the index of sentiment in the German business environment. It is unlikely that during the American session we will observe the bears' attempts to actively sell the euro, so the whole focus will shift to protecting the nearest resistance of 1.1366. An exit above this level will return the market to buyers of risky assets. Therefore, only the formation of a false breakdown at 1.1366 and a sharp jump in producer prices in the United States - all this will increase pressure on the pair and form an entry point into short positions to reduce to the area of 1.1325 formed by the results of European trading. A breakdown and a bottom-up test of this range will give an additional signal to open short positions already with the prospect of falling to a large weekly low of 1.1283, and a more distant target will be the 1.1235 area, where I recommend fixing the profits. In the case of a rise in the euro and the absence of bears at 1.1366, it is best not to rush with sales. The optimal scenario will be short positions when forming a false breakdown at the maximum of 1.1406, above which it will be quite problematic for bulls to get out. There will be active profit-taking on long positions from speculative players. You can sell EUR/USD immediately on a rebound from the maximum of 1.1452, or even higher - around 1.1491 with the aim of a downward correction of 15-20 points.
The COT report (Commitment of Traders) for February 8 recorded the growth of long positions and the reduction of short ones. This report already takes into account the meeting of the European Central Bank, at which its president Christine Lagarde made it clear to all market participants that the regulator will act more aggressively if the observed picture with inflation does not change, or changes for the worse. Last week, officials from the ECB took a wait-and-see attitude, and a technical reversal of the bull market led to a decline in the EUR/USD pair. Demand for risky assets also decreased due to the risk of a military conflict between Russia and Ukraine. However, a more weighty argument for the observed downward movement of the EUR/USD pair is the actions of the Federal Reserve System about interest rates. On Monday, February 14, an extraordinary meeting was held, the results of which were preferred to be hidden from the public - this is even more adding fuel to the fire that is flaring up around high inflationary pressure in the United States. Some economists expect that the central bank may resort to more aggressive actions and raise rates immediately by 0.5% in March this year, rather than by 0.25%, as originally planned. This is a kind of bullish signal for the US dollar. The COT report indicates that long non-commercial positions increased from the level of 213,563 to the level of 218,973, while short non-commercial positions decreased from the level of 183,847 to the level of 180,131. This suggests that traders continue to build up long positions with every good decline in the European currency. At the end of the week, the total non-commercial net position increased slightly and amounted to 38,842 against 29,716. The weekly closing price jumped and amounted to 1.1441 against 1.1229 a week earlier. Signals of indicators: Moving averages Trading is conducted above 30 and 50 daily moving averages, which indicates an attempt by euro buyers to return to the market. Note: The period and prices of moving averages are considered by the author on the hourly chart H1 and differ from the general definition of the classic daily moving averages on the daily chart D1. Bollinger Bands In the case of a decline, the lower limit of the indicator around 1.1283 will act as support. Description of indicators
|
| Stock rally halted over geopolitical tensions Posted: 15 Feb 2022 03:09 AM PST
US stocks edged lower on Monday amid geopolitical tensions in the US. The S&P 500 posted its third consecutive decline, while the tech-heavy Nasdaq 100 closed near its opening price. Bond yields, on the other hand, rose amid gains in shorter maturities. That move led to the flattening of the curve, with the gap between two- and ten-year interest rates narrowing.
Ukrainian President Volodymyr Zelensky briefly spooked the markets with his statement that his office later said was sarcastic. It was about the escalating tensions in the West, which, if avoided, could prompt a short rally, said George Ball, chairman of Sanders Morris Harris Investors were also on edge as bets on the pace of rate hikes after the Fed's January meeting shifted to six or seven this year. Strategists at JPMorgan, led by Marko Kolanovic, said global markets are already taking into account potential aggressive waves of monetary tightening this year. St. Louis Fed President James Bullard said on Monday that the central bank needs to move ahead with the plan on raising rates in order to highlight their ability to fight inflation. "I do think we need to preload more planned housing removals than we used to," he said. But Oksana Aronov of JPMorgan said bonds are unlikely to have "a happy ending" if interest rates are raised. She added that "we are in somewhat of a hot mess. We're in the middle of the Fed's last policy mistake and concerned about their next policy mistake. Right now, caution is the name of the game." Other key events for this week are: - release of US PPI on Tuesday; - publication of EIA crude oil inventory report on Wednesday; - release of FOMC minutes on Wednesday; - publication of China CPI and PPI on Wednesday; - speeches of Cleveland Fed President Loretta Mester and St. Louis Fed President James Bullard on Thursday. - US Monetary Policy Forum on Friday. The material has been provided by InstaForex Company - www.instaforex.com |
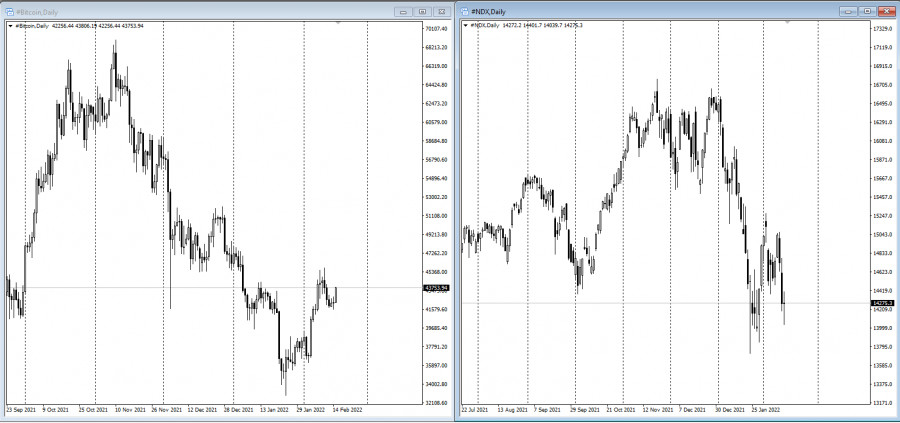
| Nasdaq has become more volatile than Bitcoin Posted: 15 Feb 2022 02:50 AM PST
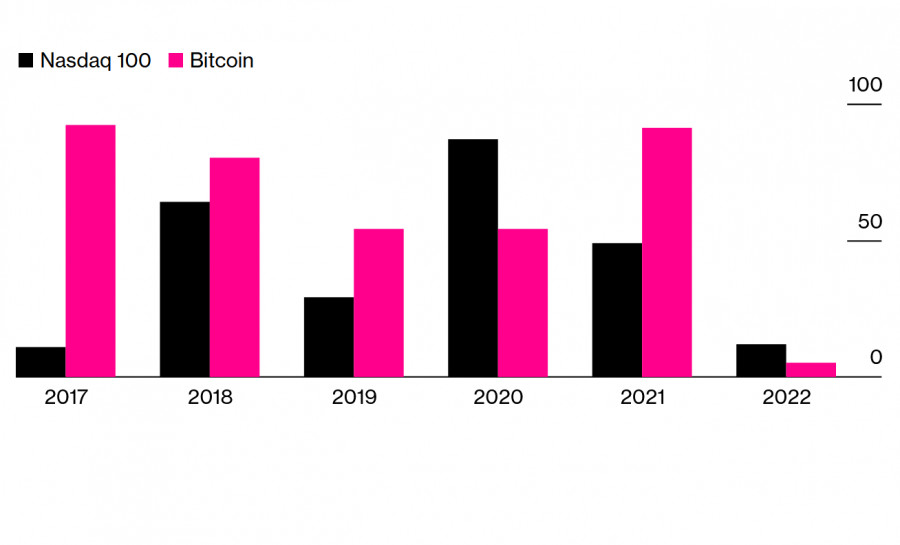
Nasdaq 100 index fell nearly 13% in 2022, much larger than Bitcoin's 8% drop. It seems that the tech-heavy index is now more volatile than Bitcoin despite having fewer trading days than the cryptocurrency.
But the sell-off last January, which sent prices below $33,000, appears to have left a mark on risk appetite as total spot volume on crypto exchanges fell to $1.8 trillion in January, down 30% from the previous month. This decrease in trading volume creates problems for crypto markets because volatility is part of its attraction. Juthica Chou of Kraken said a big catalyst for Bitcoin's bullish run in 2017 was the lack of activity in the stock markets. Back then, the Nasdaq 100 only posted 11 moves, much lower than Bitcoin's 92 moves. "Certainly as there's opportunity in the broader market that will take away a little bit from allocating capital to crypto,"Chou said. "At the end of the day, Bitcoin is the size of one large tech company. It's not necessarily going to be able to produce the returns that some of these larger, high-frequency firms may look at," she added. The material has been provided by InstaForex Company - www.instaforex.com |
| India calls for a ban on cryptocurrencies Posted: 15 Feb 2022 02:40 AM PST
The Central Bank's chatter continues to negatively affect the cryptocurrency market. The government and regulators in India continue to be negative about all kinds of cryptocurrencies. At the same time, several governments and regulators, and even the IMF, have called for a global system to regulate them. However, the lack of regulatory laws has led some to call for an outright ban. These calls for a ban on crypto and crypto mining continue to make the news. The head of the Hungarian central bank called for a ban on cryptocurrency trading and mining.
However, Central Bank Governor Gyorgy Matolcsyi was not alone. Bitcoin mining has been subjected to increased scrutiny, and some countries have imposed bans or are considering taking such measures. Erik Thedeen, European Securities and Markets Authority Vice-Chairman, called for a ban on mining just last month. At the end of the year, news that Indian regulators were searching cryptocurrency exchanges on suspicion of tax evasion sent a wake-up call of increased scrutiny. India's Prime Minister Narendra Modi also spoke about cryptocurrencies at Davos 2022, calling for cooperation with a common approach to address emerging issues related to cryptocurrencies.
Just yesterday, news surfaced online that crypto market representatives were meeting with Indian regulators to discuss crypto. Last Friday, crypto industry representatives reportedly met with politicians for the first time since Finance Minister Nirmala Sitharaman's announcement on tax policy in early February.
According to the report, representatives called on the government to reconsider its 30% tax on cryptocurrency. For crypto exchange investors, Friday's meeting seems to have caused a negative reaction from regulators as RBI Deputy governor Shri T. Rabi Sankar called for a ban on cryptocurrencies yesterday. He highlighted key issues, including the use of cryptocurrencies to evade state control and the threat to India's banking and monetary system. However, the market reacted weakly to this news.
A government-imposed ban now seems unlikely after news of a 30% tax on cryptocurrencies. The material has been provided by InstaForex Company - www.instaforex.com |
| Royal Mint sees record demand for gold Posted: 15 Feb 2022 02:36 AM PST
In a press release published last week, the Royal Mint said demand for bullion products surged internationally, with US investors leading the way. Investors have avoided paper gold for most of 2021, but appetite for physical gold and silver remained high in the last quarter of 2021. Reportedly, international sales in the fourth quarter of 2021 were up 14.4% compared to the same quarter in 2020, while purchases of one-ounce Britannia bars and coins from US consumers increased by 96%. International sales of silver bars also rose by 34%. Germany and the US were the leaders of growth, and in January the World Gold Council revealed that the US bought 117 tons of gold bars in 2021, up 69% from 2020. That raised global demand for gold and bullion to 1,180 tons, 31% higher than the previous figure. Analysts say it was rising inflationary pressures and growing economic uncertainty that made physical gold an attractive asset. Geopolitical tension is also a factor why demand for precious metals returned. That is why it was not surprising that gold rose above $1,860 after geopolitical tension in the US escalated and after the Fed had an unscheduled meeting on Monday.
|
| EUR/USD analysis on February 15, 2022. James Bullard calls for 1.00% rate hike by July 1 Posted: 15 Feb 2022 02:20 AM PST
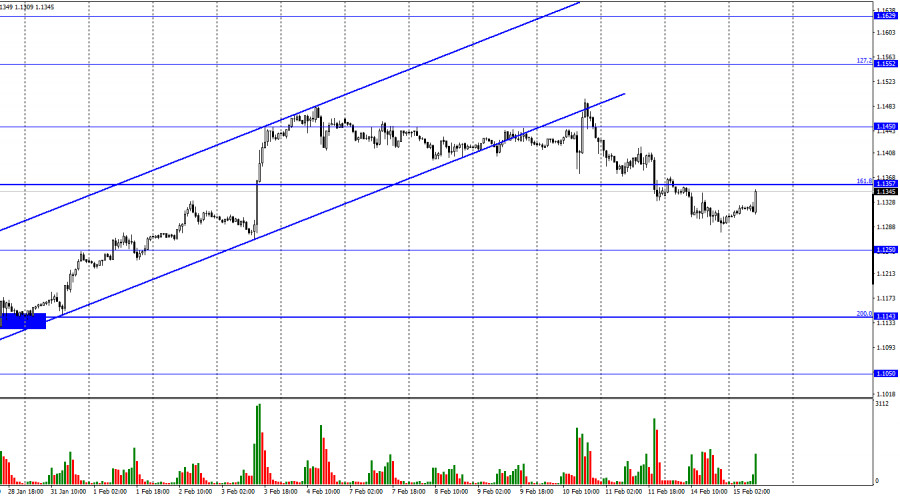
On Monday, the EUR/USD continued to decline towards the level of 1.1250 after settling below the correction level of 161.8% - 1.1357. The activity of traders was low, but the European currency was still steadily falling. The information background on Monday was quite poor. Apart from the Fed's unscheduled meeting, there was no major news. This morning, it was reported that the results of the meeting will not be revealed. If this is true, then the Fed is unlikely to raise the rate secretly. In this case, traders should wait for the next Fed meeting, which will be held on March 15-16. At the same time, James Bullard, the president of the St. Louis Federal Reserve and one of the most ardent supporters of monetary tightening, supported a 1% rate hike by July 1, 2022. In his opinion, the Fed's expectations that inflation would start to slow down without the intervention of the central bank did not come true. He noted that the last four reports on inflation turned out to be "depressing," and confidence in the Fed is declining since the organization itself is not taking any measures to curb price growth and return inflation to the target level of about 2%. Bullard also believes that the time when the Fed could afford to prepare the markets for a rate hike is over. Now the regulator needs to act clearly and quickly, but the final word will be with Fed President Jerome Powell. Bullard himself considers his proposal a good one and will try to convince other FOMC members to support his plan. Thus, the situation around the Fed interest rate is now being escalated in much the same way as the situation around Ukraine. The European currency is influenced by this background, unlike the British pound. However, the situation is much less favorable for the euro compared to the US dollar since the ECB is not going to raise the rate this year, and the Bank of England has already done it twice.
On the 4-hour chart, the pair settled below the retracement level of 127.2% - 1.1404 and continues to decline towards the 161.8% Fibonacci level which corresponds to 1.1148. At the moment, there are no emerging divergences today shown by any indicator. Yet, there is no need for them given the current information background. COT report:
Over the last reporting week, speculators opened 6,726 long contracts and closed 4,827 short contracts. This indicates a bullish shift in their sentiment. The total number of open long contracts is 218,000 and short contracts - 182,000. Thus, the overall mood of the non-commercial category of traders is characterized as bullish. This would enable the euro to grow if not for the information background which fully supports the US currency. I believe that this week, the COT report may not be taken into account as the situation in the world is tense and the mood of major players can change rapidly. Economic calendar for US and EU: European Union - ZEW Economic Sentiment (10-00 UTC). European Union - GDP growth (10-00 UTC). US - Producer Price Index (13-30 UTC). On February 15, the economic calendar for the US and the EU has several events none of which can be considered important. Today's news background can have only a small impact on the market. Outlook for EUR/USD and trading tips: I recommended opening new short positions with the targets at 1.1357 and 1.1250 if the price consolidates below 1.1404 on the 4-hour chart. At the moment, these trades can be kept open. Buying the pair is not advisable now as the likelihood of a continued decline is still high. The material has been provided by InstaForex Company - www.instaforex.com |
| GBP/USD analysis on February 15, 2022. GBP up amid strong data form UK Posted: 15 Feb 2022 02:19 AM PST
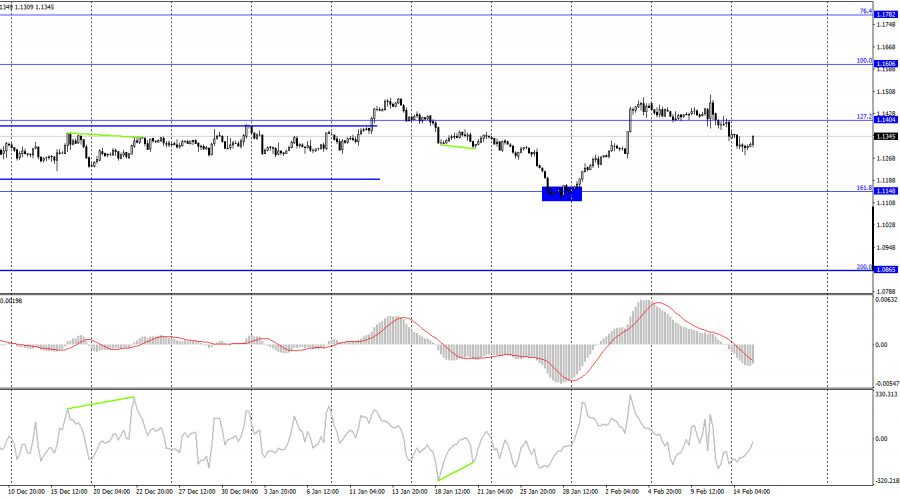
On Monday, GBP/USD fell to the retracement level of 38.2% - 1.3507 on the H1 chart. A pullback from this level supported the British pound and initiated growth. Today, bulls have gained ground amid strong economic data from the UK. Consolidation above 50.0% - 1.3552 will facilitate further growth towards the next Fibonacci level of 61.8% - 1.3599. Indeed, the UK macroeconomic data turned out to be rather strong. Unemployment remained unchanged at 4.1%, but this rate is considered the minimum one in many countries (for example, the US has the same unemployment rate). The number of jobless claims fell by 32,000, broadly in line with traders' expectations. Average wages rose by 4.3% in December against expectations of +3.8%. However, these data has had a slight effect on the market, and here is why. This morning, it was reported that units of Russia's southern and military district started to pull to their base. The Russian ruble immediately recovered amid this news, while the US dollar faced a risk of a sell-off wave as it is widely used as a safe-haven asset in times of political uncertainty. Thus, when tensions ease, the greenback weakens. Therefore, it seems that today traders have largely reacted to the news about Russian troops pulling back from the Ukrainian border even though it was only a small part of them. Nevertheless, this can be a signal of de-escalation, and there is hope that diplomats will eventually reach an agreement. Either way, this is good news. No more important economic events are expected today, but there may be news regarding the Russia-Ukraine conflict.
On Friday, the pair consolidated twice above the descending trendline on the 4-hour chart. However, GBP failed to develop further growth. Today, the quotes have again returned to this line in an attempt to consolidate above it for the third time. If this attempt turns out to be successful, the price may continue to grow towards the retracement level of 38.2% - 1.3642. There are no emerging divergences in any of the indicators today. COT report:
The sentiment of the non-commercial group of traders has changed dramatically over the last reporting week. A week earlier, speculators increased the number of short contracts. Today, on the contrary, they are adding more long positions, the number of which has increased by 15,127. This is a vivid example of how quickly the sentiment of major players is changing. The overall mood of speculators can now be called bearish as they have more short contracts opened. But, as I said, the mood of traders is changing too quickly, and the current information background may contribute to these changes. Economic calendar for US and UK: UK – Claimant Count Change (07-00 UTC). UK – Employment Change (07-00 UTC). UK – Average Earnings Change (07-00 UTC). US – Producer Price Index (13-30 UTC). On Tuesday, all scheduled reports in the UK have already been published. The data on producer prices in the US is unlikely to influence the market today. For the rest of the day, the information background will remain weak. Outlook for GBP/USD and trading tips: I would recommend selling the pound now although there are no sell signals on the 4-hour chart. At the same time, there are plenty of sell and buy signals on the 1-hour chart. Traders are still nervous, so the price movements can be very rapid and strong. The material has been provided by InstaForex Company - www.instaforex.com |
| Rate hikes and bond market crisis: BTC to become main investment haven for large firms Posted: 15 Feb 2022 02:17 AM PST Investors may now relax after a busy Monday and the end of the closed FOMC meeting. The massive risk hedging campaign has ended, and investment in risky assets has resumed. Consequently, the altcoins market showed spectacular growth and the total capitalization of the cryptocurrency market soared 6%, approaching the psychological mark of $2 trillion. The Federal Reserve released the results of the closed meeting. The regulator kept interest rates unchanged at least until the next meeting scheduled for March 16. The main topic for consideration at the closed meeting was risk associated with leveraged loans in 2021 that remained at the high level although the situation somewhat improved from the first six months of 2021. The Federal Reserve also touched on the change in the percentage of non-pass loans. The figure decreased but remain at an acceptable level. On the one hand, the US central bank may seem to continue summing up the results of 2021. On the other hand, the regulator is definitely preparing for the upcoming changes in monetary policy this year. According to Goldman Sachs, there could be 7 rate hikes in 2022. Monetary policy tightening is expected to harm the equity and cryptocurrency markets. However, CEO Fundstrat Global Advisors Tomas Lee suggests that in the long term, digital assets will benefit from it.
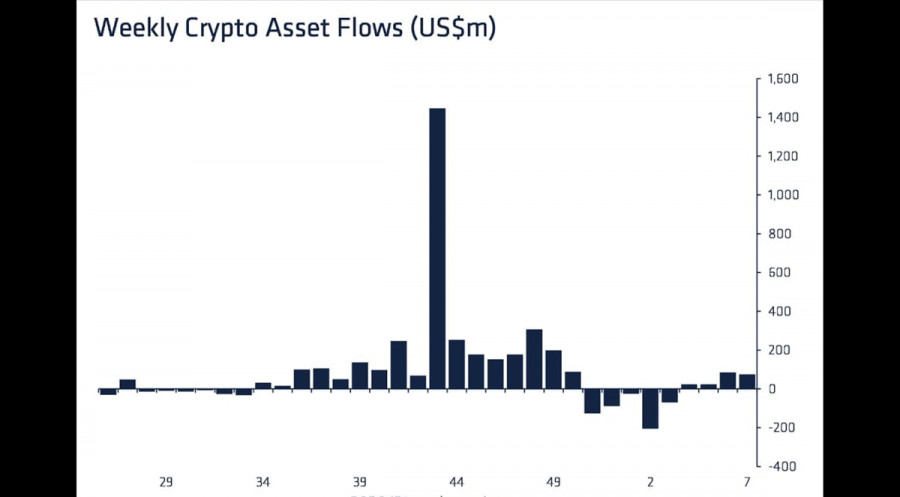
He believes that rate hikes will cause a crisis in the bond market. Over the next decade, investors could lose about $60 trillion. At the same time, Lee assumes there will be a massive shift of large capital towards cryptocurrency assets and products as investors will be willing to find an effective alternative to bonds, albeit more volatile. Lee says investors will remain in the stock market, but the cryptocurrency industry will become the main investment haven for market participants. The cryptocurrency market may expand by 60 trillion over the next decade, the analyst estimated. At the same time, bitcoin will account for the bulk of such investments as it is considered the safest financial instrument. So, the future of the entire industry will depend on the safety of the flagship cryptocurrency. Meanwhile, Bloomberg suggests the adoption of BTC will continue and the asset will be used as collateral for loan transactions in the near future. This will be beneficial to the mass adoption of the coin. Crypto funds keep showing positive dynamics despite the upcoming FOMC meeting. Weekly crypto asset flows totaled $75 million last week, indicating a great growth potential of most digital assets.
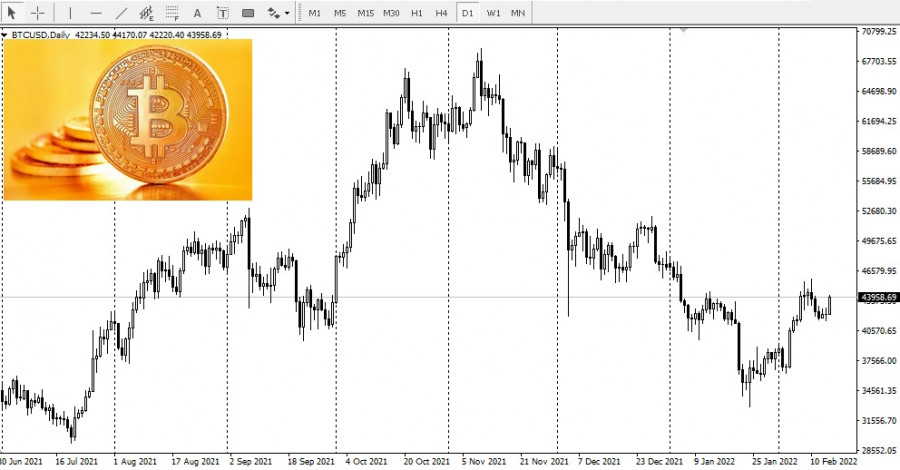
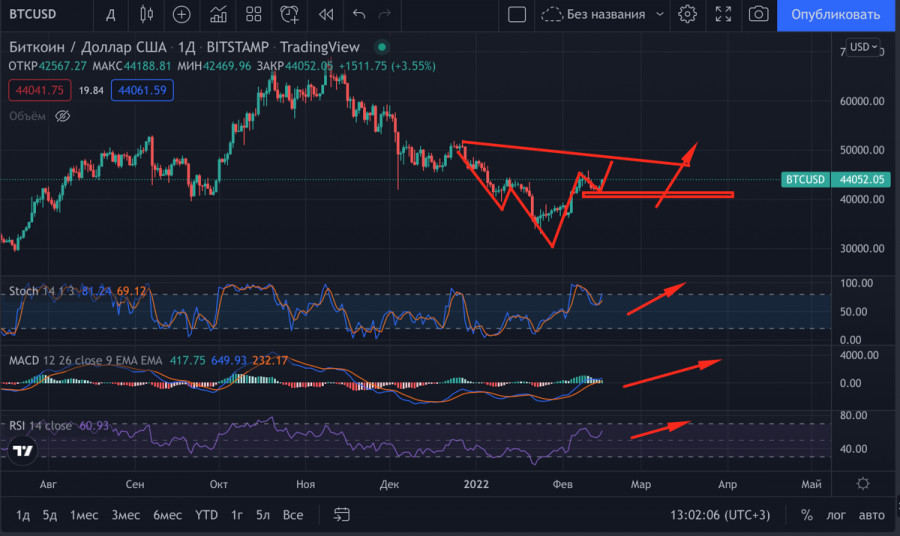
Technically, BTC may retest the $45K mark and head towards $46K. BTC added gains after the closed FOMC meeting. The key support zone of $45K was not broken, which means the coin may head towards $46 soon. The line of the head and shoulders pattern is passing there. Technical indicators are signaling a breakout. So, the MACD has crossed the zero line and a bearish crossover is now forming. Meanwhile, the Stochastic and the RSI are moving up, indicating the increased activity of buyers and their readiness to consolidate above $45K.
|
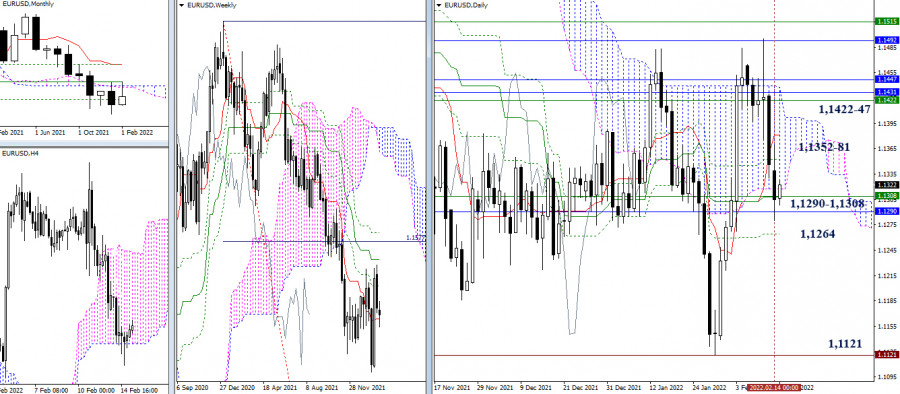
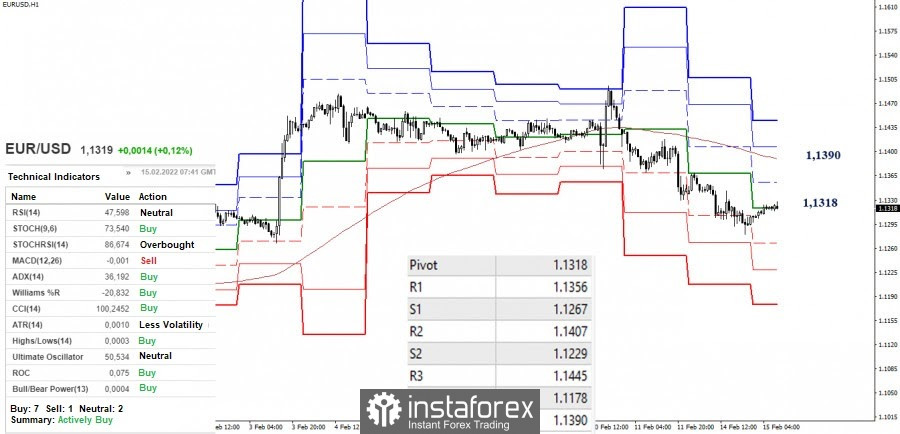
| Technical analysis recommendations of EUR/USD and GBP/USD on February 15, 2022 Posted: 15 Feb 2022 02:05 AM PST EUR/USD
The advantage yesterday mainly belonged to bears, who updated last week's low and declined to the area of combining strong supports of 1.1308 - 1.1290 (daily levels + weekly short-term trend + monthly Fibo Kijun). The result of the interaction will determine the nearest course of events. On the contrary, the formation of rebound will return the pair first to the daily resistances (1.1352 - 1.1381), and then to the resistances of 1.1422-47. A breakdown and a reliable consolidation below will allow the bears to build plans to further strengthen their sentiments, but to restore the downward trend, it will still be necessary to pass a significant distance and update the low (1.1121).
The bears have the main advantage in the smaller timeframes. However, the pair is currently in the upward correction zone. In turn, the bulls are now fighting for the central pivot level (1.1318). A consolidation above which will open the way to the next important level – a weekly long-term trend (1.1390). The nearest resistance on this way today can be noted at 1.1356 (R1). In contrast, the rebound and recovery of the downward trend on the hourly chart will return relevance to the support of the classic pivot levels (1.1267 - 1.1229 - 1.1178). GBP/USD
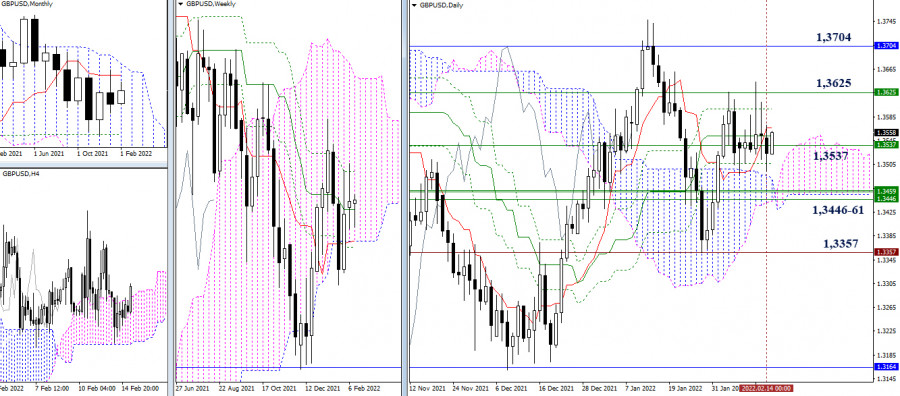
The development of events continues to remain in the attraction zone, led by a weekly medium-term trend (1.3537), so uncertainty dominates in the daily timeframe. The main pivot points continue to remain in the same places, which also contributes to the preservation of the alignment of the situation, already announced earlier.
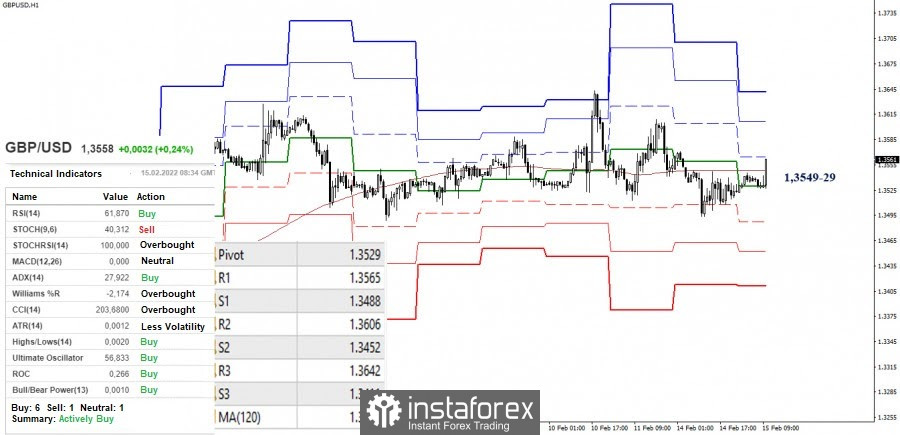
The uncertainty in the higher timeframes leads to instability in the smaller ones. The opposing sides often lose their advantage, and as a result, they cannot develop an activity for a long time and remain tied to key levels that have been in a horizontal position lately. Today, the key levels in the smaller timeframes are consolidating around 1.3549-29 (central pivot level + weekly long-term trend). The possession of levels determines the current advantage of players in the market. Classic pivot levels act as intraday pivot points. Their resistances are currently set at 1.3565 - 1.3606 - 1.3642, while the supports are at 1.3488 - 1.3452 - 1.3411. *** Ichimoku Kinko Hyo (9.26.52) and Kijun-sen levels in the higher time frames, as well as classic Pivot Points and Moving Average (120) on the H1 chart, are used in the technical analysis of the trading instruments. The material has been provided by InstaForex Company - www.instaforex.com |
| Ambitious plans, betting against USD Posted: 15 Feb 2022 01:52 AM PST
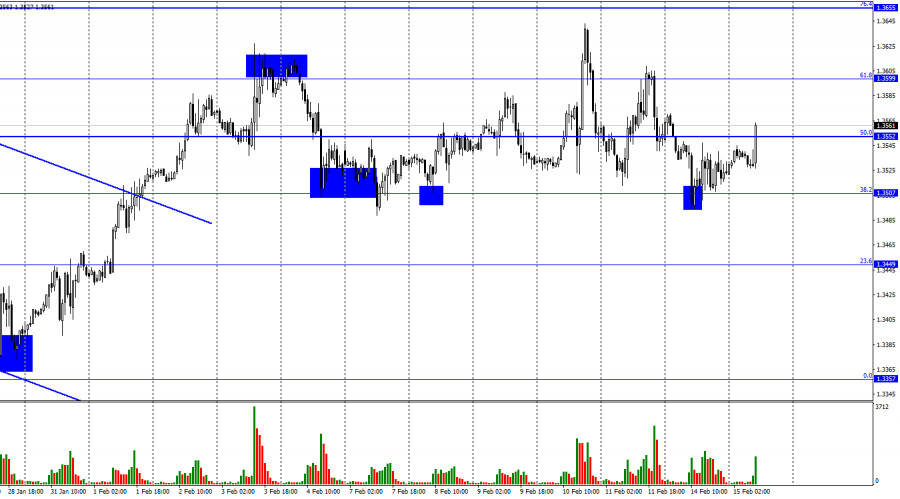
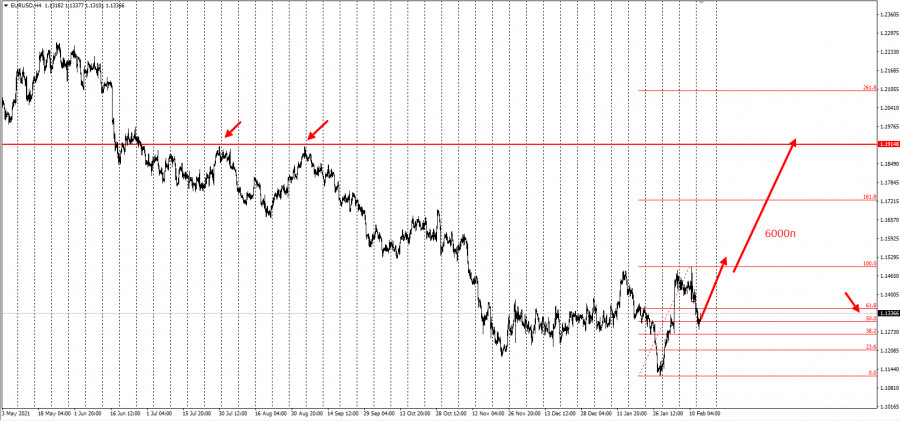
Hi, dear traders! Let me present you with my trading ideas for EUR/USD, GBP/USD, and AUD/USD. The technical pictures on charts with larger timeframes reveal the common trend. All of them indicate that strong buying sentiment is emerging for major currency pairs. Now let's discuss such trading plans. At the emergency meeting yesterday, the Federal Reserve softened its rhetoric that undermined the US dollar's strength. The US central bank did not increase the official funds rate this time. EURUSD The trading instrument retraced 50% from a stunning rally that developed from historic lows reached in January. In light of yesterday's emergency meeting, EUR/USD revealed signs of a confident rise to update one-year highs and climb even higher.
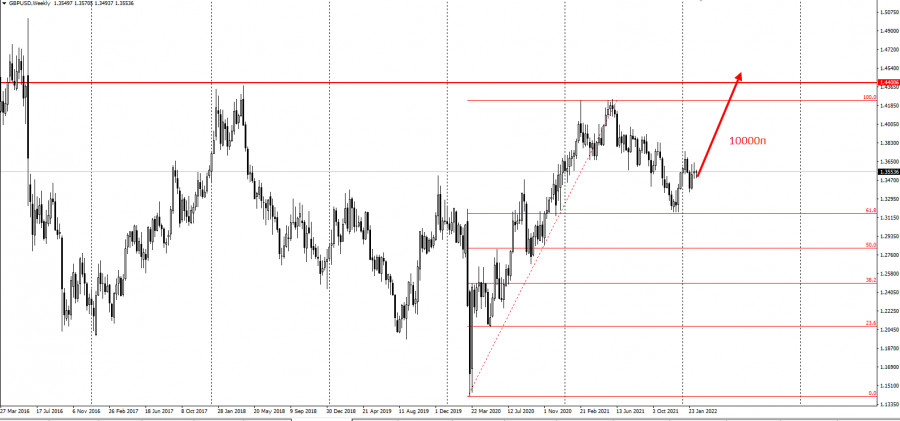
GBPUSD At the end of 2021, the currency pair was testing the 61.8% Fibonacci level following a powerful growth of 2020. Currently, GBP/USD is showing signs of growth to the ambitious target at 1.4444. The potential growth is measured at about 10,000 pips.
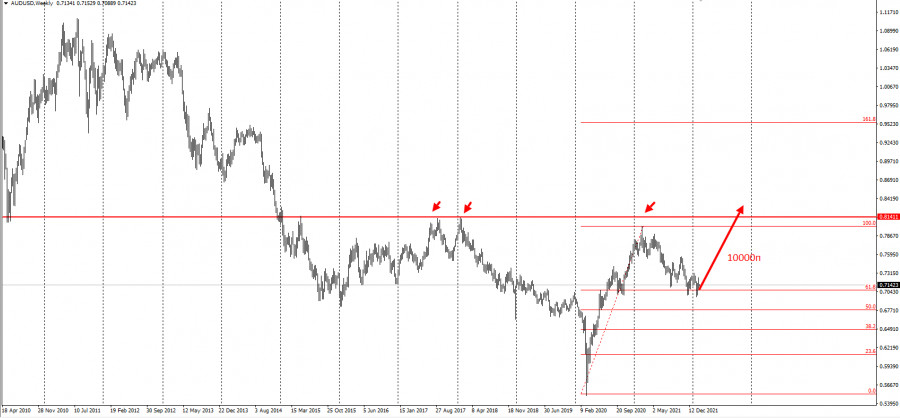
AUDUSD Like GBP/USD, the currency pair has pulled back to the 61.8% Fibonacci level following a rally of 2020. At the moment, AUD/USD is reversing upwards with the potential growth of nearly 10,000 pips.
You might have noticed that all three trading instruments have formed similar wave structures and suggest would-be growth of about 10,000 pips! It would be a good idea to pick any of them. Besides, you could plan long positions with all of them, distributing equal funds. Another option is to enter the market with long positions from shorter time frames following your own trading strategy. The trading ideas are offered in line with my own methods like Price action and Hunting for stop orders. Good luck in trading! Manage your risks! The material has been provided by InstaForex Company - www.instaforex.com |
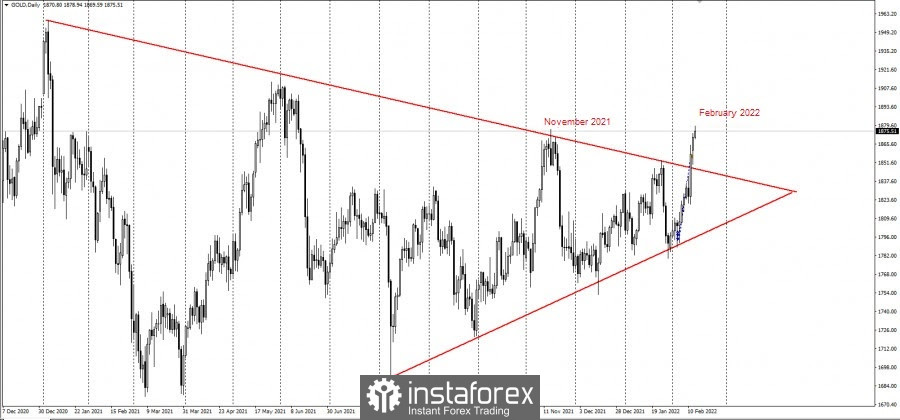
| Gold is a safe-haven asset for all portfolios Posted: 15 Feb 2022 01:30 AM PST
Gold's demand and its price are growing more amid the Fed's unscheduled meeting yesterday and the geopolitical situation. The prices of this yellow metal surged to a new three-month high:
John Reade, World Gold Council's Chief Market Strategist, said that the demand for gold as a safe-haven is positive, but prices could correct sharply if the geopolitical conflict is resolved immediately. And instead of looking at short-term price volatility, the World Gold Council study shows that gold plays a vital role in diversification for any type of portfolio. If the portfolio contains between 4% and 10% of gold, this will be the optimal amount to increase risk-adjusted returns. He made these comments as there was an interesting trend in the gold market last year – investment demand for exchange-traded products lagged behind physical demand. In its annual gold market analysis, the WGC reported that physical demand for this precious metal increased by 10% in 2021 to 4,021 tonnes. 173 tons of gold were liquidated from the ETF. Looking over the rest of 2022, Reade thinks that the gold market is in good shape even though the precious metal faces the prospect that the Fed could raise interest rates seven times this year. As for gold and bitcoin, Reade responded that the two assets are completely different. He explained that although digital currencies improved portfolio returns, they also added risk and volatility. The material has been provided by InstaForex Company - www.instaforex.com |
| Daily Video Analysis: XAUUSD, H4 Buy On Weakness Posted: 15 Feb 2022 01:19 AM PST Today we take a look at XAUUSD. Combining advanced technical analysis methods such as Fibonacci confluence, correlation, market structure, oscillators and demand/supply zones, we identify high probability trading setups. The material has been provided by InstaForex Company - www.instaforex.com |
| Forex forecast 02/15/2022 AUD/USD, USD/JPY, GBP/JPY, EUR/JPY and Bitcoin from Sebastian Seliga Posted: 15 Feb 2022 01:02 AM PST Let's take a look at the technical picture of AUD/USD, USD/JPY, GBP/JPY, EUR/JPY and Bitcoin. The material has been provided by InstaForex Company - www.instaforex.com |
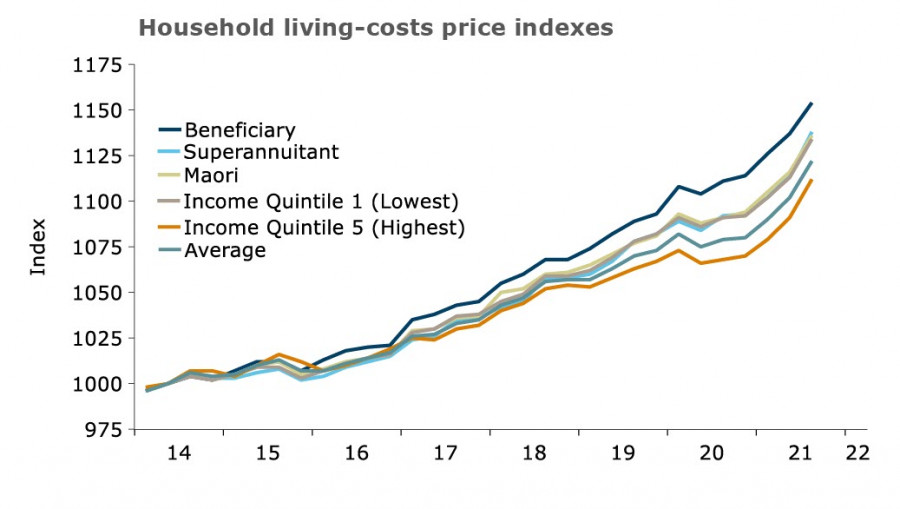
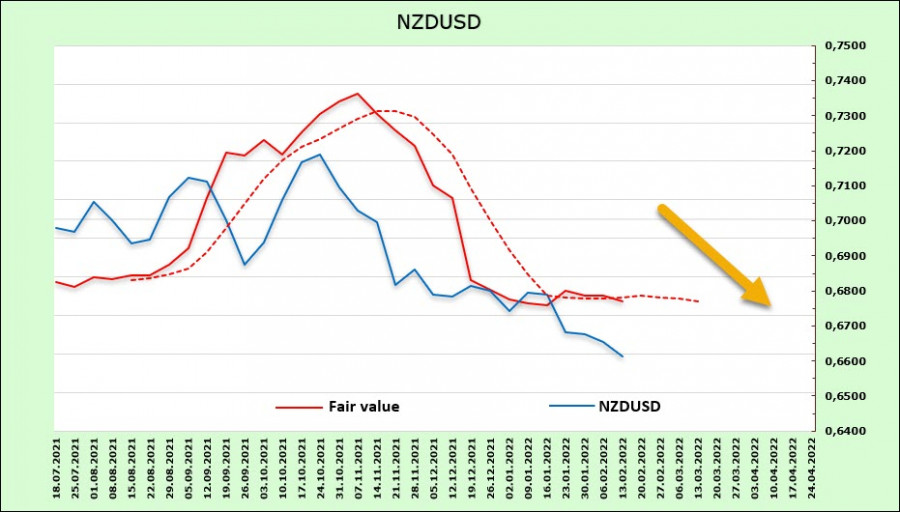
| Demand for risk remains low. The Fed continues to use hawkish rhetoric. Overview USD, NZD, and AUD Posted: 15 Feb 2022 01:00 AM PST The US Fed's emergency meeting on Monday did not lead to any unexpected actions, which investors were slightly afraid of. The issues of the credit market state are considered and its prospects are reassessed in connection with the expected rate hike in March. The probability that the Fed will immediately raise the rate by 0.5% at the next meeting has fallen to 33%, which should somewhat calm the markets. At the same time, Fed officials continue to verbally intervene. The president of the St. Louis Fed, James Bullard, repeated on CNBC his call for the Fed to raise the discount rate by 100 basis points by July. The head of the Kansas Fed, Esther George, also reiterated that the Fed should raise rates outside scheduled meetings and start selling bonds from its portfolio. These speeches support the overall hawkish background on the US dollar, although investors are not in a rush to buy it based on the CFTC report last week. April gold futures are at a three-month high, while oil rose above $96 per barrel for the first time since 2014. All this indicates the weakness of the US dollar, which is currently supported largely by the rhetoric of Fed officials and the artificial escalation of geopolitical tensions. NZD/USD It became slightly clearer why the RBNZ is not in a hurry with rates, despite a record increase in inflation. It can be recalled that six months ago, it seemed that the RBNZ would be ahead of other central banks in terms of normalization rates. But this was not the case. This week, Stats NZ published data on the Household Price Index (HLPI) for the fourth quarter. These data are similar to the Consumer Price Index (CPI), but the HLPI provides detailed information on how the rising cost of living affects different households. Here, it shows that there has been a significant increase in the cost of living in all households in recent years.
The total cost of living in the 4th quarter rose by 5.2%, which is slightly lower than inflation (+5.9%), but it makes it clear that if the RBNZ starts raising the rate in an attempt to ease the growing inflationary pressure, heavily indebted households will experience significant cost-covering problems. Data on food, rent, and housing prices will be released this week. If there is a steady increase, then the RBNZ will have no choice but to raise the rate, but if growth slows down, this will reduce market expectations for the rate. In any case, it can be assumed that there is no more outstripping growth in yields and the demand for New Zealand assets will remain low, which excludes a strong growth in demand for NZD. The futures market is unchanged. The net short position in NZD fell by 87 million over the reporting week, reporting to -689 million. It shows that there are no purchases from investors as the estimated price does not increase.
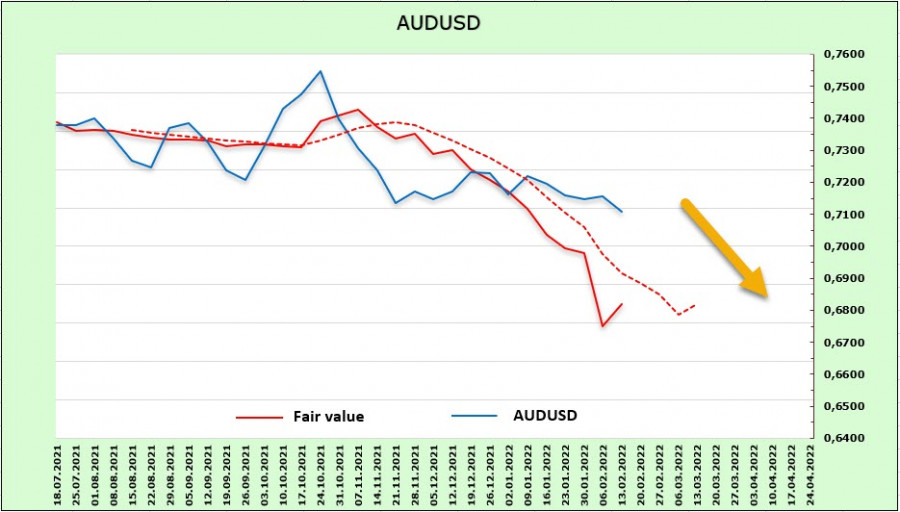
As expected last week, the New Zealand dollar held above the local low of 0.6520 but found no reasons to rise either. An upwards pullback is possible. The nearest resistance is 0.6810/20, but it is more likely to continue trading in the range. AUD/USD The Australian dollar continues to be under pressure despite the rise in commodity prices. The CFTC report showed that the net short position did not decrease over the past week but even increased by 436 million, namely to -6.127 billion. This is a strong bearish edge. The settlement price shows the first signs of the end of the decline, which gives a chance for a corrective pullback.
Given the faster-than-predicted economic recovery, rate hike forecasts are shifted to late 2022, which is a weak bullish factor for the Australian dollar that will not solve anything on its own. High uncertainty remains, and the RBA's pace of normalization will noticeably lag behind Fed. The Australian dollar continues to trade closer to the middle of the bearish channel. The probability of breaking through the support level of 0.70 and moving further to 0.6760/70 remains high, which is currently the most likely scenario. A possible upward correction is limited by the zone 0.7290/0.7300 and it is logical to use growth attempts for sales. The material has been provided by InstaForex Company - www.instaforex.com |


| You are subscribed to email updates from Forex analysis review. To stop receiving these emails, you may unsubscribe now. | Email delivery powered by Google |
| Google, 1600 Amphitheatre Parkway, Mountain View, CA 94043, United States | |


Comments