Forex analysis review
Forex analysis review |
- Technical analysis of USD/CHF for February 23, 2022
- Technical analysis of AUD/USD for February 23, 2022
- How to trade EUR/USD on February 24, 2022. Simple trading tips and analysis for beginners
- Trading signals for GOLD (XAU/USD) on February 23-24, 2022: buy above $1,898 (21 SMA)
- BTC February recovery turns out bull trap
- Solana double bottom
- US stock indicators are acutely reacting to the growing tensions between Russia and Ukraine
- The Dollar index vulnerable to more downside.
- Technical analysis on Gold for February 23, 2022.
- Is bear market coming up for crypto?
- Ichimoku cloud indicator analysis on EURUSD for February 23, 2022.
- Simplified wave analysis and forecast for EUR/USD, USD/JPY, GBP/JPY, GOLD for February 23
- Ukraine is going to introduce a state of emergency. There seems to be a war with Russia.
- Video market update for February 23,,2022
- NZD/USD: New Zealand dollar on the upswing
- BTC analysis for February 23,.2022 - Potential for downsdie continuation
- Analysis of Gold for February 23,.2022 - Potential for the drop to take previous lows
- USD/JPY analysis for February 23, 2022 - Upside continuation in the play towards 115.80
- Has gold reached its ceiling?
- The European stock market continues to shake. Investors do not understand what to expect next
- EUR/USD: plan for the US session on February 23 (analysis of morning deals). Euro buyers set their sights on yesterday's
- Forecast for EUR/USD on February 23
- Bitcoin went up after Biden announces sanctions on Russia
- US premarket on February 23: banking and oil sectors among most attractive investment areas
- Trading tips for oil
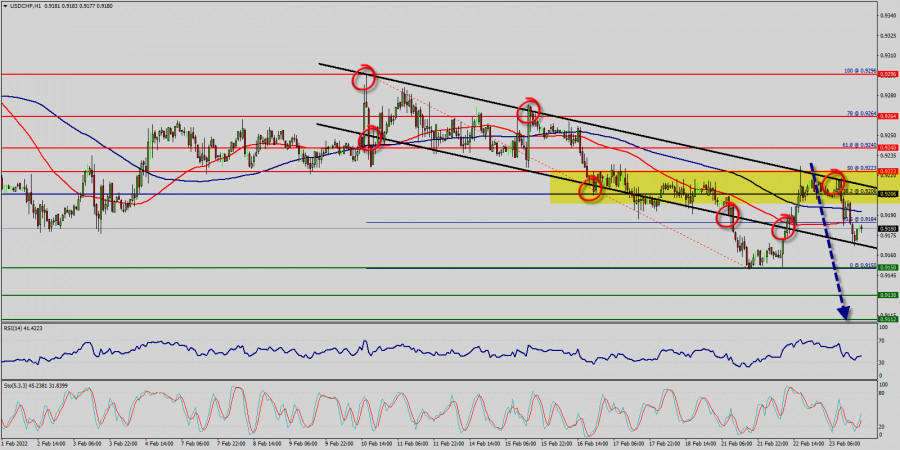
| Technical analysis of USD/CHF for February 23, 2022 Posted: 23 Feb 2022 11:05 AM PST
The USD/CHF pair opened below the daily pivot point (0.9206). It continued to move downwards from the level of 0.9206 to the price around the level of 0.9180. Today, the first resistance level is seen at 0.9206 followed by 0.9264, while daily support 1 is seen at 0.9150. Furthermore, the moving average (100) starts signaling a downward trend; therefore, the market is indicating a bearish opportunity below 0.9206. Therefore, it will be good to sell at 0.9206 with the first target of 0.9150. It will also call for a downtrend in order to continue towards 0.9130. The major daily support is seen at the 0.9112 level, which represents the third support for this week on the H1 chart. According to the previous events, we expect the USD/CHF pair to trade between 0.9206 and 0.9112 in coming hours. The price area of 0.9206 remains a significant resistance zone. Thus, the trend is still bearish as long as the level of 0.9206 is not broken. On the contrary, in case a reversal takes place and the USD/CHF pair breaks through the resistance level of 0.6632, then a stop loss should be placed at 0.9296 The material has been provided by InstaForex Company - www.instaforex.com |
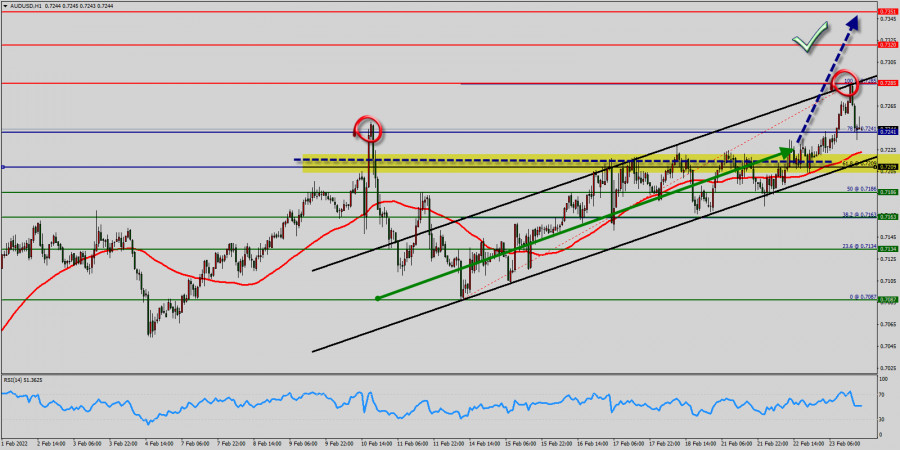
| Technical analysis of AUD/USD for February 23, 2022 Posted: 23 Feb 2022 10:51 AM PST
The AUD/USD pair has broken resistance at the level of 0.7209, which acts as support now. So, the pair has already formed minor support at 0.7209. The strong support is seen at the level of 0.7134 because it represents the last bearish ave. In the H1 time frame, the RSI and the moving average (100) are still pointing to the upside. Therefore, the market indicates a bullish opportunity at the level of 0.7209. Buy above the minor support of 0.7209 with a target at 0.7285 (this price is coinciding with the ratio of 100% Fibonacci - double top). On the other hand, if the pair closes below the minor support (0.7186), the price will fall into the bearish market in order to go further towards the strong support at 0.7163. The falling structure does not look corrective. In order to indicate a bearish opportunity below 0.7209, sell below this level (0.7209) with the first target at 0.7163. Moreover, if the pair succeeds to pass through 0.7163, it will move downwards continuing the bearish trend development to 0.7087 in order to test the daily support 2. However, if a breakout happens at 0.7351, this scenario may be invalidated. Comment: Also, the double bottom is seen at the level of 0.7087. If the trend is buoyant, then the currency pair strength will be defined as following: AUD is in an uptrend and USD is in a downtrend. The material has been provided by InstaForex Company - www.instaforex.com |
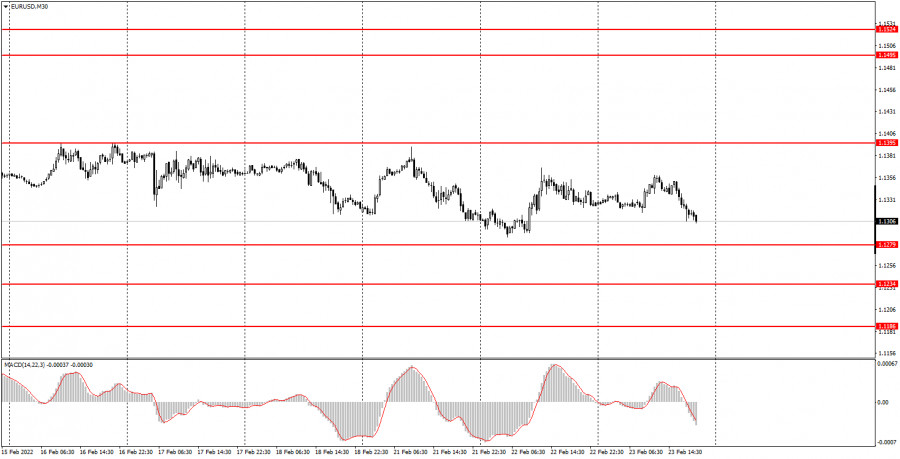
| How to trade EUR/USD on February 24, 2022. Simple trading tips and analysis for beginners Posted: 23 Feb 2022 10:49 AM PST Analyzing trades on Wednesday EUR/USD on 30M chart
On Wednesday, the EUR/USD pair continued to trade within the sideways channel of 1.1279-1.1395. So, the technical picture has not changed much in the past 24 hours. The pair did not even approach the channel boundaries today, so there were no signals on the 30-minute time frame. In addition, there was neither macroeconomic news nor fundamental background. The only key report of the day was the second estimate of the inflation rate for January. The reading did not differ much from the first estimate and amounted to 5.1%. Naturally, there was no market reaction to this report. Market participants are now fully focused on the geopolitical crisis. Although the EUR/USD and GBP/USD pairs seem to downplay any news about the Ukrainian-Russian conflict, the market may still be affected in the event of a full-fledged war. The risk of Russia's military invasion of Ukraine is now really high. Therefore, if this happens, global markets may get into a panic. EUR/USD on 5M chart
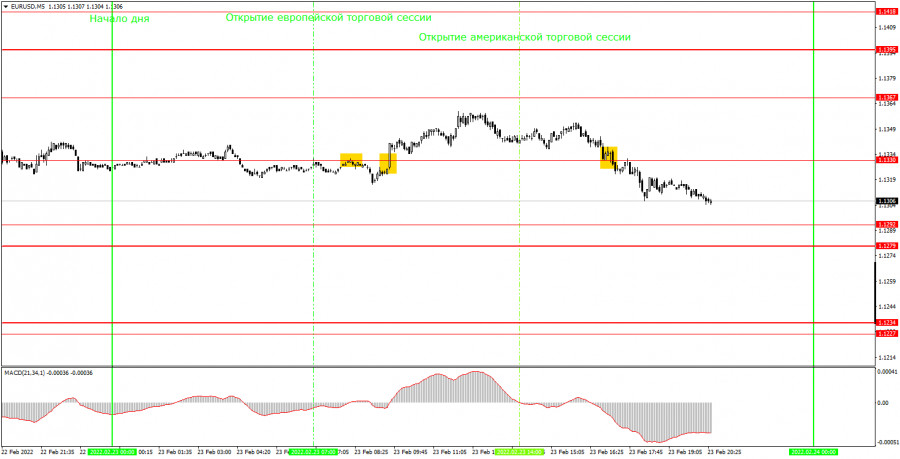
On the 5-minute time frame, three trading signals were formed on Wednesday. The volatility was average as the pair advanced by just 55 pips. Just like yesterday, the pair first went up and then moved lower. However, such movements are natural when the pair is trading flat. Let us take a look at trading signals. It is not easy to trade when the price is moving sideways, and strong signals appear less often. The first sell signal today turned out to be false. The price rebounded from the level of 1.1330 and managed to go down by only 9 pips. Therefore, a sell trade should have been closed manually after consolidation above the level of 1.1330, which was already a buy signal. After the formation of a new signal, the price rose by about 20 pips, so novice traders could at least have time to set a Stop Loss to breakeven. However, the price failed to reach the target level and settled below the level of 1.1330 during the North American session, thus creating a sell signal. However, traders could have ignored this signal as two false signals had been formed near the same level of 1.1330. As a result, today's session was far from perfect but at least we managed to avoid serious losses. The market continues to trade mixed. Trading tips on Thursday On the 30-minute time frame, the latest upside cycle was canceled a long time ago. However, a new trend has not yet been formed. There is no trendline and no channel, which means there is no trend at the moment. For eight trading days, the pair has been stuck between the levels of 1.1279 and 1.1395, indicating a clear flat movement. The market is still waiting for the outcome of the conflict in Eastern Europe which is escalating every day. On the 5-minute time frame on Wednesday, it is recommended to trade at the levels of 1.1227-1.1234, 1.1279-1.1292, 1.1330, 1.1367, 1.1395, and 1.1418. You should set a Stop Loss to the breakeven point as soon as the price passes 15 pips in the right direction. There will be no important reports or events in the EU on Thursday. As for the US, it will release the second estimate for Q4 GDP which is expected to increase by 0.2%. A minor report on jobless claims will also be published. However, these reports are unlikely to influence the market as traders seem to be cautious now. Basic rules of the trading system 1) The strength of the signal is determined by the time it took the signal to form (a rebound or a breakout of the level). The quicker it is formed, the stronger the signal is. 2) If two or more positions were opened near a certain level based on a false signal (which did not trigger a Take Profit or test the nearest target level), then all subsequent signals at this level should be ignored. 3) When trading flat, a pair can form multiple false signals or not form them at all. In any case, it is better to stop trading at the first sign of a flat movement. 4) Trades should be opened in the period between the start of the European session and the middle of the US trading hours when all positions must be closed manually. 5) You can trade using signals from the MACD indicator on the 30-minute time frame only amid strong volatility and a clear trend that should be confirmed by a trendline or a trend channel. 6) If two levels are located too close to each other (from 5 to 15 pips), they should be considered support and resistance levels. On the chart Support and Resistance Levels are the levels that serve as targets when buying or selling the pair. You can place Take Profit near these levels. Red lines are channels or trend lines that display the current trend and show in which direction it is better to trade now. The MACD indicator (14, 22, and 3) consists of a histogram and a signal line. When they cross, this is a signal to enter the market. It is recommended to use this indicator in combination with trend patterns (channels and trendlines). Important announcements and economic reports that can be found on the economic calendar can seriously influence the trajectory of a currency pair. Therefore, at the time of their release, we recommend trading as carefully as possible or exiting the market in order to avoid sharp price fluctuations. Beginners on Forex should remember that not every single trade has to be profitable. The development of a clear strategy and money management is the key to success in trading over a long period of time. The material has been provided by InstaForex Company - www.instaforex.com |
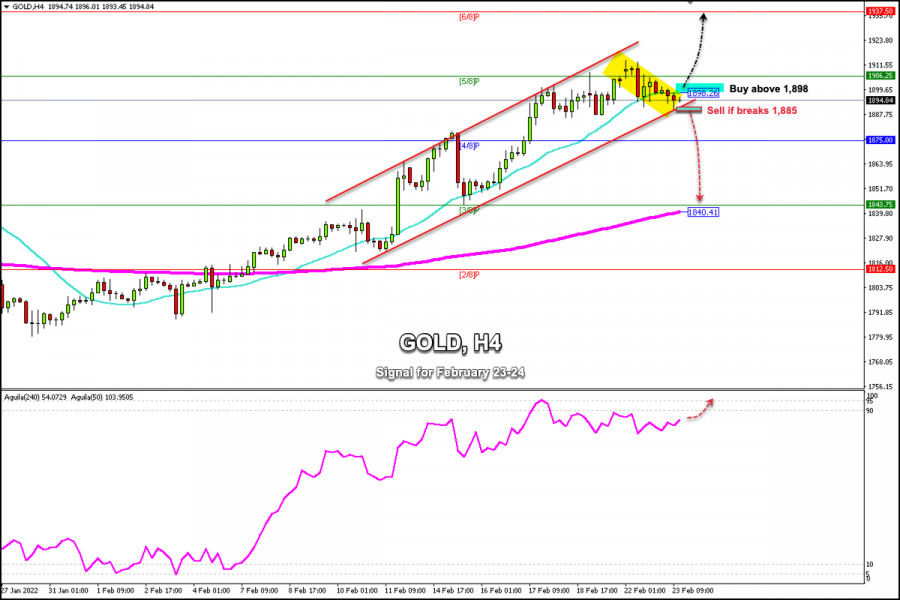
| Trading signals for GOLD (XAU/USD) on February 23-24, 2022: buy above $1,898 (21 SMA) Posted: 23 Feb 2022 07:38 AM PST
On February 22, gold hit a high of 1,913.98. From that level, it made a technical correction towards the bottom of the uptrend channel around 1,889. Currently, the price is bouncing above the uptrend channel and approaching the 21 SMA located at 1,898. A consolidation above the 21 SMA on the 4-hour chart could accelerate the move higher towards 5/8 Murray in 1,906. With a break above it, gols could reach 6/8 Murray at 1,933. The entry of Russian troops into the Donetsk and Luhansk areas has had a negative impact on the markets so far. These fundamental data keeps investors taking refuge in gold. It is likely that in the coming days gold will continue to consolidate around 1,890 – 1,914. As gold remains above the uptrend channel and above 1,898, it is likely to continue that trend and may go as high as the resistance of 1,937. On the contrary, a sharp break and daily close below 1,885 will be the beginning of a bearish scenario with a fall towards 1,875 and to 200 EMA at 1,840. The eagle indicator continues to show a positive signal but in an overbought zone. Gold is likely to continue gaining strength in the coming hours. Support and Resistance Levels for February 23 - 24, 2022 Resistance (3) 1,933 Resistance (2) 1,918 Resistance (1) 1,906 ---------------------------- Support (1) 1888 Support (2) 1,875 Support (3) 1,860 *********************************************************** Scenario Timeframe H4 Recommendation: buy above Entry Point 1,898 Take Profit 1,906; 1,937 Stop Loss 1,892 Murray Levels 1,937 (4/8), 1,906(3/8) 1875 (4/8), 1843 (3/8) *************************************************************************** The material has been provided by InstaForex Company - www.instaforex.com |
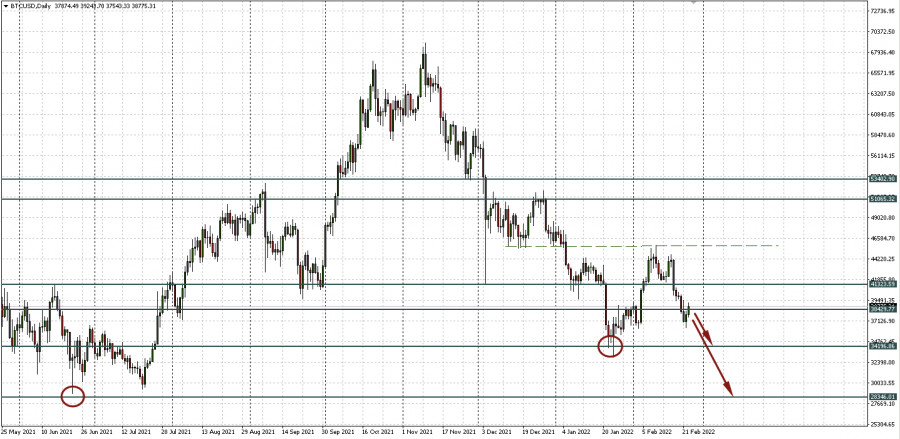
| BTC February recovery turns out bull trap Posted: 23 Feb 2022 07:14 AM PST A cryptocurrency analyst who accurately predicted the bottom of the 2018 bear market warned bitcoin traders that the major cryptocurrency was at risk of breaking support at the level of $30,000 Pseudonymous crypto analyst Smart Contracter wrote on his Twitter account that BTC/USD's recent jump from a low of $33,000 on January 24 to a high of $45,000 on February 10 was likely to be a huge bull trap. Smart Contracter stated that BTC had failed to hold the 0.618 Fibonacci level. Therefore, it can be assumed that its recent surge was a bull trap. Now, bitcoin is most likely to test the support at $28,000. Accurate forecastsNotably, this analyst has previously managed to highlight the major cryptocurrency trend shifts and predict its dips and reversals. In December, when bitcoin was trading above $50,000 per coin, Smart Contracter predicted its sharp correction to around $25,000. "What if we take out the June lows again after taking out the April highs all as half of a larger structure that ruins both bulls and bears? I wouldn't rule it out. Also on a side note, I maintained my bullish bias for too long and vastly underestimated the severity and depth of this dip." Smart Contracter seems to base his evaluation on the market construction of the Dow Jones Industrial Average when it traded in a wide range between 1998 and 2009 before breaking out and igniting a parabolic surge. Short-term forecasts differWhile Smart Contracter is brief-time bearish on bitcoin, his fellow market analyst Justin Bennett believes BTC is already generating bullish reversal signals on the lower timeframe. "BTC hourly still looks good. Descending broadening wedge and RSI bullish divergence. That doesn't mean everything is A-OK, far from it. The highest conviction play, in my opinion, is a daily close above $39,600." I believe the technical picture on the daily chart is more credible for analysis. Besides, the current situation is ambiguous: the level of 39429.77 is tested in both directions. However, it is likely to be insignificant for the medium-term outlook. As for my hope for BTC recovery, I have repeatedly focused on the level of 34196.86. It was the reason for the price decline in January. Besides, I consider the level of 28346.01 the last bullish stronghold. Therefore, I share Smart Contractor's view in this case.
|
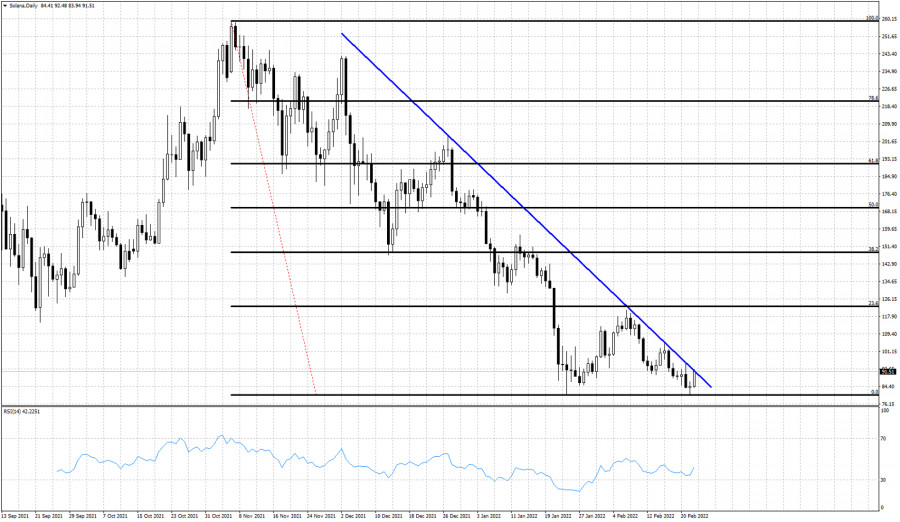
| Posted: 23 Feb 2022 06:13 AM PST Solana is trading above 90.30. Short-term trend remains bearish as price continues making lower lows and lower highs. Price made a low at 80.27 just above the previous low of 79.97. Solana has formed a possible double bottom. Will we see a W shaped reversal?
Blue line - resistance trend line Solana is now testing the blue downward sloping trend line resistance. So far price whenever it touched the blue trend line resistance it got rejected. So far price has confirmed the importance of the resistance trend line. Breaking above it will provide us with a bullish signal that could bring price towards $122 at least where we find the 23.6% Fibonacci retracement of the entire decline. The material has been provided by InstaForex Company - www.instaforex.com |
| US stock indicators are acutely reacting to the growing tensions between Russia and Ukraine Posted: 23 Feb 2022 06:10 AM PST
American stock indicators are acutely reacting to the growing tension in relations between Russia and Ukraine. All indices showed a decline at the close of the session on Tuesday. Thus, the broad S&P 500 lost 1%, the industrial The Dow Jones Industrial Average - 1.4%, and the technological NASDAQ Composite - 1.2%. The escalation of the conflict between Russia and Ukraine is keeping investors around the world in suspense. Following the recognition by Russian President Putin of the independence of the LPR and the DPR, Russian troops were introduced into these two regions. European countries responded to this step by imposing sanctions against Russia. Thus, Germany has already suspended the launch of the Nord Stream–2 project. If earlier investors believed that the conflict between Russia and Ukraine would remain only in words, now the threat seems more real. If the situation worsens, stock markets will continue to show a decline. The US President called the actions of the Russian Federation an "invasion" and announced the sanctions being prepared against Russia. Analysts believe that the imposition of sanctions is unlikely to affect the revenues of American companies. However, the direct participation of the United States in the conflict will undoubtedly have a serious impact on the stock quotes. It should also be noted that the rise in energy prices and the consequences of a more aggressive policy of banks in response to an increase in inflation can seriously affect the behavior of investors. The consumer confidence index in the United States this month has already decreased by almost 10 points compared to the January level (from 111.1 to 110.5 points). At the same time, the current level coincided with the forecasts of experts. According to analysts, such a decrease is caused by rising inflation and negative expectations of citizens regarding opportunities for economic growth. All 11 components of the S&P 500 indicator sectors showed a decline. Home Depot securities lost 8.9% due to a decline in sales, which the company showed in the reports. Also, the decline in the value of shares was shown by Best Buy, Lowe's, and Dollar General, which fell by 3.6%. Despite an increase in the cost of oil by 1.5% and reaching $96.84 per barrel, the energy sector showed a decline. Exxon Mobil and Halliburton securities fell by 1.2%. Good corporate reporting results did not help Macy's. Its securities lost 5% in value. At the same time, the profitability of ten-year Treasury bonds increased from 1.930% to 1.947%. At the same time, Krispy Kreme's securities gained 8.4% due to good reporting for the fourth quarter of 2021 on revenue and profit. And these indicators turned out to be higher than market expectations. Medtronic Plc securities gained 3.1% in price due to a 17% increase in net profit in the third quarter of the fiscal year 2022, although this figure was lower than the market forecast. The material has been provided by InstaForex Company - www.instaforex.com |
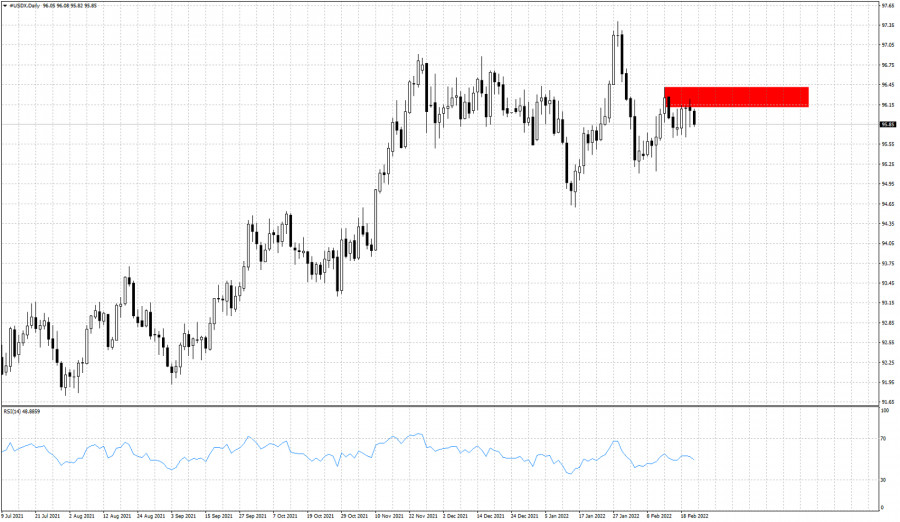
| The Dollar index vulnerable to more downside. Posted: 23 Feb 2022 06:07 AM PST The Dollar index has formed a lower high at 96.27 relative to the January high of 97.41. Price is vulnerable to a new sell off as long as price is below 96.30. The Dollar index is again under pressure and our downside target is at 94.70-94.50.
As long as the Dollar index is trading below the red rectangle resistance area, our short-term view will be bearish favoring another sell off towards 94.70. Support is found at 95.66 and a break below this level will increase chances of our 94.70 scenario coming true. The last higher high in the Dollar index was accompanied by a lower high in the RSI. This was our first bearish divergence. This does not necessarily mean a top, but it should not be ignored if combined with the break of key support levels. The material has been provided by InstaForex Company - www.instaforex.com |
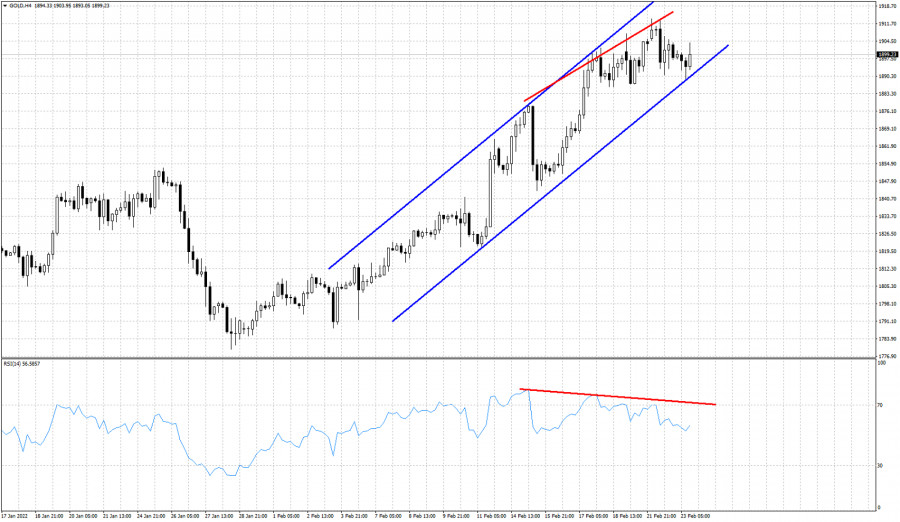
| Technical analysis on Gold for February 23, 2022. Posted: 23 Feb 2022 05:56 AM PST Gold price remains in a bullish trend. Price recently tested the lower channel boundary and thus far there is no sell signal provided. Price respected the channel boundaries and bounces off support. Could Gold price move to new higher highs?
Blue lines - bullish channel Gold price can make new higher high towards $1,920. However as the RSI warns, the up trend is weakening. The bearish divergence is an important warning that should not be ignored. Gold has support at recent low of $1,889. Breaking below this level will most probably mark the end of the up trend from $1,779. The chances of a reversal have increased. The material has been provided by InstaForex Company - www.instaforex.com |
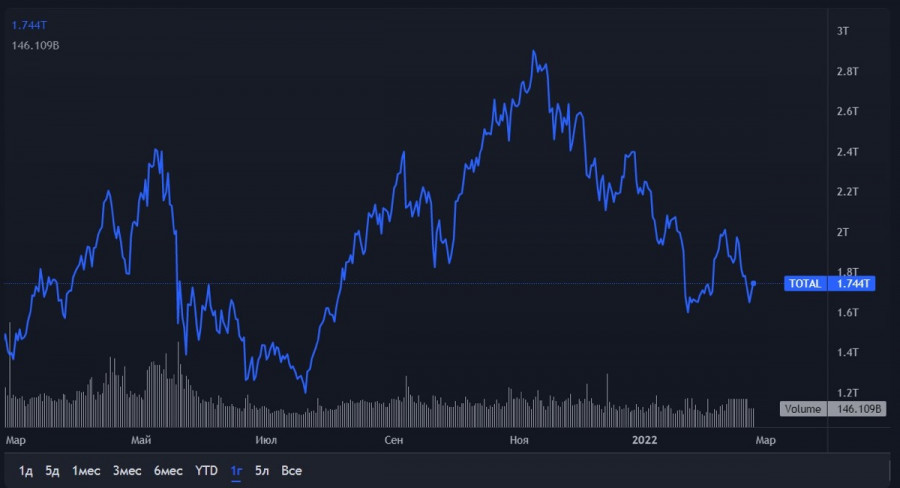
| Is bear market coming up for crypto? Posted: 23 Feb 2022 05:54 AM PST In early February, the crypto market saw light at the end of the tunnel. The 2-month long downward correction seemed to be coming to an end. BTC quickly regained $45,000 and settled at this level. However, bitcoin began to slide down afterwards, reaching a low of $36,300. The crypto community is debating whether the market is turning bearish or BTC is going down due to recent events worldwide. Here are 5 arguments in favor of a bear market shift, ranging from fundamental factors to local, interconnected ones.
Geopolitical situationVladimir Putin's decision to recognize the self-proclaimed rebel regions of DPR and LPR as sovereign states has brought the world close to the point of no return. The next day, wide-ranging sanctions were imposed on Russia by many European countries, as well as the US and Canada. Rising tensions are weighing down on the stock market. Investors abandon high risk assets, trying to protect their capital. As a result, the crypto market has nothing that could give it support and reverse the main cryptocurrencies upwards.
Fed policyAmid rising war risks in Europe, the Federal Reserve's influence on the cryptocurrency market has been overlooked. However, its impact on crypto assets has been significant. The Fed's monetary tightening and interest rate hike is likely to push down digital assets. The market cap of $2 trillion could be unreachable for crypto in 2022. As investment flows dwindle, major market players would seek more lucrative and less risky profit opportunities. The Fed policy is likely to hit the DeFi and NFT markets particularly hard, bringing liquidity down to swing lows and all-time lows, depending on the platform. The Federal Reserve could become the main obstacle for the crypto market's growth in the long term.
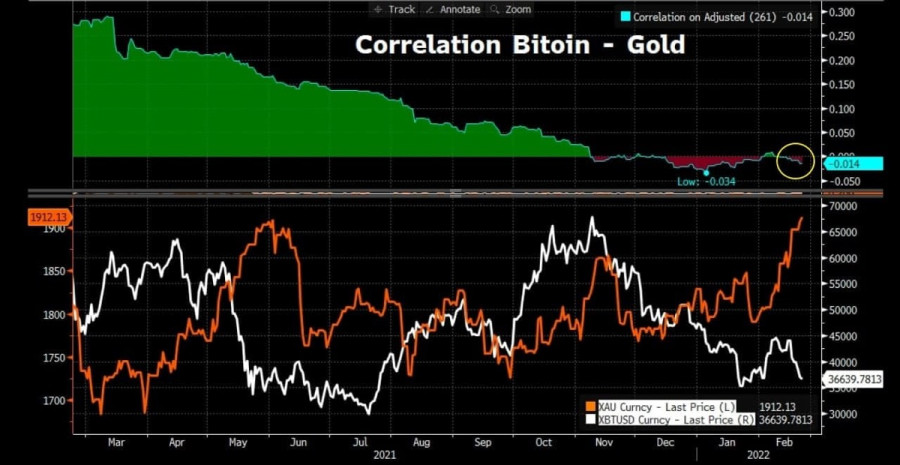
Bitcoin vs. goldGold entered a new uptrend during a spike of BTC's dominance in the crypto market. It seemed that investors were hedging risks caused by Fed statements and growing tensions between Russia and Ukraine. However, the correlation between gold and BTC turned out to be negative – investors did not use bitcoin as a defensive asset. The precious metal climbed to an 8-month high, while the cryptocurrency plunged to swing lows. In the meantime, the market cap of stablecoins pegged to gold pushed new highs. Compared to gold, bitcoin has yet to gain trust of investors.
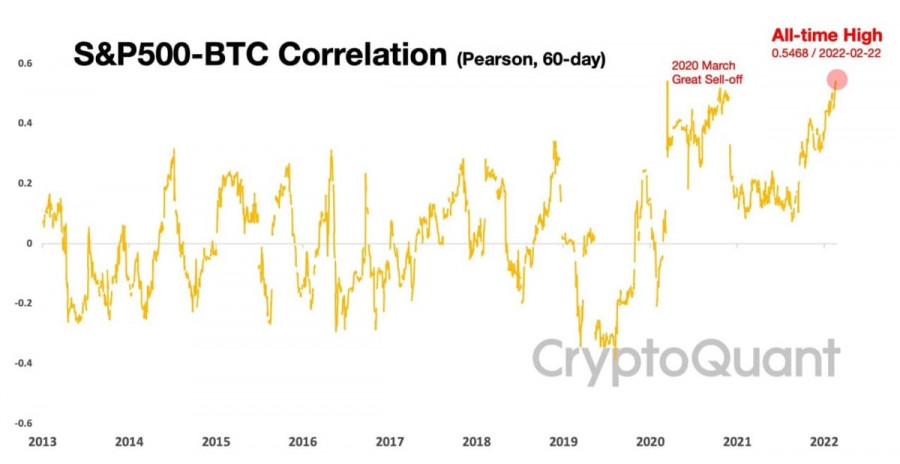
Record high correlation between BTC and US equitiesThe very high correlation between bitcoin and US stock indexes suggests the cryptocurrency is recognized as a high-risk asset. Although it indicates that regular financial institutions have accepted BTC, they still do not view it as a defensive asset. The high correlation between crypto and equities is another sign of an upcoming crypto winter.
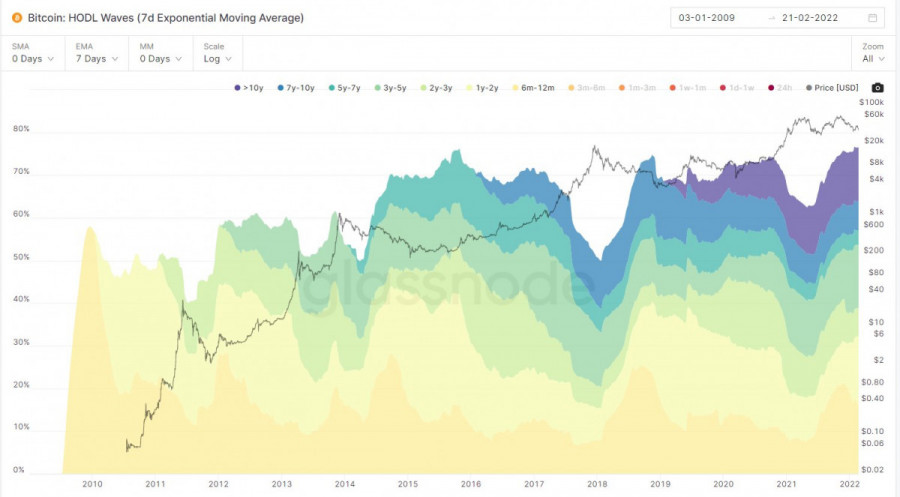
Share of mid-term holders reached all-time high – 76.5%Major investors are abandoning crypto assets – Cardano has experienced a major outflow, while Ethereum's inflows are increasing. In the meantime, market players are holding onto their BTC investments – the number of wallets holding BTC for more than 6 months has reached a record high of 76.5%. Investors could possibly sell their assets to limit their losses. Alternatively, they are following the HODL trading strategy, which is widely used in the crypto market during a long downtrend.
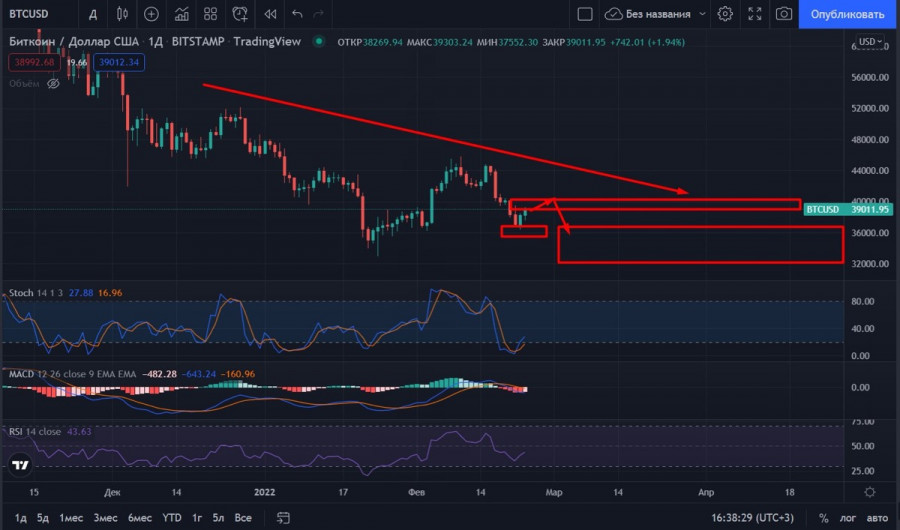
Nevertheless, it is not completely certain that bitcoin and the crypto market are in a lengthy downtrend. Perhaps the market is digesting the current situation – eventually it will be priced in the value of the cryptocurrency. In the afternoon, the asset regained $39,000. However, the candlestick pattern suggests the position of bulls is weak – there is no potential for a long-term uptrend. BTC has managed to hold on to $37,100, giving bullish traders some time to consolidate and push the asset upwards. However, this is unlikely under current conditions. BTC/USD could likely slump into the $35,000-$32,000 range by the end of February. Its future trajectory would be determined by the reaction of the market and market makers, the movement of stock indexes, and the geopolitical situation.
|
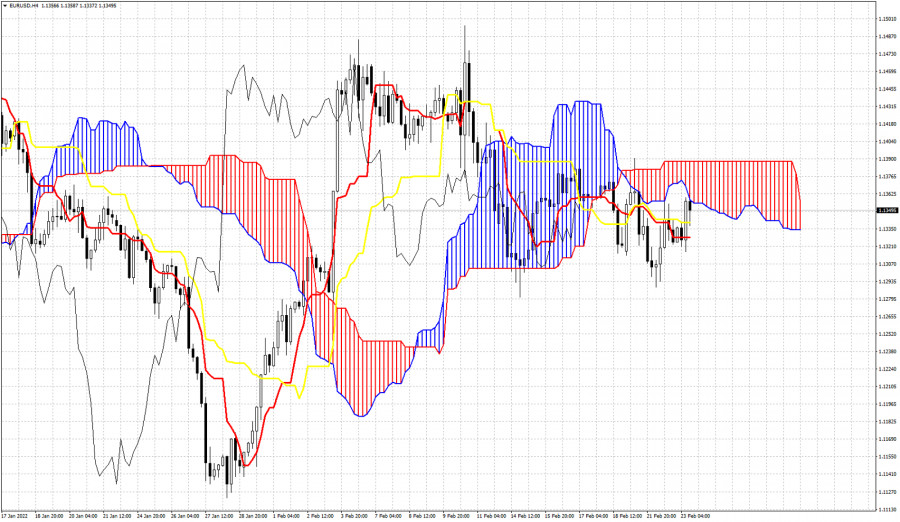
| Ichimoku cloud indicator analysis on EURUSD for February 23, 2022. Posted: 23 Feb 2022 05:52 AM PST EURUSD remains in a bearish short-term trend according to the Ichimoku cloud indicator. Price is still below the 4 hour Kumo (cloud). Price is testing the lower cloud boundary once again today. Bulls need to break inside the cloud in order to change trend to neutral from bearish.
|
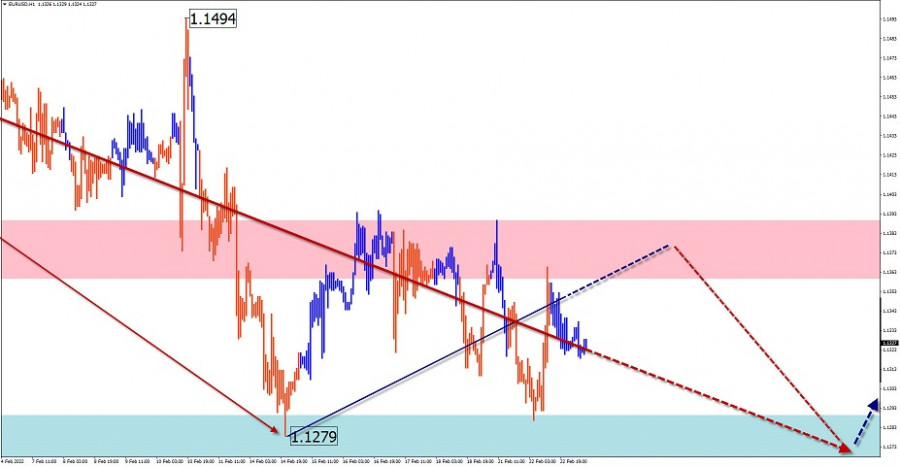
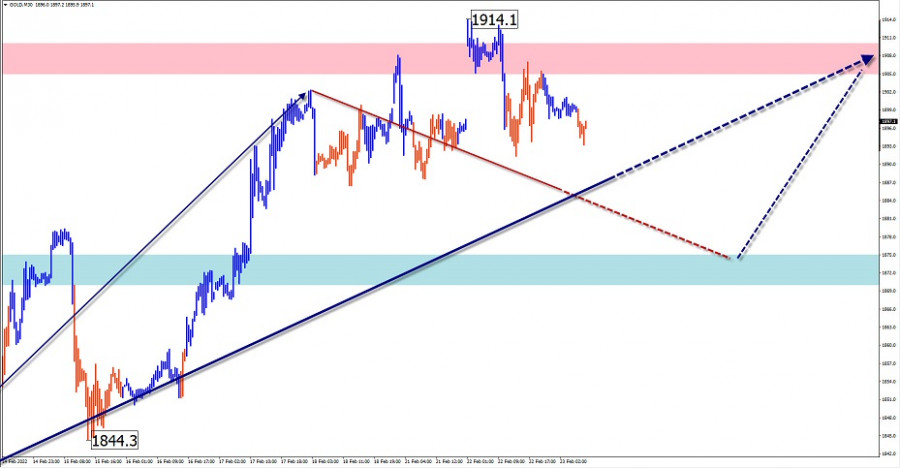
| Simplified wave analysis and forecast for EUR/USD, USD/JPY, GBP/JPY, GOLD for February 23 Posted: 23 Feb 2022 05:47 AM PST EUR/USD Analysis: The wave construction of the European currency chart, which has not been completed for today, has been reported since January 28. This rising wave has a reversal potential. If it is confirmed, the wave will give rise to a new short-term trend. The downward section of the last two weeks has not yet gone beyond the correction. Forecast: Today, the price is expected to move between the nearest oncoming zones. In the first half of the day, a downward course is more likely. At the end of the day or tomorrow in the area of settlement support, you can expect a reversal and a resumption of the price rise. Potential reversal zones Resistance: - 1.1360/1.1390 Support: - 1.1290/1.1260 Recommendations: Euro trading in the near future can bring profit only in the form of short-term transactions in a small lot. Purchases will become possible after the appearance of confirmed reversal signals in the area of the support zone.
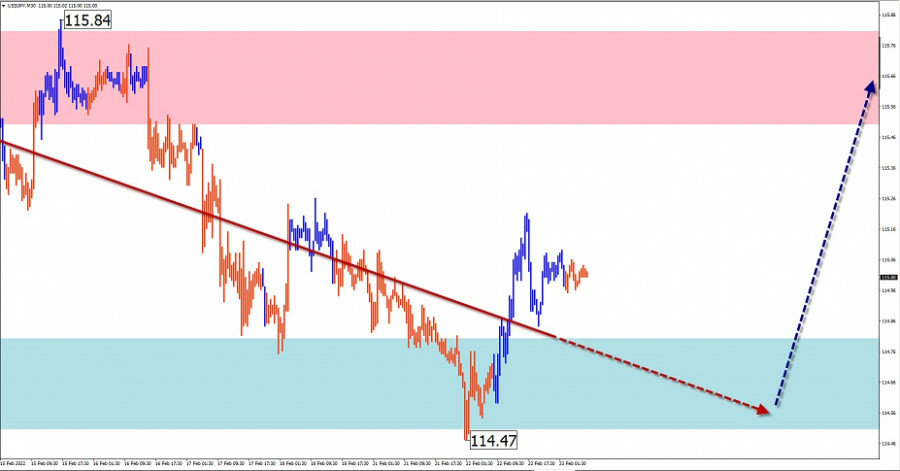
USD/JPY Analysis: The trend rate of the Japanese yen major in the last two years is set by the ascending wave algorithm. Quotes are currently located within the boundaries of the resistance zone of the senior TF. The unfinished section has been counting since November 30 last year. In the last two weeks, the price in sideways flat forms an intermediate pullback. Forecast: On the current day, the price is expected to move from the lower border of the price corridor to the area of the calculated resistance. At the European session, pressure on the support zone is not excluded, with a short-term puncture of the lower border. Potential reversal zones Resistance: - 115.50/115.80 Support: - 114.80/114.50 Recommendations: Today, short-term purchases with a fractional lot from the support zone are possible on the yen chart. It is recommended to close deals at the first signs of an imminent reversal.
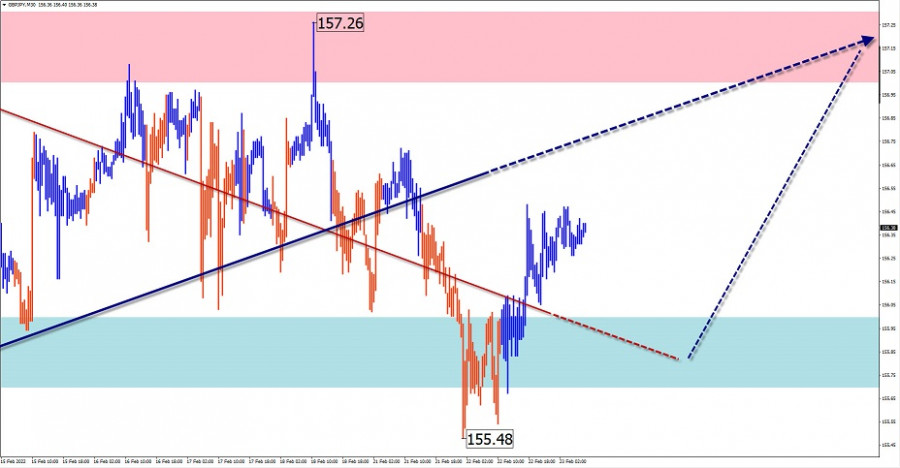
GBP/JPY Analysis: Over the past two years, the ascending wave algorithm has brought the quotes of the pound/yen cross to the area of a strong reversal zone of the weekly scale of the chart. The incomplete short-term wave at the main exchange rate has been counting since November last year. In its structure, in the last two weeks, the price has been moving sideways, forming an intermediate correction. Forecast: Today, the general flat mood of the pair's movement is expected to continue. In the first half of the day, a downward vector is not excluded, with a price decline any further than the support zone. At the end of the day or tomorrow, you can count on a change of direction and an increase in quotes, up to the resistance zone. Potential reversal zones Resistance: - 157.00/157.30 Support: - 156.00/155.70 Recommendations: Sales of the pair are risky today and can lead to losses. It is recommended to refrain from entering the pair's market until confirmed buy signals appear in the support area.
GOLD Analysis: The rising wave brought gold quotes to the area of the strong resistance of a large TF. Before continuing the rise, the structure needs to increase its wave level in correction. Forecast: In the next day, the price is expected to move sideways with a common downward vector. The preliminary target zone runs along the upper boundary of the large-scale support zone. Potential reversal zones Resistance: - 1905.0/1910.0 Support: - 1875.0/1870.0 Recommendations: Short-term fractional lot sales are possible until the current decline is completed. It is optimal to refrain from entering the market of the instrument until the confirmed buy signals appear in the area of the support zone.
Explanations: In the simplified wave analysis (UVA), waves consist of 3 parts (A-B-C). The last incomplete wave is analyzed. The solid background of the arrows shows the formed structure, and the dotted one shows the expected movements. Attention: The wave algorithm does not take into account the duration of the movements of the instrument in time! The material has been provided by InstaForex Company - www.instaforex.com |
| Ukraine is going to introduce a state of emergency. There seems to be a war with Russia. Posted: 23 Feb 2022 05:46 AM PST Ukrainian authorities have been considering declaring a nationwide state of emergency since Russian President Vladimir Putin recognized the independence of the two self-proclaimed republics, which has increased tensions with Kyiv and raised concerns about a potential broader conflict. Ukraine is going to introduce a state of emergency. There seems to be a war with Russia.
This measure, announced by the Secretary of the Security and Defense Council Alexey Danilov in Kyiv on Wednesday, will allow certain regions to impose restrictions. Restrictions on the movement of people, mass gatherings, and the media also require the approval of the Ukrainian Parliament. According to Danilov, the state of emergency will last for the first 30 days, and parliamentary approval is expected on Wednesday. Russia's recognition of the separatist-controlled territories of Donbas, which took place on February 22, as well as the constant presence of Russian troops on the border with Ukraine, provoked a security crisis not only for Ukraine but also for the West. The United States and its European allies accuse the government in Moscow of undermining Ukraine's territorial integrity and violating international law. At the same time, the United States and Britain claim that their intelligence still suggests that Russia is preparing to launch a large-scale invasion of Ukraine, including, possibly, the capital Kyiv. Moscow has repeatedly denied such plans, but now Putin's agreements with separatist territories at the official level will allow him to send troops to these areas and build bases there. Putin said he would not send troops, which he calls "peacekeepers" yet. This will cause concern about the proximity to the line of contact between the separatists and the Ukrainian military. However, according to private reports from Donbas, Russian troops have already entered the disputed territory. Residents of Donetsk in social networks report that in parallel in the republics there is a mass mobilization, often forced. For evading military duties, up to two years' imprisonment is threatened. There is now every reason to consider a large-scale military conflict between the two former allied states more than likely. Until recently, Ukraine's position was much more advantageous. The problem is that the Kremlin uses a position of strength in building international relations, and does not always clearly understand that for Western countries such a dictate of the "stronger" is not always acceptable. That is why the Kremlin appealed to the US president with a proposal to sign an agreement on the refusal to deploy NATO troops on the territory of Ukraine. The administration of President Putin does not realize that such an agreement cannot be signed within the framework of current international legislation. Therefore, having advanced troops to the Ukrainian borders and using them as a weighty argument, the Kremlin nevertheless put forward impossible demands in advance. Now it is difficult to judge what steps Moscow planned next. Perhaps the invasion was planned, but the Russians could only accept a quick victory - a protracted war is not beneficial to anyone. However, the unusually warm weather put an end to any possible plans for quick capture, if they were being developed. The most reasonable solution in this situation was to send troops to the territory of the republics, regroup, and, after waiting for dry weather, resume pressure on Ukraine. This is exactly the scenario that the events of recent days have developed. Russia recognized the independence of the two republics, and its units occupied these territories. Therefore, the Kremlin could lose this round dry. Moscow could also have initially planned to recognize the independence of the republics by concentrating troops in the north and northeast of Ukraine in advance as a "convincing argument." All that remained for Ukraine was to wait. Most likely, the Kremlin would have stopped there for now. Since Putin's team has not achieved significant results in a short time, it would be an unacceptable luxury to continue escalating the situation for months. Ukraine does not lose anything from Russia's recognition of the independence of the republics, since they have not been under its control for a long time. So Ukrainians could get at least a temporary respite and prepare for a possible military conflict better. However, Ukrainian President Volodymyr Zelensky made the biggest mistake of his life - he raised the issue of restoring the country's nuclear security program. In particular, he convened a Council of four countries that in the 90s acted as guarantors of the inviolability of Ukraine's security. He also warned that if the Security Council turns out to be useless, Ukraine may take its steps in this direction. Having made such a statement, Zelensky signed the death sentence of Ukraine. Putin's team got an iron argument in their hands for any invasion, which can be presented without shame to both their fellow citizens and Western representatives - Russia's nuclear security. Even the most liberal-minded Russians cannot object to the "nuclear argument". A possible offensive has received a new batch of arguments in its favor. And now it may well not be a quick offensive, but a planned and large-scale confrontation. Alas, the chances that the Kremlin will decide to invade the territory of Ukraine to secure Moscow, which is too close to its western borders, and therefore in the zone of imminent defeat, increased significantly yesterday. The first sanctions from the United States this year turned out to be too small, signaling to the Kremlin and the rest of the world the position of the States. So there is no one to "cover" Ukraine here either. Only Europe can still influence the distribution of forces, but it is unlikely that it will. Few Europeans are ready to shed blood for Ukrainians. Most likely, Russia's offensive on Ukraine will begin in March-April, as soon as the spring thaw ends. For world markets, this means that the hryvnia will continue to depreciate rapidly. The euro is also becoming too volatile. In the near future, the dollar, the Canadian dollar, and the pound sterling will benefit the most from the conflict. The material has been provided by InstaForex Company - www.instaforex.com |
| Video market update for February 23,,2022 Posted: 23 Feb 2022 05:15 AM PST Watch for potential upside continuation on the USD/JPY .... The material has been provided by InstaForex Company - www.instaforex.com |
| NZD/USD: New Zealand dollar on the upswing Posted: 23 Feb 2022 05:14 AM PST
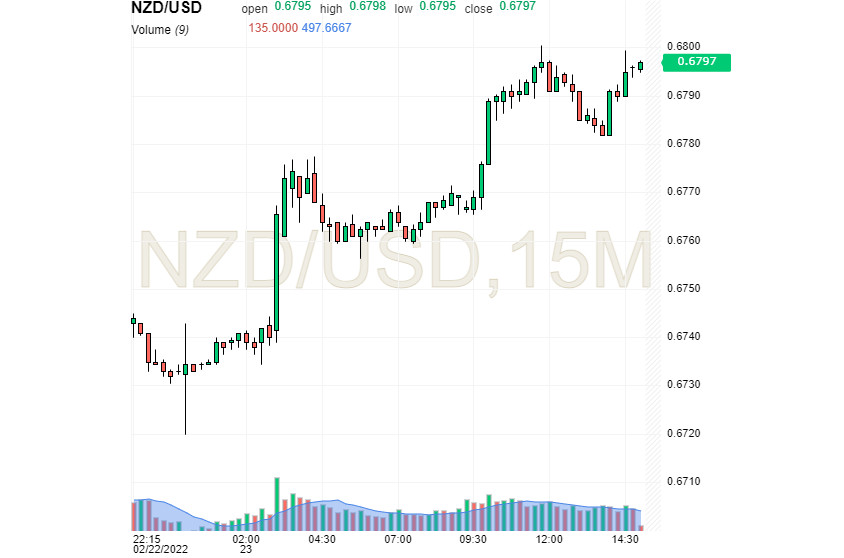
The interest rate increase by the Reserve Bank of New Zealand has propelled the New Zealand dollar upwards. The uptrend is likely to continue, experts say. On Wednesday, February 23, NZD jumped to its 5-week high after the regulator hiked the interest rates. The Reserve Bank of New Zealand increased the rate by 25 basis points to 1% and intends to continue monetary tightening in the future. Investors did not expect the central bank to take such a hawkish stance. The RBNZ could discuss more rate hikes at its future meetings. The board of the RBNZ has decided to continue winding down monetary stimulus to tackle high inflation, which is far above the target level of 2%. The central bank strives to keep price growth within the range of 2-3%. However, it would require ending monetary stimulus and reverting to pre-pandemic policy. The current situation favors the New Zealand dollar. According to MUFG Bank, NZD was the best-performing G10 currency. Growing inflationary risks have been the main driving force behind the regulator's hawkish policy. In late 2021, consumer prices in New Zealand jumped by 5.9%, reaching a 30-year high. Continuing demand for NZD has also propelled the currency upwards. The New Zealand dollar has been steadily rising, extending its bullish momentum and outrunning its American counterpart. Thanks to support from fundamental factors, NZD has managed to ignore tensions in Eastern Europe. NZD/USD hovered near 0.6797 on Wednesday. In this situation, traders should keep long positions targeting 0.7000 open.
The New Zealand economy is outperforming its current potential due to the hawkish policy shift of the RBNZ. According to an adjusted outlook by Goldman Sachs, the regulator is expected to increase the interest rate by 25 basis points at every policy meeting in 2022 up to 2.5%. The forecast is in line with the Reserve Bank's plans to hike the rate to 2.5% in 2022 and 3.3% in late 2023. This week, New Zealand's central bank signaled its resolve to bring inflation under control with its hawkish policy shift. In the medium term, inflationary pressure is expected to go down. The RBNZ is likely to continue tightening its monetary policy throughout the year. The material has been provided by InstaForex Company - www.instaforex.com |
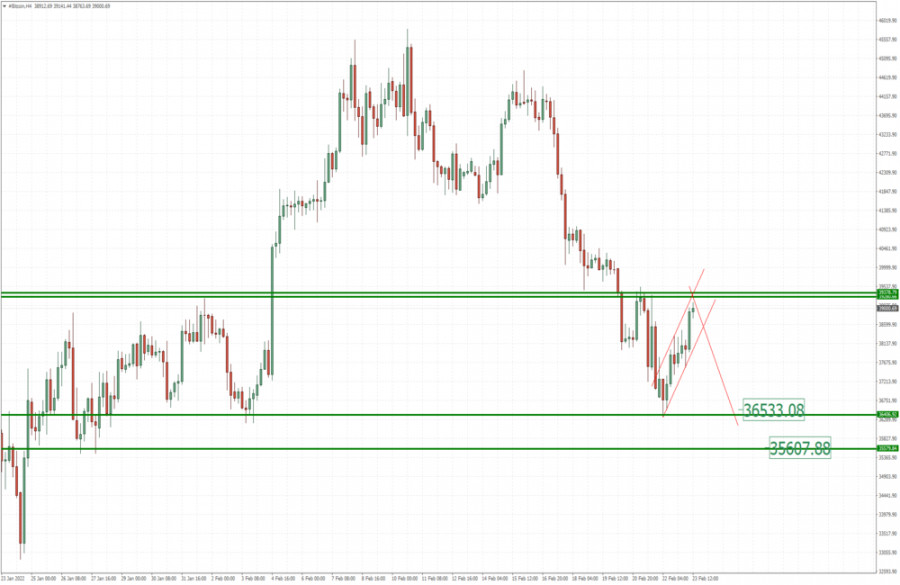
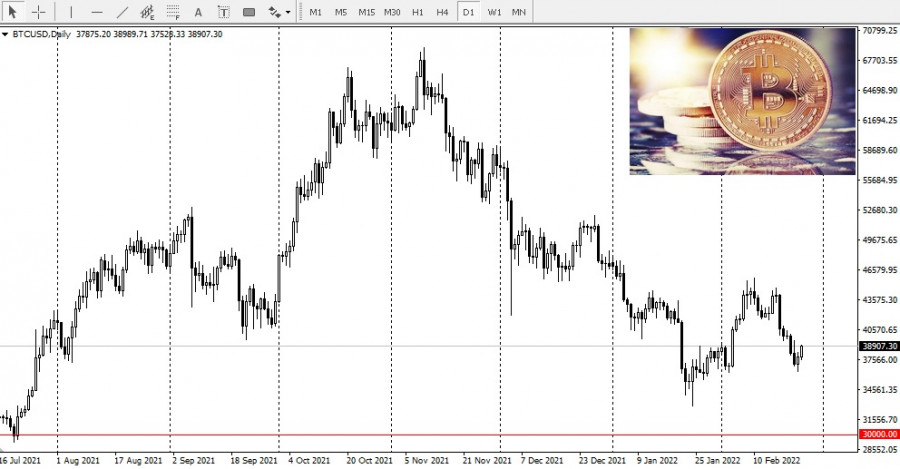
| BTC analysis for February 23,.2022 - Potential for downsdie continuation Posted: 23 Feb 2022 05:00 AM PST Technical analysis:
BTC has been trading upside in last 24 hours towards the level of $39,500. Anyway, I see the upside movement like corrective and potential for the downside continuation. Trading recommendation: Due to strong downside cycle in the background, I see potential for the downside continuation. Watch for potential selling opportunities in case of the breakout of the mini rising channel. Downside objectives are set at $36,500 and $35,600 In the background, there is the the big downside momentum, which is indication for the potential downside continuation. Key resistance is set at $39,500 The material has been provided by InstaForex Company - www.instaforex.com |
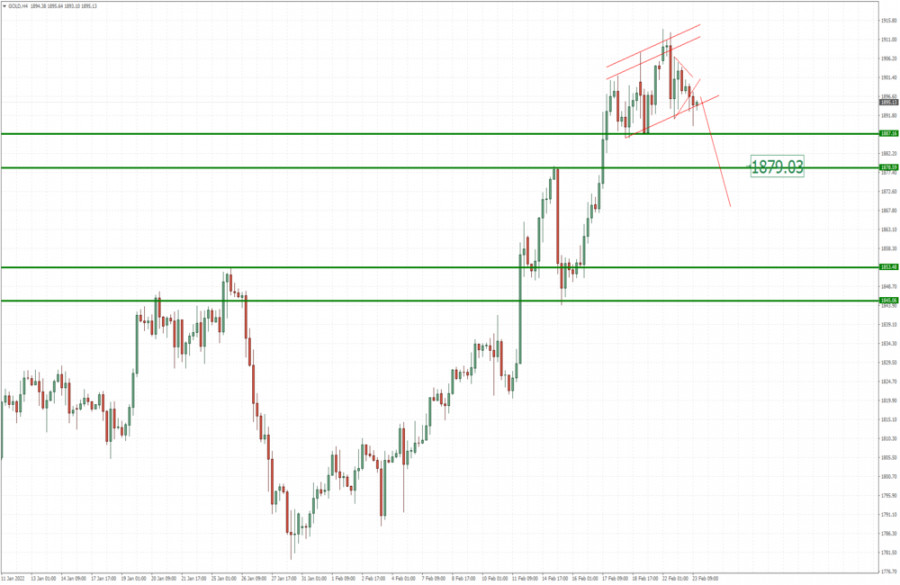
| Analysis of Gold for February 23,.2022 - Potential for the drop to take previous lows Posted: 23 Feb 2022 04:53 AM PST Technical analysis:
Gold has been trading sideways at the price of $1,895 and I see potential for the sell off before any further upside continuation. Trading recommendation: Due to indecision on the market and the extreme reading on the Gold, I see poetical for the downside movement. Watch for potential for intraday downside opportuntiies on the rallies with the downside objectives at $1,879 and $1,847 In the background, there is the the big momentum slowdown on the upside run, which is indication for the potential downside movement. Resistance is set at $1,912 The material has been provided by InstaForex Company - www.instaforex.com |
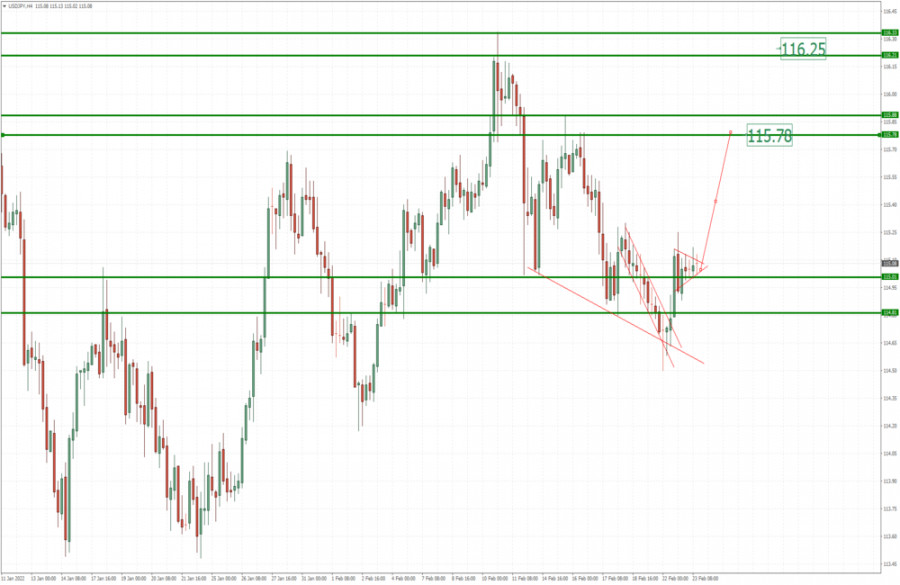
| USD/JPY analysis for February 23, 2022 - Upside continuation in the play towards 115.80 Posted: 23 Feb 2022 04:46 AM PST Technical analysis:
USD/JPY has been trading upside as like I suggested yesterdays. Anyway, I still expect upside movement towards the next pivot due to the fresh money flow to the upside from yesterday. Trading recommendation: Due to strong upside impulsive movement from yesterday, I expect further upside continuation towards upside references. Watch for potential buying opportunities on the dips with the upside objectives at 115,80 and 116,25. In the background, there is the breakout of the slope pattern, which is good sign for the strength in the background. Key support level is set at 114,50 The material has been provided by InstaForex Company - www.instaforex.com |
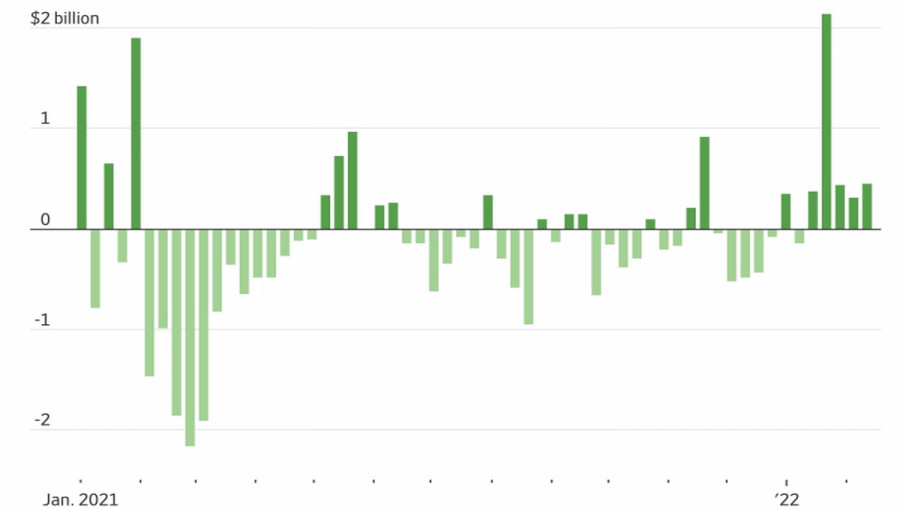
| Posted: 23 Feb 2022 04:25 AM PST Investors' active purchase of a hedge against geopolitical risk has pushed gold futures quotes above $1,900 per ounce for the first time since June. The question is whether speculators will get rid of the precious metal amid a decrease in the likelihood of an escalation of the conflict in Eastern Europe. Russia sent troops into Ukraine, recognized the republics that broke away from the neighboring state as independent, and the West responded with sanctions. Is the conflict settled? Even though gold finished 2021 and entered 2022 in an extremely pessimistic mood, the start of this year turned out to be very encouraging for it. Hedge funds are increasing long positions with enviable constancy, and stocks of specialized exchange-traded funds have been growing for five consecutive weeks, increasing by 57.3 tons since the beginning of 2022. We are talking about the longest winning streak since August 2020. At the same time, Goldman Sachs believes that the inflow of capital into ETFs may amount to 600 tons, which is equivalent to the indicators of 2016, 2019, and 2020, when the markets were concerned about the topic of recession. Dynamics of capital flows in ETFs
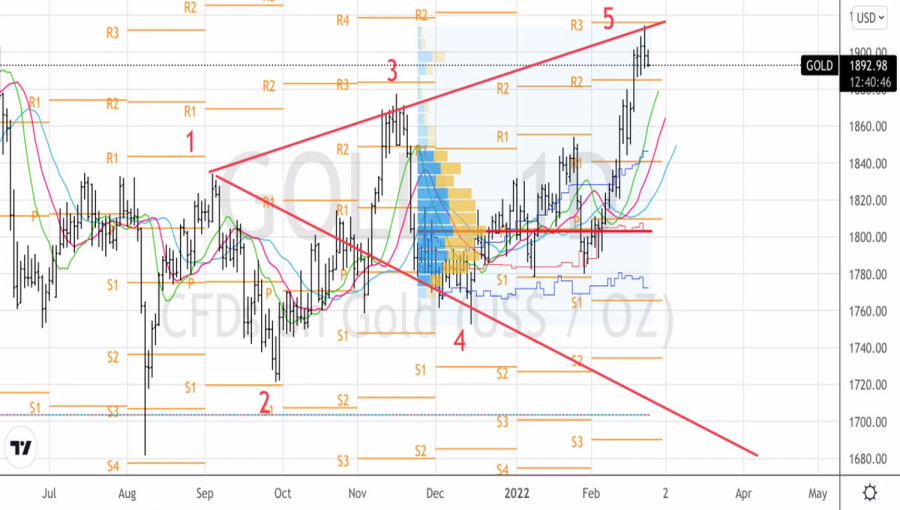
The spurt of gold in February meant that there is no shortage of bullish forecasts at present. Citigroup believes the precious metal will reach $1,950 an ounce due to heightened risks of a political misstep by the Fed and a growing possibility of a recession. Goldman Sachs even predicts that gold will be able to exceed the level of $2,000 per ounce and even aim at a new record. According to the bank, the link between it and the real yield of U.S. Treasuries is now broken due to the new inflationary regime a la 1070s and the deteriorating health of the U.S. economy. Historically, an increase in U.S. debt rates leads to a fall in XAUUSD quotes, which is not currently observed. It cannot be said that the market is exclusively bullish. According to DailyFX, the worst of the crisis in Eastern Europe, at least in terms of uncertainty, is already over. The main catalyst for the change in futures quotes for the analyzed asset in the near future will be a reduction in the risk of escalation of the conflict, which will contribute to the fall of the precious metal in the direction of $1,750, and then $1,700 per ounce over the next 6 months. In my opinion, the truth is somewhere nearby. Of course, the main reason for the gold rally in February was geopolitics. Its relegation into the background will contribute to the implementation of the principle of "buy the rumor, sell the news." In the end, Russia's invasion of Ukraine has already happened, Western sanctions have been announced. These factors have already been taken into account in XAUUSD quotes, it's time for the bulls to know the honor. Profit-taking on long positions is fraught with a serious correction. Technically, there is an inverted pattern of Wolfe Waves on the daily chart of the precious metal. Currently, the quotes have reached point 5, which increases the risks of a pullback. The development of the correction requires a confident assault of support at $1,880-$1,885 per ounce. It will also become a strong argument in favor of forming short positions on gold in the direction of $1,855 and $1,840. Gold, Daily chart
|
| The European stock market continues to shake. Investors do not understand what to expect next Posted: 23 Feb 2022 04:11 AM PST At the close of trading on Tuesday, key European indices reported a lack of unified dynamics amid market participants' concern about the aggravation of geopolitical tensions in eastern Europe. At the same time, at the beginning of the session on the eve of the stock markets of Western Europe were trading in a confident minus. As a result, the index of leading companies in the STOXX Europe 600 Euroregion increased by 0.07% to 455.12 points. Renault (-3.8%), Erste Group Bank AG (-4.1%), and Raiffeisen Bank International AG (-7.5%) demonstrated the maximum drop in the components of the exchange indicator The German DAX lost 0.26%, falling to 14693 points, the French CAC 40 sank by 0.01% to 6787.6 points, and the British FTSE 100 increased by 0.13% to 7494.21 points.
The value of Volkswagen's securities increased by 7.8%, and Porsche Automobil Holding - by 11.3% on a message from Volkswagen management about negotiations with the holding regarding the IPO (initial public offering) of Porsche AG. Quotes of the British manufacturer of medical equipment Smith & Nephew jumped by 7.5% on the background of the publication of a strong quarterly report. Quotes of securities of the French company Worldline SA, specializing in payment services, increased by 10.5%, thanks to revenue growth in the fourth quarter above the forecasts of market experts. The share price of one of the largest banks in Europe - British HSBC Holdings Plc - increased by 0.04%. In the fourth quarter of 2021, HSBC Holdings Plc increased its net profit by more than three times. In addition, representatives of the bank reported an increase in the securities repurchase program by $ 1 billion. Shares of the British hotel chain operator InterContinental Hotels Group Plc rose in price by 4.2% after the company reported a profit for the past year and announced the resumption of interim dividend payments at 85.9 cents per paper. Quotes of the British copper producer Antofagasta Plc rose by 0.7% on the background of the news that in 2021 the company increased the amount of dividends and increased net profit more than twice. Shares of the German manufacturer of medical equipment Fresenius Medical Care AG fell by 8.4%. According to the results of the fourth quarter, the company's adjusted profit and revenue increased by 5%, but its forecast for 2022 disappointed market participants. The securities of the British financial services company Hargreaves Lansdown declined by 15.6% after reporting a drop in pre-tax profit and revenue in the first half of the 2022 financial year. On Tuesday, the news about the escalation of tension between Ukraine and Russia remained in the focus of market participants' attention. On Monday, Russian President Vladimir Putin signed decrees recognizing the Donetsk People's Republic and the Luhansk People's Republic. According to the new documents, the maintenance of peace in the DPR and LPR will be provided by the Armed Forces of the Russian Federation. In response, the West called the Kremlin's actions a violation of international law, and some states imposed several sanctions against Russia. Another important factor for the markets on Tuesday was corporate news from leading companies in the region, as well as macro statistics. So, in the outgoing month, the indicator of confidence of German entrepreneurs in the state economy jumped to a maximum five-month mark of 98.9 points. At the same time, analysts predicted an increase in the index only to 96.5 points. By the way, this could not save the German stock index DAX from a slight drop. The material has been provided by InstaForex Company - www.instaforex.com |
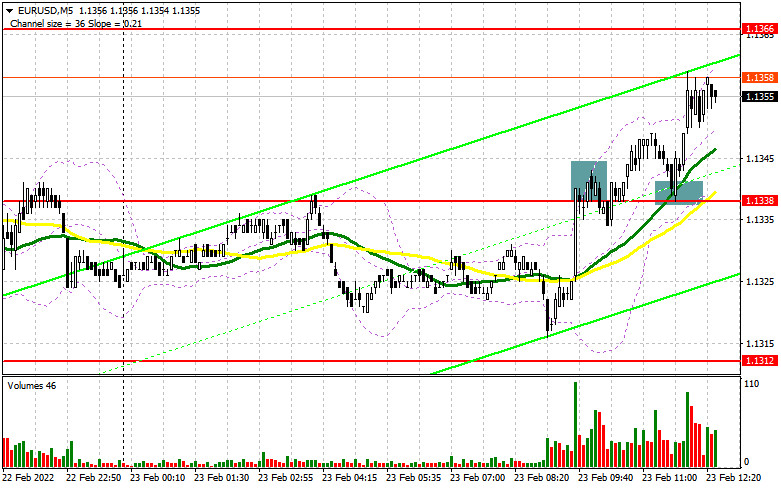
| Posted: 23 Feb 2022 04:11 AM PST To open long positions on EURUSD, you need: In my morning forecast, I paid attention to the 1.1338 level and recommended making decisions on entering the market from it. Let's look at the 5-minute chart and figure out what happened. The negative report on Germany led to the formation of a false breakdown in the resistance area of 1.1338, but there was no downward movement from this level. A breakout and consolidation above this range, and then a reverse test from top to bottom gave an excellent entry point already into long positions. At the time of writing, the pair has gone up more than 20 points, and the demand for the euro remains. For the second half of the day, the technical picture has not changed, as has the strategy. And what were the entry points for the pound this morning?
Today, there are no statistics on the United States, so the market will react only to geopolitical changes and news related to Russia and Ukraine. If there is no negative, we can count on the continued growth of the euro and the renewal of yesterday's highs. However, it should be understood that a serious conflict between Russia and Ukraine, which may even develop into an armed one, creates a certain pressure on the class of risky assets, to which the euro belongs. An important task of the bulls for the second half of the day will be to protect the nearest support of 1.1338, which served as resistance in the morning. Only the formation of a false breakdown will give the first entry point into long positions in the continuation of the upward correction of the pair. It is possible to count on a larger recovery of EUR/USD and go beyond the side channel only after active actions of buyers in the area of 1.1366. A breakout and a test of this range from top to bottom will lead to another buy signal and open up the possibility of recovery to the area of 1.1395, where I recommend fixing the profits. It is unlikely to get out of this range quickly since its breakdown will resume the bullish trend and open a direct road to the highs of 1.1427 and 1.1454, where I recommend fixing the profits. However, as I noted above, geopolitical tensions will affect the growth prospects of the euro. With the aggravation of the Russia-Ukraine conflict, the demand for the US dollar will return. If the pair declines during the US session and there is no activity at 1.1338, traders will begin to close long positions, which will return pressure on the euro. Therefore, it is best to postpone purchases until a false breakdown at 1.1312, but it is possible to gain long positions on the euro immediately for a rebound from the level of 1.1289, or even lower - around 1.1262 with the aim of an upward correction of 20-25 points inside the day. To open short positions on EURUSD, you need: Sellers have not yet shown themselves in any way and decided to postpone their activity until yesterday's highs are updated, or even higher - to a weekly maximum. Until the moment when trading is conducted above 1.1338, we can expect the pair to continue growing, so it is so important for the bears to focus on the return of this range during the American session. Given that we don't have any data on the US in the afternoon, volatility may be quite limited. An important task of the bears will be to protect the resistance of 1.1366. The formation of a false breakdown at this level, similar to what I discussed above, as well as negative news related to Russia and Ukraine, will all be a signal to open short positions to reduce EUR/USD to the 1.1338 area, just below which the moving averages are playing on the buyers' side. A breakdown of this area and a reverse test from the bottom up will give an additional signal to open short positions already with the prospect of falling to a minimum of 1.1312, and there you can reach a more distant goal of 1.1289, where I recommend fixing the profits. If the euro rises during the American session and there are no bears at 1.1366, it is best not to rush with sales. The optimal scenario will be short positions when a false breakdown is formed in the area of the weekly maximum of 1.1395. You can sell EUR/USD immediately on a rebound from 1.1427, or even higher - around 1.1454 with the aim of a downward correction of 15-20 points.
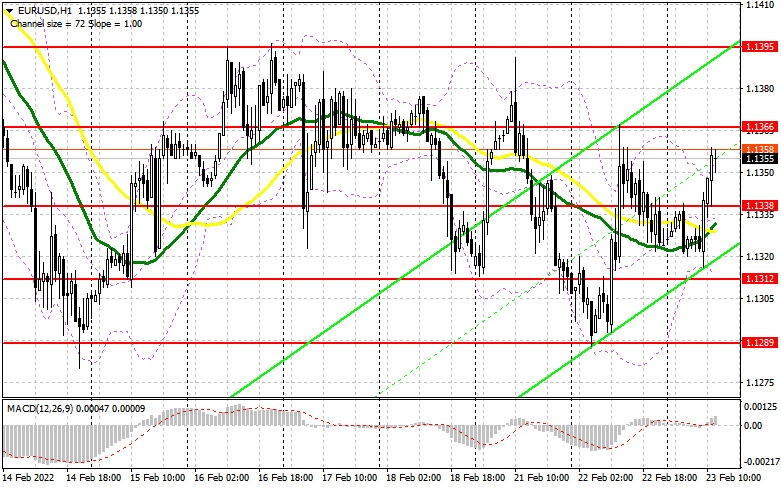
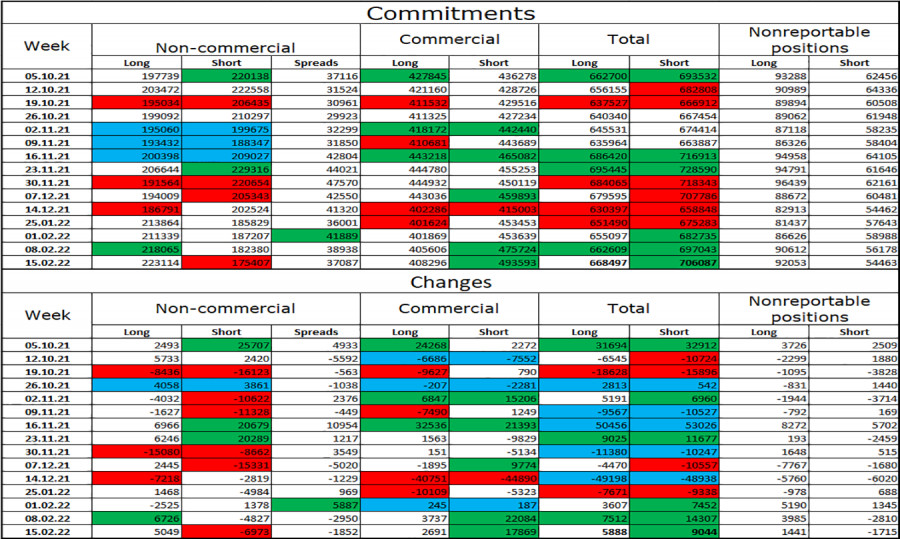
The COT report (Commitment of Traders) for February 15 recorded a reduction in both long and short positions, which led to an increase in the positive delta, as there were much fewer short positions. The uncertain policy of the European Central Bank, together with its president Christine Lagarde, who recently said that it was necessary to act more aggressively in the event of an acceleration of inflationary pressure, and last week completely changed her position, leads traders to a dead end. But, even despite the growth of the positive delta, the euro sank very much at the end of the reporting period. This is happening against the background of the risk of a military conflict between Russia and Ukraine. More recently, the Russian authorities recognized the independence of the LDPR, which only exacerbated geopolitical tensions around the world. Another weighty argument for the observed downward movement of the EUR/USD pair is the actions of the Federal Reserve System in relation to interest rates. According to the Fed minutes from the February meeting, it is expected that the Central Bank may resort to more aggressive actions and raise rates immediately by 0.5% in March this year, and not by 0.25%, as originally planned. This is a kind of bullish signal for the US dollar. The COT report indicates that long non-commercial positions decreased very slightly - from the level of 218,973 to the level of 217,899, while short non-commercial positions decreased from the level of 180,131 to the level of 170,318. This suggests that although fewer people are willing to sell euros, there are no more buyers from this. It seems that traders prefer to sit on the sidelines of those events that are now rapidly gaining momentum. At the end of the week, the total non-commercial net position increased slightly and amounted to 47,581 against 38,842. The weekly closing price collapsed and amounted to 1.1305 against 1.1441 a week earlier. Signals of indicators: Moving averages Trading is conducted above 30 and 50 daily moving averages, which indicates the bulls' attempts to continue the upward correction. Note. The period and prices of moving averages are considered by the author on the hourly chart H1 and differ from the general definition of the classic daily moving averages on the daily chart D1. Bollinger Bands A breakthrough of the upper limit of the indicator in the area of 1.1352 will lead to new growth of the euro. In the case of a decline, the lower limit of the indicator in the area of 1.1312 will act as support. Description of indicators
|
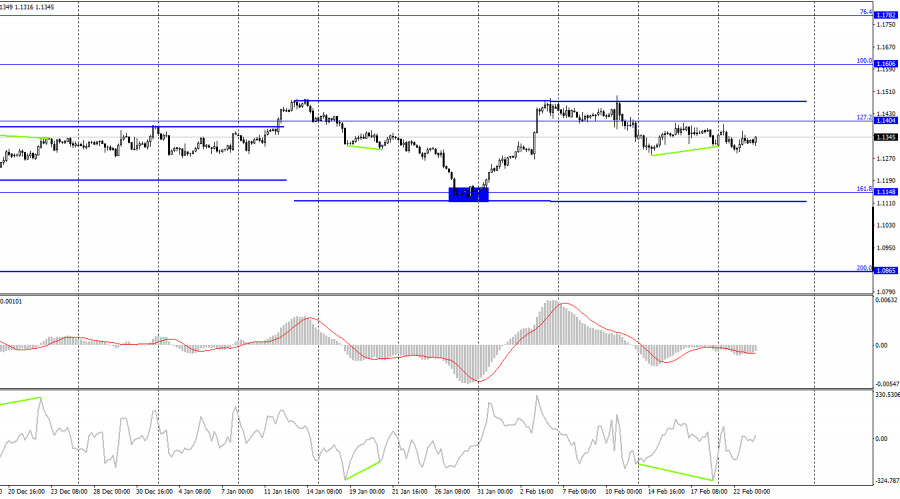
| Forecast for EUR/USD on February 23 Posted: 23 Feb 2022 04:11 AM PST
On Tuesday, the EUR/USD pair continued to trade inside the side corridor, which it has been for the eighth day. Thus, at this time I cannot characterize the mood of traders as "bullish" or "bearish". I assume that the pair may be inside the side corridor for some time because no news is expected this week that can affect the mood of traders. We can say that all the most important news has already been released. And they all concerned geopolitics. Yesterday, it became known that the EU countries, the United States imposed sanctions against the Russian Federation, the DPR, and the LPR. The whole world assessed these sanctions as "weak", which saved the ruble and Russian markets from an even greater fall. But we are more interested in the euro and the dollar. And those are standing in one place and do not know where to move on. So far, traders have shown not that they care about geopolitics, but that they do not care about it at all. Although such behavior can also be described as cautious. Traders may understand that the geopolitical conflict in Ukraine is only at the very beginning and may continue to get worse. Especially after it became known about the cancellation of the meeting between US Secretary of State Antony Blinken and Russian Foreign Minister Sergey Lavrov. This meeting was supposed to precede the meeting of Presidents Putin and Biden, which was scheduled for tomorrow. However, now the world media say that the meeting will not take place. This means that there is no hope for a quick de-escalation of the conflict. Moscow and Washington have made their moves. Each move signaled to the market that the parties did not intend to give in and were ready to go in their convictions to the very end. But there is no economic news right now, so traders, no matter how much they would like it, cannot shift the focus from geopolitics to the economy. A report on inflation in the European Union will be released today, but it is unlikely to cause a reaction, since this will be the final value for January, and it rarely differs from the preliminary one. Inflation is likely to rise to 5.1% y/y.
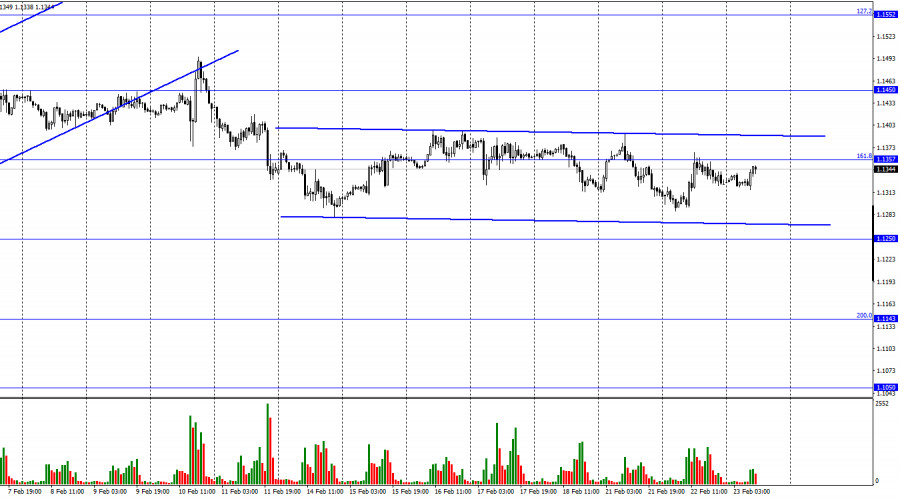
On the 4-hour chart, the pair performed a new reversal in favor of the US dollar and began a very weak process of falling. However, the current side corridor is the main graphical analysis weapon for traders. The picture clearly shows that the pair was first inside one side corridor, and now it is in the second, wider one. However, this does not change the essence of the matter. It will be possible to identify the trend only when the closure is performed above or below the corridor. Commitments of Traders (COT) Report:
Last reporting week, speculators opened 5,049 long contracts and closed 6,973 short contracts. This means that the bullish mood has intensified. The total number of long contracts concentrated on their hands now amounts to 223 thousand, and short contracts - 175 thousand. Thus, in general, the mood of the "Non-commercial" category of traders is also characterized as "bullish". This makes it possible for the European currency to count on growth, if not for the information background, which now supports the American currency to a greater extent. I believe that now the data from the COT reports can be neglected since the situation in the world is tense and the mood of major players can change rapidly. News calendar for the USA and the European Union: EU - consumer price index (10:00 UTC). On February 23, the EU calendar contains one weak report. In the USA today, the calendar of economic events is empty. Thus, I do not think that the graphical picture of the euro-dollar pair will change much after today. EUR/USD forecast and recommendations to traders: I recommended new sales of the pair with targets of 1.1357 and 1.1250 if a close is made below the level of 1.1404 on the 4-hour chart. Now, these deals can be kept open. I recommend buying a pair if there is a closure over any side corridor on any chart. The material has been provided by InstaForex Company - www.instaforex.com |
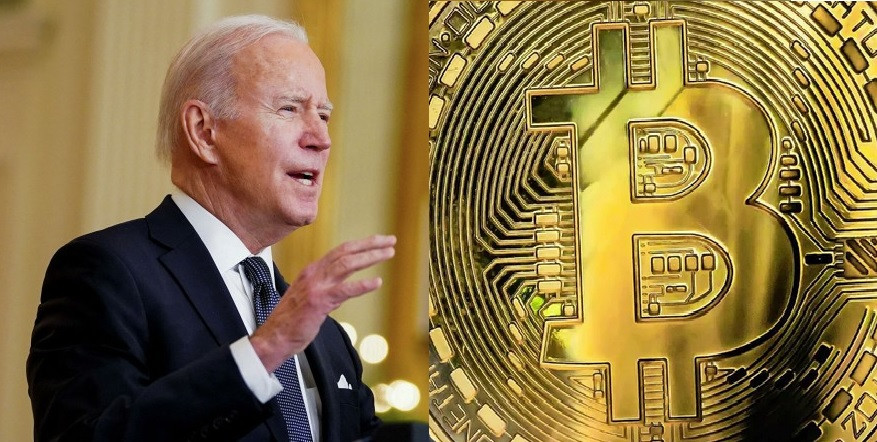
| Bitcoin went up after Biden announces sanctions on Russia Posted: 23 Feb 2022 03:52 AM PST
Bitcoin slightly went up after U.S. President Joe Biden announced new sanctions against Russia. According to a Bloomberg report, during a press conference on Tuesday, Biden said for the first time that he considers Russia's move against two regions of Ukraine as an invasion. Accordingly, he hastened to announce sanctions against Russia. Biden also said the United States would provide additional supplies and troops to the Baltic states and Poland. Last week, the largest cryptocurrency by market capitalization dipped below $40,000 for the first time since January 21, leaving traders wondering how Russia's growing military presence in Ukraine will shake up the cryptocurrency market. So far, bitcoin has not been the hedge against inflation that many hoped for. Fundamental factors will contribute to the long-term rise of bitcoin as the overall tension in Europe subsides. The prospect of large-scale sanctions against Russia could be a potential boost for bitcoin as Russia looks to the crypto market to avoid potential global punishment.
|
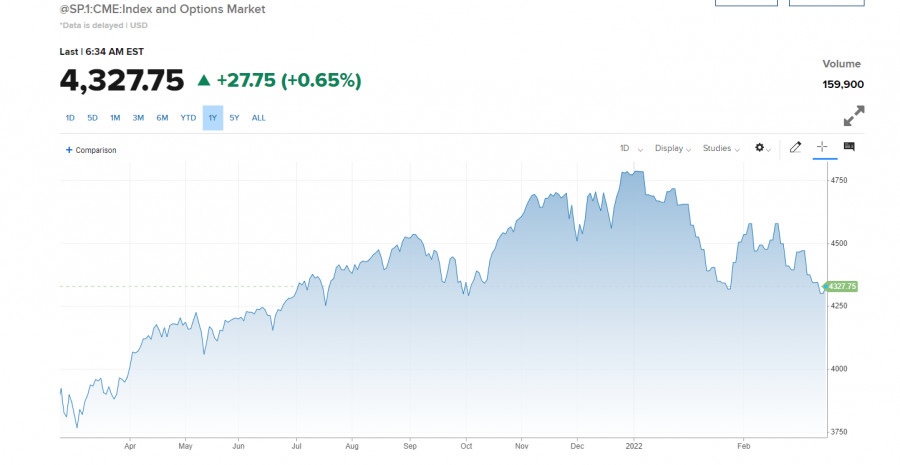
| US premarket on February 23: banking and oil sectors among most attractive investment areas Posted: 23 Feb 2022 03:49 AM PST US stock index futures rose on Wednesday after the S&P 500 index closed in the red amid escalating tensions between Russia and Ukraine. Futures contracts linked to the industrial index rose by 220 points or 0.65%. S&P 500 futures added 0.77% and Nasdaq 100 futures gained 1.11%. The Dow Jones index fell by 483 points or 1.42% after yesterday's trading session, marking its fourth consecutive decline. The S&P 500 index lost 1.01%, and Nasdaq Composite dropped by 1.23%. It was the fourth negative session in a row.
US President Joe Biden unveiled the first sanctions against Russia yesterday. The measures aim at several Russian banks, the country's sovereign debt, and three businessmen. Many experts note that despite the negative reaction of the market to military actions, which tend to cause volatility and short-term declines, markets eventually recover unless these events push the economy into recession. Energy prices declined today, while government bond yields rose. A lot of energy stocks are in the red now, despite the jump in oil prices, which is a good time to buy the asset in the medium term. High oil prices promise to remain so for quite some time. At the time of writing, Brent crude is down slightly from yesterday's levels at $99.50 per barrel, and West Texas Intermediate crude futures, after hitting a high of $96, have also sagged and are trading at $91.30 now.
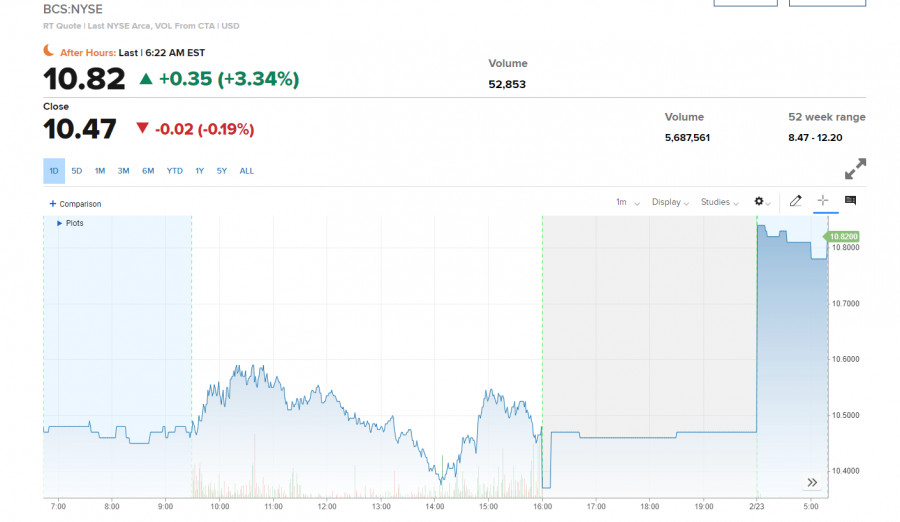
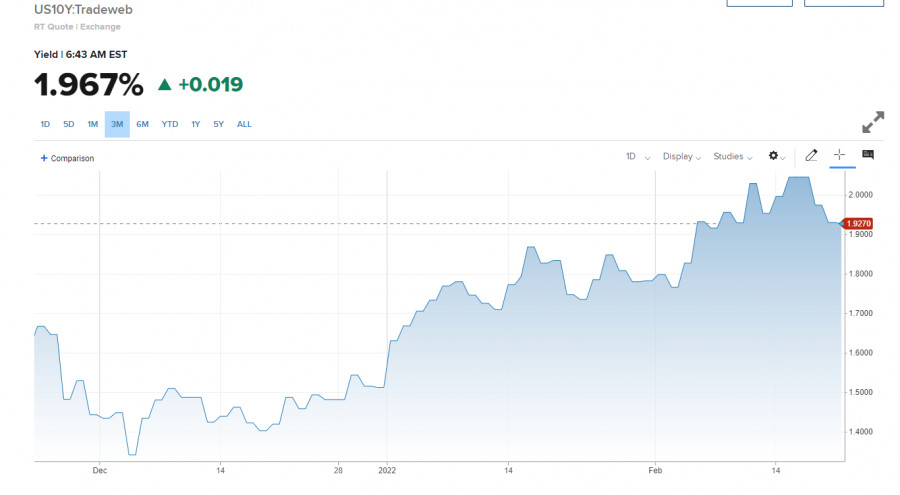
I also would like to draw your attention to the banking sector, which will show good growth this year amid rising interest rates in many countries. According to Refinitiv, Barclays Plc's fourth-quarter net income was £1.12 billion, exceeding the average forecast of £756.5 million. These figures show a significant improvement in the company's financial health compared with net income of £1.53 billion reported in 2020 and £220 million in the fourth quarter of the same year. Barclays also reported a full-year 2021 net income of £6.38 billion, beating analysts' expectations of £5.75 billion. This large growth was achieved by the prosperity of its corporate and investment banking divisions. The UK bank experienced a tumultuous Q4 2021 after CEO Jes Staley resigned in November over a regulatory investigation into his relationship with Jeffrey Epstein. After the bank's third-quarter earnings, Staley said 2021 would be a "great year" for Barclays, as strong growth from its corporate and investment banking division continued to drive profits, a key ratio used to measure profitability. As for US interest rates, rising rates will only boost banking sector profitability. According to CME Group's FedWatch tool, Wall Street is betting on a 100% chance of a rate hike at the Federal Reserve's meeting in March. With inflation skyrocketing, calls for a 50 basis point rate hike at the March meeting are increasing. Regarding bond yields, they have fallen as tensions between Russia and Ukraine have escalated. The yield on benchmark 10-year US Treasuries fell below 2% as investors look for safe-haven assets.
As for the technical picture of the S&P 500 index Bulls started actively buying from $4,319 today, above which the market opened with a gap. A fast return above $4,319 leaves hope for the market recovery, however, what will be at the regular session today is a big question. Buyers need to hold the price support at $4,319, and the index is likely to test this level today. A breakout of this range may increase pressure on the index and return the bear market with the prospect of hitting the lows of $4,265 and $4,223. Bulls will probably try to continue pushing the price upwards today to the resistance area of $4,378. A breakout of this area may allow the index to recover to the area of $4,433. The material has been provided by InstaForex Company - www.instaforex.com |
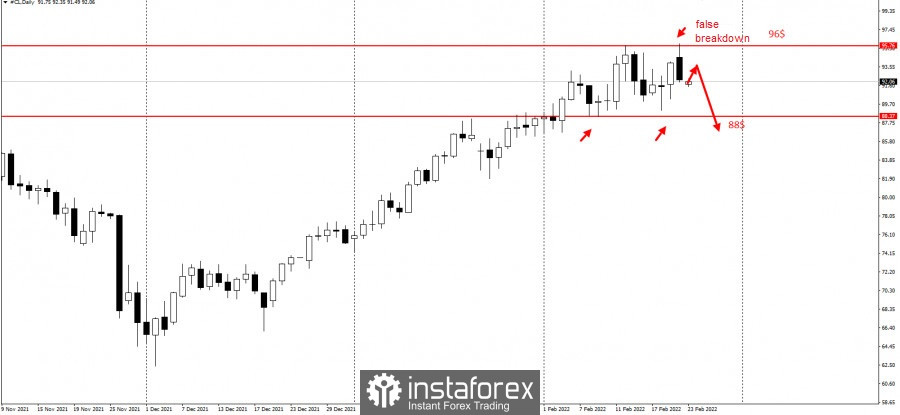
| Posted: 23 Feb 2022 03:33 AM PST
After hitting another high ($96), oil fell during yesterday's US session and closed $4 below the daily high. If we take the fall from 96 to 92 as an initiative, then we can consider a continuation of this movement according to this scheme:
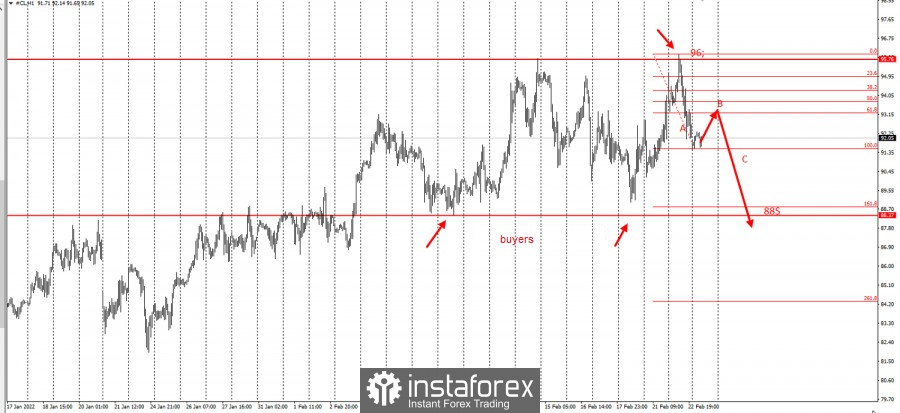
The H1 chart will look like this:
Since there is a three-wave pattern (ABC), where wave A represents the selling pressure yesterday, traders can take short positions up to the 50% and 61.8% retracement levels of $ 93. Set stop loss at $96, then take profit on the breakdown of $88. This trading idea is based on the "Price Action" and "Stop Hunting" strategies. Good luck and have a nice day! The material has been provided by InstaForex Company - www.instaforex.com |


| You are subscribed to email updates from Forex analysis review. To stop receiving these emails, you may unsubscribe now. | Email delivery powered by Google |
| Google, 1600 Amphitheatre Parkway, Mountain View, CA 94043, United States | |


Comments