Forex analysis review
Forex analysis review |
- US premarket for February 17: Buy gold urgently
- GBP/USD update for February 17, 2022 - Buyers in control
- EUR/USD analysis on February 17, 2022: Escalation of conflict in Donbass
- Analysis of Gold for February 17,.2022 - Breakout of multy-year triangle pattern
- US stock indices trade mixed
- BTC analysis for February 17,.2022 - Potential for another downside wave
- Bloomberg notes a decrease in correlation between Bitcoin and S&P 500: how will this affect BTC/USD quotes?
- GBP/USD on February 17, 2022
- XAU/USD: Long positions look preferable
- GBP/USD: trading plan for American session on February 17. GBP heading for 1-month high and aiming to test resistance at
- Outlook for EUR/USD on February 17. EUR recoups losses to climb to 1.1381
- Technical analysis recommendations for EUR/USD and GBP/USD on February 17
- Stocks fell ahead of January FOMC minutes
- Daily Video Analysis: XAUUSD, H4 Gold Buying Opportunity
- Bank of Canada will fight inflation hard
- Recent crypto rally lags behind those posted by the stock market
- Trading plan for USD/CAD on February 17, 2022
- Forex forecast 02/17/2022 USD/CHF, AUD/USD, USD/JPY and Bitcoin from Sebastian Seliga
- Immediate growth of cryptocurrency threatens financial stability
- Analysis and trading tips for EUR/USD on February 17
- Three main factors for USD growth: geopolitics, risk appetite, and macro statistics
- Indicator analysis of GBP/USD for February 17, 2022
- Geopolitics and inflation push gold up
- Trading plan for starters of EUR/USD and GBP/USD on February 17, 2022
- Indicator analysis of EUR/USD for February 17, 2022
| US premarket for February 17: Buy gold urgently Posted: 17 Feb 2022 06:56 AM PST U.S. stock index futures tumbled Thursday as investors took advantage of the technical failure of the instrument's inability to break above $4,480 after digesting corporate profit and loss reports, Federal Reserve news, and developments in the Russian-Ukrainian conflict. Futures for the Dow Jones Industrial Average lost 161 points, or 0.46%. S&P 500 futures were down 0.5% and Nasdaq 100 futures were down 0.63%.
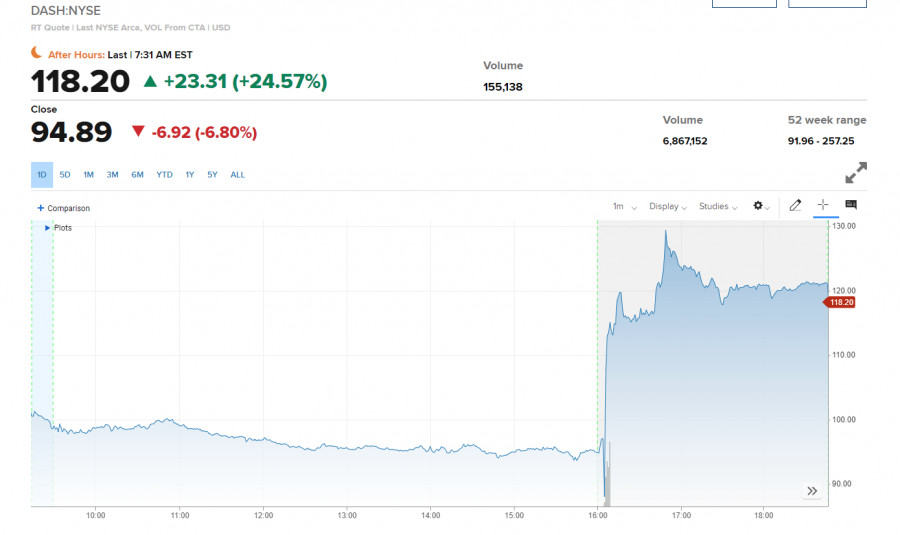
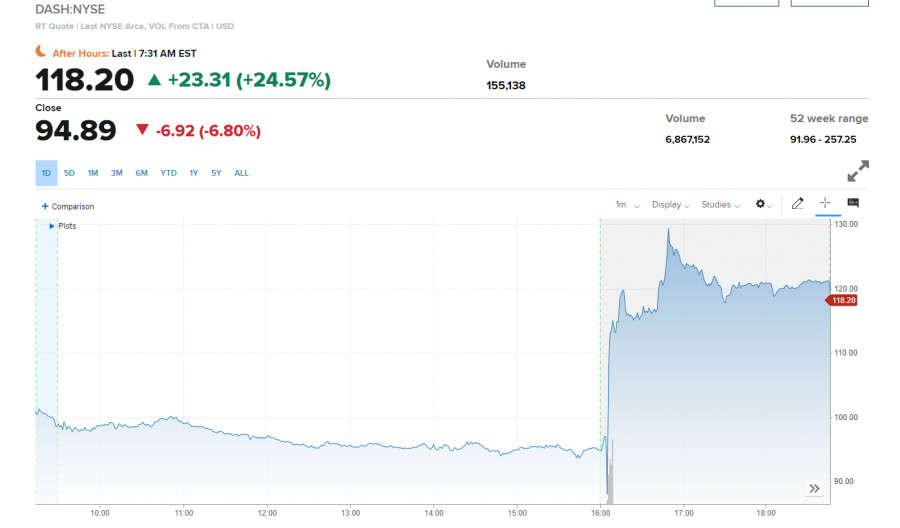
Yesterday, quite a lot of corporate reports were published, which indirectly only influenced the direction of the market. DoorDash rose more than 26% today in premarket trading after the company announced revenue growth and issued an upbeat outlook. Cisco rose 3.5% after the company raised its forecast and Applied Materials added 2%. Today, investors are waiting for quarterly reports from Walmart, Airbus, Autonation, and Nestle.
Attention should be paid today to weekly data on jobless claims in the U.S. Economists estimate that claims for benefits could reach 218,000, a slight drop from the previous week. The market will also see data on the number of new homes and building permits, as well as the manufacturing index of the Philadelphia Fed. Fed spokesman James Bullard's speech may affect market volatility. As of yesterday, the S&P 500 was almost unchanged at the close of the trading session on Wednesday, while the Dow lost almost 55 points and the Nasdaq Composite shed 0.1%. Buy gold The ongoing tension on the Russian-Ukrainian border continues to influence the mood of market participants, which is confirmed by the growth of gold. Recently, this trading tool has grown significantly, and the recent correction has only increased demand for it.
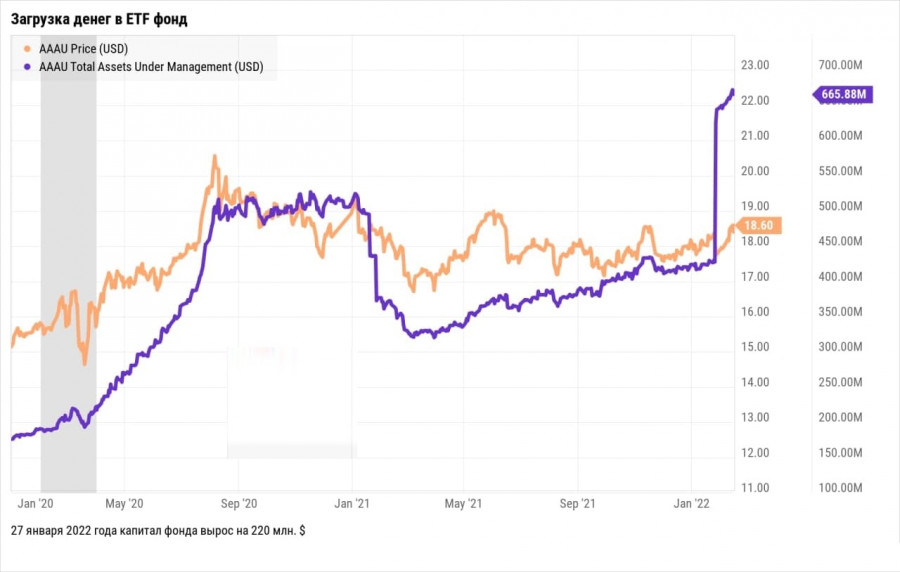
Goldman Sachs Physical Gold ETF (AAAU), which fund holds physical gold in Australia, began to actively grow capital. Recently, the fund's AUM has grown by $220 million. Investors continue to gain positions in gold, as they do not believe in a quick end to the conflict between Russia and Ukraine. NATO officials on Wednesday accused Russia of increasing the number of troops on the border of Ukraine. On Thursday, Russia has expressed dissatisfaction with the unrest in eastern Ukraine and warned that now it will take time to withdraw troops from the border. According to the latest data, the People's Militia of the LPR reported shelling from the Ukrainian side. The DPR military returned fire. The police of the unrecognized republic declare that the ceasefire regime was violated four times in a day, a total of 42 shells came from the Armed Forces of Ukraine. International investors pour more money into Chinese stocks Leaving aside geopolitics, it is worth noting that investors continue to look towards China. Mainland China equity funds saw a net inflow of $16.6 billion in January, according to research firm EPFR Global. The data showed that the gain followed a net inflow of nearly $11 billion in December. The mixed interest comes as global investment firms have become more positive about mainland Chinese equities in the past few months. Amazon and Visa Finally, Amazon has reached a global agreement with Visa to settle the dispute over credit card fees. The deal means that Amazon customers in the UK can continue to use Visa credit cards, as previously announced by both companies. Amazon will also cut the 0.5% fee on Visa credit card transactions in Singapore and Australia, which it introduced last year. Last month, Amazon said it had abandoned plans to stop accepting Visa credit cards in the UK. The company noted that they will continue negotiations on a broader resolution of their spat.
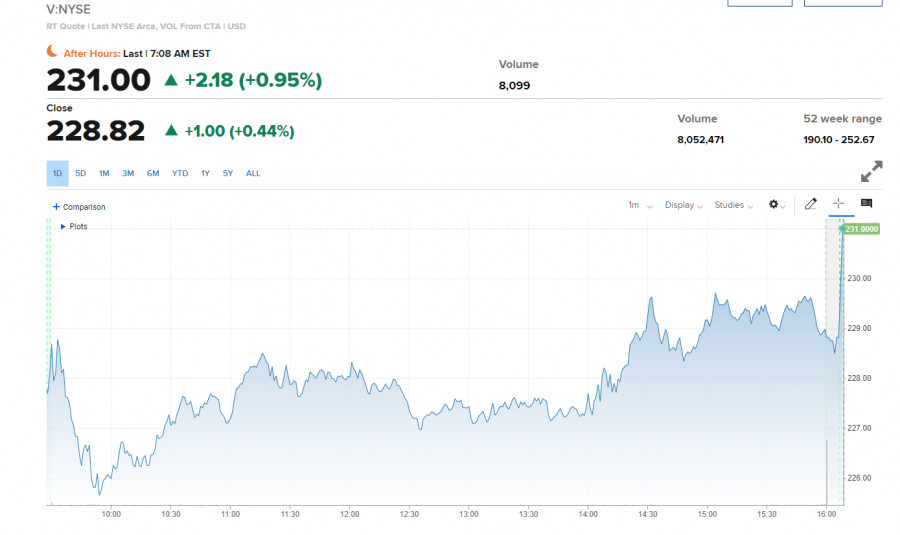
Against this backdrop, Amazon did not react to the news in premarket trading and added 0.41%, trading at $3,175. Visa rose from 228 to 231 +1.0% in premarket trading. As for the technical picture of the S&P 500 The bulls rested at $4,488, while forming a powerful support at $4,433. The further direction will depend on going beyond these levels. In case of a return under $4,433, it will be necessary to think again about protecting the support of $4,378. A breakdown of $4,378 will increase pressure on the index and return the bear market with the prospect of updating lows at $4,312 and $4,265. Surely the bulls will try to continue moving up today in the $4,488 high area. A breakdown of this area will keep the bull market alive and bring trading back to the $4,539 major resistance. The material has been provided by InstaForex Company - www.instaforex.com |
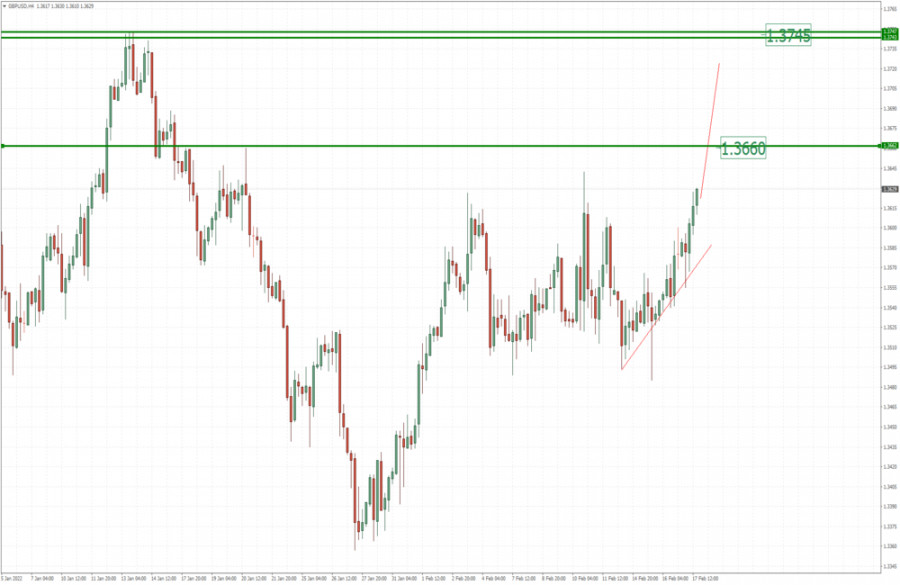
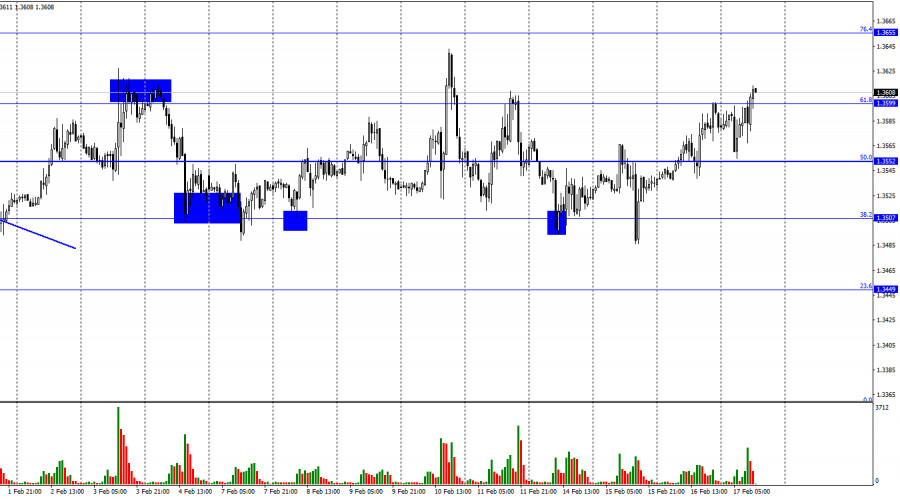
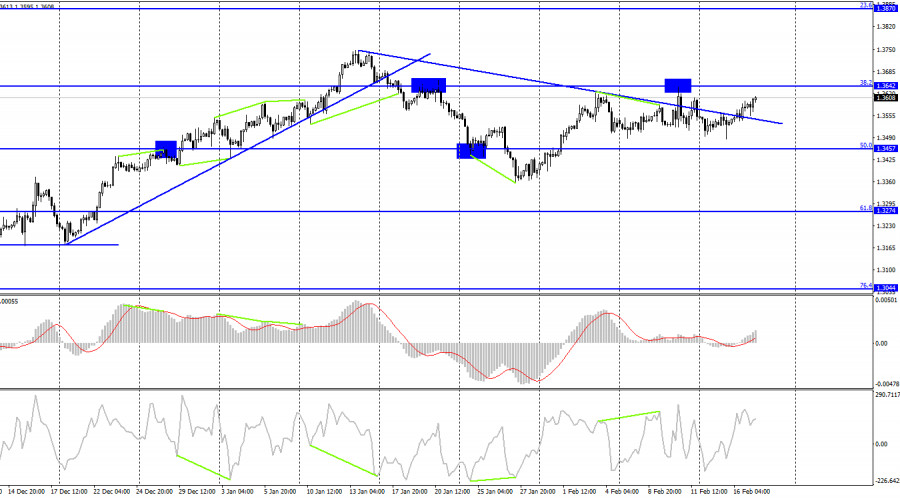
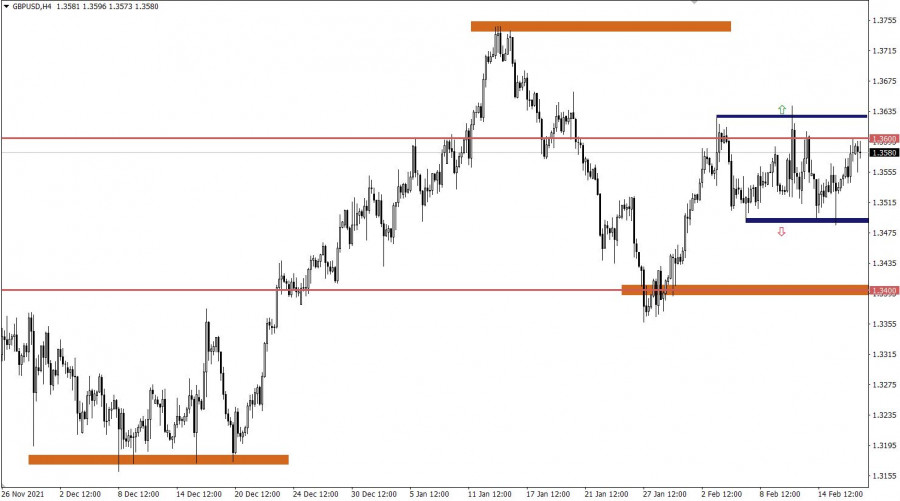
| GBP/USD update for February 17, 2022 - Buyers in control Posted: 17 Feb 2022 06:32 AM PST Technical analysis:
GBP/USD has been trading upside today with good momentum. I see potential for the upside continuation. Trading recommendation: Due to strong rejection of the rising trend-line in the background, I see potential for the upside continuation towards upper references. Watch for buying opportunities on the pullbacks using intraday charts. Upside objectives are set at 1,3660 and 1,3745. Support level is set at 1,3560 The material has been provided by InstaForex Company - www.instaforex.com |
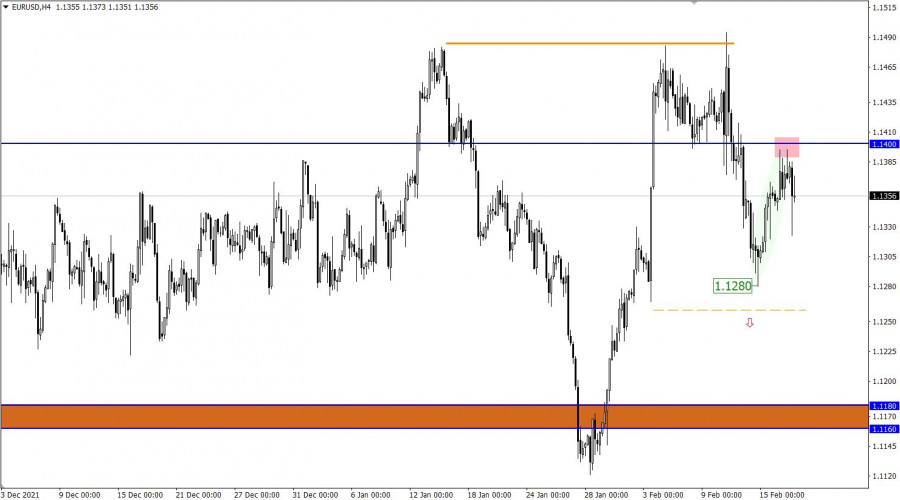
| EUR/USD analysis on February 17, 2022: Escalation of conflict in Donbass Posted: 17 Feb 2022 06:25 AM PST
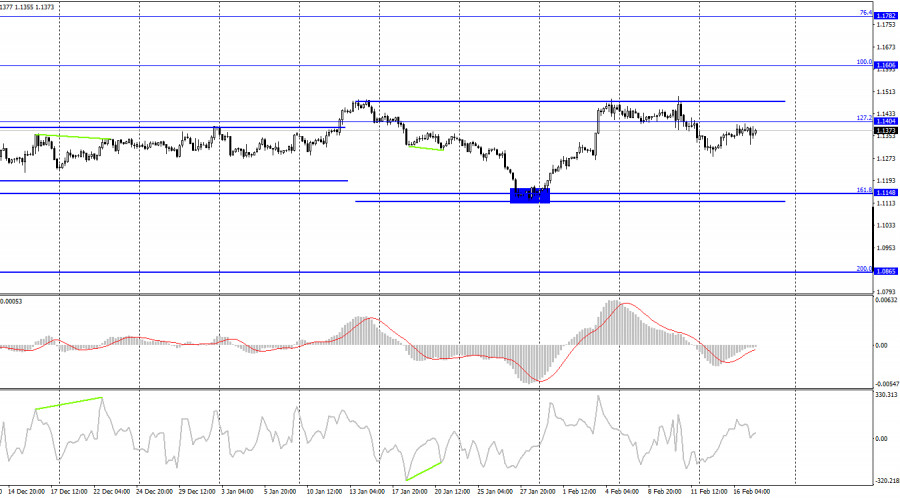
The EUR/USD pair closed above 1.1357, the 161.8% retracement level, on Wednesday. Today, the activity of traders is minimal, despite the rather important and strong informational background yesterday. In particular, the U.S. retail trade report and the minutes of the FOMC meeting were released. However, neither of these had any effect on the mood of traders. It is also almost impossible now to say in which direction traders will continue to trade and who will have an advantage. There are no corridors on the hourly chart, and the 4-hour chart is in sideways. Thus, neither geopolitics nor economic news can force traders to trade. Unfortunately, geopolitics does not grab the interest of traders. And it seems to me that the silence in the markets is just related to it. Traders simply do not want to risk the situation when it is completely unclear how the Ukrainian-Russian conflict will end. This morning, news began to come from Donbass about battles between militants of the unrecognized republics of the DPR and LPR and the Ukrainian military. The nature of these battles is unknown. Negotiations between Moscow and the West have stalled, and one question is now hanging in the air: what is next? The Russian Federation concentrated a huge army near the border of Ukraine but did not achieve what it wanted, since no one in Ukraine or in the West abandoned the idea of Ukraine joining NATO. Ukraine continues to receive financial and military assistance from many countries of the world. The February 16 invasion did not happen, but at the same time, Russian troops are unlikely to stand on the border for another year or two, waiting for a decision at the highest political level to be found. Moscow has stressed that it will not attack anyone and conducts routine exercises on its territory. The West, on the other hand, reports daily new dates for a possible Russian invasion of Ukraine. In general, the situation is very unstable and dangerous. No matter how panic happens in the markets.
On the 4-hour chart, the pair closed below 1.1404, the 127.2% retracement level, and may continue to fall in the direction of 1.1148, the 161.8% Fibonacci retracement level. There are no emerging divergences in any indicator today, and they are not required with the current information background. The new side corridor characterizes the mood of traders as neutral. Now there is no advantage for either the bulls or the bears. Commitments of Traders (COT) report:
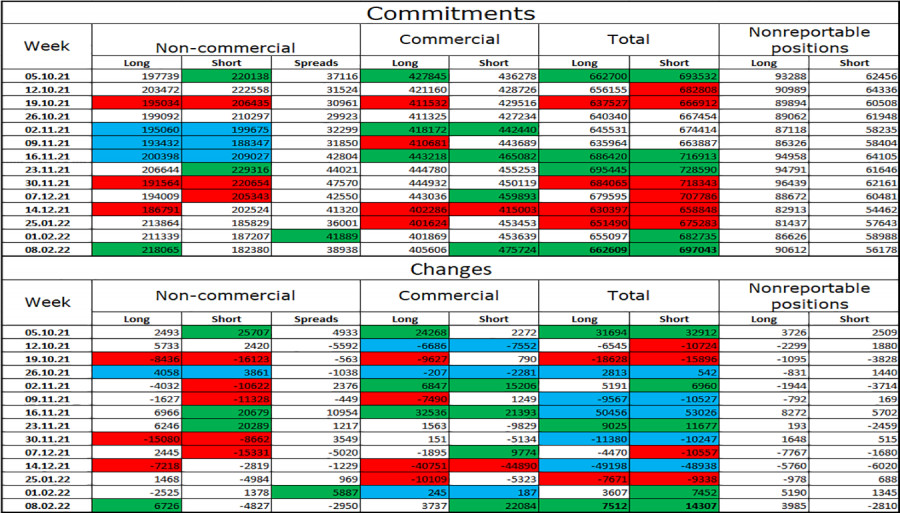
Last reporting week, speculators opened 6,726 long contracts and closed 4,827 short contracts. This means that their mood has become more bullish. The total number of longs focused on their hands is now 218K and shorts are 182K. Thus, in general, the mood of the non-commercial category of traders is characterized as bullish. This would enable the European currency to count on growth, if not for the information background, which now fully supports the U.S. currency. I believe that this week's COT reports can be neglected, as the situation in the world is tense and the mood of major players can change rapidly. U.S. & EU New calendar: U.S. - Initial Jobless Claims (13:30 UTC). On February 17, the calendars of the European Union and the United States are almost completely empty. There will be only one less important report in the U.S., which will surely be ignored. The information background today will be weak or absent. EUR/USD Forecast and Advice to Traders: I recommend selling the pair with targets at 1.1357 and 1.1250 if the price closes below 1.1404 on the 4-hour timeframe. These trades can now be kept open. I do not recommend buying now, as the probability of a continuation of the fall is too high. The material has been provided by InstaForex Company - www.instaforex.com |
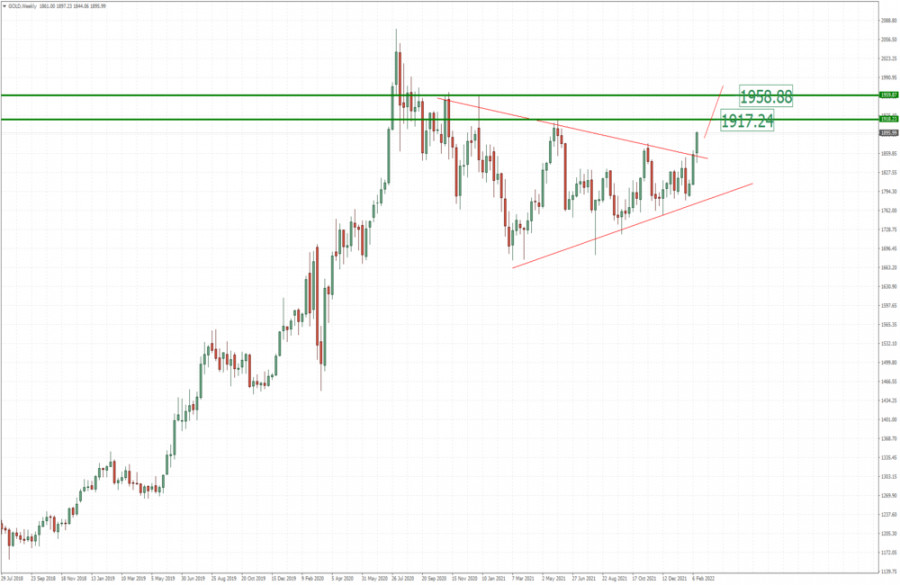
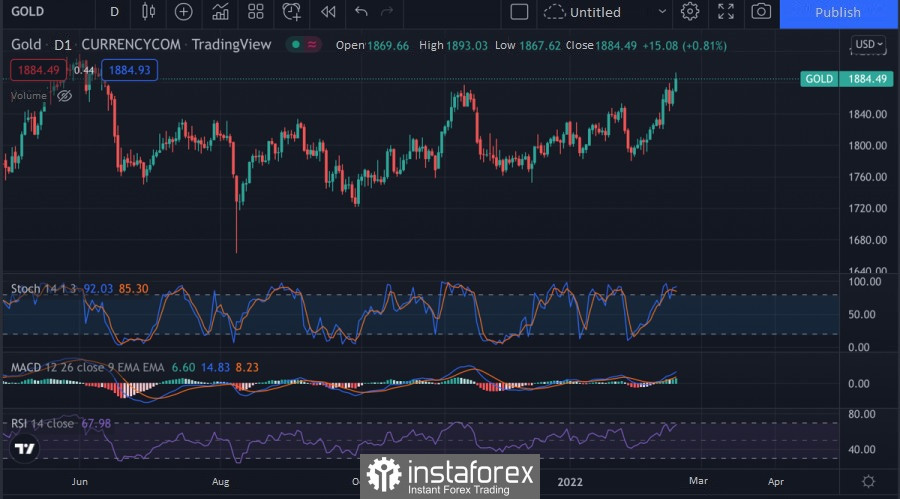
| Analysis of Gold for February 17,.2022 - Breakout of multy-year triangle pattern Posted: 17 Feb 2022 06:14 AM PST Technical analysis:
Gold has been trading upside this week and today and I see potential for further upside continuation. Trading recommendation: Due to the breakout of multi-year consolidation on the Gold and strong upside momentum this week, I see potential for buying opportunities. Watch for buying opportunities on the dips with the upside objectives at $1,917 and $1,958. There is the breakout of the big symmetrical triangle in the background, which is strong sign for the further rise. Support level is set at $1,878 The material has been provided by InstaForex Company - www.instaforex.com |
| Posted: 17 Feb 2022 06:11 AM PST
US stock indices closed mixed on Wednesday. The Dow Jones and the NASDAQ lost 0.16% and 0.11% respectively. The S&P 500 added 0.1%. The indices showed 2 sessions of decline. However, the FOMC Minutes for January released yesterday installed optimism in markets. Traders are now trying to guess whether this is going to be a quarter or a half-percentage-point interest rate hike next month. Easing tensions between Russia and Ukraine are adding optimism. Russian troops are returning to their permanent deployment sites after the exercises. Russia and Belarus began their joint military drills "2022 Union Resolve" to examine the readiness of its forces "suppressing and repelling external aggression," and countering terrorism. The military exercise does not pose any threat and its function is solely defensive, the parties said. Continuing inflation is spooking investors. In the UK, the figure hit the 30-year high. In the US, retail sales jumped to 3.8% in January, much better than market forecasts of a 2% rise. On a yearly basis, US retail sales increased 13% in January, compared to a 16.7% rise in December. Monetary policy, high energy prices, and global supply chain disruptions are among the forces driving inflation up. The Fed will have to resort to aggressive measures if inflation growth is not tamed. Industrial production in the US increased 4.10% year-on-year in January. The figure had been expected to grow by 0.4%-05%. On a yearly basis, industrial production climbed 4.1%, following a 3.8% rise in December. Uncertainty in the market is caused by various factors, including galloping inflation, monetary measures by regulators, the imbalance between supply and demand, as well as an uneven pace of the global economic recovery. The Russia-Ukraine conflict only adds fuel to the fire. All these factors, in turn, affect oil prices that have already soared to $93.66 per barrel. Meanwhile, the earnings season in the US goes on. Kraft Heinz Co. incurred losses in Q4 2021. However, the adjusted figures showed higher-than-expected earnings. The company's stock added 5.6% as a result. Roblox Corp. stock tumbled 26.5%, following disappointing Q4 earnings. ViacomCBS plunged 17.8% after the publication of quarterly results below expectations. Shopify Inc. lost 16%, following disappointing Q4 results, and despite higher-than-expected adjusted earnings. The STOXX Europe 600 gained 0.1%. Japan's Nikkei 225 climbed 2.2%. The Korea Composite Stock Price Index advanced 2%. Hong Kong's Hang Seng Index rose 1.5% and China's Shanghai Composite added 0.6%. The material has been provided by InstaForex Company - www.instaforex.com |
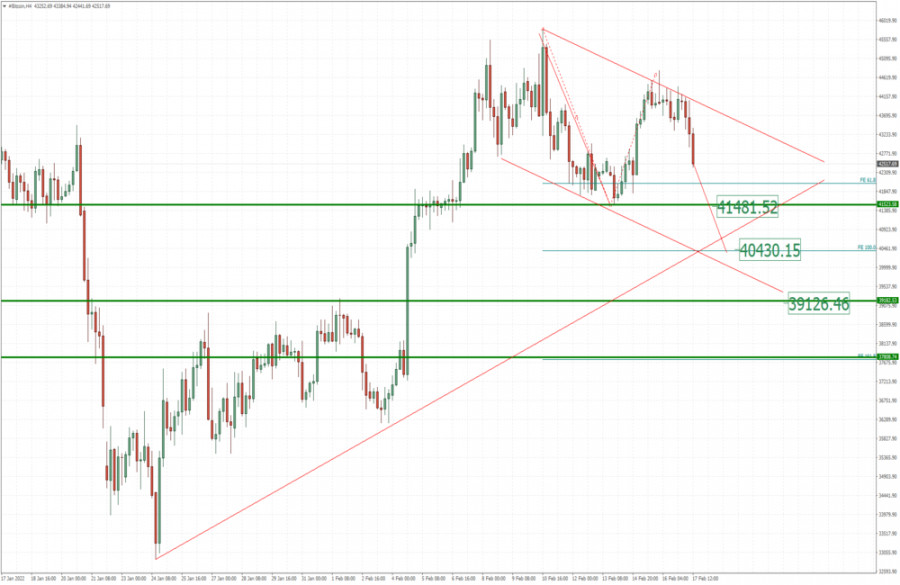
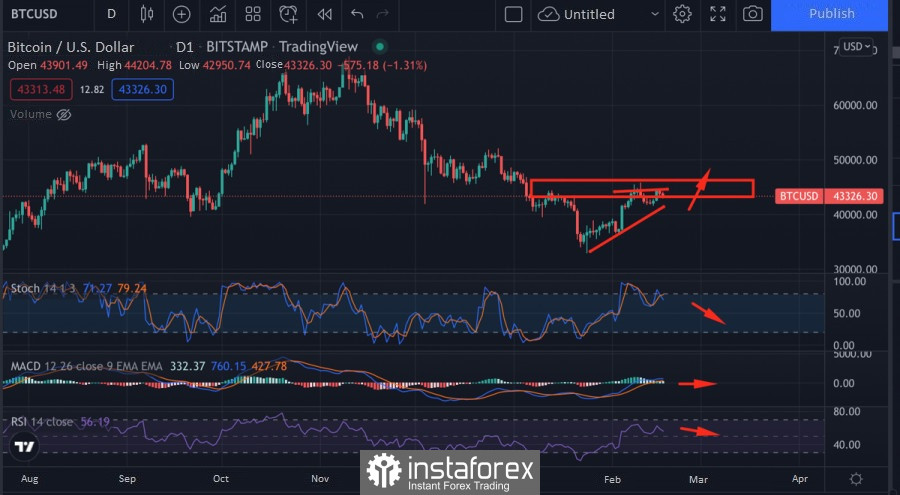
| BTC analysis for February 17,.2022 - Potential for another downside wave Posted: 17 Feb 2022 05:54 AM PST Technical analysis:
BTC has been trading downside morning and there is the breakout of the contraction in the background ,which is sign that BTC can trade lower in the next period. Trading recommendation: Due to the downside breakout of mini contraction in the background and potential for the second downside leg, I see potential for the downside opportunities. Watch for selling opportunities on the intraday rallies with the downside objectives at $41,480, $40,430 and $39,125. Key resistance is set at the price of $44,600 The material has been provided by InstaForex Company - www.instaforex.com |
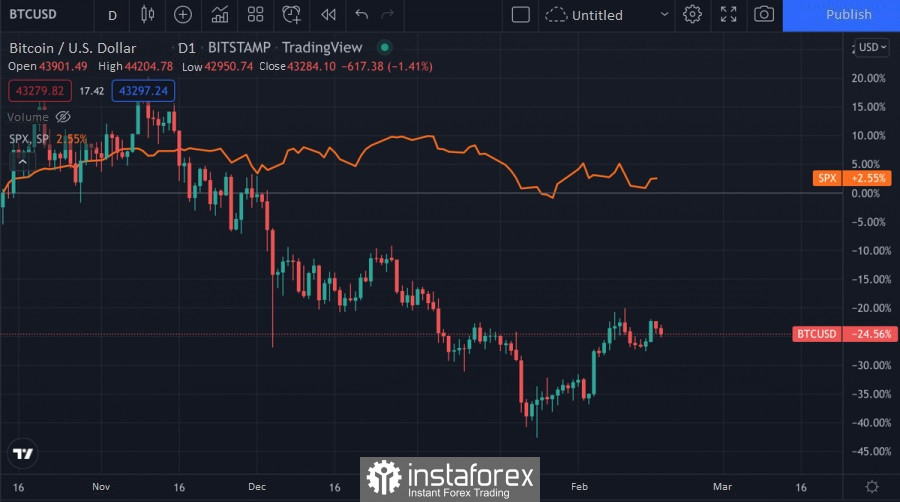
| Posted: 17 Feb 2022 05:04 AM PST The situation around Bitcoin has not changed significantly over the past day. It continues to move within a narrow range of $42k–$44k, and the market expects to break out of it soon. But despite the local lull, in the broader perspective, there is a divergence between Bitcoin and stock indices. IntoTheBlock experts note a decrease in the correlation between Bitcoin and the S&P 500 to 0.45. Codependency began to fall as the cryptocurrency recovered above $35k. This is good news, as it confirms the assumption that BTC began to correlate with stock indices due to a difficult market situation.
Due to the formation of a local bottom at $32k and a gradual increase in price to current levels, the cryptocurrency begins to get rid of dependence on classical instruments. This is positive news for the digital asset market as a separate sector of the global economy. In addition, the drop in the level of dependence indicates an increase in investment in crypto assets, as well as a gradual improvement in the situation on the digital coin market. Another feature that contributed to the decrease in the correlation was the macroeconomic situation and the policy of the Fed. Investors are pursuing capital saving tactics, and BTC is an important tool in this process. Galaxy Digital CEO Michael Novogratz, also believes that the main cryptocurrency, along with gold, is an effective risk hedging tool.
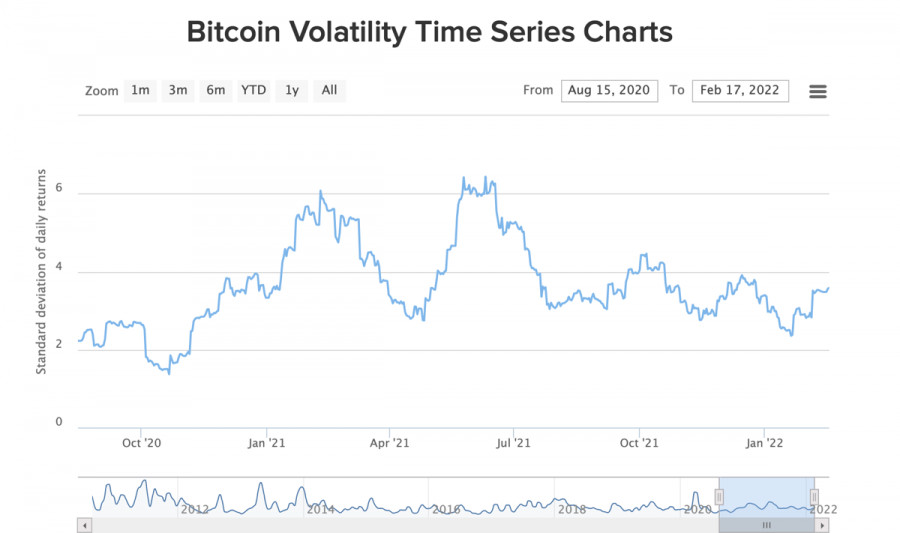
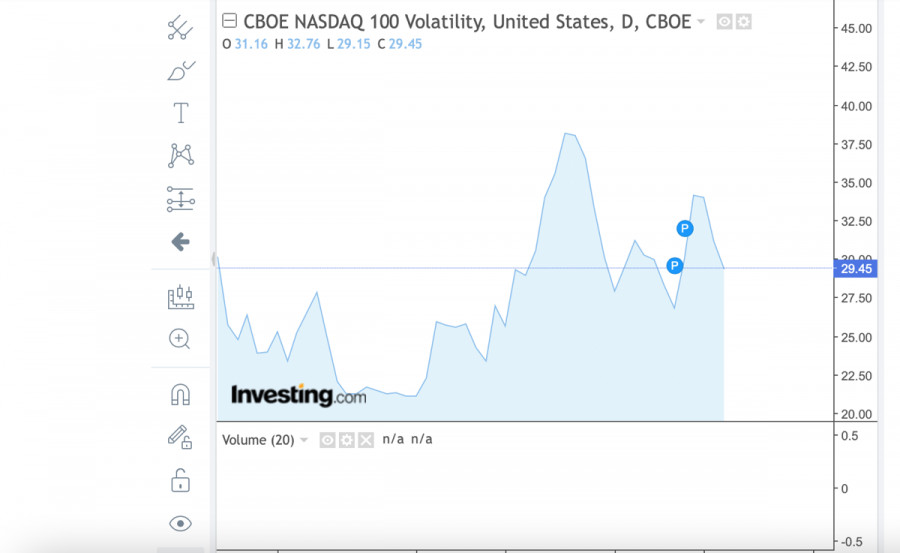
The increase in volatility during the corrective cycle in winter 2021 was also a reason for investor caution and strengthened the correlation between BTC and SPX/NASDAQ. However, as the level of fluctuations decreased and the price recovered, the cryptocurrency became more independent. Bloomberg analysts noticed that in 2022, the volatility of Bitcoin is less than that of the NASDAQ index.
This indicates the stabilization of investment flows in Bitcoin products, the active growth of the audience, and its maturity. It is likely that the correlation with trade indices will increase as the Fed tightens its monetary policy. As the Fed plans to repeatedly raise rates this year, risky assets like cryptocurrencies and the stock market will set another codependency record more than once. In the local perspective, a decrease in the correlation indicates interest in BTC as a separate financial instrument or a risk hedging tool. Meanwhile, in technical terms, the main cryptocurrency has not moved off the ground. The asset continues to fluctuate near the important $43k–$45k resistance zone, and only a break of this range will launch a full-fledged upward movement. Buying activity remains at a high level, but a hefty selling shelf in the $44.2k–$44.5k region is preventing BTC/USD from moving further up.
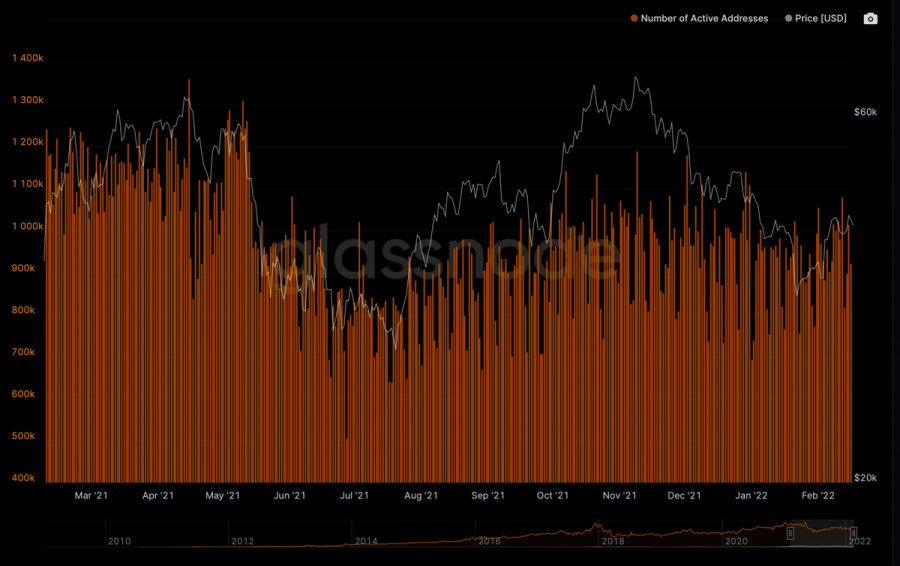
The on-chain activity of Bitcoin also raises questions. The number of unique addresses in the asset network remains around 900K and cannot be fixed above this mark. This indicates a local peak of buying activity, which is clearly not enough to complete the formation of the "head and shoulders" pattern.
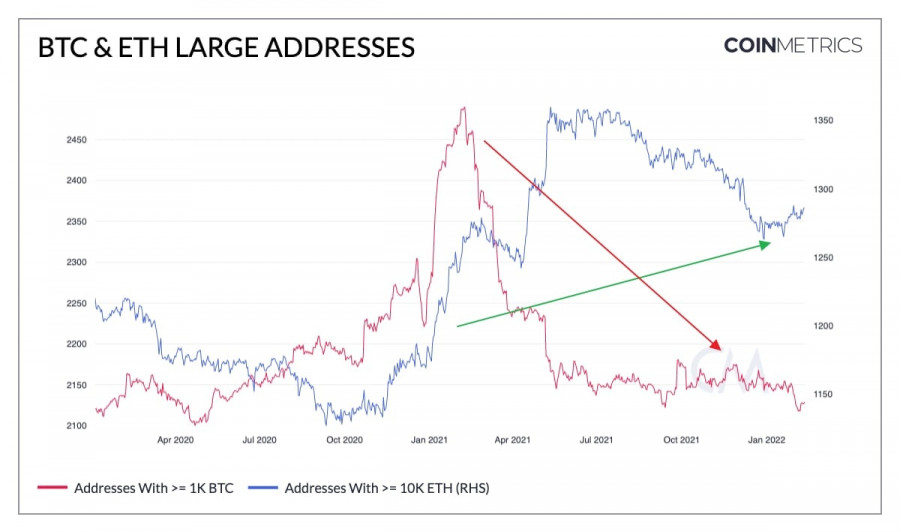
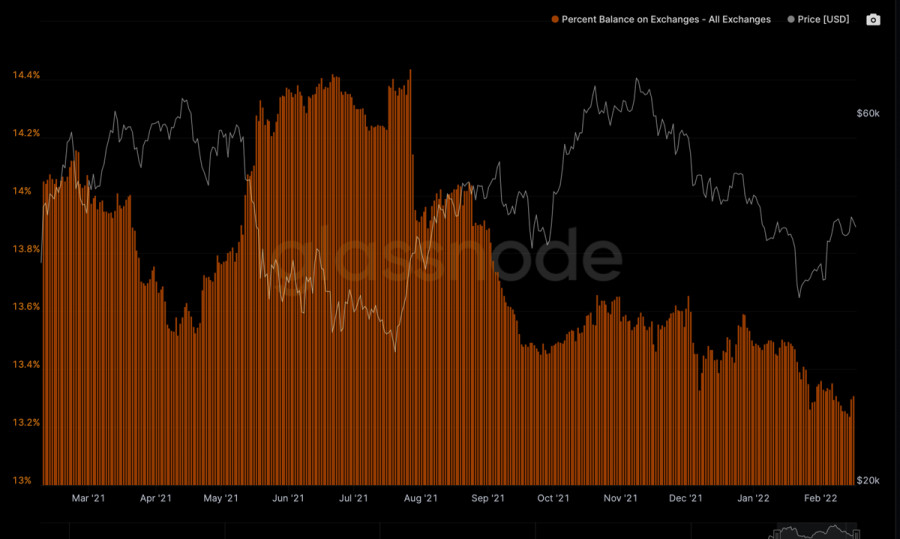
The balance of BTC coins on the exchange also began to acquire an upward trend, which indicates a decrease in demand for cryptocurrency. According to Coinmetrics data, Ethereum is more popular than BTC among large investors at the beginning of 2022. Given the on-chain factors, Bitcoin needs to add in buying activity for further upward movement.
|
| Posted: 17 Feb 2022 04:34 AM PST
Hi, dear traders! According to the H1 chart, on Wednesday GBP/USD bounced off the retracement level of 61.8% (1.3599) down towards the level of 50% (1.3552), before reversing upwards and closing below 1.3599. The pair could continue to rise towards the next Fibo level of 76.4% (1.3655). Yesterday, January's FOMC meeting minutes were published. Market expectations of multiple rate increases have risen significantly recently. Now, market players see 7 rate hikes this year, prompted by soaring inflation that continues to skyrocket despite the winding down of QE. The latest Fed meeting made no important policy decisions and gave no signals about the regulator's future plans. Now, the Fed should clarify how much they would hike the interest rate in March and how often they would do it. However, the US central bank gave no information about it after the meeting, or in its minutes. FOMC members acknowledged US economic growth, while at the same time expressing concern over inflation and stating they were ready to tackle the issue. At the same time, many market players assume high inflation is a complex problem, which is present in many nations and which hinges on the deficit of oil and natural gas, as well as the supply chain situation. Several rate increases could only slow down price growth, and not return it to the target level.
According to the H4 chart, the pair settled above the descending trend line and continued to rise towards the retracement level of 38.2% (1.3642), as predicted earlier. If GBP/USD bounces off this level, it could then decline towards the Fibo level of 50% (1.3457). If the pair settles above the Fibo level of 38.2%, it could then rise towards the next level of 23.6% (1.3870). There are no emerging divergences today. Commitments of Traders (COT) report: The sentiment of Non-commercial traders has changed drastically over the past week covered by the report. Previously, they opened Short positions, now they have opened 15,127 Long positions. The overall trend remains bearish, as open Short positions still outnumber Long ones. However, it shows how quickly the mood of traders can shift. This week's events could contribute to this. US and UK economic calendar: US – Initial jobless claims data (13-30 UTC). There are no important events in the UK, and the sole data release in the US cannot significantly influence traders. Outlook for GBP/USD At this point, opening short positions could be recommended, but there are no sell signals at either the H1 or the H4 charts. It is unlikely that any sell signals could be found at the H1 chart. If the pair closes above the trend line, long positions could be opened with 1.3642 being the target. The material has been provided by InstaForex Company - www.instaforex.com |
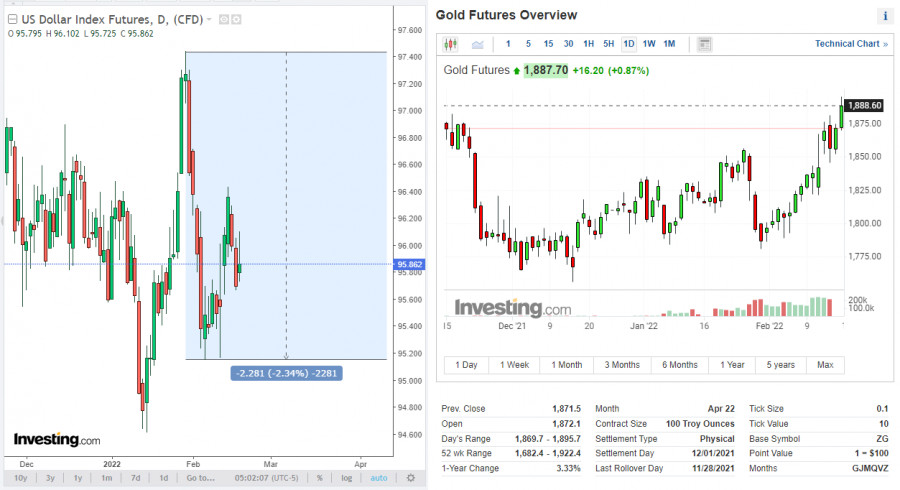
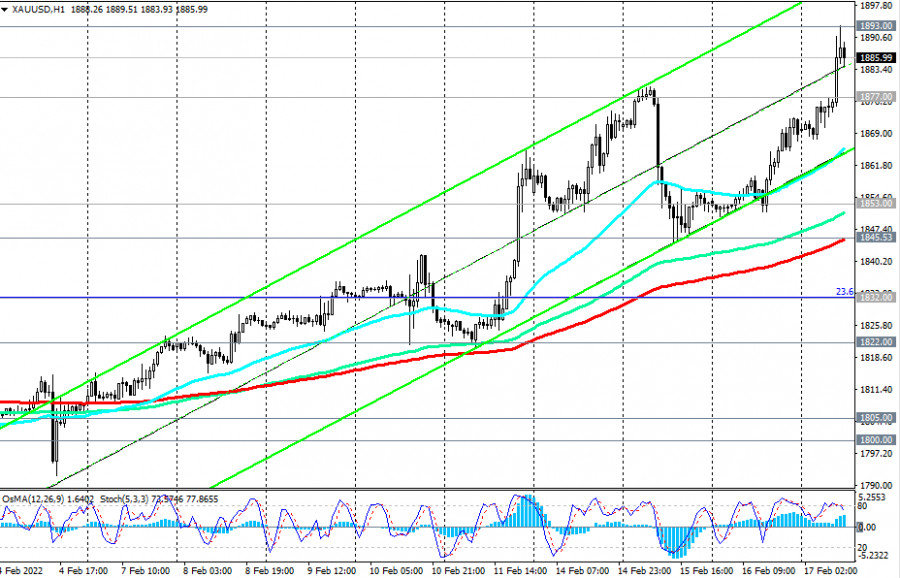
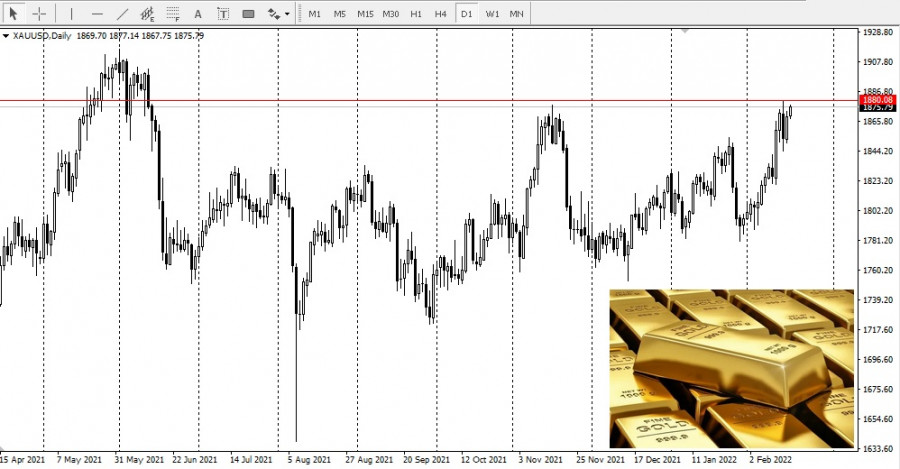
| XAU/USD: Long positions look preferable Posted: 17 Feb 2022 04:07 AM PST "If, contrary to expectations, inflation does not slow down, it would be advisable for the Committee (on open market operations) to remove stimulus measures faster than expected," the minutes of the FOMC meeting, published on Wednesday, said. Nothing new was said in the minutes regarding the prospects for the Fed's monetary policy. On the contrary, they weakened expectations of a more aggressive tightening of the Fed's policy. After last week the U.S. Department of Labor reported another increase in consumer inflation in the country. The consumer price index (CPI) in January rose by 0.6% (+7.5% in annual terms) after rising by 7.0% in December. Speculation intensified that Fed officials could raise interest rates at the March meeting by 50 basis points at once. Some market participants and economists even assumed that the Fed's interest rate would be raised 5-7 times more this year. However, the minutes of the Open Market Committee meeting released on Wednesday do not confirm this: they only reiterate that decisions to tighten policy will be considered from meeting to meeting. Market participants were probably so disappointed with the neutral FOMC protocols that they practically ignored the strong macroeconomic statistics released on Wednesday from the U.S. Retail sales showed steady growth in January by 3.8% (against the forecast of +2.0% and after a decrease of 2.5% in December). At the same time, industrial production rose by 1.4% (against the forecast of +0.4% and after a decline of 0.1% in December).
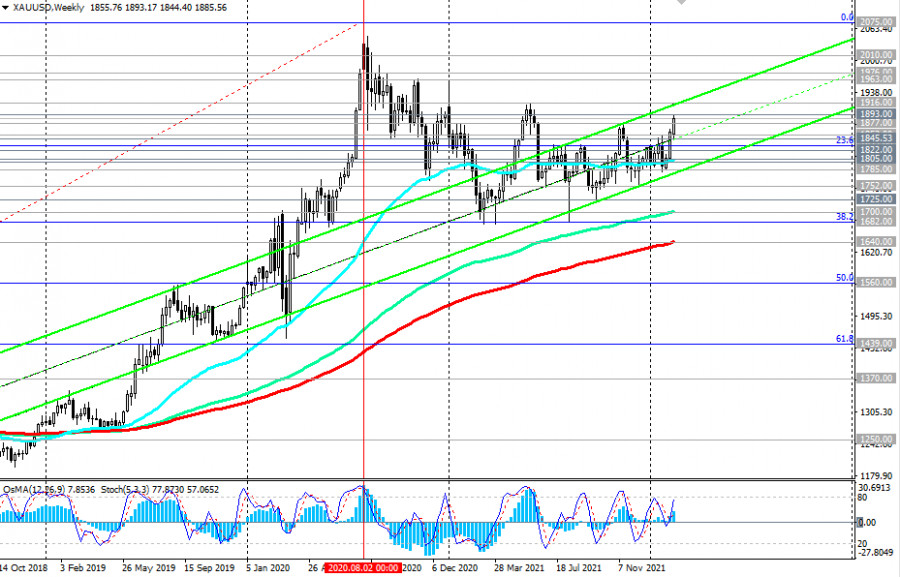
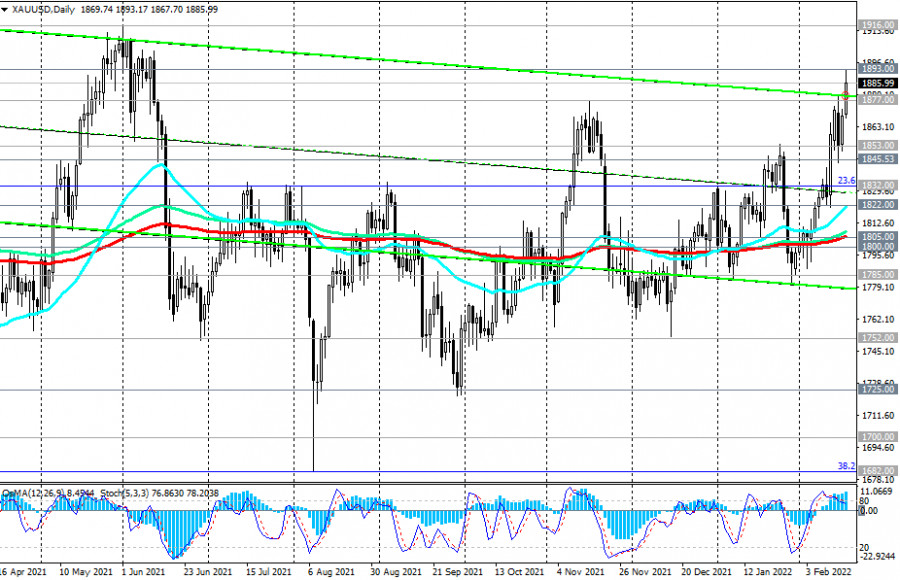
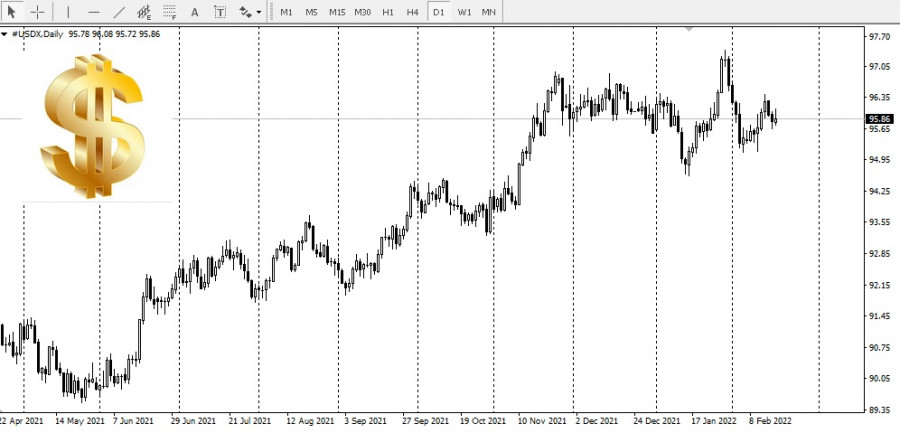
As a result of yesterday's trading day, the dollar weakened, and the dollar index (DXY) fell to 95.70. At the time of writing, DXY futures are trading near 95.86, but the dollar does not yet have a strong positive momentum for further strengthening. Perhaps the reason for growth will appear today, when at 13:30 (GMT) the weekly statistics on the number of applications for unemployment benefits in the U.S. for the week of February 11 will be released. Initial jobless claims are expected to decline to 219K from 223K, 239K, 261K, 290K in previous reporting periods. One way or another, this is still a low number of applications for unemployment. It remains at the lowest level for several decades - about 200,000. This is a positive factor for the dollar, after it became clear from the report of the U.S. Department of Labor that unemployment in the country is at the minimum pandemic and multi-year level of 4.0%. Meanwhile, the weakening of expectations of a more aggressive tightening of the Fed's monetary policy (after the protocols published yesterday from the January meeting) contribute to the growth of gold quotes. Thus, the XAU/USD pair reached a new 8-month high of 1,893.00 today. Gold quotes are extremely sensitive to changes in the monetary policy of the world's leading central banks, especially the Fed. When it tightens, the quotes of the national currency (under normal conditions) tend to grow, while the price of gold falls. However, as we can see from the long-term charts, its price is not going to fall. Gold does not generate investment income, but is a popular defensive asset, especially in the face of rising inflation. And if the Fed fails to contain rising inflation, it will make it more difficult for the Fed to keep the balance between economic growth and the monetary tightening cycle, and this, in turn, could hurt the dollar. According to analysts of the gold market, the dynamics of its prices will depend on "whether investors' fears about inflation will intensify and whether interest rates will rise faster than expected." But as we can see from rising gold prices, the conventional scale is tilting in favor of buyers of this precious metal, which also receives support from the ongoing tensions between Russia and Ukraine. Technical analysis and trading recommendations At the time of writing, the XAU/USD pair is trading near 1,885.00, remaining in a long-term bull market and moving within an ascending channel on the weekly chart. Its upper limit is close to 1,916.00 (local highs in 2021). This mark will be a reference in case of further growth of XAU/USD and after the breakdown of today's local resistance level of 1,893.00.
Data coming from the U.S. point to accelerating inflation, which puts pressure on the Fed to tighten monetary policy as aggressively as possible. And the closer the March meeting of the U.S. Federal Reserve, the stronger the volatility in the quotes of the dollar and gold will grow. In the meantime, long positions look preferable in the XAU/USD pair.
In an alternative scenario, XAU/USD will return to the key long-term and psychologically important support level of 1,800.00. The first signal for the implementation of this scenario will be a breakdown of the local support level of 1,877.00, and a breakdown of the support levels of 1,853.00 and 1,845.00 (200 EMA on the 1-hour chart) will confirm this scenario.
In case of further decline, XAU/USD will head towards the bottom of the range (between 1,752.00 and 1,877.00) and further towards the bottom of the wider range passing through 1,682.00 (38.2% Fibonacci retracement of the upward wave since December 2015 and marks 1,050.00). A break of the support levels of 1,640.00 (200 EMA on the weekly chart), 1,560.00 (50% Fibonacci level) will increase the risks of breaking the long-term bullish trend of XAU/USD. Support levels: 1877.00 1853.00 1845.00 1832.00 1822.00 1805.00 1800.00 1785.00 1752.00 1725.00 1700.00 1682.00 1640.00 1560.0 Resistance levels: 1893.00, 1900.00, 1916.00, 1963.00, 1976.00, 2000.00, 2010.00 Trading recommendations Sell Stop 1866.00. Stop-Loss 1894.00. Take-Profit 1853.00, 1845.00, 1832.00, 1822.00, 1805.00, 1800.00, 1785.00, 1752.00, 1725.00, 1700.00, 1682.00, 1640.00, 1560.00 Buy Stop 1894.00. Stop-Loss 1866.00. Take-Profit 1900.00, 1916.00, 1963.00, 1976.00, 2000.00, 2010.00 The material has been provided by InstaForex Company - www.instaforex.com |
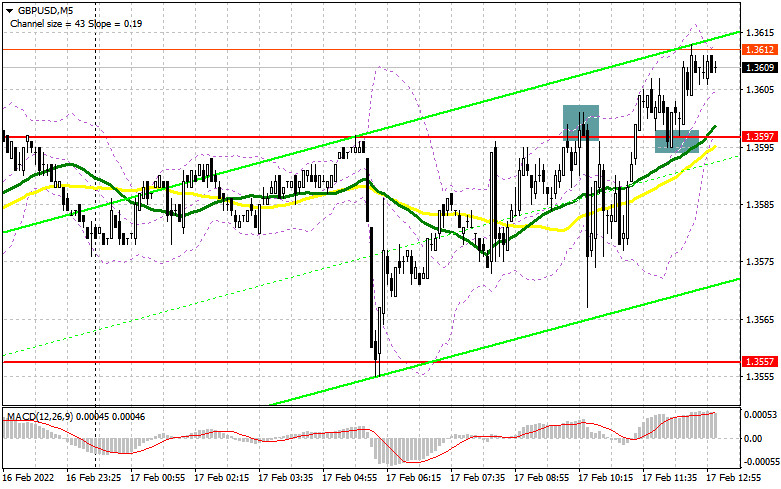
| Posted: 17 Feb 2022 04:04 AM PST What is needed to open long positions on GBP/USD In my morning article, I turned your attention to 1.3597 and recommended taking decisions on the market entry with this level in focus. Now let's take a look at the 5-minute chart and try to figure out what has actually happened. GBP recovered in the first half of the day following a decline to 1.3597 in the Asian trade. Later on, there was a false breakout. So, we had a nice entry point for short positions. Nevertheless, the currency pair did not make a notable decline. GBP fell 20-25 pips, rebounded, and made the second test of 1.3597. This price action enabled the instrument to climb higher and consolidate there. Then, the price had a test downwards that created a good entry point with long positions this time. By the time of writing this article, GBP/USD had risen nearly 20 pips, heading for new resistance at 1.3621. As you understand, the technical picture changed in the second half of the day.
The economic calendar contains serious fundamental data that is due in the American session. The data could influence GBP/USD, discouraging GBP buyers. Yesterday, the bears made unsuccessful efforts to regain control over the market after strong data from the US. Today the situation may repeat itself. US initial unemployment claims are expected to contract sharply last week. If GBP avoids selling pressure, it would be better to stick to the trading plan for going long on GBP/USD. While the currency pair is trading above 1.3580, there is a high chance of further growth. The major task for the bulls in the second half of the day is to defend support at 1.3580 to ensure a further uptrend. Besides, the bulls have to break new resistance of 1.3561 which is to be tested soon. The reasonable trading plan would be long positions in case GBP/USD makes a downward correction in the second half of the day. The correction may be triggered by the Philadelphia Fed manufacturing index and a report on US building permits. However, traders will give priority to a speech by FOMC member James Bullard. A false breakout at 1.3580, where there are moving averages, will contribute to a good market entry point for going long. A breakout and test of 1.3621 which is the buyers' target today will create an extra signal for opening long positions with the target of 1.3656. 1.3694 is seen as a higher target where I recommend profit taking. Alternatively, GBP/USD could lower in the American session and the bulls could be sluggish at 1.3580. This may happen because traders might be worried by remarks from the Fed's policymakers. In this case, it would be better to exercise caution about buying risky assets. I would recommend waiting until the next major level of 1.3543 is tested. If there is a false breakout there, we would have a market entry point for going long. We will be able to buy GBP immediately at a drop off 1.3504, the last hope of the buyers, or lower from 1.3465, bearing in mind a 20-25 pips intraday correction. What is needed to open short positions on GBP/USD For the time being, the bears are reluctant to enter the market in light of their failed attempt to defend 1.3597. Now the prior task for the bears is to protect new resistance at 1.3621. If they allow GBP to climb higher, they will lose all their achievements of the last week. The price may form a false breakout at 1.3621 amid strong US data. This will create an excellent market entry point for going short. The bear market may resume if the currency pair falls to support at 1.3580 closing the European session. This is the level where moving averages are passing, playing in favor of the bulls. So, the bears will find it difficult to push the price below this level. A breakout and test of 1.3580 upwards will give an extra market entry point to open short positions with downward target at 1.3543 and 1.3504. If the lower level is tested, the bulls will lose all their achievements this week. A deeper target is seen at 1.3465 where I recommend profit taking. In case GBP/USD grows in the American session and the sellers lack activity at 1.3621, it would be better to cancel selling until the price climbs again to a one-month high at 1.3656. I would recommend opening short positions there on conditions of a false breakout. We could sell GBP/USD immediately at a bounce off 1.3694, bearing in mind a 20-25 pips intraday correction.
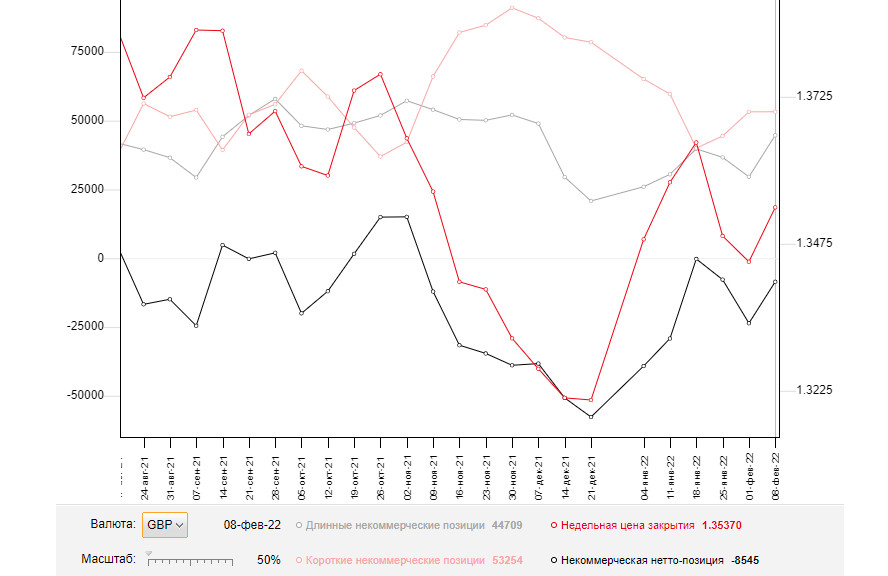
The COT (Commitment of Traders) report from February 8 logs a sharp increase both in short and long positions. Long positions prevail that contracted the negative delta's value. Nevertheless, the negative value remained last week. It means that the market is still in the grips of the sellers. Importantly, this COT report takes into account policy decisions of the Bank of England, including a rate hike. Despite this fact, GBP didn't find any help. Everybody is aware that the Bank of England ventured into monetary tightening in an effort to fight against soaring inflation. The British economic is going through rough times nowadays. The economic growth might stall anytime soon. That's why raising interest rates didn't fuel a rally in GBP. Geopolitical tensions between Russia and Ukraine and the Federal Reserve's hawkish rhetoric that implies the first rate hike in March dampen global risk sentiment. So, the bulls are cautious about buying GBP/USD. Some market participants expect the US central bank to raise the funds rate by 0.5% at a time, not by 0.25%. If so, such aggressive tightening will set the stage for a rapid advance of the US dollar. According to the COT report from February 8, long non-commercial positions rose sharply from 29,597 to 44,709 whereas short non-commercial positions grew moderately from 53,202 to 53,254. This contracted abruptly the negative non-commercial net positions from -23,605 to -8,545. GBP/USD closed last week higher at 1.3537 from 1.3444.
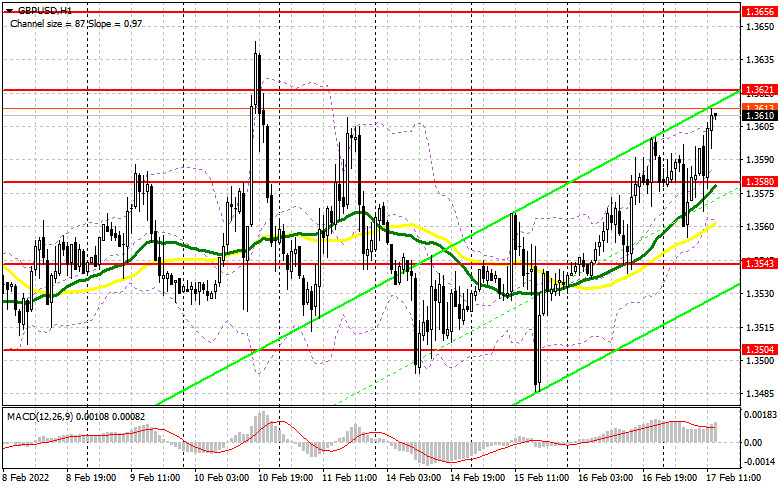
Indicators' signals: Trading is carried out above the 30 and 50 daily moving averages. It indicates that the bulls are determined to push GBP/USD higher. Moving averages Note: The period and prices of moving averages are considered by the author on the H1 hourly chart and differs from the general definition of the classic daily moving averages on the daily D1 chart. Bollinger Bands If GBP/USD declines, the indicator's lower border of 1.3565 will serve as support. Alternatively, if the currency pair grows, the upper border at 1.3605 will act as resistance. Description of indicators
|
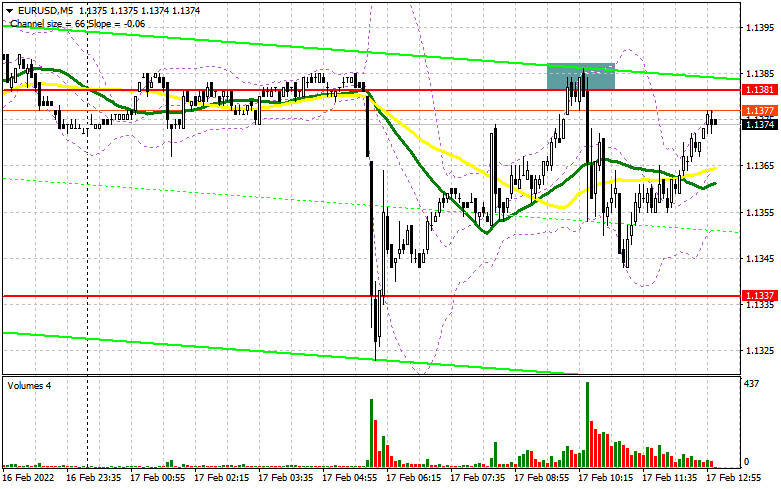
| Outlook for EUR/USD on February 17. EUR recoups losses to climb to 1.1381 Posted: 17 Feb 2022 04:01 AM PST Conditions to open long positions on EUR/USD: In the forecast I provided early today, I attracted your attention to the level of 1.1381. Let us take a look at the 5-minute chart and analyze the market situation. A jump in the euro after a massive sell-off during the Asian trade allowed buyers to regain control and touch the resistance level of 1.3181. The formation of a false breakout provided strong sell signals. As a result, the pair lost about 40 pips. From the technical point of view, the market situation will remain the same in the second part of the day.
During the US trade, we will see more significant fundamental factors that may influence the euro/dollar pair. Firstly, it is the US labor market report. A slump in the number of first-time claims may boost the US dollar since the employment rate is likely to fall. That is why a false breakout after a downward correction to the support level of 1.1332 remains the best condition to open buy orders on the euro. To continue the bullish trend, the pair should jump above the resistance level of 1.1381, which capped the euro's rise in the first part of the day. If the pair breaks the mentioned level and the US discloses weak data on labor market and Philly Fed manufacturing index, traders will receive a new buy signal. This may allow the pair to climb to 1.1414 and then to 1.1452, where it is recommended to lock in profits. If the pair continues falling during the US trade and fails to fix at 1.1332, bulls may face serious problems when forming a new upward channel. That is why it is better to avoid buying the euro until it hits 1.1283 and you see a false breakout. It is possible to buy the euro from 1.1235, expecting an upward correction of 20-25 pips. Conditions to open sell positions on EUR/USD: Sellers managed to keep control over the market, not allowing the euro/dollar pair to climb above 1.1381. However, they failed to push the pair to 1.1332. The fact is that demand for the euro surged. To keep control, bears should protect the resistance level of 1.1381. The formation of a false breakout of the mentioned level as well as strong data on the US labor market and hawkish comments made by FOMC member James Bullard may give a signal to open short positions with the target at 1.1332. Notably, the level is acting as intermediate support. If the pair upwardly breaks this level, traders may receive an additional signal to open short positions with the targets at such lows as 1.1283 and 1.1235. The level of 1.1200 may act as a farther target. There, it is recommended to lock in profits. However, such a tumble could be possible only in case of very strong data on the US labor market. If the euro rises and bears fail to protect 1.1381, it is better to avoid selling the asset. Short orders could be opened after the formation of a false breakout near 1.1414. Traders may open positions from 1.1452 or 1.1491, expecting a downward correction of 15-20 pips.
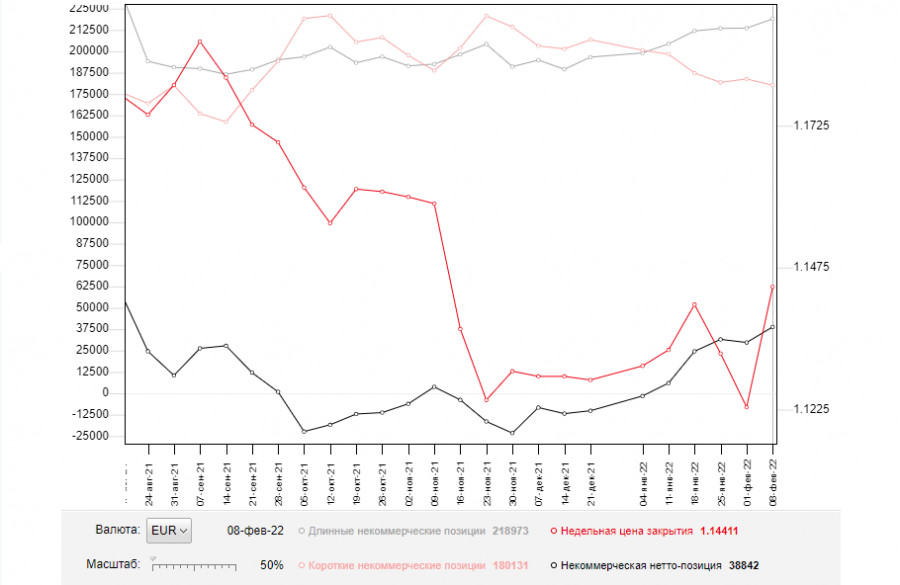
Commitment of Traders Report The COT report from February 8 unveiled a rise in the number of long positions and a drop in the short ones. The report also takes into account the ECB's meeting where Christine Lagarde made it clear that the regulator would take aggressive measures if inflation continued rising. Last week, ECB members took the wait-and-see approach. Meanwhile, technical changes in the bullish market led to a decline in the euro/dollar pair. Demand for risk assets also decreased amid tensions between Russia and Ukraine. However, the depreciation was mainly caused by the Fed's actions concerning the key interest rate. On Monday, February 14, the Federal Reserve held an emergency meeting, the results of which are still in secret. This, in turn, fuels concerns over high inflationary pressure. Some analysts suppose that the regulator may choose a more aggressive approach and hike the benchmark rate by 0.5% in March instead of raising it by 0.25% as planned earlier.It is a bullish signal for the US dollar. The COT report reads that long non-commercial positions increased to 218,973 from 213,563, whereas the number of short non-commercial positions slid to 180,131 from 183,847. Such changes reflect the fact that traders continue opening long positions amid every decline in the euro. Thus, during the week, the total non-commercial net position inched up to 38,842 against 29,716. The weekly closing price jumped to 1.1441 against 1.1229 a week earlier.
Signals of indicators: Moving Averages Trading is conducted just below the 30- and 50-day moving averages, which indicates that the market remains under the control of sellers. Note: The period and prices of moving averages are considered by the author on the one-hour chart that differs from the general definition of the classic daily moving averages on the daily chart. Bollinger Bands If the euro/dollar pair declines, the lower limit of the indicator located at 1.1345 will act as support. If the pair gains in value, the upper limit of the indicator located at 1.1390 will act as resistance. Description of indicators
|
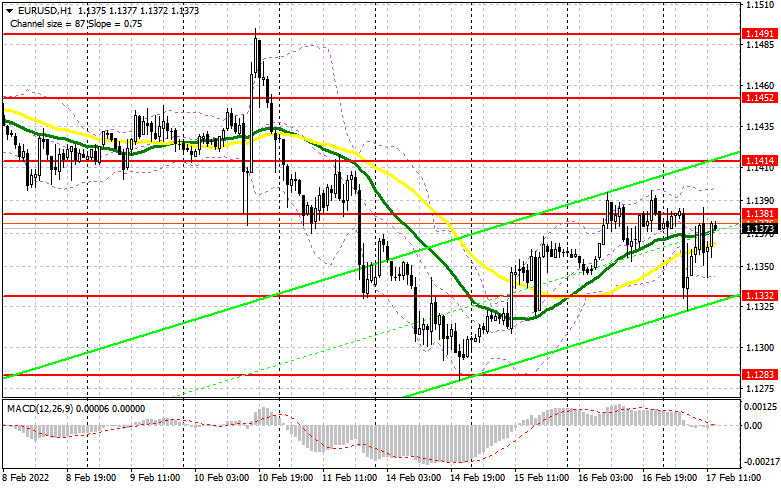
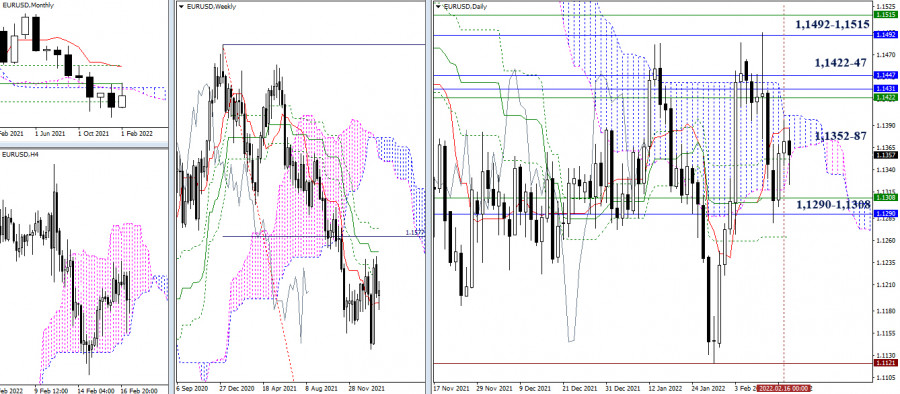
| Technical analysis recommendations for EUR/USD and GBP/USD on February 17 Posted: 17 Feb 2022 02:47 AM PST EUR/USD
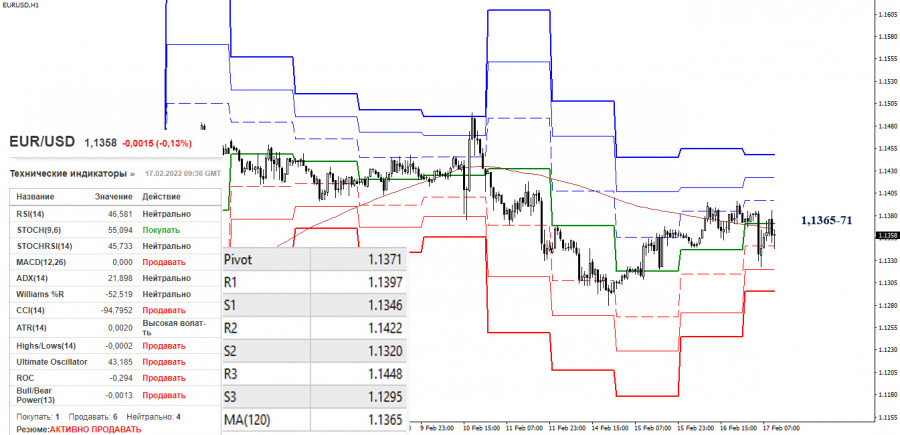
On Tuesday, the euro rebounded at the support around 1.1290 - 1.1308. However, after testing the daily levels above 1.1352-87, which exerted pressure on it, the euro slowed down. Consequently, the rebound halted. The next key targets remain the support at 1.1290 - 1.1308 (weekly short term trend + monthly Fibo Kijun) and resistance at 1.1422-47 (monthly cloud + weekly Fibo Kijun) and 1.1492 - 1.1515 (weekly and monthly medium term trends).
In the smaller time frames, the key level (weekly long-term trend) has been determining for the last two days. Today, it is located at 1.1365. A consolidation above the key level and a reversal of the moving average will change the current balance of forces and will strengthen the position of the bulls. Today, the bullish target within the day is the resistance of classic pivot levels 1.1397 - 1.1422 - 1.1448. Consolidation of key levels favorable to the bears and coming decline will provide a chance for the pair to resume a bearish scenario. Today, it is possible to indicate the support of classical pivot levels at 1.1346 - 1.1320 - 1.1295. *** GBP/USD
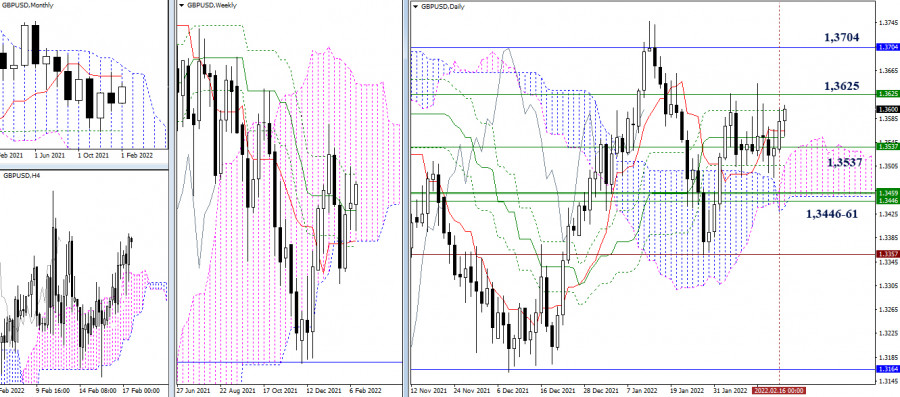
The pair has been within a consolidation range since last week. The daily levels (1.3553-65-99) and weekly medium-term trend (1.3537) are favorable to the pair. In case the pair breaks the consolidation range, the key levels to strengthen the bulls will be 1.3625 (a final level of the weekly dead cross) and 1.3704 (a monthly short-term trend), while several weekly levels 1.3446-61 on the low boundary of the daily cloud (1.3454) are important for the bears.
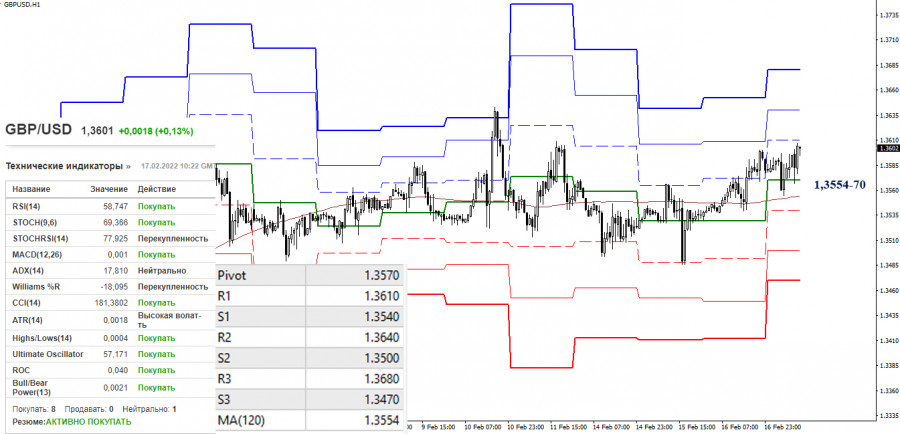
The situation has changed again in the smaller time frames. The bulls managed to reach the key levels. Today, they are located near 1.3554-70 (central pivot level + weekly long-term trend). Therefore, currently the bulls have the advantage. The resistance of the classic pivot levels 1.3610 - 1.3640 - 1.3680 is considered their reference points within the day. A loss of 1.3554-70 and reversal of the moving average will again change the current balance of forces. However, only the players' activity will indicate how effective the changes will be as the pair is now within a consolidation range of the higher time frames. The support of the classic pivot levels is set at 1.3540 - 1.3500 - 1.3470. *** In the technical analysis of the situation, the following instruments are used: higher time frames - Ichimoku Kinko Hyo (9.26.52) + Fibo Kijun levels H1 - Pivot Points (classic) + Moving Average 120 (weekly long-term trend) The material has been provided by InstaForex Company - www.instaforex.com |
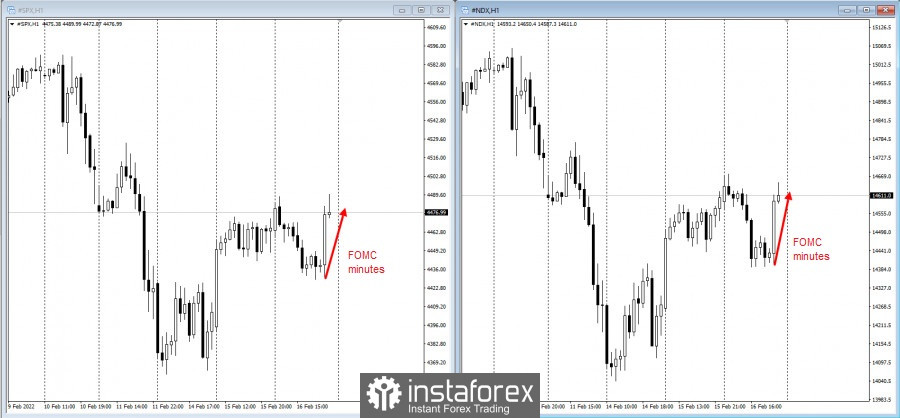
| Stocks fell ahead of January FOMC minutes Posted: 17 Feb 2022 02:36 AM PST
US stocks fell on Wednesday, before the release of the January FOMC minutes. Apparently, traders are worried over the geopolitical tensions in Ukraine and the persistently rising inflation, which could force the Fed to take more aggressive actions towards monetary policy. Tech companies were the ones that suffered the most, with Meta Platforms dipping as much as 3%. Dollar also declined.
Investors are already estimating the size of the Fed's rate hike in March and plan to cut the balance sheet to a record $8.9 trillion. "If we raise rates really aggressively, we run the risk of slamming the brakes on the economy, putting the economy into recession, which would then -- we'd be crashing back down into this low inflation environment," said Minneapolis Fed President Neel Kashkari. Markets are already buckling under pressure from high inflation and rising rates, but now it is facing another problem - the risk of the biggest European security crisis in decades. Negotiations are also underway in Ukraine, with US President Joe Biden leading talks with German Chancellor Olaf Scholz ahead of an emergency European leaders' summit on Thursday. Fortunately, despite seeing the worst performance of the S&P 500 since 2009, investors still poured $152 billion into the market, said JPMorgan. But strategist Nikolaos Panigirtzoglou warns that the upcoming rate hike by the Fed will undoubtedly spur volatility in the market, as it did in 2018. Other key events for this week are: - meeting of G-20 finance ministers and central bankers from Thursday to February 18; - speech of Cleveland Fed President Loretta Mester and St. Louis Fed President James Bullard on Thursday, - US monetary policy forum on Friday. The material has been provided by InstaForex Company - www.instaforex.com |
| Daily Video Analysis: XAUUSD, H4 Gold Buying Opportunity Posted: 17 Feb 2022 02:27 AM PST Today we take a look at XAUUSD. Combining advanced technical analysis methods such as Fibonacci confluence, correlation, market structure, oscillators and demand/supply zones, we identify high probability trading setups. The material has been provided by InstaForex Company - www.instaforex.com |
| Bank of Canada will fight inflation hard Posted: 17 Feb 2022 02:09 AM PST
The Canadian dollar strengthened against its US counterpart on Wednesday, as domestic data showed a further increase in January inflation.
Canada's annual inflation rate surged by 5.1% to a 30-year high. This was the 10th consecutive month when growth was above the Bank of Canada's benchmark range of 1-3%. It also shows that food and housing prices continued to rise. In turn, oil, which is one of Canada's main exports, has recouped part of the decline. However, analysts doubt that this data will be enough for the Central Bank to raise the interest rate by 50 basis points instead of 25 at the monetary policy meeting on March 2. Bank of Canada's Deputy Governor, Timothy Lane, said in a university speech that inflation is likely to be more stable than predicted, and the Central Bank is increasingly focusing on countering these risks. According to the Central Bank last month, the recession in the Canadian economy had been overcome, and interest rates should rise from their current low of 0.25%. In addition, Governor Tiff Macklem said that Canadians should expect multiple rate increases. The material has been provided by InstaForex Company - www.instaforex.com |
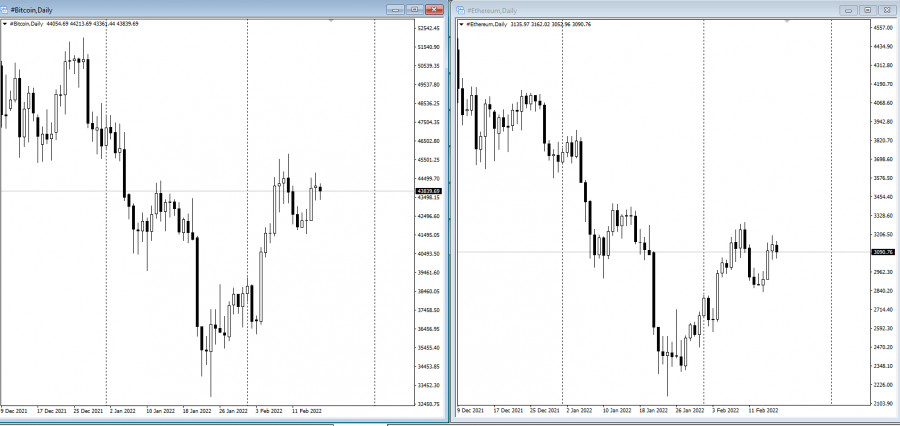
| Recent crypto rally lags behind those posted by the stock market Posted: 17 Feb 2022 02:04 AM PST
Investors who are looking for clues as to whether Bitcoin's downturn is drawing to a close may be disappointed to see that recent rebounds lag behind those posted by the stock market. According to data presented by Bitooda, BTC rarely sits within a close range of its all-time highs, while in comparison, major US stock indices seldom drop below a 10% correction from record highs. In fact, since 2014, the S&P 500 and the Nasdaq 100 have only experienced two short bear markets, including one at the start of the pandemic. The second is earlier this year.
During that same period, Bitcoin experienced a long decline before hitting new highs. It is currently in its fourth major decline. Sam Doctor, head of research at Bitooda said the cryptocurrency hit record highs 124 times since 2014, while the S&P 500 and Nasdaq 100 hit new highs of 483 and 482 times, respectively. Bitcoin's most recent peak of nearly $69,000 in November was achieved in an easy-money environment, with regulators cutting interest rates as the coronavirus pandemic threatened financial stability. Now that the Federal Reserve is signaling a rate hike to curb inflation, the token could have a more difficult path upwards, digging itself out of the route. "It will require more patience. I don't see the same type of circumstances where money is just going to flood in the way we saw before," said Steve Sosnick, chief strategist at Interactive Brokers. Bitcoin is down less than 1% to $43,650 as of 09:30 pm GMT. The material has been provided by InstaForex Company - www.instaforex.com |
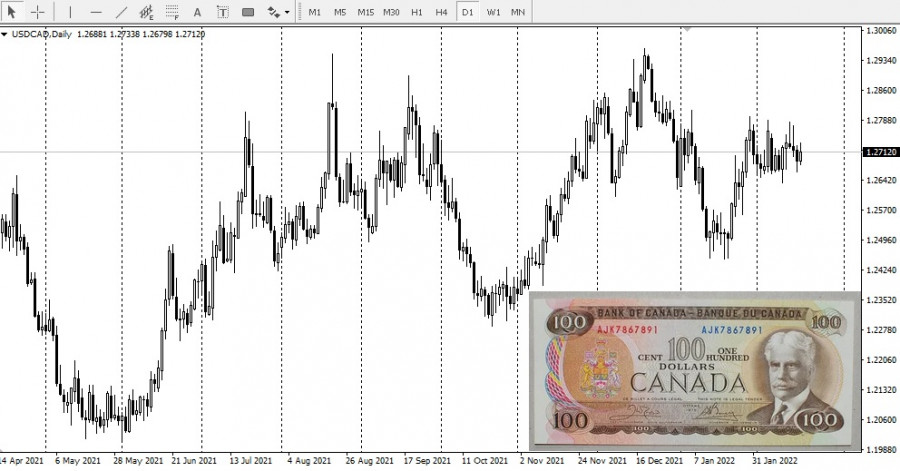
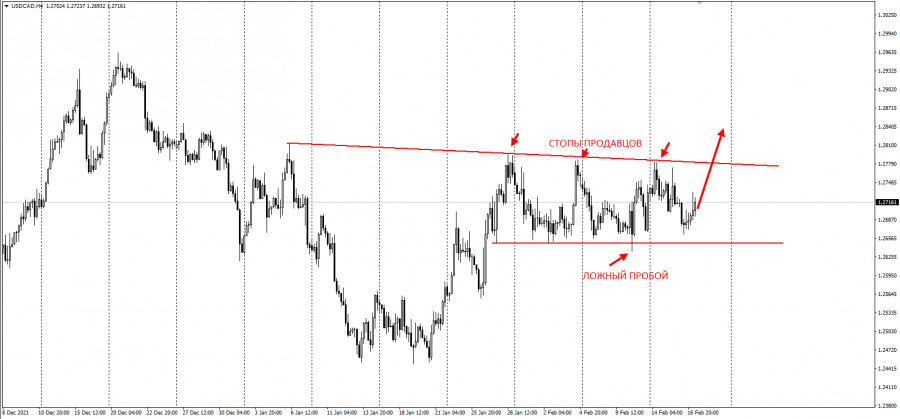
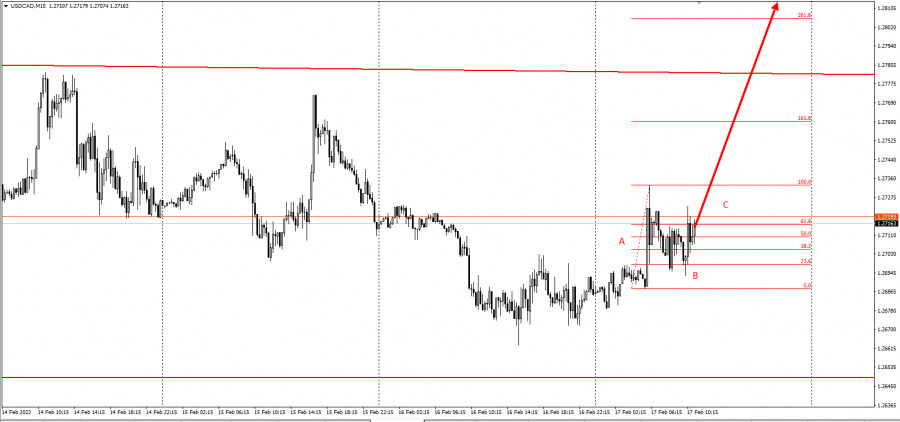
| Trading plan for USD/CAD on February 17, 2022 Posted: 17 Feb 2022 01:52 AM PST
Hello, dear traders! Here is my trading plan for USD/CAD. After a steep drop in oil prices in the American session, the positions of the Canadian dollar were somewhat shaken. After a false breakout on February 10, the instrument remained bullish. The pair has a great chance of rising to the level where stop orders of bears are set. See the chart below:
Thus, we have a tree-wave structure - ABC. In this case, Wave A indicates bullish activity during the Asian session today. Long position could be considered after a bounce from the 50% Fibonacci level of 1.27100, as seen on the chart above. A Stop Loss and a Take Profit should be placed at 1.26876 and 1.28000 respectively. I use strategies such as Stop Hunting and Price Action when drawing up my trading plan. Have a nice trading week! Always remember to control your risks! The material has been provided by InstaForex Company - www.instaforex.com |
| Forex forecast 02/17/2022 USD/CHF, AUD/USD, USD/JPY and Bitcoin from Sebastian Seliga Posted: 17 Feb 2022 01:06 AM PST Let's take a look at the technical picture of USD/CHF, AUD/USD, USD/JPY and Bitcoin. The material has been provided by InstaForex Company - www.instaforex.com |
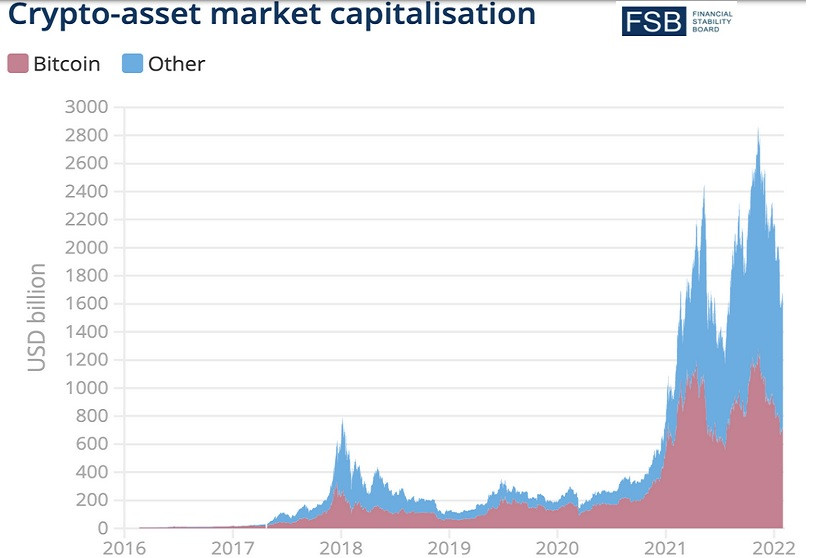
| Immediate growth of cryptocurrency threatens financial stability Posted: 17 Feb 2022 12:46 AM PST
The Financial Stability Board (FSB), an international organization that monitors risks to G20 economies, said that the booming cryptocurrency market could soon pose a serious threat to financial stability. According to the FSB report published on Wednesday, the rapidly developing cryptocurrency markets may become a threat soon to financial stability due to their scale and growing interconnection with the traditional financial system. If the pace of rapid implementation continues at the current level, regulators around the world should be prepared for all types of risks and have ready-made responses at hand. The report also states that the capitalization of the cryptocurrency market increased by 3.5 times last year, namely to $2.6 trillion.
If the current scale-up situation persists, it could have implications for financial stability. Some of the issues that the FSB pointed out included the growing interconnection between cryptocurrencies and the regulated financial system, liquidity mismatches, the growing use of leverage in investment strategies, the risk of concentration of trading platforms, and lack of regulation. The FSB also noted a gap in public understanding of the crypto space compared to levels of participation. The risks associated with the popularity of stablecoins were also highlighted, including regulatory compliance and reserve asset adequacy. Since stablecoins are mainly used as a bridge between crypto-assets and traditional fiat currencies, this affects the stability and functioning of crypto-asset markets. The ecosystem of assets (including in DeFi) may become limited. This can disrupt trading and also cause stress in these markets. The report concluded that the FSB will continue to monitor events and new risks in the crypto space, as well as explore the potential of regulation. The Financial Stability Board was established in 2009 after the G20 summit in London. It is an international organization responsible for monitoring and providing recommendations regarding the global financial system. The material has been provided by InstaForex Company - www.instaforex.com |
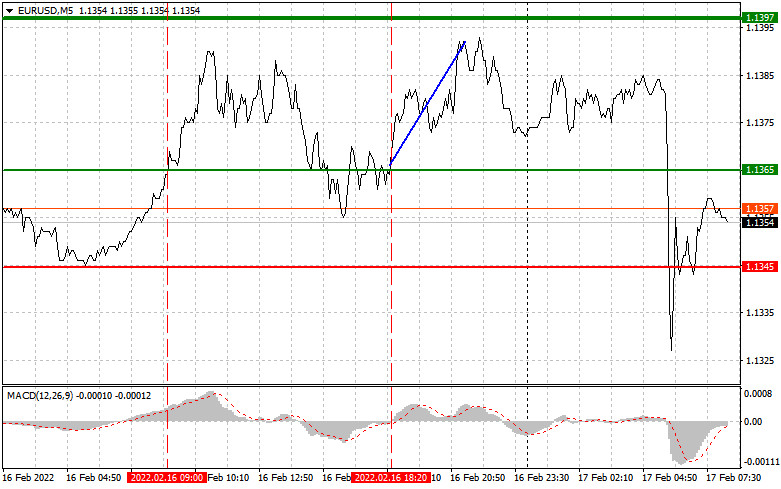
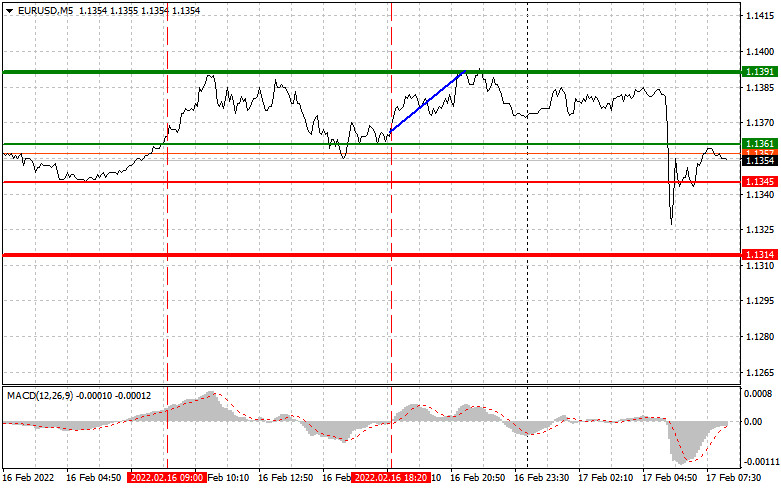
| Analysis and trading tips for EUR/USD on February 17 Posted: 17 Feb 2022 12:31 AM PST Analysis of transactions in the EUR / USD pair A signal to buy emerged after EUR/USD hit 1.1365. However, the pair did not increase because the MACD line being far from zero limited the upside potential of the pair. Fortunately, the second attempt was successful because it led to a rise of about 30 pips.
Although the report on EU industrial production was much better than expected, traders took short positions in EUR/USD because of more convincing data on the growth of US retail sales and industrial production. The sharp increase, especially in retail sales, was another confirmation of rising inflationary pressures in the country, which will force the Fed to act more aggressively towards monetary policy. Going back to the EU, several speeches are scheduled for today, but the most important ones are Isabelle Schnabel and Philip Lane's. Economic bulletin from the ECB is also significant, while the report on the foreign trade balance of Italy is not that pivotal. In the afternoon, the US will release data on jobless claims, manufacturing activity and issued building permits, but more interesting is the speech of FOMC member James Bullard, who is known for his aggressive approach to interest rates. For long positions: Buy euro when the quote reaches 1.1361 (green line on the chart) and take profit at the price of 1.1391 (thicker green line on the chart). A rally will occur if data from the eurozone and reports from the ECB exceed expectations. But before buying, make sure that the MACD line is above zero or is starting to rise from it before taking long positions. It is also possible to buy at 1.1345, but the MACD line should be in the oversold area as only by that will the market reverse to 1.1361 and 1.1391. For short positions: Sell euro when the quote reaches 1.1345 (red line on the chart) and take profit at the price of 1.1314. Pressure will return if data from the eurozone turns out weaker than expected and if economic reports in the US exceed expectations. But before selling, make sure that the MACD line is below zero, or is starting to move down from it. Euro can also be sold at 1.1361, however, the MACD line should be in the overbought area, as only by that will the market reverse to 1.1345 and 1.1314.
What's on the chart: The thin green line is the key level at which you can place long positions in the EUR/USD pair. The thick green line is the target price, since the quote is unlikely to move above this level. The thin red line is the level at which you can place short positions in the EUR/USD pair. The thick red line is the target price, since the quote is unlikely to move below this level. MACD line - when entering the market, it is important to be guided by the overbought and oversold zones. Important: Novice traders need to be very careful when making decisions about entering the market. Before the release of important reports, it is best to stay out of the market to avoid being caught in sharp fluctuations in the rate. If you decide to trade during the release of news, then always place stop orders to minimize losses. Without placing stop orders, you can very quickly lose your entire deposit, especially if you do not use money management and trade large volumes. And remember that for successful trading, you need to have a clear trading plan. Spontaneous trading decisions based on the current market situation is an inherently losing strategy for an intraday trader. The material has been provided by InstaForex Company - www.instaforex.com |
| Three main factors for USD growth: geopolitics, risk appetite, and macro statistics Posted: 17 Feb 2022 12:25 AM PST
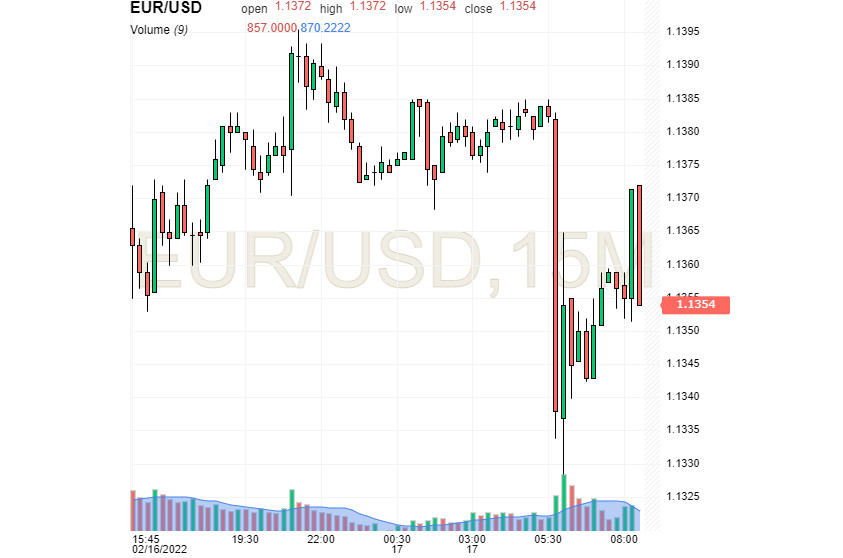
The US dollar's steady growth, observed from time to time, is due to the interaction of three main factors – a decrease in risk appetite, inspiring US macro statistics, and the easing of geopolitical conflict. At the moment, the key "pillar" supporting the US dollar is American statistics. Today, the US currency found it difficult to choose a direction, as markets assessed several factors affecting it. Its growth was facilitated by positive macroeconomic statistics from the US, which turned out to be better than forecasts. In particular, US retail sales soared 3.8% m/m in January 2022 against an expected rise of 2.1%. At the same time, the volume of industrial production in the country increased by 1.4%, while a growth rate of 0.4% was forecasted. Both indicators indicate favorable conditions for further tightening of the Fed's monetary policy. The decline in risk appetite is also another factor stimulating the growth of the US dollar. In such a situation, investors go to protective assets, primarily gold and the US dollar. However, risk appetite has returned amid certainty over the Fed's new minutes, which is less hawkish than expected. This situation provoked the USD's temporary decline. At the same time, retail sales and the strengthening of the US labor market can improve global risk appetite. Moreover, some weakening of the US dollar was facilitated by geopolitical tensions, namely, the alleged ceased of the military conflict around Ukraine. This provoked significant price dynamics for key trading instruments. As a result, the US currency turned to the downside. It was followed by gold and oil. On Thursday morning, the EUR/USD pair was near the level of 1.1354. It is worth noting that the euro rose to the level of 1.1363 against the US dollar yesterday and managed to consolidate at this level a little later.
The growing inflation continues to put pressure on the US dollar. The current situation requires the Fed to take decisive action – to raise rates as soon as possible. The regulator cannot afford dovish rhetoric, otherwise, it will provoke serious economic shifts. ECB also made "hawkish" statements, which allows the key rate to be raised by the end of the year. The US dollar is supported by the growth of retail sales in the country. The strong indicator neutralizes concerns about a possible recession in the American economy. Earlier, investors were worried that the upcoming Fed rate hike would negatively affect the US economy. It should be noted that the high probability of a recession poses a threat to further USD growth. However, experts believe that there are now no reasons to implement an unfavorable scenario. The material has been provided by InstaForex Company - www.instaforex.com |
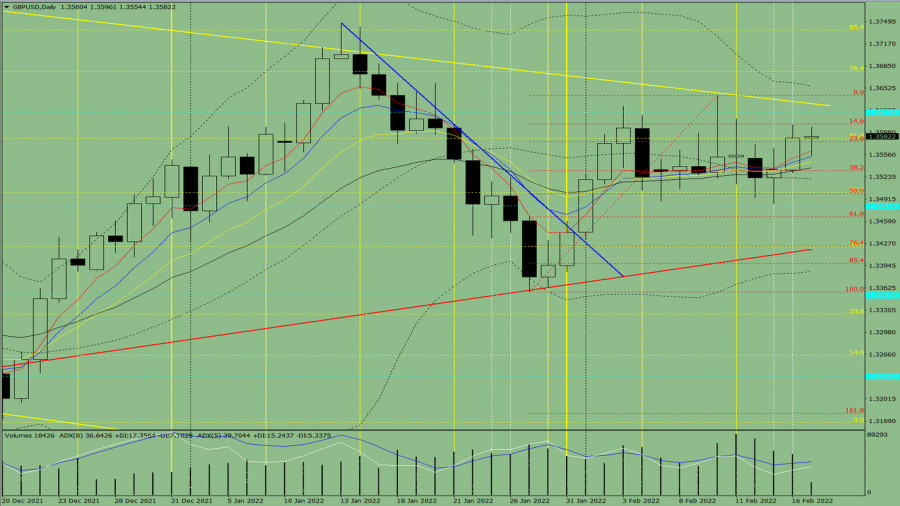
| Indicator analysis of GBP/USD for February 17, 2022 Posted: 17 Feb 2022 12:21 AM PST Trend analysis (Fig. 1). The market may move down on Thursday from the level of 1.3580 (close of yesterday's daily candle) to test the level of 1.3554, the 8-day EMA (thin blue line). Upon reaching this level, the price may start to move up to the target level of 1.3629, the resistance line (thick yellow line).
Fig. 1 (daily chart) Comprehensive analysis: - Indicator analysis - down; - Fibonacci levels - down; - Volumes - down; - Candlestick analysis - down; - Trend analysis - up; - Bollinger bands - up; - Weekly chart - up. General conclusion: The price may move down from the level of 1.3580 (close of yesterday's daily candle) to test the level of 1.3554, the 8-day EMA (thin blue line). Upon reaching this level, the price may start to move up to the target level of 1.3629, the resistance line (thick yellow line). Alternative scenario: from the level of 1.3580 (close of yesterday's daily candle), the price may roll back down to test 1.3533, the 38.2% retracement level (red dotted line). Upon reaching this level, the price may start to move up to the target level of 1.3629, the resistance line (thick yellow line). The material has been provided by InstaForex Company - www.instaforex.com |
| Geopolitics and inflation push gold up Posted: 17 Feb 2022 12:19 AM PST
There are still two factors that have driven the recent rise in gold prices.Inflation continues to rise. Reports show that inflation is spiraling. Geopolitical tensions are persisting. During the US session, the US announced that Russia was continuing its troop buildup near Ukraine's borders.A modest tailwind was provided by the weakness of the US dollar. The USD index has declined by 0.19% and is trading at 96.85:
The US dollar weakened due to the publication of the minutes of the last FOMC meeting, which showed little change from the last statement and press conference. The minutes did not reflect hawkish rhetoric but were perceived as dovish. However, inflationary pressures are spiraling. The PPI (Producer Price Index) report released by the Bureau of Labor Statistics showed that wholesale prices rose by 1% by January, bringing the year-over-year increase to 9.7%. One cannot underestimate the importance of this report because rising costs for corporations that produce goods and services will at some point affect retail prices, which may rise soon. Last week on Thursday, February 10, the US government released the Consumer Price Index (CPI) for January 2022. The report indicates that the current annual inflation rate rose to 7.5%. This inflation rate marks the largest one-month increase since February 1982. The consumer price index and core CPI exceeded economists' expectations. The next PCE (the preferred inflation index used by the Federal Reserve) report will be released on February 25. However, the December numbers, which were released on January 28, also indicate a huge increase in inflationary pressures. The PCE price index reflects changes in the prices of goods and services purchased by consumers in the United States, but excludes prices for energy and food. Meanwhile, the inflation rate relative to the PCE for December 2021 is currently fixed at 5.8%. Geopolitical environment: Yesterday, it became possible that the crisis could be de-escalated relying on Vladimir Putin's statements that Russia was pulling back its troops from the Ukrainian border. However, the belief that the geopolitical turmoil would abate proved short-lived. According to the New York Times, Secretary of State Antony Blinken and the head of NATO said they saw no signs of a withdrawal. Both NATO and the United States said that they had no concrete evidence that Russia had withdrawn their forces. The US and NATO statements contradicted those of the Russian Defense Ministry, which announced further withdrawals and published a video showing a train of armored vehicles heading to mainland Russia from Crimea. The fundamental events that pushed gold to its current eight-month high seem to be clearly driven by both the news and the bullish market sentiment toward gold as a safe haven asset. The price of gold has rallied based on fundamental data. While gold fell in price on Tuesday, yesterday's rise recouped that decline, and gold may test $1,880 again by the end of the week.
|
| Trading plan for starters of EUR/USD and GBP/USD on February 17, 2022 Posted: 17 Feb 2022 12:10 AM PST Here are the details of the economic calendar for February 16:Britain's inflation data reflected the growth of consumer prices from 5.4% to 5.5%, which is likely to become an argument for another increase in the refinancing rate by the Bank of England. This news has become an impulse for the pound's growth. As for the EU, their industrial production was published, where a decline of 1.4% was replaced by an increase of 1.6%. It is worth noting that production was expected to decline, thus the divergence of expectations played into the hands of the European currency. This was followed by the US retail sales data during the American trading session, the growth rate of which slowed down from 16.71% to 12.96%. The situation was slightly softened by the industrial production data, which instead of slowing down, reflected their growth from 3.80% to 4.08%. Analysis of trading charts from February 16: The EUR/USD pair in the pullback stage returned the quote to the previously broken level of 1.1400. This step led to a regrouping of trading forces after a rapid decline last week. As a result, the 1.1400 level acts as resistance, which positively affects the volume of short positions. Despite local bursts of activity, the GBP/USD pair has been moving within the side channel of 1.3500/1.3600 for the second week in a row. The long-term price movement in a closed amplitude indicates the process of accumulation of trading forces, which will eventually lead to a natural acceleration in the market. It is worth noting that a sideways movement of the Doji type on the daily chart signals a high degree of uncertainty among market participants. Thus, a burst of activity at the end of the flat is guaranteed in the market.
February 17 economic calendar: The weekly data on applications for the US unemployment benefits will be released today, which is expected to decline. This is a positive factor for the US labor market. Statistics details: The volume of initial applications for benefits may fall from 223 thousand to 219 thousand. The volume of repeated applications for benefits may fall from 1,621 thousand to 1,605 thousand. Time targeting Applications for US unemployment benefits – 13:30 Universal time Trading plan for EUR/USD on Feb 17: Based on the price behavior within the control level of 1.1400, it can be assumed that the downward interest is still relevant in the market. The rebound from resistance returned the quote below the level of 1.1350, which leaves a chance for a full recovery from the recent pullback. The main signal about the prolongation of the downward cycle will appear if the price is kept below the level of 1.1260. Traders will consider an alternative market development scenario if the price holds above the level of 1.1400 in a four-hour period. Trading plan for GBP/USD on Feb 17: The quote approached the upper border of the side channel once again. This led to a reduction in the volume of long positions and, as a result, to a slowdown in the upward movement from the beginning of the week. In this situation, traders are still considering the trading tactics of breaking through one or another control level of the relative flat. In this regard, buy positions will be valid after holding the price above 1.3630 in a four-hour period, and sell positions would be valid after holding the price below 1.3480 in a four-hour period.
What is reflected in the trading charts? A candlestick chart view is graphical rectangles of white and black light, with sticks on top and bottom. When analyzing each candle in detail, you will see its characteristics of a relative period: the opening price, closing price, and maximum and minimum prices. Horizontal levels are price coordinates, relative to which a stop or a price reversal may occur. These levels are called support and resistance in the market. Circles and rectangles are highlighted examples where the price of the story unfolded. This color selection indicates horizontal lines that may put pressure on the quote in the future. The up/down arrows are the reference points of the possible price direction in the future. The material has been provided by InstaForex Company - www.instaforex.com |
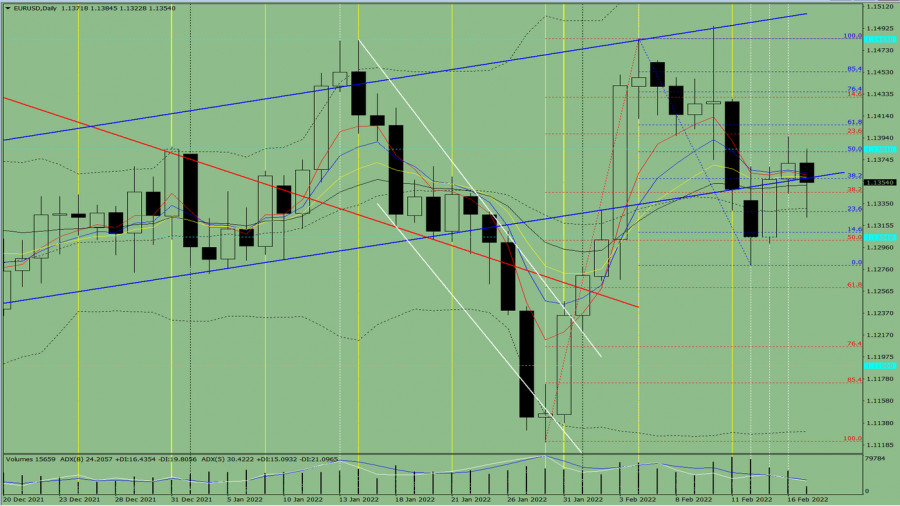
| Indicator analysis of EUR/USD for February 17, 2022 Posted: 16 Feb 2022 11:58 PM PST Trend analysis (Fig. 1). The market may move down on Thursday from the level of 1.1371 (close of yesterday's daily candle) to test 1.1331, the 21-day simple moving average (black dotted line). Upon reaching this level, the price may move upwards to the target level of 1.1406, the 61.8% retracement level (blue dotted line).
Fig. 1 (daily chart) Comprehensive analysis: - Indicator analysis - down; - Fibonacci levels - down; - Volumes - down; - Candlestick analysis - down; - Trend analysis - up; - Bollinger bands - up; - Weekly chart - up. General conclusion: The market may move down from the level of 1.1371 (close of yesterday's daily candle) to test 1.1331, the 21-day simple moving average (black dotted line). Upon reaching this level, the price may move upwards to the target level of 1.1406, the 61.8% retracement level (blue dotted line). Alternative scenario: from the level of 1.1371 (close of yesterday's daily candle), the price may start to move down to test 1.1331, the 21-day simple moving average (black dotted line). Upon reaching this level, the price may continue to move downward to the target level of 1.1305, the historical support level (blue dotted line). When testing this level, the price may start to move up to the target level of 1.1395, the upper fractal (daily candle from 16/02/2022). The material has been provided by InstaForex Company - www.instaforex.com |


| You are subscribed to email updates from Forex analysis review. To stop receiving these emails, you may unsubscribe now. | Email delivery powered by Google |
| Google, 1600 Amphitheatre Parkway, Mountain View, CA 94043, United States | |


Comments