Forex analysis review
Forex analysis review |
- April 1, 2022 : EUR/USD daily technical review and trading opportunities.
- April 1, 2022 : EUR/USD Intraday technical analysis and trading plan.
- April 1, 2022 : GBP/USD Intraday technical analysis and significant key-levels.
- Bitcoin falls. Crypto experts believe BTC to boom in April
- Trading Signal for Nasdaq-100 (#NDX) for April 01-04, 2021: sell below 15,081 points (21 SMA - 4/8 Murray)
- OPEC+ to use Rystand and Wood Mackenzie data instead of IEA
- Trading Signal for BITCOIN (BTC/USD) for April 01-04, 2021: sell in case of pullback at $46,782 (21 SMA - 7/8 Murray)
- GBP/USD Trading Plan on 1st April
- EUR/USD forecast on 1st April
- Investors ignore US non-farm payrolls
- Trading Signal for EUR/USD for April 01-04, 2021: buy if breaks 1.1060 (21 SMA - 200 EMA)
- European stocks decline
- DAX back tests break down level.
- Weekly Bitcoin analysis for April 1st.
- The Dollar index trading range.
- BTC update for April 01,.2022 - Potential for furthher drop
- Ichimoku cloud indicator analysis on Gold for April 1, 2022.
- Intraday analysis for EURUSD
- Analysis of Gold for April 01,.2022 - Potential for bigger drop
- EUR/USD analysis for April 01, 2022 - Potential for downside continuation
- Trading tips for USD/JPY
- Video market update for April 01,,2022
- Tips for beginner traders in EUR/USD and GBP/USD for April 1, 2022
- GBP/USD: trading plan for American session on April 1. GBP trading with low volatility neglecting manufacturing PMI
- EUR/USD: trading plan for the US session on April 1 (morning trades analysis). Euro slightly drops against US dollar ahead
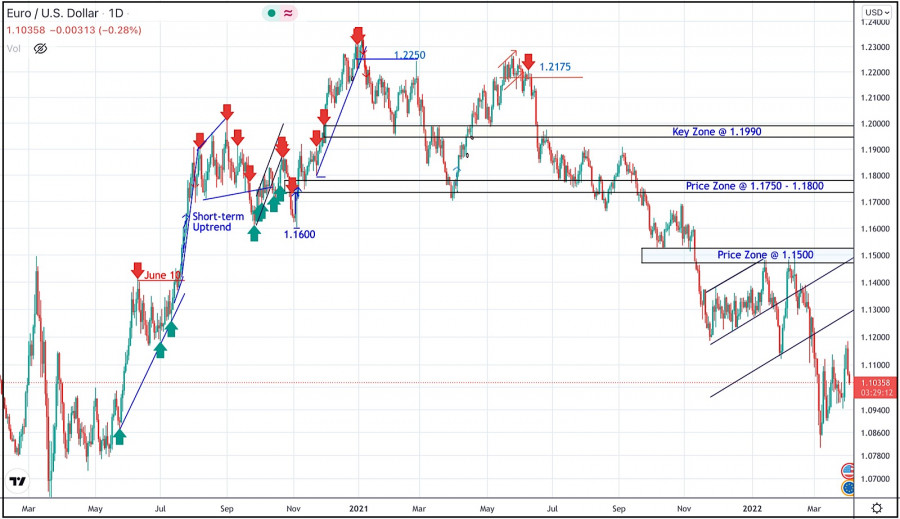
| April 1, 2022 : EUR/USD daily technical review and trading opportunities. Posted: 01 Apr 2022 10:35 AM PDT
During the past few weeks, the EURUSD pair has been trapped within a consolidation range between the price levels of 1.1700 and 1.1900. In late September, Re-closure below the price level of 1.1700 has initiated another downside movement towards 1.1540. Price levels around 1.1700 managed to hold prices for a short period of time before another price decline towards 1.1200. Since then, the EURUSD has been moving-up within the depicted movement channel until bearish breakout occurred by the end of last week's consolidations. Few weeks ago, the price zone of 1.1350 failed to offer sufficient bearish rejection that's why it was bypassed until 1.1500 which applied significant bearish pressure on the pair. A possible SELL Entry was offered upon the previous ascending movement towards 1.1500 which provided significant bearish pressure. Shortly after, the EURUSD looked oversold while approaching the price levels of 1.0850. That's where the current upside movement was initiated. Any movement towards 1.1200 should be considered for another SELL trade as long as sufficient SELLING pressure is demonstrated. The material has been provided by InstaForex Company - www.instaforex.com |
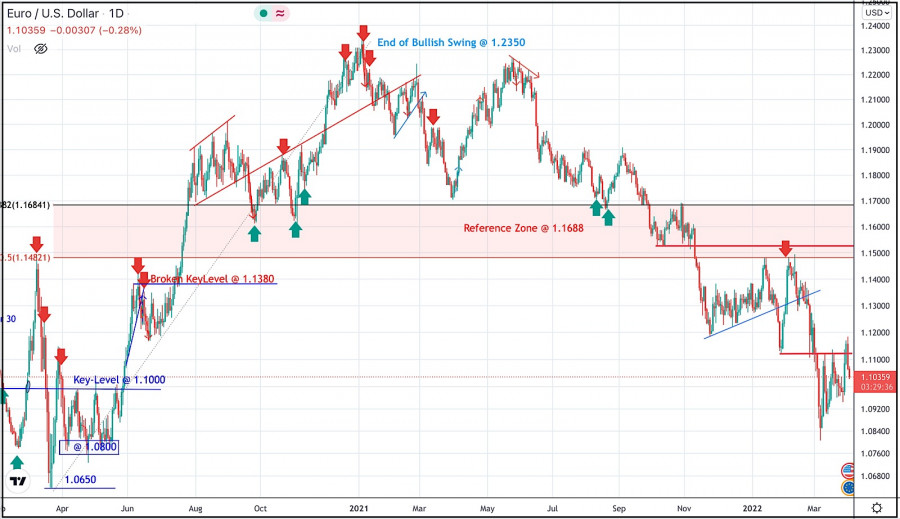
| April 1, 2022 : EUR/USD Intraday technical analysis and trading plan. Posted: 01 Apr 2022 10:35 AM PDT
Recent bullish pullback towards 1.1650-1.1680 (upper limit of the previous consolidation range) was expected to offer bearish rejection and a valid SELL Entry. Significant bearish decline brought the EURUSD pair again towards 1.1550 levels which failed to provide sufficient BUYERS for too long period. Hence, only a short- term sideway movement was demonstrated around 1.1550 before quick bearish decline could occur towards 1.1200. On the other hand, the price levels around 1.1520 stood as a reference zone that applied significant bearish pressure upon two successive bullish visits. Recent Bearish decline below 1.1100 was considered as a bearish continuation sign. That's why, downside movement was expected to proceed towards 1.1000 then 1.0920 where the current bullish pullback was initiated. The current price levels around 1.1150 should be watched upon the current bullish move for bearish rejection and a possible SELL Entry. However, failure to do so will probably enable more bullish advancement towards 1.1320. The material has been provided by InstaForex Company - www.instaforex.com |
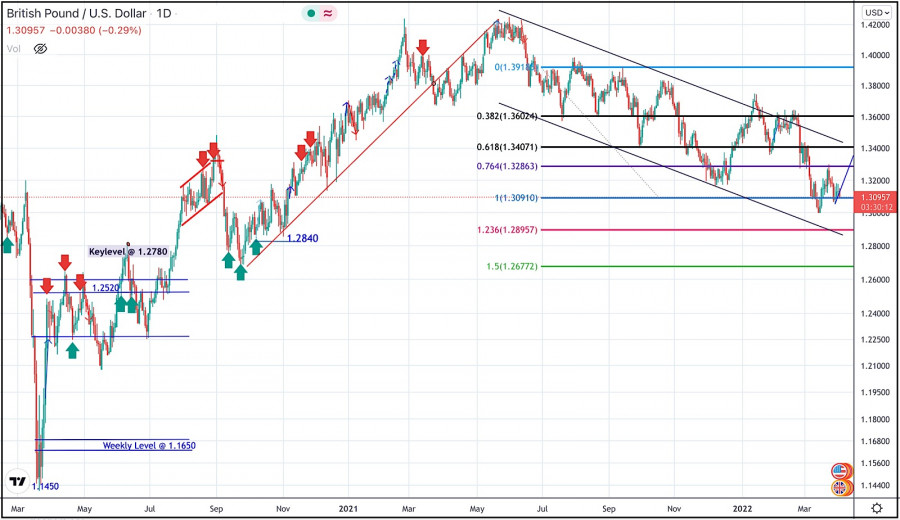
| April 1, 2022 : GBP/USD Intraday technical analysis and significant key-levels. Posted: 01 Apr 2022 10:34 AM PDT
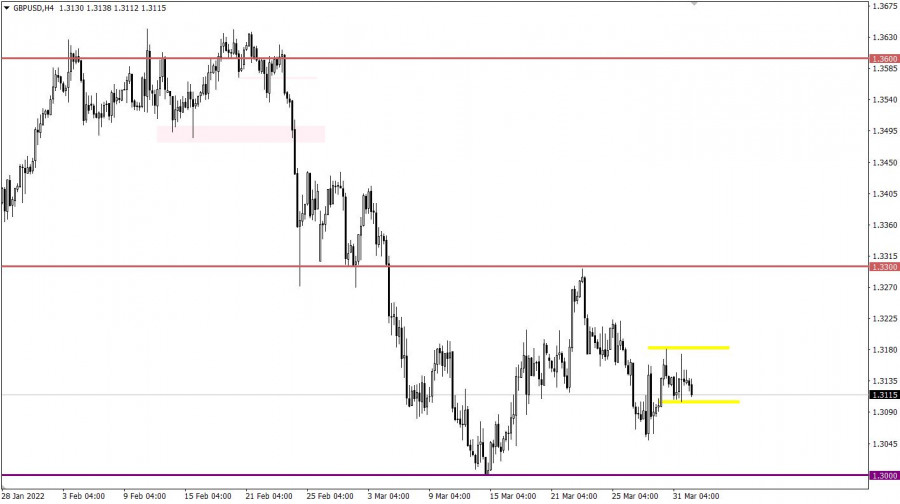
The GBPUSD pair has been moving within the depicted bearish channel since July. Recently, BUYERS were watching the price levels of 1.3730 to have some profits off their trades as it stood as a key-resistance which offered significant bearish rejection recently. The short-term outlook turned bearish when the market went below 1.3600. This enhanced the bearish side of the market towards 1.3400 which brought the pair back towards 1.3600 for another re-test. Hence, the recent bullish pullback towards 1.3600 should have been considered for SELL trades as it corresponded to the upper limit of the ongoing bearish channel. It's already running in profits. Bearish persistence below 1.3090 was needed to enable further downside continuation towards 1.2900 (the lower limit of the movement channel). However, Evident bullish rejection was manifested around 1.3000, please note that bullish breakout above 1.3280 will probably enable quick bullish advancement towards 1.3400 and probably 1.3600. Otherwise, another bearish breakout below 1.3090 will probably enable more bearish extension at least towards 1.2890. The material has been provided by InstaForex Company - www.instaforex.com |
| Bitcoin falls. Crypto experts believe BTC to boom in April Posted: 01 Apr 2022 10:06 AM PDT On Friday morning, the main cryptocurrency declined significantly by almost 5% and dropped to the $44,700 mark. According to Binance, at the time of writing, the BTC has lost 4.82% and is trading at $44,732. According to CoinMarketCap, a website that tracks prices of crypto assets, digital gold fell by 5.33% in a day, falling to $44,590. The top 10 leading altcoins by market capitalization followed bitcoin's trend and started to decline rapidly. Consequently, in the last 24 hours the Ethereum token fell by 3.1%, XRP lost 4.9% and Avalanche dropped by 0.6%. On the contrary, Solana rose by 3%.
According to CoinGecko, the world's largest aggregator of digital asset data, the total capitalization of the crypto market fell by 2.7% to $2.19 trillion over the past 24 hours. At the same time, the Bitcoin Dominance Index fell by 0.1% to 39.7% on Thursday, while the BTC Fear and Greed Index dropped by 3 points to 52 points. On Friday, the latter index sagged another 2 points to 50 points. Digital gold lost 1.5% in the first quarter of 2022. At the same time, March was a favorable period for the asset. Consequently, BTC grew by 10% and strengthened for the second month in a row. A strong bullish trend of the cryptocurrency began on March 14 with BTC trading at nearly $37,000. Moreover, on March 28 the coin reached the level of $48,160, a high of 2022. However, the digital asset then encountered a technical obstacle and a period of correction started. Therefore, bitcoin pulled back below the key support level of $45,000 in some days. If BTC continues to decline, it risks finding another potential support at $42,000 in the near future. Notably, bitcoin lost more than 16% in January. However, it rose by 12% during February. In November 2021, BTC renewed its all-time high, soaring above $69,000. The cryptocurrency has declined steadily and has fallen by more than 40% since that time. By the end of 2021, bitcoin increased by 1.6 times to $46,200 from $28,900. As the digital coin market is unstable, experts make the most unexpected predictions about its future. Many analysts agree that in the near future the leading central banks and many private players will start gradually to change reserves from dollars and euros and will turn to their diversification. It is likely that cryptocurrencies, particularly bitcoin will make up for some part of these updated reserves. Notably, according to crypto experts' preliminary forecasts for bitcoin, April is traditionally considered the best period for digital gold. Therefore, over the past 11 years, the coin grew eight times and fell only three times this month. The material has been provided by InstaForex Company - www.instaforex.com |
| Posted: 01 Apr 2022 09:20 AM PDT
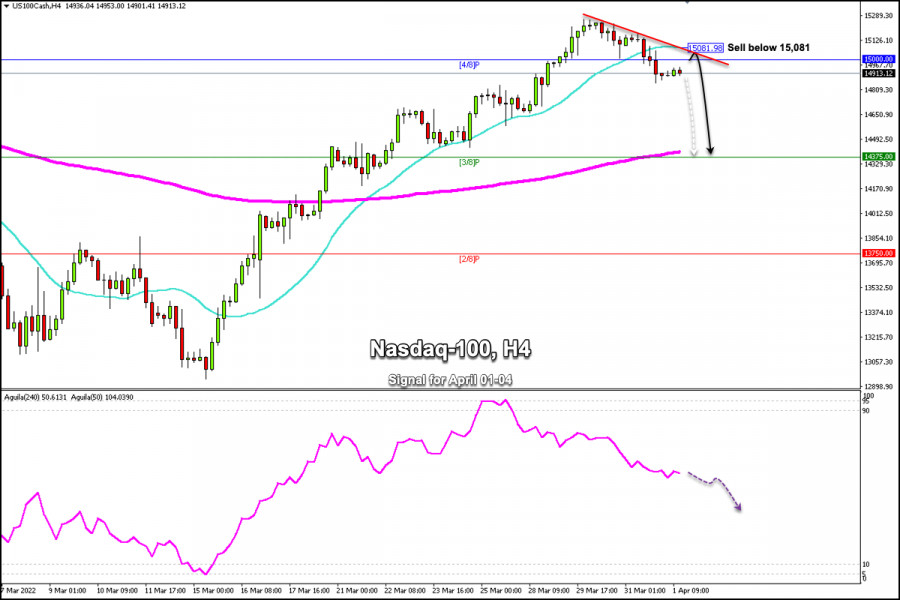
Nasdaq-100 Tech Index (#NDX) is trading below the 21 SMA located at 15,081 and below the 4/8 Murray located at the psychological level of 15,000. Since mid-March, the NDX began a strong upward movement that reached the maximum of 15,257. At the beginning of April, the technology index is making a technical correction as part of taking profit for the end of the month and the weekend. According to the 4-hour chart, a negative signal is observed for the Nasdaq-100, which is showing signs of exhaustion and could continue its downward trend. In the next few hours, we expect the downward movement to continue and can reach the 200 EMA located at 14,390 and at 3/8 Murray around 14,375. The US jobs report showed non-farm payrolls rose by 431,000 in March, below the 490,000 expected by market consensus. US employment data does not change the negative market sentiment, and risk aversion could weigh on the Nasdaq-100 due to skepticism about talks between Ukraine and Russia. Our trading plan for the next few hours is to sell below 4/8 Murray located at the level of 15,000 or to sell at current price levels, with targets in the area 14,375. The eagle indicator is showing a negative signal which supports our bearish strategy. The material has been provided by InstaForex Company - www.instaforex.com |
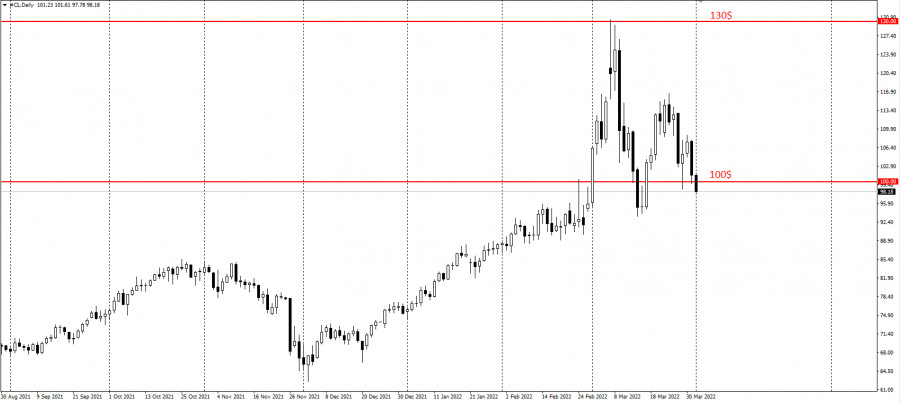
| OPEC+ to use Rystand and Wood Mackenzie data instead of IEA Posted: 01 Apr 2022 09:08 AM PDT
The Technical Committee of OPEC+ group has dropped the International Energy Agency as a secondary source of member oil production data in favor of Norwegian consultancy Rystad and Wood Mackenzie. The decision to switch from the IEA to Rystad and Wood Mackenzie was made after a thorough analysis. Production data from secondary sources is now essential for OPEC and OPEC+ to monitor all member countries for compliance with the requirements of the production control agreement. In addition to secondary sources, OPEC also publishes monthly primary source production data every month with figures from member countries themselves. The report noted that some members of OPEC+ had expressed criticism of the IEA data recently. As for the International Energy Agency, it seems that it's not only data that bothers the oil producer group. Based on recent media reports, some members of OPEC+ are unhappy with the IEA's attitude to oil supply control. Moreover, the UAE's energy minister has recently directly slammed the organization for pushing for more oil. This week the news came that the US would again release up to 1 million barrels of oil per day from its strategic reserves to make up for the shortfall. Oil continues to decline due to this news. As of this morning, it was trading below $100 a barrel:
Saudi energy minister Abdulaziz bin Salman criticized the IEA last year. Moreover, this move eventually proved right as the IEA asked OPEC+ to increase oil investment just months after announcing that all new investments in oil and gas should end in 2021. Bloomberg noted that the exchange of critical remarks between the two organizations had been going on for months, suggesting that removal of the IEA as a secondary source of production data was the next step. The material has been provided by InstaForex Company - www.instaforex.com |
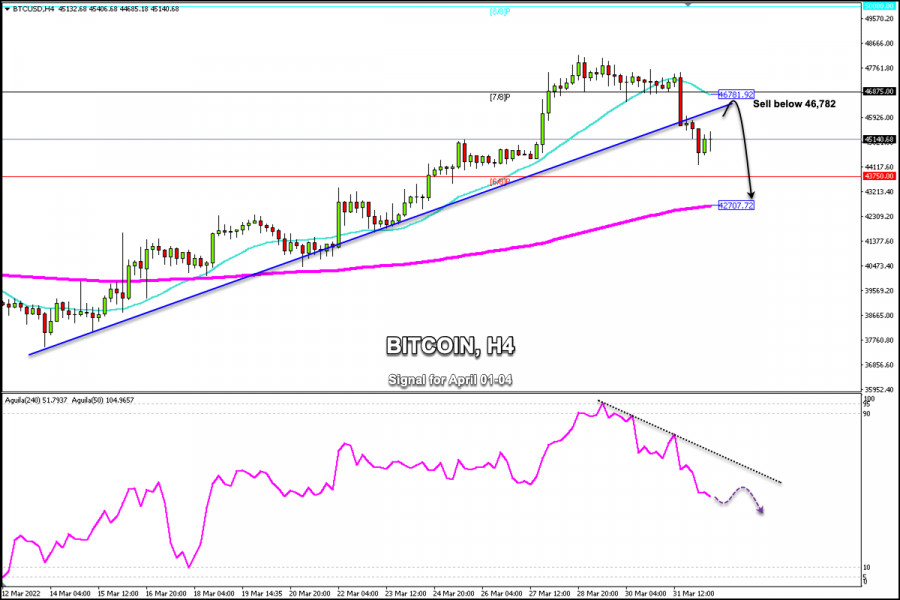
| Posted: 01 Apr 2022 08:34 AM PDT
Since March 14, the Cryptocurrency market had a strong upward movement. The big driver was the comments that there is an agreement on the table between Ukraine and Russia. This stimulated risk appetite and BTC climbed to $48,200 from the level of $37,500. BTC gains are estimated at more than 30% in 15 days. The price of Bitcoin, Ethereum and other cryptocurrencies are still feasting on the positive news around Ukraine which has seen solid gains across all risk assets. However, Bitcoin pulled back from the high of $48,200 to $44,188 in the European session today. It is currently trading at $45,140. According to the 4-hour chart, we can see that BTC has broken the uptrend channel that sustained since March 14. A pullback towards the resistance zone of $46,781 is expected in the next few hours. This is the level coinsiding with 21 SMA and 7/8 Murray which represents a key area of technical reversal. BTC is likely to resume its downward movement below this level and could reach the 200 EMA located at $42,707. Fear, uncertainty and risk aversion could weaken the strength of Bitcoin. If the news from Ukraine is negative, we could expect a BTC drop towards the psychological level of $40,000 and it could reach the support zone of $37,500. As long as Bitcoin consolidates and trades below $48,500, it will remain under strong bearish pressure and the price could reach $42,000. A breakout and daily close below $42,707 (200 EMA) could be the sign of a trend reversal. Bitcoin could resume its overall bearish move and reach the zone of 37,000 and even $35,000. The material has been provided by InstaForex Company - www.instaforex.com |
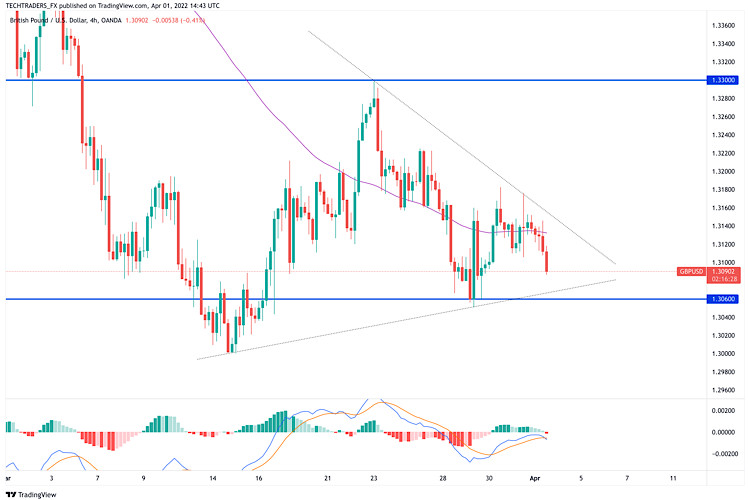
| GBP/USD Trading Plan on 1st April Posted: 01 Apr 2022 07:49 AM PDT
GBP/USD came under renewed bearish pressure and edged lower toward 1.3100 in the early American session. The US Dollar Index stays in positive territory after the data showed a stronger-expected increase in wage inflation in March. The Relative Strength Index (RSI) indicator on the four-hour chart is edging lower below 50 and GBP/USD stays below the 100-period and the 50-period SMA, pointing to a bearish shift in the near-term technical outlook 1.3100 (psychological level, Fibonacci 23.6% retracement of the latest downtrend) aligns as key support. With a daily close below that level, additional losses toward 1.3050 (static level) and 1.3000 (psychological level, static level) could be witnessed. On the upside, 1.3135 (100-period SMA) could be seen as interim resistance before 1.3160 (static level, Fibonacci 38.2% retracement, 50-period SMA) and 1.3200 (psychological level, Fibonacci 50% retracement). The material has been provided by InstaForex Company - www.instaforex.com |
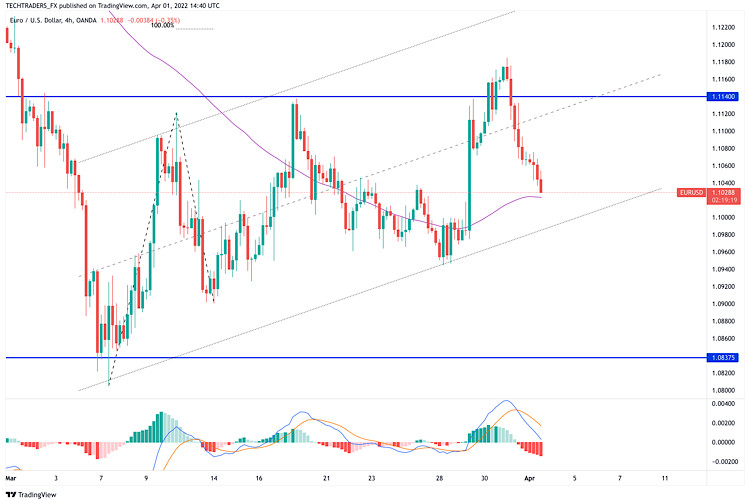
| Posted: 01 Apr 2022 07:48 AM PDT
EUR/USD is trading under modest bearish pressure and remains near the mid-1.1000s on Friday. The data from the US showed the increase in Nonfarm Payrolls was less than expected in March but average hoursly earnings continued to rise. The US Dollar Index holds in positive territory ahead of the weekend. EUR/USD is trading below the 200-period SMA on the four-hour chart after managing to hold above that line mid-week. On the downside, 1.1040 (Fibonacci 50% retracement of the latest downtrend) aligns as the first support before 1.1020 (100-period SMA) and 1.1000 (psychological level, Fibonacci 38.2% retracement). On the flip side, EUR/USD faces immediate resistance at 1.1080 (Fibonacci 61.8% retracement) before 1.1100 (psychological level, 200-period SMA). With a four-hour close above the latter, buyers could show interest in the shared currency and the near-term technical outlook could turn bullish. In that case, the pair could target 1.1160 (static level). The material has been provided by InstaForex Company - www.instaforex.com |
| Investors ignore US non-farm payrolls Posted: 01 Apr 2022 07:45 AM PDT The latest US employment data was mixed, causing no noticable reaction in the currency market. According to latest non-farm payrolls, 431,000 jobs were created in the US economy, well below a forecasted increase of 490,000. However, February's employment data was revised upwards to 750,000. Unemployment decreased to 3.6% from 3.8% in February. Economists expected unemployment to fall to 3.7%. Why did the market not react with volatility after this important data was released? There are two possible reasons. Firstly, even though the final payroll data did not match previous estimates, it still was a signal of strong job creation in the US. Secondly, investors probably awaited the reaction of the US market after the opening of the New York session. Furthermore, market players could be cautious amid ongoing geopolitical tensions between Russia and Western countries due to the war in Ukraine. Market players would now focus on the ISM manufacturing PMI, which was projected to increase to 59.0 points from 58.6 in February. If the index does not fall below the forecasted level, it could boost demand for equities in the US and create a swing low for USD. The material has been provided by InstaForex Company - www.instaforex.com |
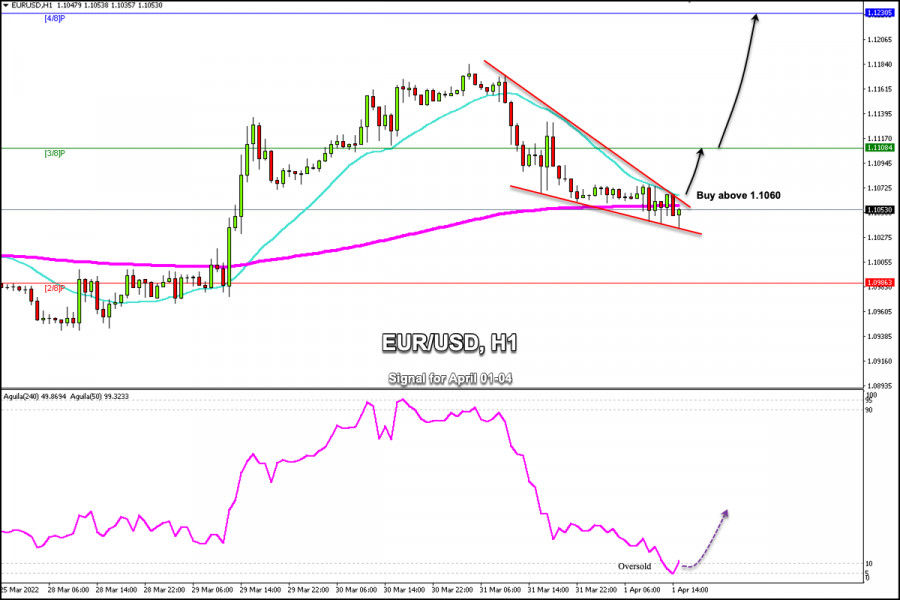
| Trading Signal for EUR/USD for April 01-04, 2021: buy if breaks 1.1060 (21 SMA - 200 EMA) Posted: 01 Apr 2022 07:17 AM PDT
EUR/USD is falling from 1.1184, high of March 31, in anticipation of important economic data from the US. The pair fell to 1.1035 in the European session, currently trading at 1.1053. The lack of news on the political scene along with the lack of progress in the peace talks between Russia and Ukraine has given some extra momentum to the US dollar and gold. EUR/USD is trading within a downtrend channel and above a descending channel which is forming a falling wedge pattern. This pattern could be a signal for a bullish move only if the Euro breaks the 200 EMA and the 21 SMA located at 1.1060. The break of the falling wedge pattern could give the euro a strong move and it could resume its upward movement and could reach 1.1108 on 3/8 Murray and 1.12 30 on 4/8 Murray. According to the 1-hour chart, the eagle indicator has reached the oversold zone, which is a sign that in the next few hours or days the euro could make an upward movement. For this, we must wait for a confirmation above 1.1060. On the contrary, as long as it remains trading below 1.1055, the euro is likely to continue its downward trend and could reach 2/8 Murray located at 1.0986. According to the technical pattern that we can see in the chart above, our trading plan will be to buy above the 21 SMA located at 1.1060, with targets at 1.1108 and 1.1230. The eagle indicator supports our bullish strategy. The material has been provided by InstaForex Company - www.instaforex.com |
| Posted: 01 Apr 2022 06:23 AM PDT
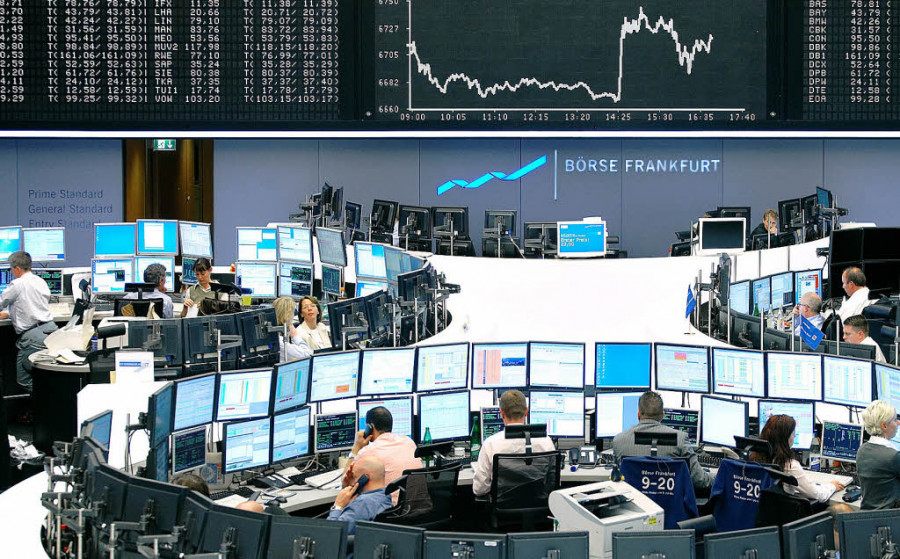
The European stock market declined at the end of yesterday's trading session. All major indices of the region lost about 1% each. Thus, the composite STOXX Europe 600 index fell by 0.94%, the German DAX declined by 1.31%, the UK's FTSE 100 dropped by 0.83%, and the French CAC 40 index lost 1.21%. The Italian FTSE MIB and the Spanish IBEX 35 indices plummeted by 1.1% and 1.23% respectively. Notably, over the first quarter of this year, the FTSE 100 index has added 1.8%, while the German DAX and French CAC 40 have lost 9.2% and 6.9% respectively. The STOXX Europe 600 composite indicator decreased by more than 6% in total. Investors closely watched economic data from the UK. In Q4 2021, the country's GDP growth was 6.6%, according to preliminary data, the growth was estimated at 6.5%. In quarterly terms, GDP growth amounted to 1.3%, which also exceeded the previously announced 1%. The FTSE 100 index strengthened slightly after the data release. There was also a drop in the unemployment rate in February in the euro area states to 6.8% from January's 6.9%. This was not quite in line with the expectations of analysts, who predicted a drop to 6.7%. Germany's unemployment rate last month remained at February's level of 5%. The total number of unemployed people fell by 18,000, though it had been expected to drop to 20,000. Germany recorded a 0.3% rise in retail sales in February compared to January levels. However, according to analysts' forecasts, the growth was estimated at 0.5%. In France, consumer prices rose by 5.1% year-on-year last month, compared to February's level of 4.2%. This exceeded the expectations of analysts, who predicted growth of this indicator only to 4.9%. Consumer spending in the country also increased by 0.8%, though not as rapidly as prices. Experts predicted a more significant growth of this indicator. Hennes & Mauritz AB lost some ground despite reporting a net profit for Q1 2022. The securities fell by 12.9%, as the company's profit did not meet investors' expectations. Air France-KLM has announced that former CEO Benjamin Smith would remain in charge. Meanwhile, the company's stock dropped by 1.5%. According to information about the upcoming major acquisition of Brewin Dolphin Holdings by Royal Bank of Canada for a total amount of £1.6 billion ($2.1 billion), Brewin Dolphin Holdings' securities instantly increased by 61%. The material has been provided by InstaForex Company - www.instaforex.com |
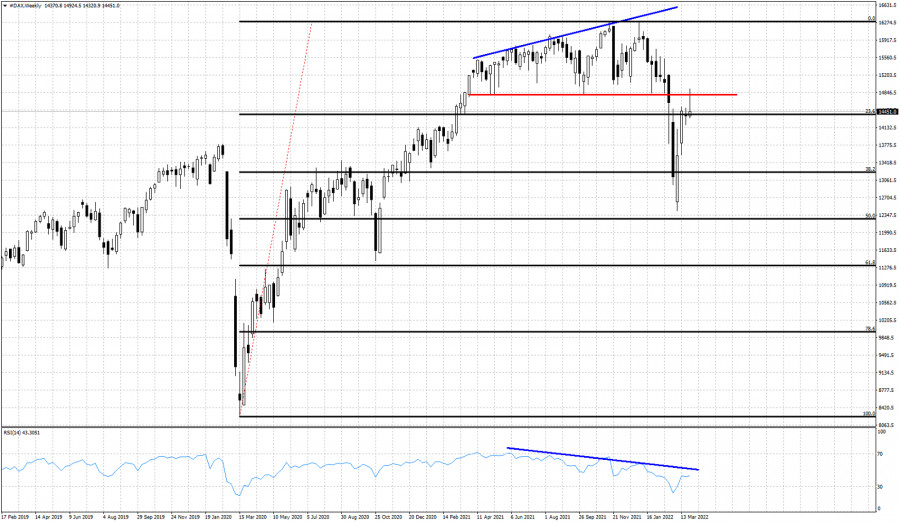
| DAX back tests break down level. Posted: 01 Apr 2022 06:16 AM PDT Dax has managed to reach above 14,800 this week but bulls were not strong enough to hold price above 14,800. The weekly candlestick pattern has a long upper tail, implying more weakness to expected. Dax has so far retraced all the way to the 61.8% level of the entire decline from 16,285 to 12,430. Price has reached and back tested the key resistance level of 14,800 which was once support.
Red line - support (broken) The bearish RSI divergence combined with the break of the horizontal support at 14,800 gave us the bearish signal. Price now bounced from the 50% Fibonacci area and got rejected at the previous support, now resistance. A turn lower is expected. Traders need to be cautious and not too optimistic. The material has been provided by InstaForex Company - www.instaforex.com |
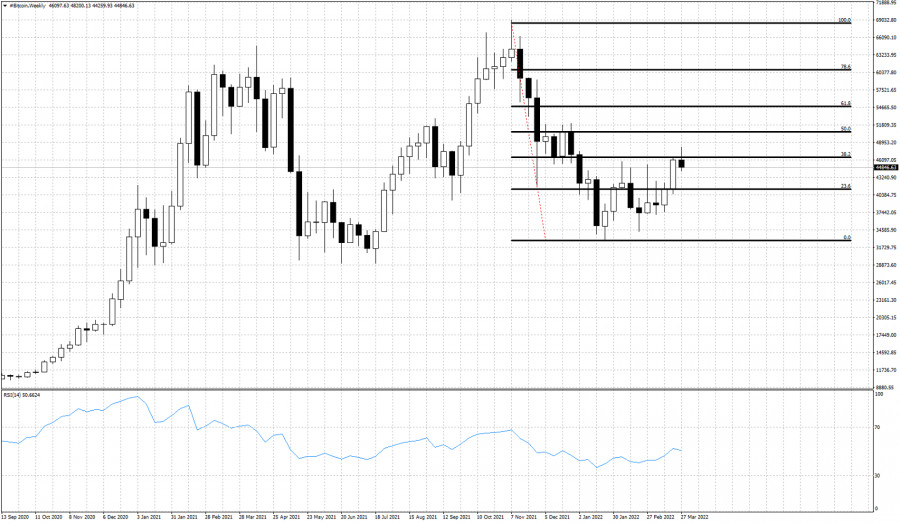
| Weekly Bitcoin analysis for April 1st. Posted: 01 Apr 2022 06:10 AM PDT Bitcoin is trading around $45,400 after reaching as high as $48,200. Price has so far retraced a little bit more than the 38% of the entire decline. The weekly candlestick in Bitcoin is not very positive for next week if price closes below $46,600.
Price is retracing the decline from its all time highs. The decline from the all time highs is over. The big question is whether this is the start of a new upward movement or just a short-term bounce before the next sell off that will bring price below $29,000. Current market conditions justify a move higher towards the 61.8% level. This week's closing will also provide us with key information on what to expect next. The material has been provided by InstaForex Company - www.instaforex.com |
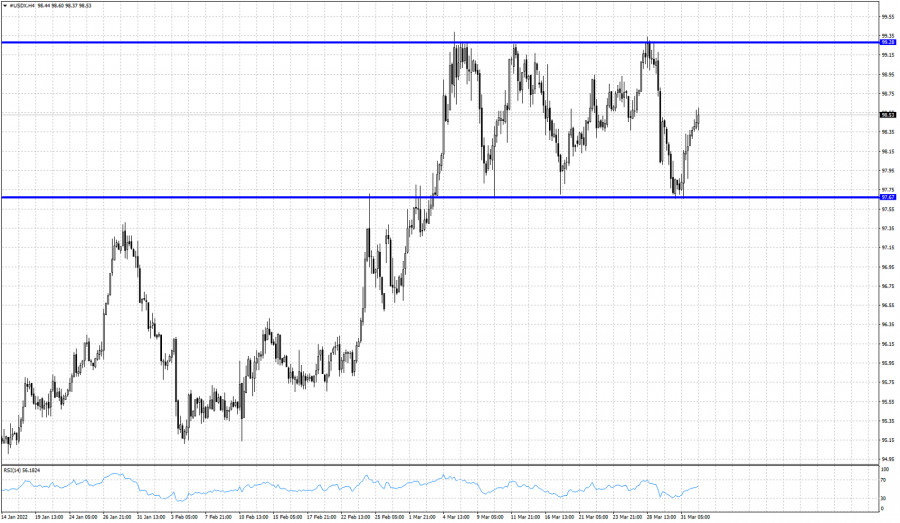
| The Dollar index trading range. Posted: 01 Apr 2022 06:02 AM PDT Since the beginning of March the Dollar index has been mostly trading sideways inside a trading range between 99.30 and 97.65. Within the last 30 days the Dollar index touched almost 4 times the 99.30 only to turn lower towards 97.65 for three times.
The Dollar index is in the middle of the trading range after bouncing off 97.65 for the third time yesterday. When price is near the upper boundary we prefer to be neutral or short. If price is at the lower boundary we prefer to be neutral or long. Breaking either of the two levels will provide an important trend signal. Traders need to be patient. The material has been provided by InstaForex Company - www.instaforex.com |
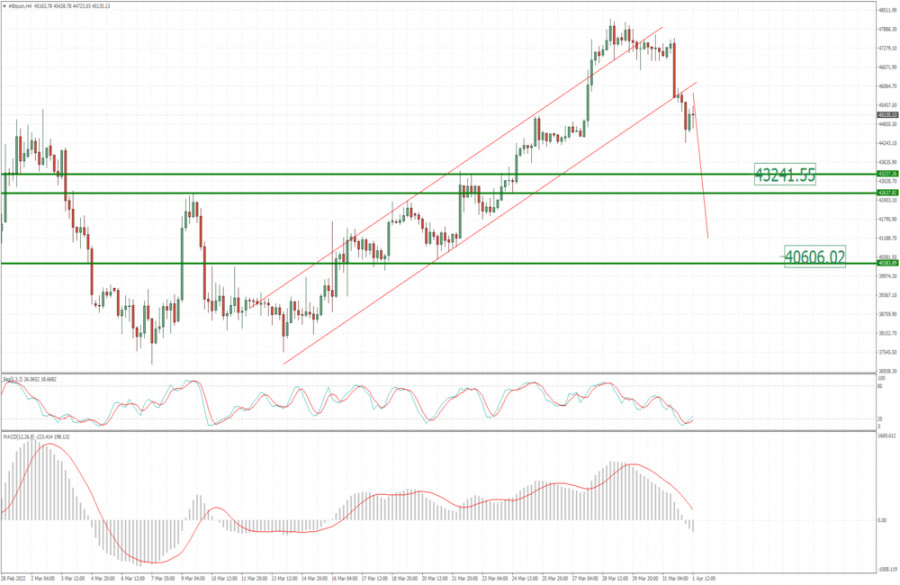
| BTC update for April 01,.2022 - Potential for furthher drop Posted: 01 Apr 2022 06:01 AM PDT Technical analysis:
BTC has been trading downside in the background and I see potential for the downside continuation. Trading recommendation: Due to the breakout of the rising channel in the background and strong supply, I see potential for the downside continuation. Watch for potential selling opportunities on the rallies with the downside objectives at the price of$43.240 and $40.600. MACD is showing downside reading and the Stochastic is showing premature bull cross, which is sign that sellers are still in control. Key resistance is set at the price of $48.200 The material has been provided by InstaForex Company - www.instaforex.com |
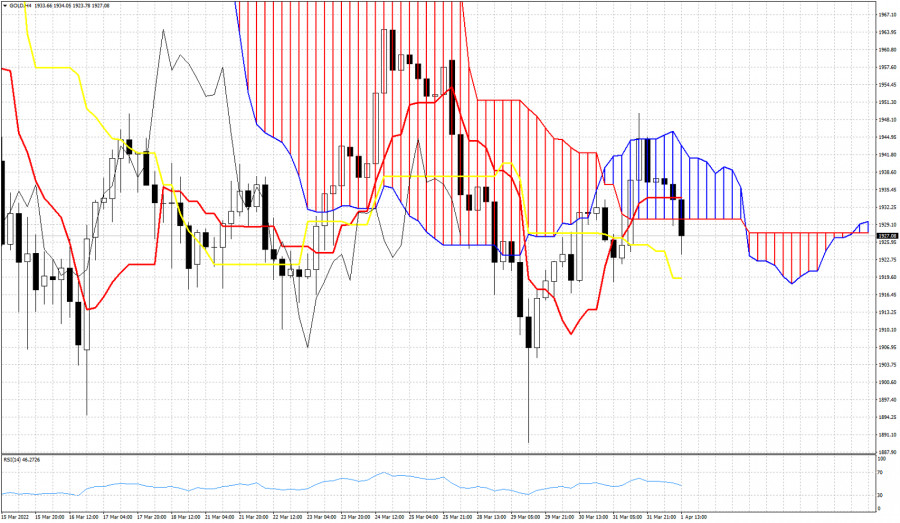
| Ichimoku cloud indicator analysis on Gold for April 1, 2022. Posted: 01 Apr 2022 05:58 AM PDT Gold price continues to trade below the Ichimoku cloud in the 4 hour chart. Price remains vulnerable to the downside. So far we have some mixed signals by the Ichimoku indicator and there is no clear picture if bulls or bears have the upper hand. While price remains below the Kumo (cloud), the tenkan-sen (red line indicator) has crossed above the kijun-sen (yellow line indicator) indicating a potential reversal.
|
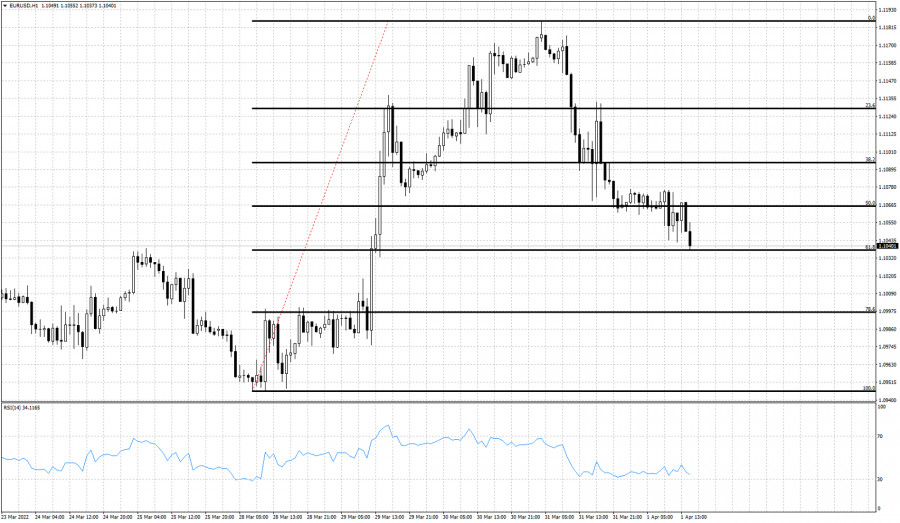
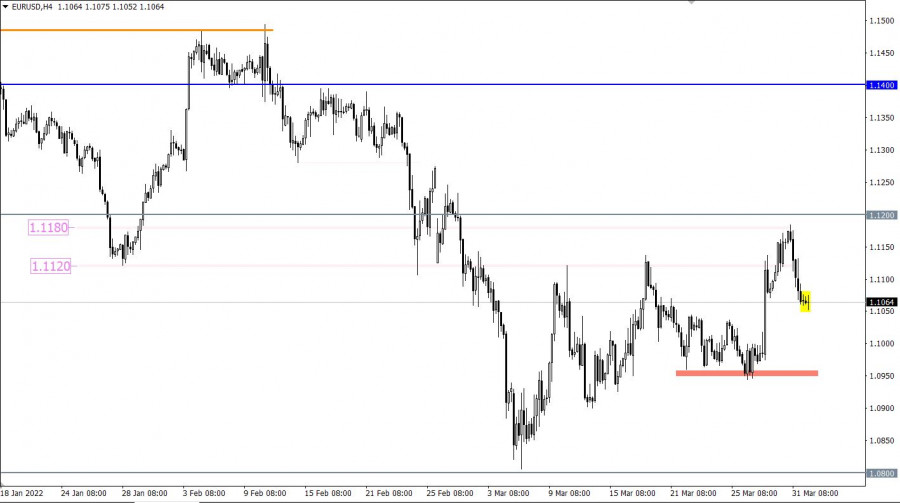
| Posted: 01 Apr 2022 05:51 AM PDT EURUSD recently made a low at 1.0945 and then a high at 1.1185 yesterday. Since then price has pulled back and retraced 618% of this upward move. In the near term there are increased chances of a reversal to the upside by taking into consideration that price has broken above a key short-term resistance as we mentioned in previous posts.
Until the end of the day when trading ends for the week, there are increased chances that EURUSD will turn around to the upside. Intraday support is found at the 61.8% level at 1.1035. I expect price to bounce off that support level. Overall our expectations remain bullish as long as price is above 1.0945. We consider this pull back as a buying opportunity as long as price is above 1.0945. We continue to expect to see EURUSD towards 1.12-1.1250 where we find the upper boundary of the medium-term bearish channel. The material has been provided by InstaForex Company - www.instaforex.com |
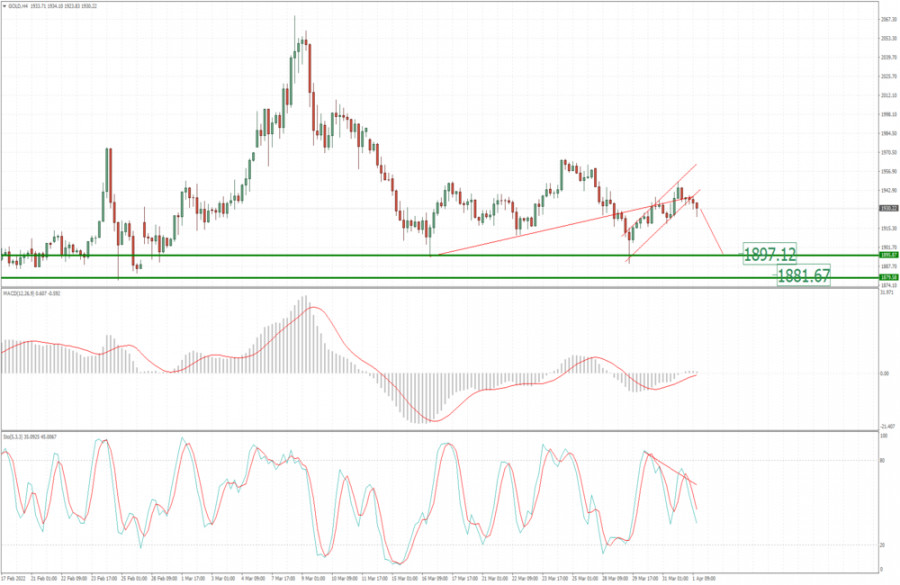
| Analysis of Gold for April 01,.2022 - Potential for bigger drop Posted: 01 Apr 2022 05:46 AM PDT Technical analysis:
Gold has been trading downside today and there is the breakout of the rising trend line Trading recommendation: Due to rejection of the upper trend-line and strong supply today, I see potential for downside continuation. Watch for potential selling opportunities on the rallies with the downside objectives at the price of $1.897 and $1.881. Stochastic is showing bearish divergence in the background and bear cross, which is another sign for the downside movement. Resistance is set at the price of $1.947 The material has been provided by InstaForex Company - www.instaforex.com |
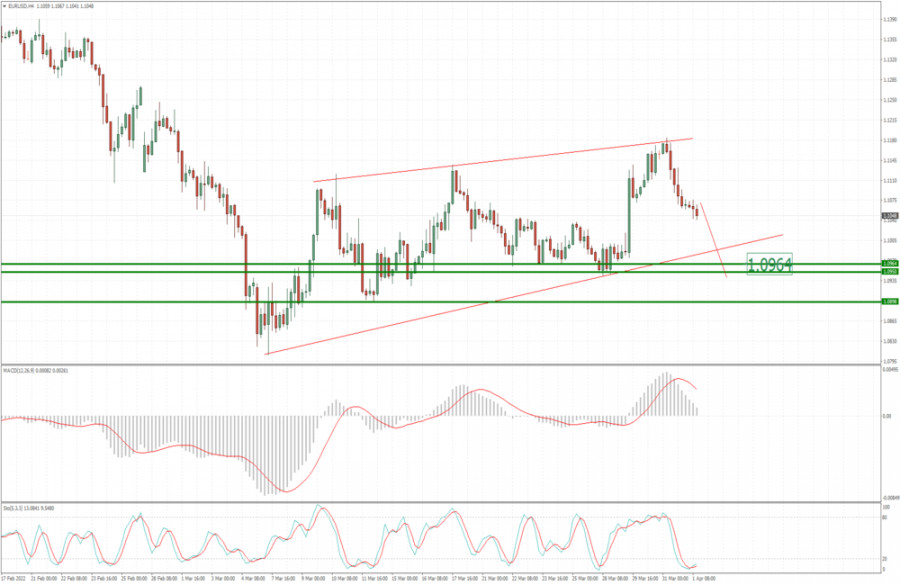
| EUR/USD analysis for April 01, 2022 - Potential for downside continuation Posted: 01 Apr 2022 05:18 AM PDT Technical analysis:
EUR/USD has been trading downside as I expected. I see further downside continuation and potential test of lower trend-line. Trading recommendation: Due to rejection of the upper trend line and strong supply today, I see potential for downside continuation. Watch for potential selling opportunities on the rallies with the downside objective at the price of 1.0965. Stochastic is showing oversold condition but with no evidence for the reversal. Resistance is set at the price of 1.1185 The material has been provided by InstaForex Company - www.instaforex.com |
| Posted: 01 Apr 2022 05:15 AM PDT
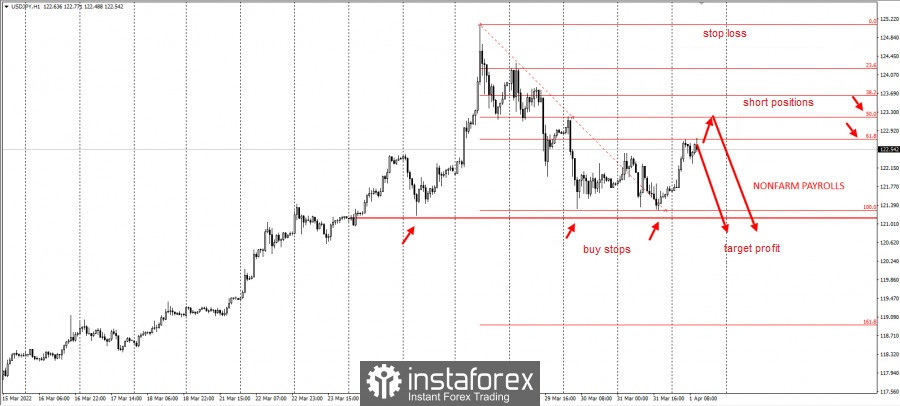
USD/JPY underwent a correction, immediately after the strong rally prompted by the Bank of Japan's soft monetary policy. It entered a good area for sell positions and showed a clear lower limit at 121.2. Today's US unemployment report will most likely add volatility to the US dollar.
Since there is a three-wave (ABC) pattern in the pair, with wave A representing the selling pressure last May 29, traders can open short positions up to the 50% and 61.8% retracement levels of 122.7-123.2. Set stop loss at 124.5 and take profit on the breakdown of 121.2. The trading idea is based on the Price Action and Stop Hunting strategies. Good luck and have a nice day! The material has been provided by InstaForex Company - www.instaforex.com |
| Video market update for April 01,,2022 Posted: 01 Apr 2022 05:15 AM PDT Watch for continuational pattern on EUR/USD.... The material has been provided by InstaForex Company - www.instaforex.com |
| Tips for beginner traders in EUR/USD and GBP/USD for April 1, 2022 Posted: 01 Apr 2022 04:59 AM PDT UK's 4th quarter GDP came out slightly better than expected. It rose 1.3% m/m, while the year-on-year amounted to 6.6%. Surprisingly, there was no market reaction in GBP/USD. In the European Union, data on the unemployment rate was published. There was a decrease in the data for February, but it was lower than what was expected. Instead of falling to 6.7%, it declined to 6.8%. Nevertheless, EUR/USD fell because of this report. Weekly data on US jobless claims is expected to be published today. Analysts predict an increase in volume, which is negative for both the US labor market and dollar. Initial applications is expected to increase from 187,000 to 197,000, while the repeated applications is projected to remain at 1,350,000. Analysis of trading charts from March 31 EUR/USD bounced back from the upper limit of 1.1120/1.1180, which led to a significant increase in the volume of short positions. As a result, euro lost about 100 pips. GBP/USD slowed down after a slight rollback from 1.3000/1.3050. This formed doji-type candles, which signals uncertainty among traders.
Economic calendar for April 1 Preliminary data on EU inflation will be released today, and analysts expect an acceleration in consumer prices from 5.9% to 6.6%. This is a negative factor for the European currency. The main macroeconomic event is considered to be the report of the United States Department of Labor, which predicts by no means bad indicators. The unemployment rate could drop from 3.8% to 3.7%, and 480,000 new jobs could be created outside of agriculture. We have a strong US labor market, which could support the US dollar. Trading plan for EUR/USD on April 1 There is a slight stagnation around 1.1060, which may play into the hands of traders in the upcoming acceleration. So, in order for the downward cycle to resume, the quote needs to stay below 1.1050. That will ensure a move towards 1.1000, or even to 1.0970. An alternative scenario is a return to 1.1120/1.1180.
Trading plan for GBP/USD on April 1 A consolidation in the range of 1.3105/1.3180 is possible. If that happens, new price jumps will be seen in the pair. Considering this, it is best to buy in the market when the price holds above 1.3185. That has a potential move towards 1.3220. Meanwhile, sell positions should be considered after the quote dips below 1.3100. That is likely to lead to a decline to 1.3060-1.3000.
What is reflected in the trading charts? A candlestick chart shows graphical rectangles of white and black light, with sticks on top and bottom. When analyzing each candle in detail, you will see its characteristics of a relative period: the opening price, closing price, and maximum and minimum prices. Horizontal levels are price coordinates, relative to which a stop or a price reversal may occur. These levels are called support and resistance in the market. Circles and rectangles are highlighted examples where the price of the story unfolded. This color selection indicates horizontal lines that may put pressure on the quote in the future. The up/down arrows are the reference points of the possible price direction in the future. The material has been provided by InstaForex Company - www.instaforex.com |
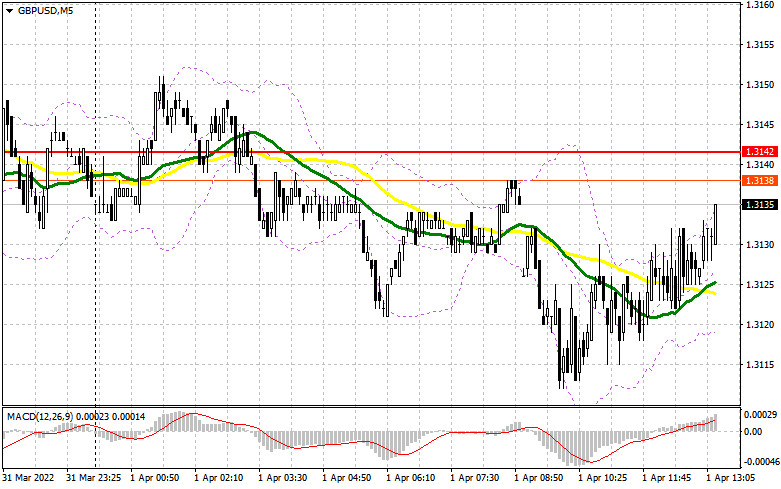
| Posted: 01 Apr 2022 04:47 AM PDT In my morning article, I turned your attention to several levels. However, GBP/USD actually failed to touch any of them. The currency pair is trading under low volatility despite a weak UK manufacturing PMI for March that grew worse than expected. The sterling did not take a nosedive. It proves that traders are focused on US macroeconomic reports that are due later in the trading day. These reports will set the tone in the second half of the day. GBP/USD did not test 1.3106 and 1.3142 and did not suggest any market entry points. The technical picture and a trading strategy remain the same for the second half of the day.
What is needed to open long positions on GBP/USD As I mentioned above, the UK manufacturing PMI for March didn't trigger a massive sell-off of GBP/USD. Indeed, a minor decline in the business activity of the industrial sector is not fatal for the domestic economy. The key to market sentiment today is how traders will respond to the US nonfarm payrolls. In case of strong employment in the US public and private sectors, the bulls will have to defend actively the nearest support at 1.3106. A false breakout at this level will generate a sell signal that is capable of returning GBP/USD to the middle of the sideways channel at 1.3142. A breakout and a test of this level downwards will create an extra entry point for long positions. This will reinforce buying pressure and open the door higher towards the upper border of the trading range that coincides with yesterday's high at 1.3179. I recommend setting take profit there. A more distant target is seen at 1.3219, though it would be hard to reach this level under the current market conditions. This scenario will be possible in the second half of the day only on condition of poor US nonfarm payrolls. If GBP/USD declines during the American trading hours and the bulls lack activity at 1.3106, it would be better to cancel buying until a more important level at 1.3071. I would advise you to enter the market only during a false breakout. We could buy GBP/USD immediately at a drop off 1.3038 or lower from 1.3003, bearing in mind a 30-35-pips intraday correction. What is needed to open short positions on GBP/USD The bear market will be cemented on condition of upbeat US employment data. Notably, GBP buyers were trying to enter the market again for the whole trading week. They aimed to push the price up, proceeding with the bullish trend that began in mid-February. A plunge in GBP/USD would be a convincing argument from the bears, thus destroying the chance for regaining the bullish momentum. The longer the pair is locked inside a trading range, the higher is the chance for a further downward move that has been going on since March 23. For the time being, GBP/USD is trading along moving averages technically, thus indicating a flat market. The bulls and the bears are engaged in a fierce standoff. The major task for the bears is to defend the level of 1.3142. A market entry with short positions will be in play on condition of a false breakout and strong US employment data. In this case, we expect GBP/USD to resume the bearish trend and decline towards 1.3106. This level is worth fighting for because a move beyond this level will activate stop losses of sellers. This will push GBP/USD down to lows at 1.3071 and 1.3038. A deeper target is seen at 1.3003 where I recommend profit taking. In case the currency pair grows in the American session and the sellers lack activity at 1.1342, it would be better to cancel short positions until yesterday's high at 1.3179. I would recommend opening short positions there also on condition of a false breakout. We could sell GBP/USD immediately at a bounce off 1.3219 and higher from 1.3253, bearing in mind a 30-35-pips intraday correction.
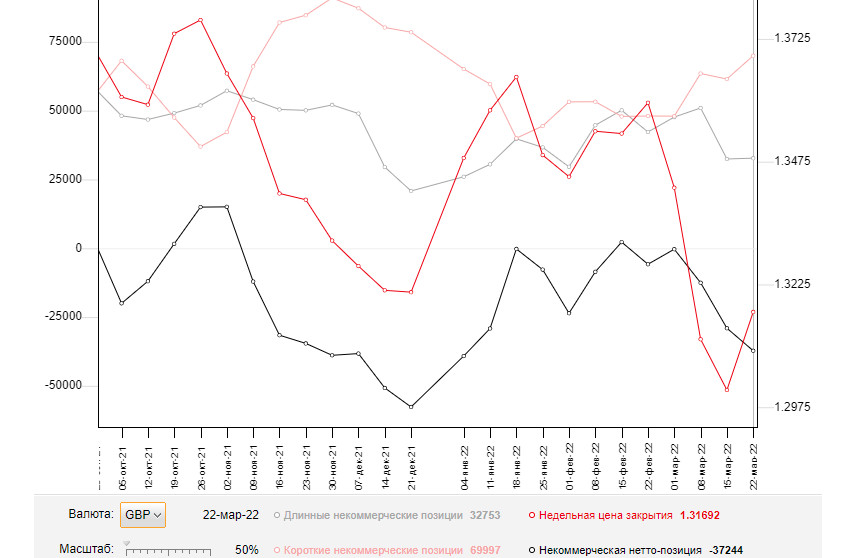
The COT report from March 22 logs a sharp increase in short positions and a minor growth in long ones. GBP came under selling pressure last week in light of hawkish remarks from several Fed policymakers. The sterling had been already hurt by economic headwinds in the Kingdom that had put a strain on British households. Experts warn about a further downturn due to inflationary risks that are hard to estimate now. A variety of factors puts a lid on the UK economy such as soaring energy prices, the lingering hostilities in Ukraine, and sanctions imposed by the UK and its European allies. This week, traders were selling GBP because of the dovish tone of the Bank of England Governor. Sells-offs are likely to continue amid the lack of positive news. The bulls will clutch at straws pinning hopes on some progress in the peace talks between Russia and Ukraine. According to the COT report from March 22, long non-commercial positions rose from 32,442 to 32,753 whereas short non-commercial positions jumped from 61,503 to 69,997. It increased the negative delta of non-commercial net positions from -29,061 to -37,244. GBP/USD closed last week higher at 1.3010 against 1.3169 a week ago.
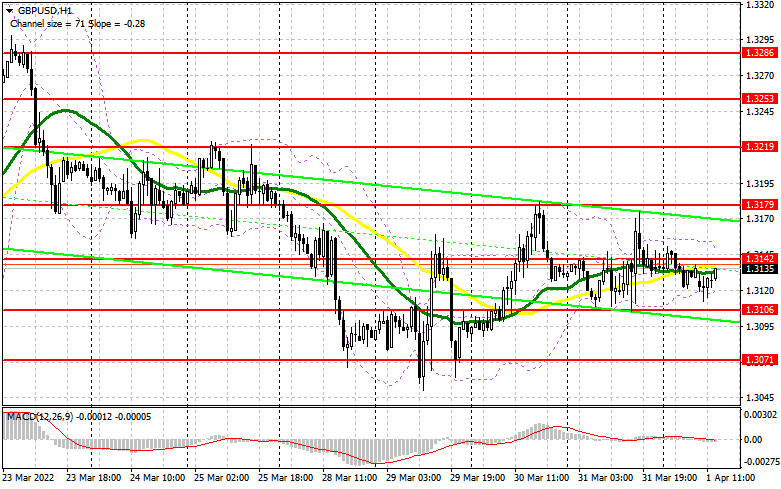
Indicators' signals: Trading is carried out roughly in the area of the 30 and 50 daily moving averages. It indicates that bullish and bearish pressure is in equilibrium. Moving averages Note: The period and prices of moving averages are considered by the author on the H1 hourly chart and differs from the general definition of the classic daily moving averages on the daily D1 chart. Bollinger Bands If GBP/USD declines, the indicators' lower at about 1.3120 will serve as support. Alternatively, if the currency pair grows, the upper border at 1.3155 will act as resistance. Description of indicators
|
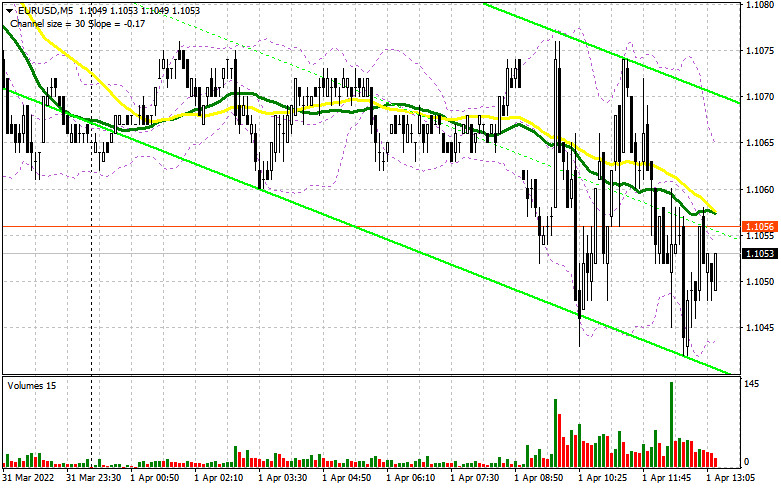
| Posted: 01 Apr 2022 04:43 AM PDT In my forecast this morning I drew your attention to the levels of 1.1035 and 1.1093 and recommended entering the market from them. Let's have a look at the 5-minute chart and analyze what happened. Despite the weak Eurozone manufacturing activity report, the data was not as weak as some economists expected. This kept the EUR/USD pair in a narrow sideways channel ahead of the US labor market report. Low volatility did not allow to reach the above-mentioned levels, so there were no signals to enter the market in the first half of the day. Technically, nothing has changed, as well as the trading strategy for the US session.
Long positions on EUR/USD: The released Consumer Price Index for the euro zone has once again proved to the European Central Bank that delaying policy changes is dangerous. The euro zone's annual inflation rate jumped to 7.5% in March from 5.9% in February. It is one of the highest levels seen. Weak manufacturing activity reports for Germany, France and Italy did not give traders much optimism as they prepare for more important US labor market statistics and expect the US dollar to strengthen. The report on Non-Farm Payrolls in the US will determine the pair's future. A strong reading is likely to put pressure on the euro, which may lead to the breakthrough and the test of 1.1035. Only a false breakout at this level is likely to create the first entry point to buy the euro. To see a bullish trend continuation and a breakthrough of the March highs, bulls need to be active around 1.1093. The moving averages are located slightly above, which play on the sellers' side. If the US data appears to be weak, and the unemployment report is also expected, a pierce and a test of 1.1093 may form an additional buy signal and open the way for the pair's recovery to the area of 1.1131. Traders are advised to take profit at this level. A breakthrough of this level is likely to trigger sellers' stop-loss orders, opening a direct way to the highs of 1.1174 and 1.1227. If the pair declines and bulls show weak activity at 1.1035, it is better to postpone opening long positions. A false breakout of the low at 1.1005 would be the best buy scenario. Long positions in the euro can be opened on a pullback only from 1.0977, or lower near 1.0948, allowing an upward intraday correction of 30-35 pips. Short positions on EUR/USD: As it was expected, bears showed some activity after the weak eurozone data release, clearly hinting at problems in the economy in the near future. The market is not under the full control of bulls, and the US data may ruin their attempts to build a strong bullish trend this week. Bears need to hold the price below a very important resistance at 1.1093. By breaking this area through when the US jobs data comes out, bears can reverse the pair to the downside. Only a false breakout at 1.1093 may bring back the pressure on the euro and create a sell signal to continue sliding to support at 1.1035. If there is strong data from the US the pair may break through this level and trigger buyers' stop-loss orders. A breakthrough and a reverse test bottom/top of 1.1035 may form an additional sell signal, which will open a direct way to the lows of 1.1005 and 1.0977, where traders may lock in profits. In case of the euro growth and a lack of activity from bears at 1.1093, which is possible only in case of another positive news on the negotiations between Russia and Ukraine, bulls are likely to establish a new uptrend. If so, it is better not to rush selling the pair. Opening of short positions would be optimal if a false breakout occurs around 1.1131. Selling the EUR/USD pair on the rebound is possible from 1.1174, or higher near 1.1227, allowing a downward correction of 20-25 pips.
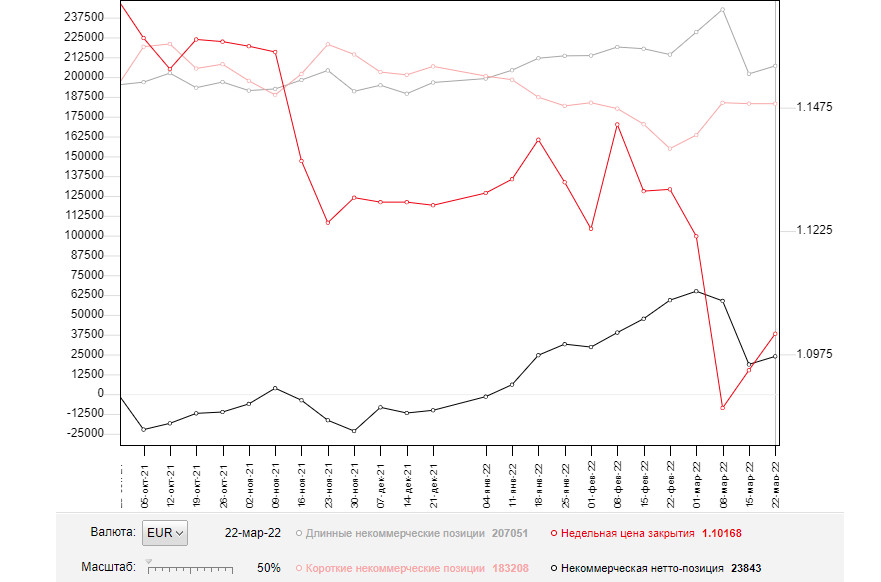
The COT (Commitment of Traders) report for March 22 showed that short positions reduced and long ones increased sharply. The pair is trading near new yearly lows and major support levels which is positive for the euro. However, if we take a look at the figures, we can see that short positions fell slightly. The pressure on EUR/USD returned after Fed Chairman Jerome Powell sharply changed his stance last week. The Chairman said on Monday that he expected a 50-point hike in key interest rates. Other representatives of the Federal Reserve supported this statement, which made market participants revise their outlooks. The risk of higher inflation in the US is the main reason for such changes in the policy. Meanwhile, the European Central Bank also held a meeting where President Christine Lagarde announced plans for a more aggressive tapering of economic support measures and raising interest rates. It added some optimism for the medium-term outlook of the euro, which is already heavily oversold against the US dollar. Positive results of the Russia-Ukraine meeting and decrease of the geopolitical tensions will play on bulls' side. The COT report indicates that long non-commercial positions rose to 207,051 from 202,040, while short non-commercial positions declined to 183,208 from 183,246. At the end of the week, total non-commercial net positioning was up to 23,843 against 18,794. The weekly closing price rose slightly to 1.1016 from 1.0942.
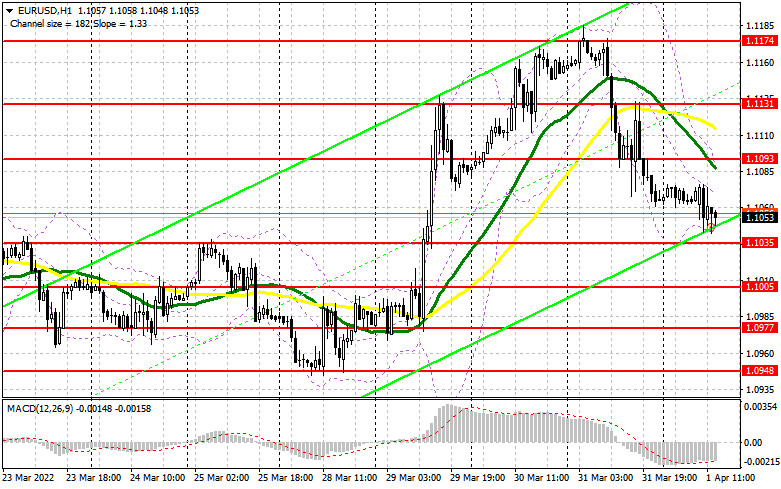
Indicator signals: Moving averages Trading is carried out near the 30-day and 50-day moving averages, indicating that bears attempt to take control over the market. Note: The period and prices of moving averages are viewed by the author on the hourly chart and differ from the general definition of classic daily moving averages on the daily chart. Bollinger Bands If the pair rises, the middle band at 1.1115 will act as resistance. Indicator description:
|


| You are subscribed to email updates from Forex analysis review. To stop receiving these emails, you may unsubscribe now. | Email delivery powered by Google |
| Google, 1600 Amphitheatre Parkway, Mountain View, CA 94043, United States | |


Comments