Forex analysis review
Forex analysis review |
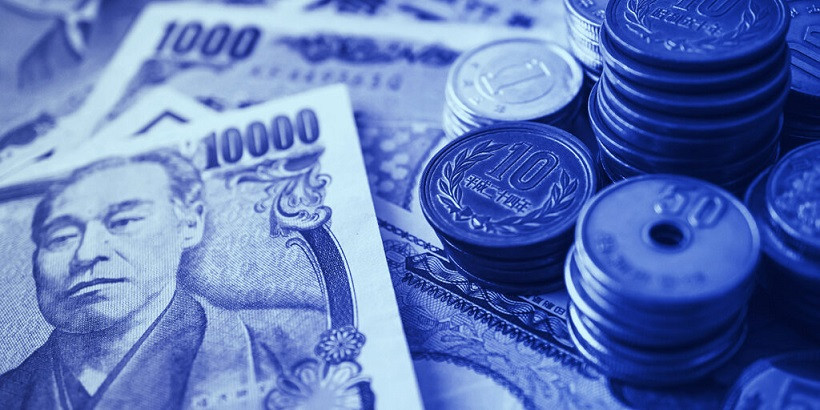
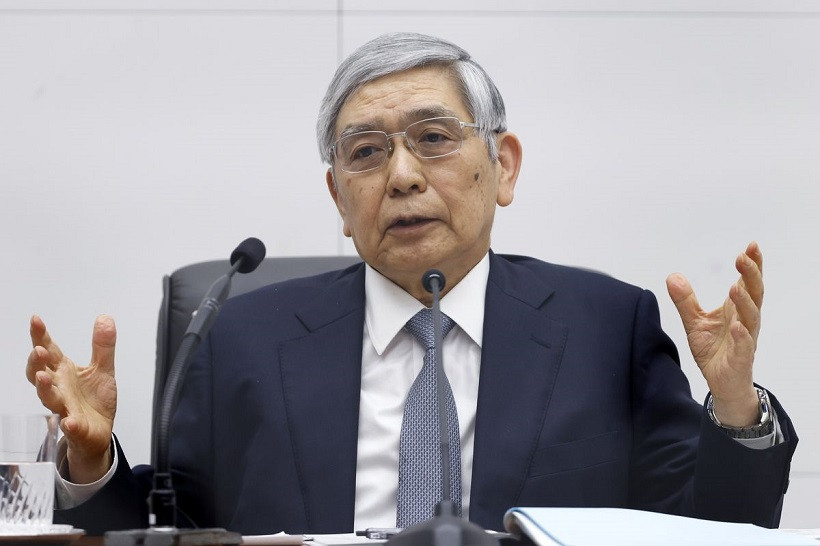
- USD/JPY. The Bank of Japan "welcomed" the fall of the yen
- EUR/USD: Dollar is gathering its thoughts. Loonie height of sales
- Technical analysis of EUR/USD for April 07, 2022
- Gold upside reversal
- Ethereum: more declines possible
- April 7, 2022 : EUR/USD daily technical review and trading opportunities.
- April 7, 2022 : EUR/USD Intraday technical analysis and trading plan.
- April 7, 2022 : GBP/USD Intraday technical analysis and significant key-levels.
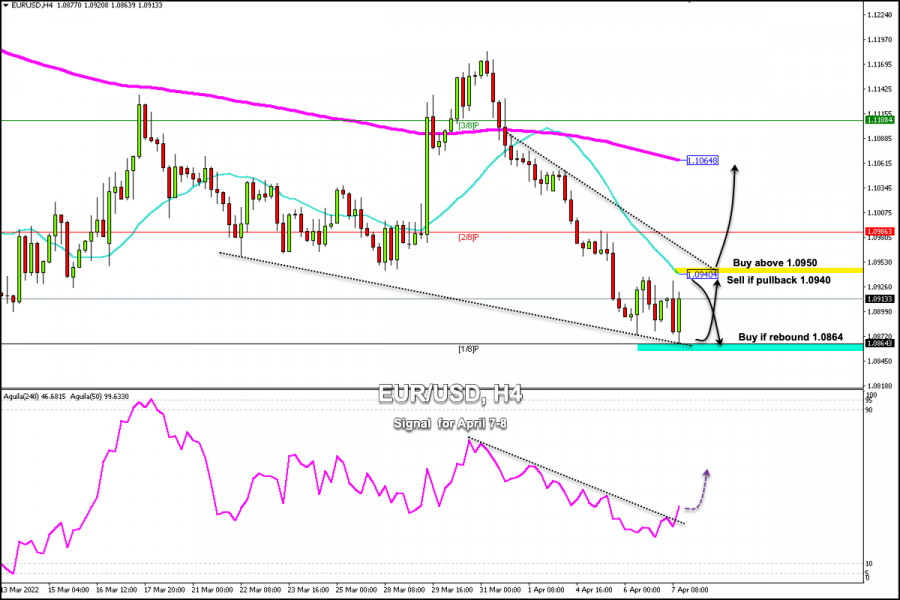
- Trading Signal for EUR/USD for April 07-08, 2021: sell below 1.0940 and buy above 1.0864 (21 SMA - 1/8 Murray)
- Analysis of GBP/USD on April 7. James Bullard: the rate should be at 3.5%
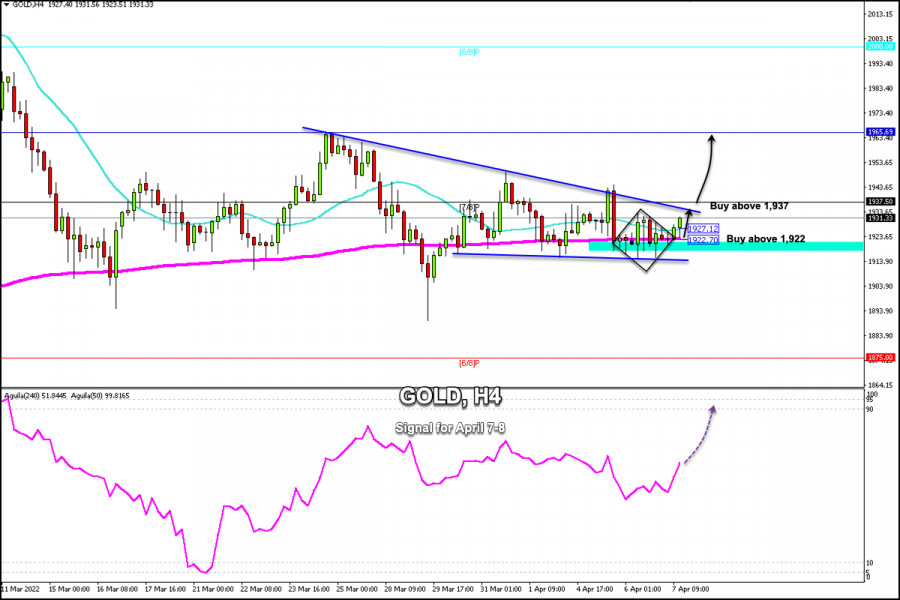
- Trading Signal for Gold (XAU/USD) for April 07-08, 2021: buy above $1,922 (200 EMA - 21 SMA)
- EUR/USD analysis on April 7. The European Parliament called for the immediate imposition of an embargo on oil, gas, coal
- EUR/USD: Fed's hawkish stance and geopolitical risks
- US stock market down on Wednesday amid tech losses
- Ichimoku cloud indicator analysis on Bitcoin.
- Ichimoku cloud indicator analysis on Gold for April 7, 2022.
- Global stock markets stumble on aggressive Fed policy
- Short-term technical analysis on EURUSD for April 7, 2022.
- American Premarket for April 7: Russia points to Ukraine's rejection of the preliminary agreement reached in Istanbul
- Trading plan for Silver for April 07, 2022
- Trading tips for gold
- Asian markets drop sharply on Thursday
- Fed has taken a more aggressive policy
- BTC update for April 07,.2022 - Potential for downside continuation
- Bitcoin: SEC's argument against spot ETF 'significantly weakened'
| USD/JPY. The Bank of Japan "welcomed" the fall of the yen Posted: 07 Apr 2022 01:27 PM PDT Last week, the dollar-yen pair updated a multi-year price high, reaching 125.11. The pair was at this height for the last time almost seven years ago – in August 2015. Then the USD/JPY bulls failed to settle above the 125.00 mark. After several attempts, they gave up, after which the bears seized the initiative. Last week, the pair's bulls also failed to hold the height – traders began to take profits en masse, thereby putting pressure on the greenback. A rather deep (250-point) price pullback followed: the pair returned to the area of the 122nd figure.
Nevertheless, the upward trend is still in force. The corrective decline turned out to be impressive, but very short-term: this week, bulls went on the offensive again, storming the 124th figure at the moment. And judging by the growth rates, traders will be able to identify themselves at the borders of the 125th price level in the medium term. At least the fundamental picture is in favor of the growth scenario. The dollar is "on the horse" again and is gaining momentum again, due to the strengthening of anti-risk sentiment and hawkish expectations. The US dollar index is approaching the 100 mark (currently at two-year highs). Similar dynamics is demonstrated by the profitability of treasuries. In particular, the yield on 10-year government bonds has already reached three-year highs. However, the USD/JPY pair is growing not only due to the strengthening of the greenback, but also due to the weakening of the yen. Such multidirectional movements push the pair up. The Japanese currency reacted to the rhetoric of the representatives of the central bank, who continue to take a dovish position, despite the signs of rising inflation in the country. So, a member of the Board of the Bank of Japan, Asahi Noguchi, recently said that the advantages of a weak yen for the Japanese economy "outweigh the disadvantages." In his opinion, the expensive national currency has "more painful consequences", in particular, in the form of deflation. By the way, similar statements were made by the Bank of Japan last year, when the USD/CAD pair was 2,000 points lower, around the 103-104 marks. At that time, many members of the central bank voiced concern about the yen being too expensive. At the moment, the alarming comments are voiced primarily by Japanese politicians, who say that a sharp drop in the exchange rate could damage the country's economy, which depends on imports. But as we can see, the Bank of Japan is not concerned about this fact. BOJ Governor Haruhiko Kuroda noted only the "unusually rapid rise of the pair," but did not draw any conclusions in the context of possible changes in monetary policy. On the contrary: representatives of the Japanese central bank do not get tired of declaring that they will maintain an ultra-soft monetary policy for a long period of time. In particular, Kuroda, speaking to members of parliament the day before yesterday, said that at the moment it is too early to even discuss an exit strategy from the relaxed policy. At the same time, he stressed that the BOJ is not in the same situation as the Fed – "in Japan, inflation and wages do not move in the same spiral, unlike the United States." In addition, Kuroda once again stressed that the growth of inflation is unstable (while he pointed to the dynamics of the consumer price index excluding food and energy). Thus, the Japanese central bank did not prevent the further weakening of the yen, emphasizing its commitment to the "dovish course". It should be noted here that the yen, as a rule, is the beneficiary of market unrest. However, the events of recent weeks suggest that traders mostly prefer an "umbrella" in the form of American currency. The greenback continues to be in high demand as a protective tool against the background of continuing geopolitical risks.
Several "alarm bells" were sounded today, and not only in the context of the Russian-Ukrainian negotiations. The situation around Taiwan has also been escalating in recent days. The political conflict has been smoldering for a long time, but now there is a possibility that the political confrontation will turn into a military one. Increasingly, statements by Chinese politicians and officials began to sound that the Taiwan issue should be resolved militarily. Another wave of these statements arose after the United States began to strengthen arms supplies to Taiwan and send American politicians there with official visits. As for the Ukrainian case, the situation here also leaves much to be desired. In particular, Russian Foreign Minister Sergei Lavrov said today that Kiev "has moved away from some of the agreements that were reached between the delegations at the talks in Istanbul." However, at the same time, he noted that the negotiation process has not been stopped – the interstate dialogue is still ongoing. And yet it is obvious that the parties are unlikely to come to any comprehensive agreement in the near future. This was indirectly confirmed by the representative of the Turkish President. He said he does not expect a serious breakthrough in the negotiations between Moscow and Kiev "in the next couple of days or even weeks." The main reason is the lack of consensus between Russia and Ukraine "on some points of negotiations." Thus, bulls on the USD/JPY pair have not exhausted their potential and may retest the 125th figure in the short term. The same thing is said by "technique". On all higher timeframes (from H4 and above), the pair is either on the upper or between the middle and upper lines of the Bollinger Bands indicator. In addition, on the daily and weekly charts, the Ichimoku indicator has formed one of its strongest bullish signals, the Parade of Lines. Therefore, it is advisable to use any corrective pullbacks to open long positions with 125.00 as the target. The material has been provided by InstaForex Company - www.instaforex.com |
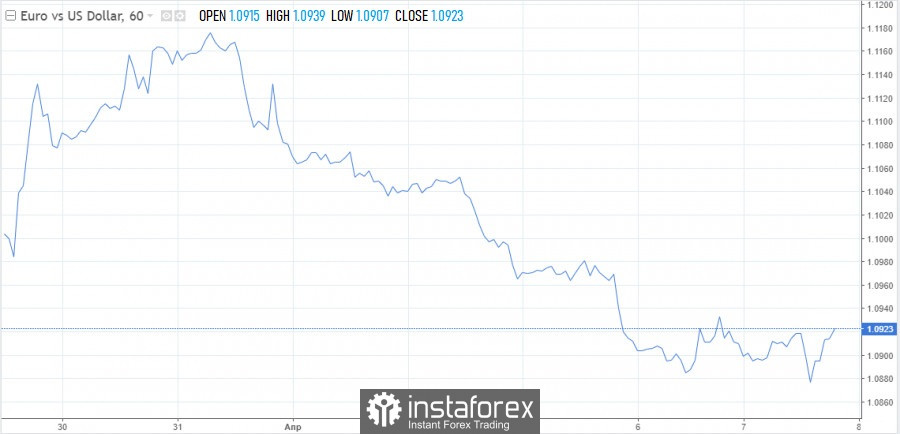
| EUR/USD: Dollar is gathering its thoughts. Loonie height of sales Posted: 07 Apr 2022 01:27 PM PDT
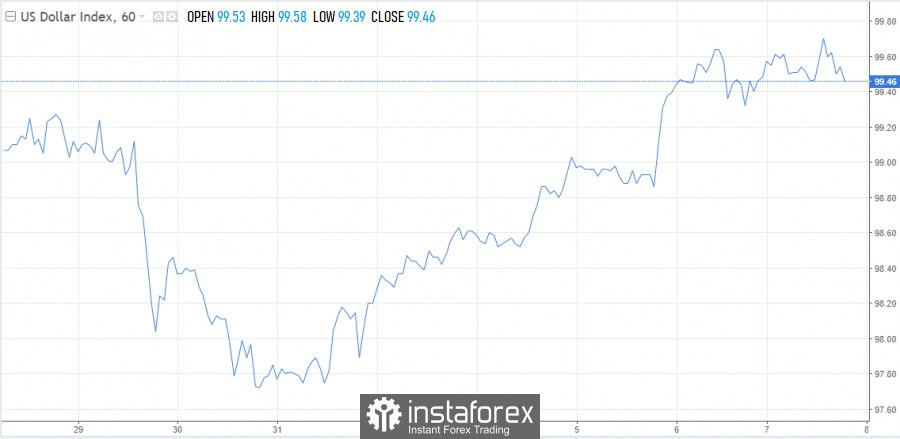
The dollar fulfilled and even exceeded growth plans, but this does not mean that the rally is over. The US dollar index is under pressure after hitting new highs in the 99.80-99.85 area and could face some downward pressure in the coming sessions. After a while, it will again continue the upward trend. The nearest major resistance is at 100.00, followed by the May 2020 high at 100.55.
Recall that the US currency is supported and will continue to be provided by tougher rhetoric of Federal Reserve officials. According to Lael Brainard, the central bank is ready for a lot, including an accelerated reduction in the balance sheet, which reaches $9 trillion. The corresponding decision can be made at the May meeting. Earlier in January, a survey showed that market participants were expecting a $2.5 trillion balance sheet cut. The European Central Bank has also begun to actively think in the direction of normalizing monetary policy. The minutes of the last meeting published the day before are formal proof of this. Members of the ECB believe that the current situation with inflation requires immediate intervention. The euro has been hit hard this week, and it's not just the strong dollar that's to blame. Now the question arises: will the European currency be able to stop the fall after the release of hawkish ECB minutes? On the one hand, members of the central bank seem to be determined. On the other hand, it seems that not everyone shares this point of view and there is a certain imbalance of opinions in the ECB. Chief Economist Philip Lane is confident that one should not overreact to a surge in inflation. Probably not. Support, if any, is limited. The euro is under serious pressure from geopolitical events after March 10, and this outweighs the ongoing positive from the ECB. It became known that the EU plans to postpone the ban on the purchase of Russian coal for a month. Previously it was July, now August has come into play. Be that as it may, this did not provide much support for the euro. Traders keep another factor in mind - the divergence in policy between the ECB and the Fed, which continues to widen as the economy of the eurozone faces an increased risk of recession amid the Russian-Ukrainian crisis. The EUR/USD pair closed five consecutive sessions with a fall. Has the bottom been reached or is there still more to come? Judging by the fact that the quote has not been able to demonstrate a convincing rebound, the euro will continue to trade at weak levels with the risk of updating recent lows. The downtrend line that appeared at the end of March remains unchanged. Bears should retain control until the pair stabilizes. The 1.0870 static level acts as temporary support, followed by 1.0850, and then comes the psychological level of 1.0800. Resistance is noted at 1.0920, 1.0950 and 1.1000 (psychological level).
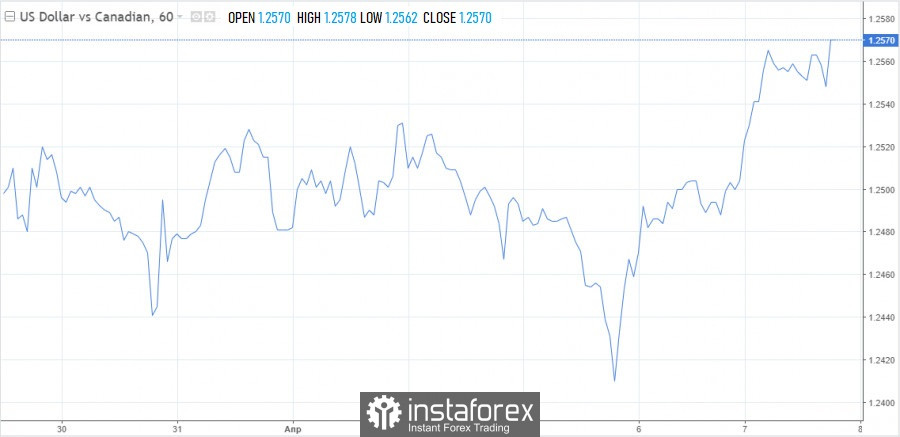
The movement of the USD/CAD pair looks quite interesting now. The Canadian dollar is falling against its US counterpart, having recently tested support at 1.2400. On Thursday, the pair has been quoted above 1.2500 since the opening of the day. There will be more to come. The aggressive rhetoric of the Fed officials brought back bears of the Canadian currency to the markets. On the one hand, the loonie looks hopeless, on the other hand, the forces for the fight, and most importantly the foundation, are also available. First of all, it is worth noting high oil prices, which significantly improve the trade balance of the Canadian economy. Since oil has every chance to continue rising against the backdrop of a continuing shortage of supply, the Canadian dollar will keep the interest of bulls in the long term. On Friday, traders will analyze the data on the Canadian labor market. In the event of optimistic data, markets will be pawned for further rate hikes by the Bank of Canada. With this development of the scenario, short positions on the USD/CAD pair towards 1.2400 will become relevant.
|
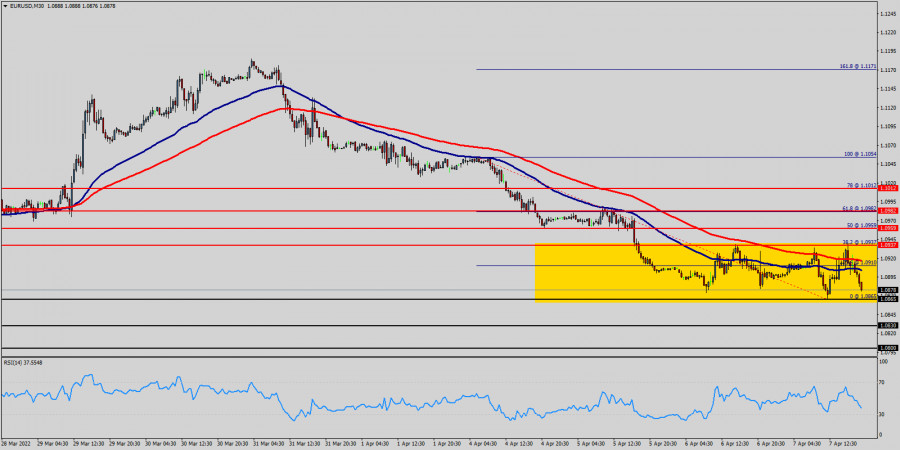
| Technical analysis of EUR/USD for April 07, 2022 Posted: 07 Apr 2022 10:21 AM PDT
The direction of the EUR/USD pair into the close this week is likely to be determined by trader reaction to 1.0830 and 1.0800. The EUR/USD pair climbed above the level of 1.0865 before it started a downside correction. It broke a fateful bullish trend line with support near 1.0865 on the M30 chart. Right now, the EUR/USD pair settled below the key 1.0937 resistance. So, it is at a risk of a downside break below 1.0865. According to previous events, the EUR/USD pair has still moving between the level of 1.0937 and the 1.0865 level (those levels coincided with the Fibonacci retracement levels 38.2% and 23.6 respectively). Look for the intraday a strong downside bias to continue as long as the EUR/USD pair holds below the price of 1.0937 which represents the daily pivot. If this move creates enough late session downside momentum then look for a wave into 1.0830, followed closely by 1.0800. The EUR/USD pair settled below the 1.0937 resistance zone, opening the doors for more downsides in the near term. Similarly, The EUR/USD pair could dive if it breaks the 1.0865 support. Today, the first resistance level is seen at 1.0910 followed by 1.0937, while daily support 1 is seen at 1.0865. Furthermore, the moving average (100) starts signaling a downward trend. Therefore, the market is indicating a bearish opportunity below 1.0910 or 1.0937. For that, it will be good to sell at 1.0910 with the first target of 1.0865. It will also call for a downtrend in order to continue towards 1.0800 in coming hours. The material has been provided by InstaForex Company - www.instaforex.com |
| Posted: 07 Apr 2022 10:10 AM PDT
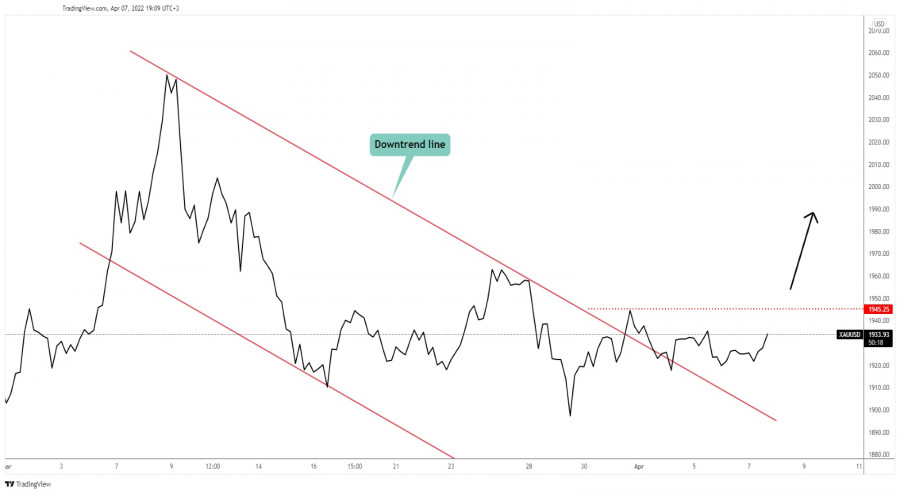
XAU/USD Down Channel Breakout!The price of gold moves somehow sideways after jumping above the downtrend line. You knew from my analyses that the downside movement could be over if the rate jumps and stabilizes above the downtrend line. You can see that the rate failed to come back down to test and retest the channel's downside line signaling that the downside movement is over and that the sellers are exhausted. It is traded at 1,936 at the time of writing below the 1,945 former high which represents an upside obstacle. GOLD Trading Conclusion!Jumping and stabilizing above the 1,945 former high could activate an upside continuation and could bring new buying opportunities. The material has been provided by InstaForex Company - www.instaforex.com |
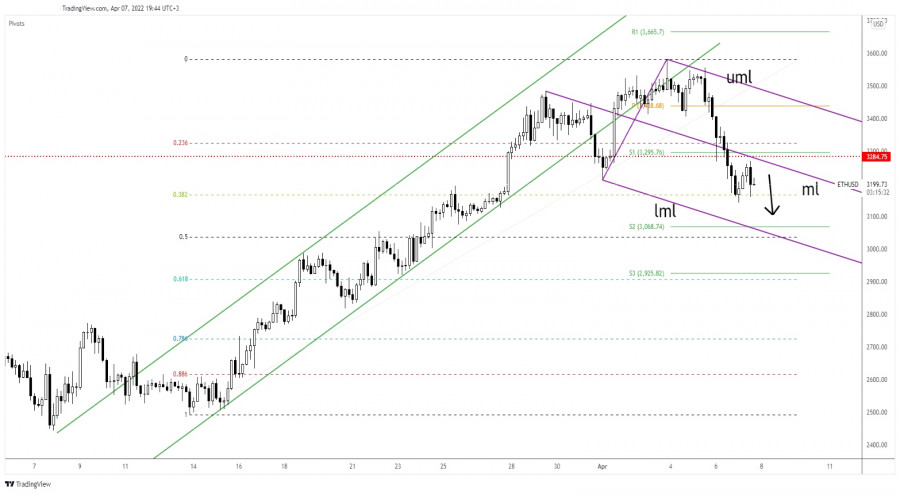
| Ethereum: more declines possible Posted: 07 Apr 2022 10:09 AM PDT The price of Ethereum is in a corrective phase. The altcoin tried to rebound but the bias remains bearish in the short term. It's traded at 3,195 at the time of writing below today's high of 3,269 and above the 3,143 daily low. ETH/USD dropped as the price of Bitcoin is in a corrective phase as well. In the last 24 hours, the crypto is down by 0.30% and by 2.99% in the last 7 days. ETH/USD Corrective Phase!
ETH/USD signaled a potential new sell-off after escaping from the up channel and after retesting the broken uptrend line. The RSI and the price action signaled a bearish divergence. The price dropped below the descending pitchfork's median line (ml) and below 3,284 static support. As long as it stays under these levels, ETH/USD could approach and reach new lows. ETH/USD Outlook!In the short term, ETH/USD could test and retest the 3,284 and the median line (ml) which represent upside obstacles. False breakouts above these levels could bring new short opportunities. Also, a valid breakdown below 38.2% (3,166) could activate more declines. The material has been provided by InstaForex Company - www.instaforex.com |
| April 7, 2022 : EUR/USD daily technical review and trading opportunities. Posted: 07 Apr 2022 10:02 AM PDT
During the past few weeks, the EURUSD pair has been trapped within a consolidation range between the price levels of 1.1700 and 1.1900. In late September, Re-closure below the price level of 1.1700 has initiated another downside movement towards 1.1540. Price levels around 1.1700 managed to hold prices for a short period of time before another price decline towards 1.1200. Since then, the EURUSD has been moving-up within the depicted movement channel until bearish breakout occurred by the end of last week's consolidations. Few weeks ago, the price zone of 1.1350 failed to offer sufficient bearish rejection that's why it was bypassed until 1.1500 which applied significant bearish pressure on the pair. A possible SELL Entry was offered upon the previous ascending movement towards 1.1500 which provided significant bearish pressure. Shortly after, the EURUSD looked oversold while approaching the price levels of 1.0850. That's where the recent upside movement was initiated. Any movement towards 1.1200 should be considered for another SELL trade as long as sufficient SELLING pressure is demonstrated. The material has been provided by InstaForex Company - www.instaforex.com |
| April 7, 2022 : EUR/USD Intraday technical analysis and trading plan. Posted: 07 Apr 2022 10:01 AM PDT
Recent bullish pullback towards 1.1650-1.1680 (upper limit of the previous consolidation range) was expected to offer bearish rejection and a valid SELL Entry. Significant bearish decline brought the EURUSD pair again towards 1.1550 levels which failed to provide sufficient BUYERS for too long period. Hence, only a short- term sideway movement was demonstrated around 1.1550 before quick bearish decline could occur towards 1.1200. On the other hand, the price levels around 1.1520 stood as a reference zone that applied significant bearish pressure upon two successive bullish visits. Recent Bearish decline below 1.1100 was considered as a bearish continuation sign. That's why, downside movement was expected to proceed towards 1.1000 then 1.0920 where the recent bullish pullback was initiated. The price levels around 1.1150 ended the recent bullish move and a another bearish move is currently being expressed. However, failure to do so will probably enable more bullish advancement towards 1.1320. The material has been provided by InstaForex Company - www.instaforex.com |
| April 7, 2022 : GBP/USD Intraday technical analysis and significant key-levels. Posted: 07 Apr 2022 09:59 AM PDT
The GBPUSD pair has been moving within the depicted bearish channel since July. Recently, BUYERS were watching the price levels of 1.3730 to have some profits off their trades as it stood as a key-resistance which offered significant bearish rejection recently. The short-term outlook turned bearish when the market went below 1.3600. This enhanced the bearish side of the market towards 1.3400 which brought the pair back towards 1.3600 for another re-test. Hence, the recent bullish pullback towards 1.3600 should have been considered for SELL trades as it corresponded to the upper limit of the ongoing bearish channel. It's already running in profits. Bearish persistence below 1.3090 was needed to enable further downside continuation towards 1.2900 (the lower limit of the movement channel). Instead, bullish rejection has arised many times around 1.3000 standing as a significant Daily Support where the current consolidation range has arised. On the other hand, another bearish breakout below 1.3090 will probably enable more bearish extension at least towards 1.2890. Bullish breakout above 1.3280 can enable quick bullish advancement towards 1.3400 and probably 1.3600. The material has been provided by InstaForex Company - www.instaforex.com |
| Posted: 07 Apr 2022 08:40 AM PDT
EUR/USD is bouncing after bottoming near the level 1/8 Murray at 1.0864. The 4-hour chart shows that the 21 SMA puts the Euro under bearish pressure and receives support at 1/8 Murray for now providing a strong bottom. The minutes of the latest meeting of the Federal Reserve, rethe market is convinced about rate hike of 50 basis points at the next meeting. This information was anticipated by investors and the market turned bearish. Therefore, a week before the FOMC minutes were published, the market sold EUR/USD and it fell to a low of 1.0860. As this information is already known, a recovery of the Euro is expected in the next few days. According to the 4-hour chart, the Euro keeps the bearish bias intact. Only a firm break above 1.0940, where a line resistance crosses there and where the 21 SMA is located, the euro would gain support and a recovery would be expected. The recovery of the euro in the next few days is considered temporary. According to the daily chart, the EMA 200 is located at 1.1397, which suggests a greater fall in the medium term. Therefore, we will have a good opportunity to sell the Euro if it fails to break the 21 SMA located at 1.0940, with targets at 1.0864. Conversely, if the euro bounces off the support at 1.0864, it will be a good opportunity to buy with targets at 1.0940 and 1.1064 (200 EMA). The material has been provided by InstaForex Company - www.instaforex.com |
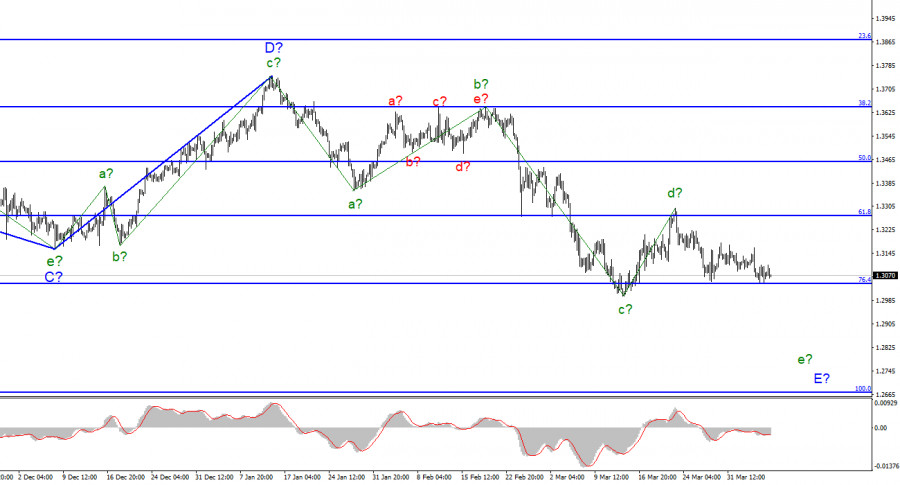
| Analysis of GBP/USD on April 7. James Bullard: the rate should be at 3.5% Posted: 07 Apr 2022 07:49 AM PDT
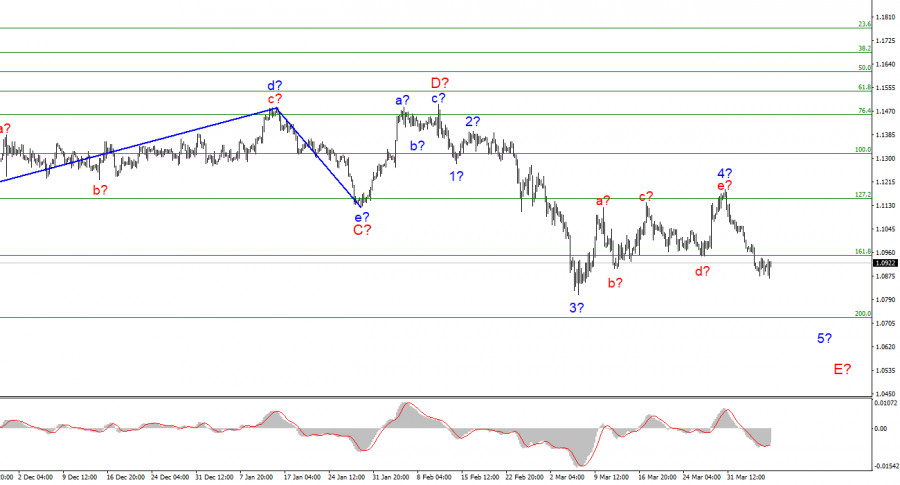
For the pound/dollar instrument, the wave markup continues to look very convincing and does not require any additions. The assumed wave d-E is completed, and there should be five waves in total inside the wave E, respectively, as in the case of the euro/dollar instrument, the downward trend section can continue its construction for some time. Wave d-E can still take a longer three-wave form. This is supported by the fact that wave b-E has taken a five-wave extended form. Also in favor of this is the unsuccessful attempt to break the low wave c-E. Thus, the instrument could not break through the 76.4% Fibonacci level and the construction of a new upward wave may begin. This wave can be corrective, internal in the composition of e-E, or it can be the beginning of c-d-E. In the first case, the decline in the British dollar quotes should resume in the near future, in the second case, the instrument may return to the 1.3274 mark, which corresponds to 61.8% Fibonacci. But one way or another, I expect the construction of a wave e-E, that is, a further lowering of the instrument. The Fed's rhetoric continues to shock the markets. The exchange rate of the pound/dollar instrument on April 7 again practically did not move from its place. The second day in a row. The news background, if we talk about the economy, was practically absent both yesterday and today. Last night, the Fed minutes were released, which resulted in a new attempt to break through the 1.3044 mark, which corresponds to 76.4% Fibonacci, but again unsuccessful. The minutes contained information that indicated the Committee's readiness not only to raise rates at an increased pace but also to begin the process of reducing the Fed's balance sheet, which is $ 8.9 trillion. This is the most "hawkish" information that the market could get. Thus, the demand for the US currency remains high, although it is still impossible to pass through the 1.3044 mark. However, today the president of the St. Louis Fed, James Bullard, even surpassed yesterday's Fed minutes. He said that the US central bank is already very much late in its fight against inflation. The most modest calculations, in his opinion, suggest that the interest rate should be at least 3.5% for the fight against inflation to be effective. "Now it is very important that the Fed approves the presented rate hike program at the next meetings," Bullard said. This information gives the market new food for thought. It gives an upper benchmark to which the Fed can raise the rate. It gives an approximate timeframe during which the rate will increase. It gives an understanding of when inflation will begin to decline approximately. If the neutral rate level is 2.5%, then the impact on inflation will begin no earlier than in 2023. And the rate can be raised to 3.5% no earlier than the second half of 2023. This means that high inflation will persist in the US for at least another year. And if energy prices continue to rise, as in recent months, even more, drastic measures may be needed to lower the consumer price index. General conclusions The wave pattern of the pound/dollar instrument still assumes the construction of wave E. I continue to advise selling the instrument with targets located near the 1.2676 mark, which corresponds to 100.0% Fibonacci, according to the MACD signals "down", since the wave E does not look completed yet. Wave d can take a three-wave form and lengthen - wave b turned out exactly like this, but in any case, we should consider the signals "down", and while wave d continues to build, the MACD indicator is rising.
At the higher scale, wave D looks complete, but the entire downward section of the trend does not. Therefore, in the coming weeks, I expect the instrument to continue to decline with targets well below the low of wave C. Wave E should take a five-wave form, so I expect to see the British quotes around the 27th figure. The material has been provided by InstaForex Company - www.instaforex.com |
| Trading Signal for Gold (XAU/USD) for April 07-08, 2021: buy above $1,922 (200 EMA - 21 SMA) Posted: 07 Apr 2022 07:26 AM PDT
Gold (XAU/USD) continues to consolidate above the 200 EMA and above the 21 SMA on the 4-hour chart. We can observe in the chart the formation of a diamond pattern. If gold breaks the area 1,937, this price acion could confirm this technical pattern and the metal could reach the zone of 1,966. The escalation of the conflict between Russia and Ukraine, punishing Russia with more sanctions, helps provide support to the price of gold. Gold investors await clarity on the Ukraine crisis for a new market sentiment. If the crisis in Ukraine worsens, investors could once again take refuge in gold and it could reach the psychological level of 2,000. Risk aversion was bolstered by a modest pullback in US Treasury yields, which helped gold consolidate and limit losses. The technical picture on the 4-hour chart shows that gold has tested a downtrend line around 1,935 on 3 occasions. A sharp break of this line could give gold a further boost. If it consolidates above 7/8 Murray, the price could go as high as 1,965. 200 EMA and 21 SMA are giving gold strong support. As long as it continues to trade above this level, we would expect gold to continue its rise so that it could reach the zone of 1,937 and 1,945. Our trading plan for the next few hours is to buy gold above 1,922 (200 EMA) or above 1,927 (21 SMA), with targets at 1,937 and 1,966. The eagle indicator supports our bullish strategy. The material has been provided by InstaForex Company - www.instaforex.com |
| Posted: 07 Apr 2022 06:30 AM PDT
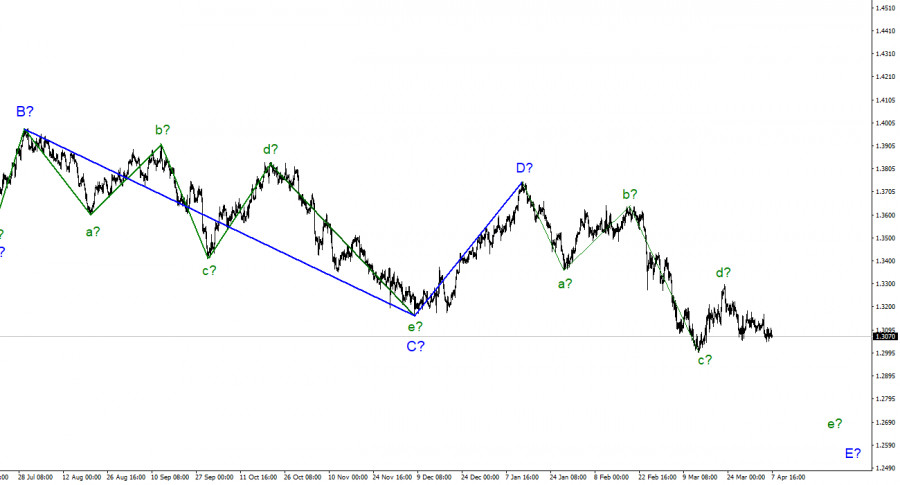
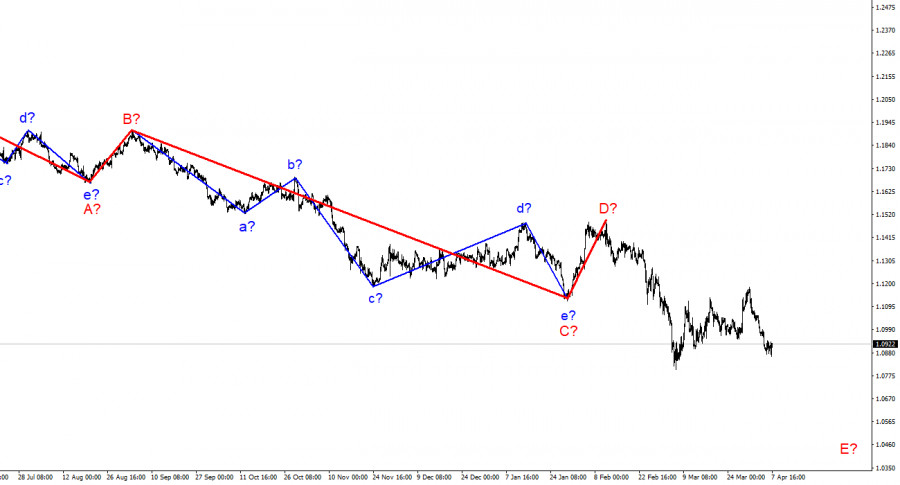
The wave marking of the 4-hour chart for the euro/dollar instrument continues to look convincing. The proposed wave 4 took a five-wave form and turned out to be completely different from wave 2. However, now this wave is recognized as complete, and the wave pattern does not require any changes. Accordingly, the instrument began constructing the proposed wave 5-E. If this assumption is correct, then the decline in the quotes of the euro currency may continue for another one or two months. At the moment, the entire wave structure of the descending trend section looks almost fully equipped, but wave 5-E is likely to also take a five-wave form. If this is the case, then at the moment the construction of only the first wave consisting of 5-E has been completed. Thus, the instrument still has a fairly strong potential for decline. The first target is around 1.0721, which equates to 200.0% Fibonacci. At the same time, much of the instrument will now depend not only on geopolitics but also on gas and oil prices and the further rupture of relations between Russia and the European Union. The European Parliament has said its word, now it's the turn of the European Council and the European Commission. The euro/dollar instrument failed to decline again on Thursday and even added 10 basis points at the time of writing. However, at the same time, it continues to remain within the framework of building a descending wave and a descending trend segment. Therefore, now the euro currency can only count on building a corrective wave. However, this may be hindered by the news background, which continues to pour in a continuous stream from the European Union, the United States, Great Britain, Ukraine, and Russia. The main news of today was the resolution of the European Parliament regarding the imposition of an embargo on Russian oil, gas, nuclear fuel, and coal. 513 MEPs voted "for" the immediate imposition of the embargo, 22 voted "against" and another 13 abstained. This decision, however, does not mean that the embargo will be imposed "just a few days ago." This is just a call to the European Council to start the appropriate procedure. Let me remind you that just yesterday Ursula von der Leyen presented a new, fifth package of sanctions, which, on the one hand, is quite tough, and, on the other hand, was immediately criticized by everyone who could. It provides for a ban on Russian ships entering European ports, a complete embargo on coal from the Russian Federation, disconnection of three Russian banks from SWIFT, personal sanctions against family members of Vladimir Putin, and Sergey Lavrov. However, as it turned out a little later, the embargo on coal will begin to take effect only in August, which raises a reasonable question, why introduce it at all? What is the point of sanctions, which, as they say in the EU, are designed to stop the aggression of the Russian Federation in Ukraine, if they begin to take effect in a few months? In addition, MEPs called for Russia to be excluded from the G-20, the UN Council, Interpol, WTO, and UNESCO. US Treasury Secretary Janet Yellen made similar statements and appeals yesterday. Thus, the sanctions pressure on Moscow continues to increase while Moscow itself does not comment on this information in any way. General conclusions. Based on the analysis, I still conclude that the construction of wave E continues. If so, now is still a good time to sell the European currency with targets located around the 1.0721 mark, which corresponds to 200.0% Fibonacci, for each MACD signal "down". The current wave marking assumes the construction of a wave 5-E, which can also turn out to be very long. In the next few days, a correction wave may begin to build, after which I expect a new decline in the instrument.
On a larger scale, it can be seen that the construction of the proposed wave D has been completed, and the instrument has updated its low. Thus, the fifth wave of a non-pulse downward trend section is being built, which may turn out to be as long as wave C. If this assumption is correct, then the European currency will still decline. The material has been provided by InstaForex Company - www.instaforex.com |
| EUR/USD: Fed's hawkish stance and geopolitical risks Posted: 07 Apr 2022 05:55 AM PDT The minutes of the Fed's March meeting published yesterday turned out to be hawkish: the rhetoric of the document was quite harsh. This fact suggests that the American regulator will decide on a 50-point rate increase not only at the May meeting, but also following the results of the June meeting. In general, the document did not become a sensation – many of the theses mentioned in the text of the protocol were voiced by representatives of the Federal Reserve after the March meeting. In addition, after the March meeting, more recent key data on the labor market and inflation were published. All these releases were on the side of the greenback, reinforcing hawkish expectations. Therefore, the minutes published yesterday only stated an already well-known fact: Fed members are ready for a more aggressive pace of monetary policy tightening.
Fed members signaled at the end of the March meeting that the pace of rate hikes in the current cycle will differ from previous similar cycles. In the minutes of the January meeting, this issue was developed in more detail – it stated that "the members of the Committee consider it appropriate to increase rates faster than after 2015, but on the condition that inflation does not decrease." We are talking about a three-year period of raising the rate from December 2015 to December 2018. The pace of monetary tightening during this period was indeed quite measured. The rate was first raised in December 2015, then in December 2016, then in February, March, June, July, September, and December 2017; and then in March, June, September, and December 2018. During this period, the rate was raised from 0.25% to 2.5%. At the March meeting, the regulator was more forthright. The minutes indicate that many members of the Fed believe that a rate hike of 50 basis points at once "at one or more upcoming meetings" would be justified. Again, unless inflation in the U.S. starts to decline, which is highly unlikely. In other words, the protocol published yesterday confirmed, in particular, the forecasts of Goldman Sachs analysts and many other experts. According to their scenario, the regulator will raise the rate by 50 points twice, in May and June. Then four increases of 25 basis points at each subsequent meeting until the end of this year. Also, Fed members at the March meeting signaled their readiness to start reducing assets on the balance sheet of the Central Bank. Here, too, the Fed is similarly poised to realize a faster pace of balance sheet reduction than it did in the period 2017-2019. The protocol states that the regulator will begin to reduce assets on the balance sheet of the Central Bank in increments of $95 billion per month ($35 billion in mortgage-backed securities and $60 billion in U.S. government bonds). Members of the Committee came to a common opinion that the Fed can agree on a program for the sale of assets already at the May meeting. It is worth noting that most experts previously expected a reduction range of 60 to 90 billion per month. Therefore, the proposed 95 billion move allowed the dollar bulls to feel more confident throughout the market, including against the euro. The U.S. currency is also supported by geopolitical factors. Negotiations between Russia and Ukraine are dragging on, and, apparently, no breakthrough is to be expected in the medium term. This assumption was indirectly confirmed today by the representative of the President of Turkey. He said he did not expect a major breakthrough in the negotiations between Moscow and Kyiv "in the next couple of days or even weeks." The main reason is the lack of consensus between Russia and Ukraine "on certain points of negotiations." However, geopolitical risks are not limited to Eastern Europe. The situation in Asia is also worrisome – the "Taiwan case" is again on the agenda. The day before yesterday, it became known that Taiwan received American weapons and military equipment, U.S. Secretary of Defense Lloyd Austin said. Beijing responded with a strong protest. The official representative of the Chinese Foreign Ministry said the Pentagon's actions are undermining China-US relations and disrupting peace in the Taiwan Strait. The Chinese authorities regard the supply of American weapons to Taiwan as a violation of bilateral agreements and an infringement of the national interests of the PRC. Let me remind you that earlier, Chinese officials have repeatedly stated that the country is ready to use force to prevent movement towards the official independence of Taiwan, which is considered a breakaway province of China. All this suggests that short positions on the EUR/USD pair are still a priority. It is advisable to use corrective upward pullbacks to enter sales. Longs, in turn, are risky, given the favorable fundamental background for the strengthening of the U.S. currency. The first target is 1.0860 (the lower line of the Bollinger Bands indicator on the daily chart). A breakdown of this support level will open the way to the annual price low, that is, to the target of 1.0806. The material has been provided by InstaForex Company - www.instaforex.com |
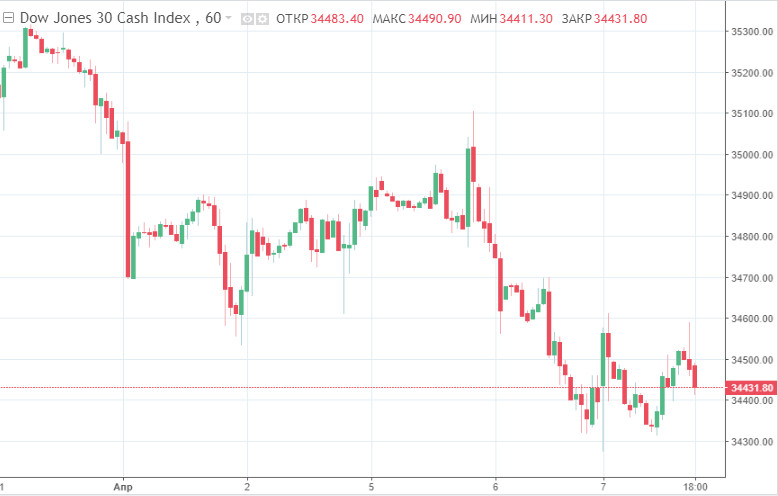
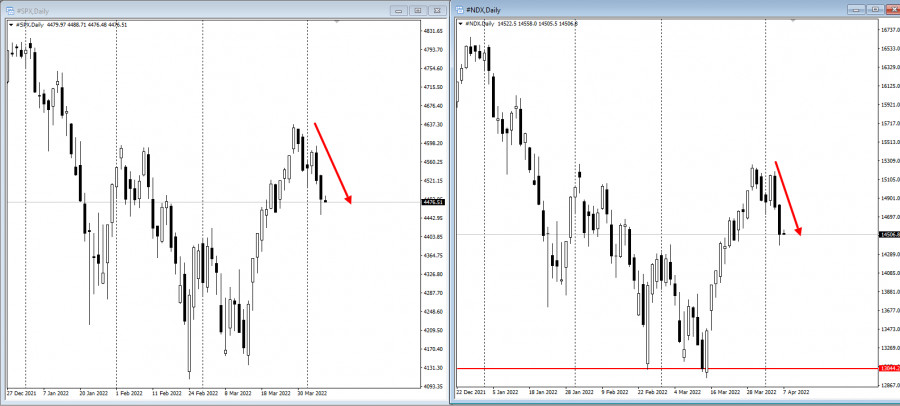
| US stock market down on Wednesday amid tech losses Posted: 07 Apr 2022 05:42 AM PDT Key US stock indexes closed in negative territory on Wednesday, as technology, consumer services and basic materials sectors suffered losses. The Dow Jones Industrial Average lost 0.42%, falling to 34,496.51 points. The S&P 500 slid by 0.97% to 4,481.15 points, while the NASDAQ Composite fell by 2.2% to 13,888.82 points.
The best performers of the session on the Dow Jones Industrial Average were UnitedHealth Group Incorporated (+2.70%), Johnson & Johnson (+2.60%), and Walmart Inc (+2.32%). The worst performers of the session were Salesforce.com Inc (-4.44%), Microsoft Corporation (-3.66%), and Visa Inc Class A (-3.13%). On the S&P 500, the top performers were Eli Lilly and Company (+4.56%), NRG Energy Inc (+4.23%), and Dollar General Corporation (+4.20%). The biggest losers were Norwegian Cruise Line Holdings Ltd (-6.80%), Penn National Gaming Inc (-6.72%), and Caesars Entertainment Corporation (-6.67%). On the NASDAQ Composite, the best performing stocks were Advent Technologies Holdings Inc (+79.70%), Moxian Inc (+39.76%), and Mobiquity Technologies Inc (+29.63%). The worst performing stocks were Guardforce AI Co Ltd (-32.54%), GWG Holdings Inc (-25.14%), and Integrated Media Technology Ltd (-21.44%).
Rising oil prices have boosted the share prices of oil companies, with Occidental Petroleum gaining 0.7%, Chevron Corp increasing by 0.9%, and Exxon Mobil rising by 1.1% Falling stocks outnumbered advancing ones on the New York Stock Exchange by 2,276 to 937; 116 ended unchanged. On the NASDAQ Stock Exchange, 2,788 fell and 1,111 advanced, while 217 ended unchanged. The CBOE Volatility Index, which measures the implied volatility of S&P 500 options, went up by 5.09% to 22.10 points. On Wednesday, market players digested the FOMC March meeting minutes. Earlier, the Fed board members stated they were ready to reduce the balance sheet by $95 billion per month. The majority of Fed policymakers found one or more 50 basis point increases to be appropriate, if inflation continued to rise. According to market analysts, the Fed's aggressive rhetoric could rattle the stock market, which previously withstood the regulator's hawkish moves. The Federal Reserve's monetary tightening is the biggest medium and long term risk for US equities. The material has been provided by InstaForex Company - www.instaforex.com |
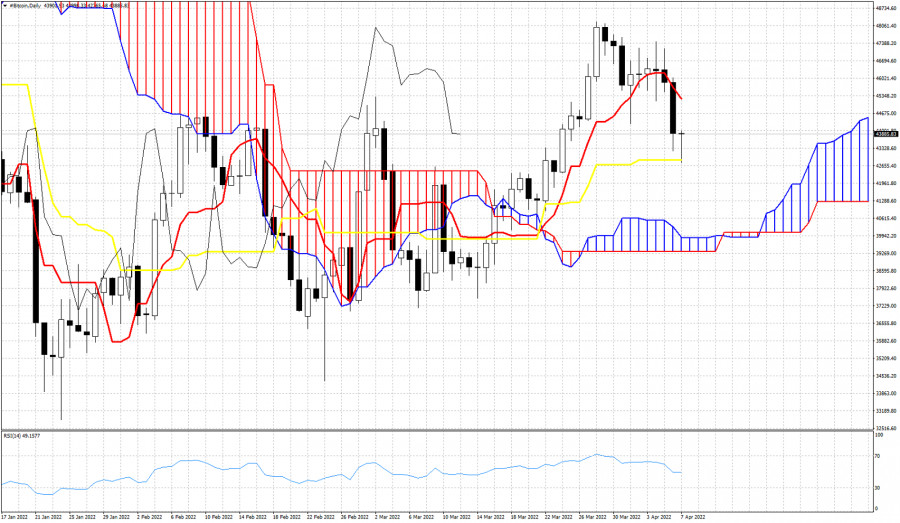
| Ichimoku cloud indicator analysis on Bitcoin. Posted: 07 Apr 2022 05:25 AM PDT Bitcoin made a low today at $42,765 and is now trading around $43,850. Price has formed a bullish reversal hammer pattern although it is still too early to call it. Price is above the Kumo (cloud) in the Daily chart, while price earlier today challenged the kijun-sen (yellow line indicator).
Resistance by the tenkan-sen (red line indicator) is found at $45,240. Bulls need to push above this level in order to add more strength to the bullish momentum. Major resistance is at the recent highs of $47,500. Failure to hold above support at $42,860, will lead to a move towards the cloud support at $39,850. The material has been provided by InstaForex Company - www.instaforex.com |
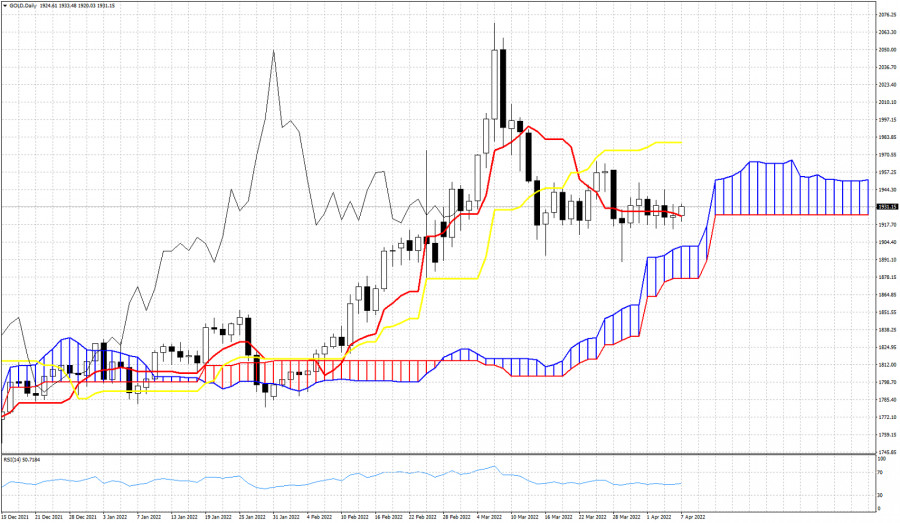
| Ichimoku cloud indicator analysis on Gold for April 7, 2022. Posted: 07 Apr 2022 05:20 AM PDT Gold price is trading around $1,931. Gold price is trading above the tenkan-sen (red line indicator) and is mostly moving sideways. Trend remains bullish in the Daily chart as price continues to stay above the Kumo (cloud).
The kijun-sen (yellow line indicator) is at $1,979. A daily close above the kijun-sen would provide a bullish signal. Support by the Kumo (cloud) is found at $1,900. Bulls do not want to see price break below this level. Instead bulls want to see price eventually break above the kijun-sen and then to see the tenkan-sen cross above the kijun-sen. That is why we keep a close eye on the $1,900 support level and at the $1,979 resistance. The material has been provided by InstaForex Company - www.instaforex.com |
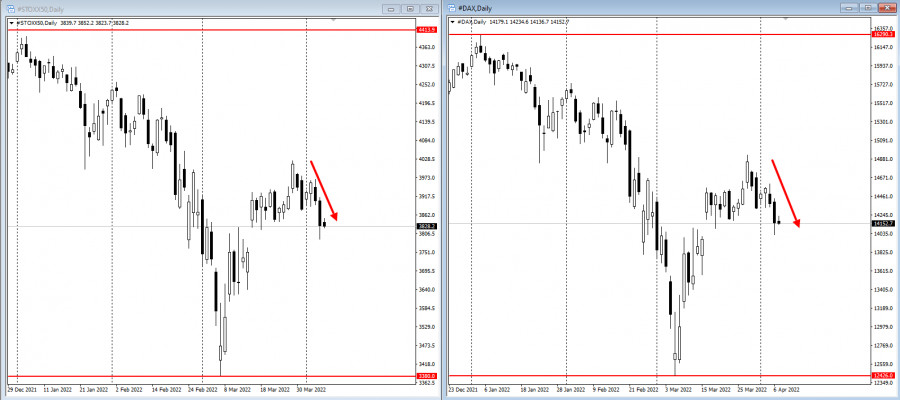
| Global stock markets stumble on aggressive Fed policy Posted: 07 Apr 2022 05:18 AM PDT
Global stock markets tumbled on Wednesday after Fed minutes showed officials were focused on curbing inflation, outlining plans to cut the balance sheet by more than $1 trillion a year. It continued up to today's Asian session, sending the benchmark MSCI down more than 1%. The European Stoxx50 also declined despite a 10% rally in shares of Atlantia SpA.
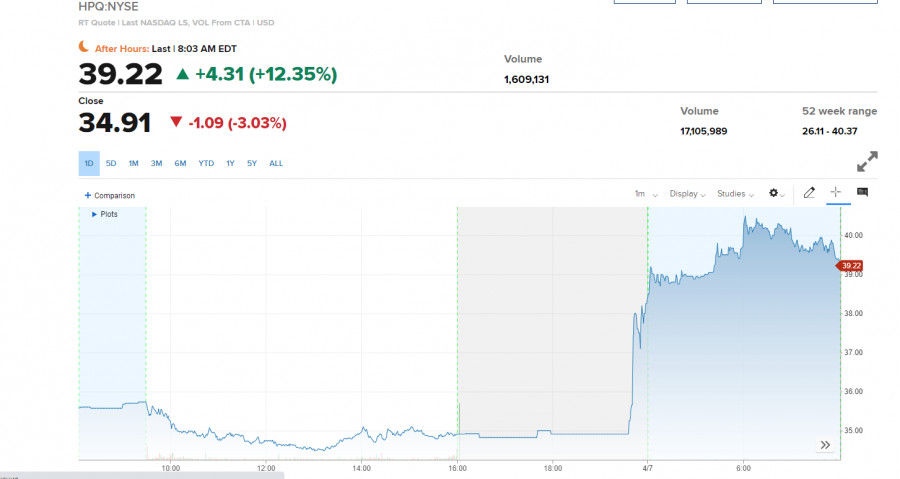
Meanwhile, S&P 500 contracts remained virtually unchanged despite recent corporate events, which include the purchase of an over $4.2 billion stake in HP.
Oil prices, on the other hand, continued to increase, with Brent trading above $102 per barrel. 10-year Treasury yields, meanwhile, fell two basis points to 2.57%.
Clearly, commodity markets are suffering from the disruption caused by the ongoing conflict in Ukraine. Oil prices rose to a very high level, curtailing a slump caused by the International Energy Agency's decision to deploy 60 million barrels of emergency reserves. In China, officials will reportedly use monetary policy tools at "the right time" and consider other measures to stimulate consumption. Key events to watch this week: - speech of Fed members James Bullard, Raphael Bostic and Charles Evans on Thursday; - monetary policy decision of the Reserve Bank of India on Friday. The material has been provided by InstaForex Company - www.instaforex.com |
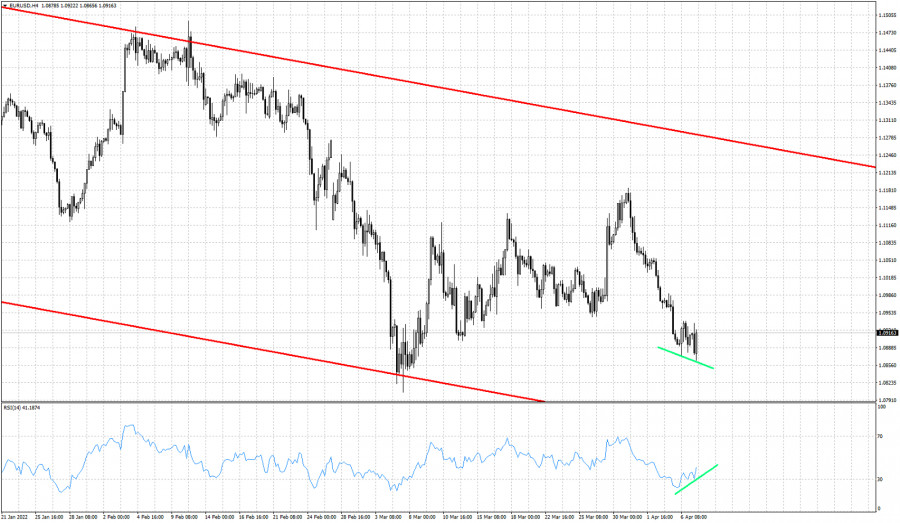
| Short-term technical analysis on EURUSD for April 7, 2022. Posted: 07 Apr 2022 05:17 AM PDT EURUSD remains inside the medium-term bearish channel and short-term trend is also bearish. Price continues making lower lows and lower highs. The RSI has just started providing bullish divergence signals in the 4 hour chart. This is not a reversal signal but a warning to bears.
Green lines- bullish divergence Despite the new lower low in price, the RSI made a higher low and is turning upwards from oversold levels. This is a warning to bears to be cautious as current market conditions justify a reversal in price to the upside. Let's also not forget what we said in yesterday's analysis. EURUSD is approaching the long-term weekly support trend line at 1.0850 area. The material has been provided by InstaForex Company - www.instaforex.com |
| Posted: 07 Apr 2022 05:14 AM PDT Futures on US stock indices rose slightly on Thursday, but this is more likely due to a slight pullback of the market after a series of unprofitable sessions in a row. After reviewing the plans of the Federal Reserve System to tighten monetary policy, which were disclosed in detail in yesterday's minutes of the March meeting, optimism has diminished. Dow Jones Industrial Average futures rose 30 points or 0.1%. S&P 500 futures rose 0.2% and Nasdaq 100 futures rose 0.4%.
Yesterday, the Fed published the minutes of its March meeting, which, although it did not turn out to be something unexpected, however, opened its eyes to how officials are going to deal with the bloated balance sheet. As it became known, the Federal Reserve System is likely to start reducing its balance sheet by $ 95 billion every month. This will further tighten monetary policy, as the central bank plans to further raise interest rates to counter the highest inflation in four decades. The March protocol states that many officials were already in favor of raising rates by half a percent, but still voted to change the rate by a quarter-point in light of Russia's military special operation on the territory of Ukraine. It is noteworthy that Fed policymakers considered several half-point increases at once, which may be appropriate in the future. Immediately after the publication of the protocol, the Dow fell by more than 100 points, while the S&P 500 dropped by 1%, and the Nasdaq Composite technology completely lost another 2.2%. Considering what uncertainty with interest rate increases awaits investors in the future, and everything depends on inflation data in the United States, I expect volatility to persist and further correction of the market to the area of more acceptable levels for purchase, which we will talk about below. Given that the geopolitical situation has deteriorated again, there is much less optimism in the market. Today, there was news that Ukraine has submitted a new draft agreement with Russia, and there is a departure from the proposals made in Istanbul. This was stated by Sergey Lavrov. The Russian Foreign Minister also said that the new version of the agreement does not state that Ukraine's security guarantees apply to Crimea and Sevastopol. The minister also called unacceptable the fact that Ukraine is putting forward all new preconditions. Against this background, crude oil prices rose again after falling in the previous session. US crude added 0.7% to $ 96.94 per barrel, while international Brent crude rose 0.9% to $ 101.95. Weekly data on applications for unemployment benefits in the United States will be released today. An increase of 200,000 is expected. However, it is unlikely that this data will have a serious impact on the markets. Premarket HP Inc shares rose 15% in premarket trading after Warren Buffett's Berkshire Hathaway announced its stake in the technology equipment maker. Most likely, with the opening of the regular session, the demand for shares will remain. Papers JD.com fell 1.1% in the premarket after the news that the company's founder Richard Liu left the post of chief executive officer, and President Xu Lei will become the new CEO. Liu will remain chairman. As for the technical picture of the S&P 500 Yesterday, the bulls missed $ 4,488 and now we need to think about how to return to this level. There is a lot of pessimism, and most likely an unsuccessful attempt to consolidate above $ 4,488 at the beginning of trading will result in another sale. In this case, the bulls will have to defend the nearest support of $ 4,433. Having missed this range, you can say goodbye to growth and it is best in this case to postpone the purchase of a trading instrument to the lows: $ 4,383 and $ 4,319. It is possible to talk about the return of the market under the control of buyers only in case of consolidation above $4,488, which will allow the return potential to reach the nearest resistance of $ 4,539. Its breakdown will open the way to the highs: $ 4,589 and $ 4,637. The material has been provided by InstaForex Company - www.instaforex.com |
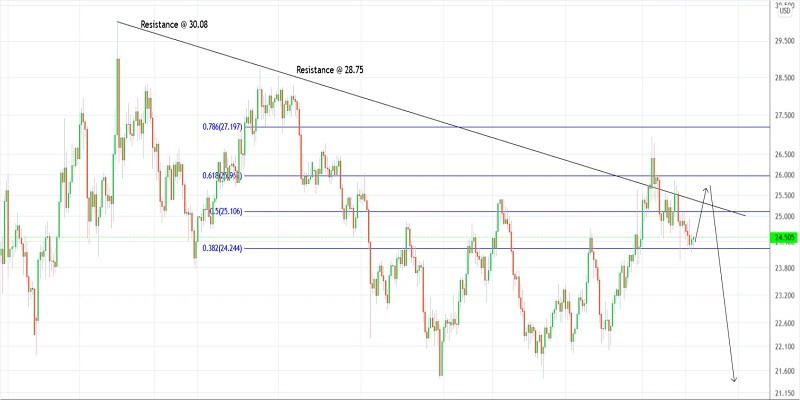
| Trading plan for Silver for April 07, 2022 Posted: 07 Apr 2022 05:09 AM PDT
Technical outlook:Silver is preparing to resume its counter trend rally through $25.85-90 mark, before finding resistance again. The metal is seen to be trading around $24.50 levels at this point in writing after dropping to $24.10 on late Wednesday post FOMC. Bulls are looking inclined to hold prices above the $24.00 mark to keep bullish momentum intact near term. Silver has been in a larger degree downtrend since $30.08 mark and has carved a series of lower lows and lower highs thereafter. The recent downswing is seen between $28.75 and $21.50 levels, which has been retraced up to fibonacci 0.618 levels around $26.90 levels as seen on the chart here. Ideally, Silver prices should stay below $26.95 mark and continue lower towards $21.50 and further as the downswing would unfold. Bears are waiting for the short term counter trend rally to get complete around $25.85 before coming back in control. Also note that prices continue to follow its one year old trend line resistance. Trading plan:Potentil short term rally through $25.85 before turning lower again. Good luck! The material has been provided by InstaForex Company - www.instaforex.com |
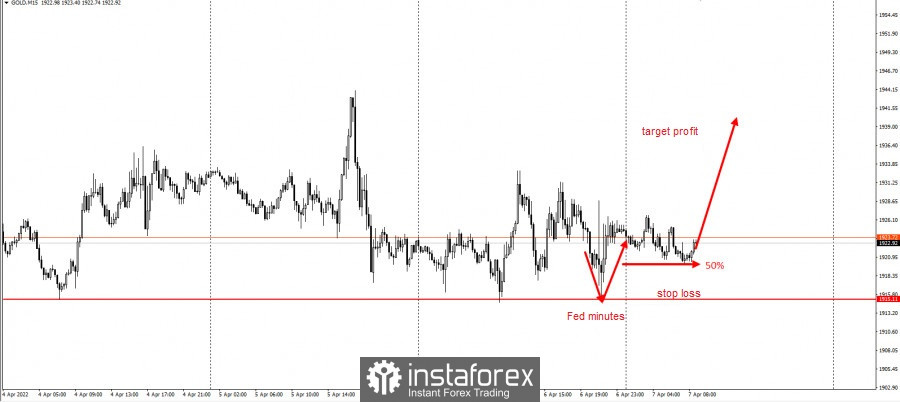
| Posted: 07 Apr 2022 05:06 AM PDT
Gold reacted interestingly to the release of the Fed's minutes of the meeting. It showed multidirectional movements, but by the end of the day closed in a positive area. This scenario signals that it is better to take long positions, more specifically, according to this scheme:
Set stop loss at 1918, and take profit on the breakdown of $1932, $1944, $1950 and $2075.
This trading idea is based on the Price Action and Stop Hunting strategies. Good luck and have a nice day! The material has been provided by InstaForex Company - www.instaforex.com |
| Asian markets drop sharply on Thursday Posted: 07 Apr 2022 05:03 AM PDT
Asian stock indexes dropped sharply during today's session. The Shanghai Composite and the Shenzhen Composite lost 0.99% and 1.43% respectively. The Hang Seng Index decreased by 1.37%, the Nikkei 225 declined by 1.58%, the KOSPI fell by 1.23%, and the S&P/ASX 200 shed 0.58%. On Wednesday, the FOMC March meeting minutes were released, which indicated that the Federal Reserve was considering raising the Fed funds rate by 50 basis points at its meeting in May. As a result, US stock indexes finished yesterday's session in negative territory. Asian indexes followed suit on Thursday. Investors are concerned about the war between Russia and Ukraine, as well as the outbreak of COVID-19 in China. The Chinese government is forced to balance between enacting quarantine measures and overcoming issues plaguing the economy. On the Hang Seng Index, the worst performing stocks of the session were Wuxi Biologics Inc. (-6.1%), Budweiser Brewing Co. APAC, Ltd. (-5.7%), Haidilao International Holding, Ltd. (-4.7%), ENN Energy Holdings, Ltd. (-4.2%), as well as Techtronic Industries Co., Ltd. (-3.6%). Shares of JD.com Inc. lost 3.4%. On the Nikkei 225, the biggest losers were Advantest Corp. (-5.7%), Tokyo Electron, Ltd. (-5.4%), Nippon Sheet Glass Co., Ltd. (-5%), Pacific Metals Co., Ltd. (-4,6%). Hitachi, Ltd. and Honda Motor Co., Ltd. fell by 4.3% and 4.1% respectively. On the KOSPI, LG Corp decreased by 2.1%. Shares of Samsung Electronics Co. lost 0.6%, despite a strong Q1 forecast. The company estimated that its revenue rose by 17.8%. According to the forecast, Samsung's operating earnings went up by 50.3%. Kia Corp. shares gained 0.3%, while Hyundai Motor Co., Ltd. stock lost 0.3%. According to the Australian Bureau of Statistics, Australia had a trade surplus of A$7.465 billion (equivalent to $5.61 billion) in February 2022. Economists had expected a surplus of about A$12 billion in February. Imports increased by 12% over the month, while exports rose by only 0.2%. Shares of BHP Group Ltd. and Rio Tinto Ltd. fell by 0.4% and 0.2% respectively. The material has been provided by InstaForex Company - www.instaforex.com |
| Fed has taken a more aggressive policy Posted: 07 Apr 2022 04:56 AM PDT The release of the Fed's minutes of the meeting led to a surge in volatility in the forex market and a more serious drop in the US stock market. Considering that expectations almost coincided with the final results, pressure on both euro and pound was restrained. The strong oversold position of the euro and the tight position of pound buyers around 1.3050 also limited the downward potential of both currencies.
Reportedly, the Federal Reserve will cut its balance sheet by $95 billion every month, which will further tighten monetary policy, as the central bank already planned to raise interest rates to counter sky-high inflation. According to the latest Fed minutes, many officials were already in favor of increasing rates by half a percentage point, but still voted for changing it by a only quarter point in light of the ongoing conflict in Ukraine. As for the Fed's balance sheet, officials have proposed to start reducing it by $60 billion (Treasury bonds) and $35 billion (mortgage-backed securities) every month, which is twice as high as what the market expected. If both moves really happen, there will be a sharp reversal in the fight against inflation because the central bank bought bonds last month, trying to make the economy's landing smoother. Despite that, many still expect to see the Fed to approve the balance sheet cut at its next meeting on May 3-4, as well as a raise in interest rates by 0.5%. Fed officials practically confirmed this earlier, for example, when San Francisco Fed President Mary Daly said the Fed will use its tools to fight inflation with all its might. Lael Brainard made similar statements, saying that interest rate hikes could take place at a more aggressive pace than the usual 0.25 percentage point increase. Fed officials also agree that they already made significant progress on their goals, so they believe that it is safe to reduce the size of the balance sheet. In the event of further increase in price pressure, one or more more aggressive interest rate increases of 50 basis points would be appropriate.
Now, the main goal of the Federal Reserve is to return inflation to a neutral rate, that is, a level that does not accelerate or slow down economic activity. They said that depending on economic and financial developments, a move to a tougher policy could be justified. After all, CPI in February 2022 already rose by 7.9%, which is the highest since 1982. The Fed's 2% inflation target is based on a separate measure, the Personal Consumption Price Index, which rose 6.4% in the 12 months to February. Technical analysis of EUR/USD Tensions in Ukraine have risen again to a fairly serious level. Given the aggressiveness of the Fed's policy, it is best to bet on the further strengthening of dollar. At most, euro buyers need a break above 1.0925 to get the market back under their control. That move will lead to a rise to 1.0970 and 1.1010. In case of a decrease in the pair, buyers will be able to count on support in 1.0880. Its breakdown will quickly push the quote to 1.0840 and 1.0770. Technical analysis of GBP/USD Pound remains in a wide side channel, and in order to continue rising, bulls need to think about how to return the resistance at the bottom of the 31st figure. A break of this range will open the way to 1.3135, and then to 1.3165, which is the upper limit of the sideways channel. But if the bears break through 1.3060 and go beyond the lower range, the apir will dip to 1.3000 and 1.2960. The material has been provided by InstaForex Company - www.instaforex.com |
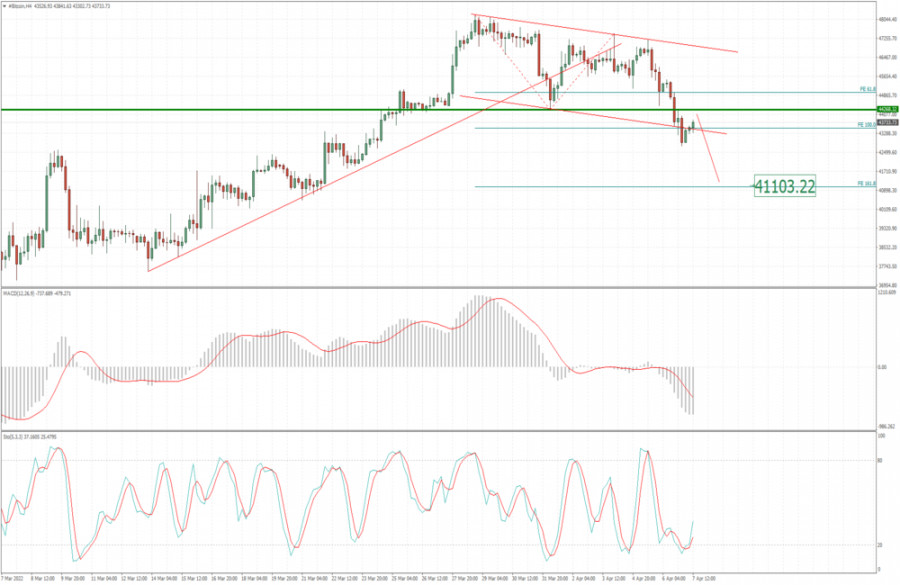
| BTC update for April 07,.2022 - Potential for downside continuation Posted: 07 Apr 2022 04:53 AM PDT Technical analysis:
BTC has been trading downside in the background and I see potential for the downside continuation towards next lower reference points. Trading recommendation: Due to strong selling pressure and weak rally today, I see potential for the downside continuation. Watch for potential selling opportunities on the rallies with the downside objective at the price of $41.000. Stochastic oscillator is showing oversold condition but MACD is still in strong downside momentum. Resistance level is set at $44.300 The material has been provided by InstaForex Company - www.instaforex.com |
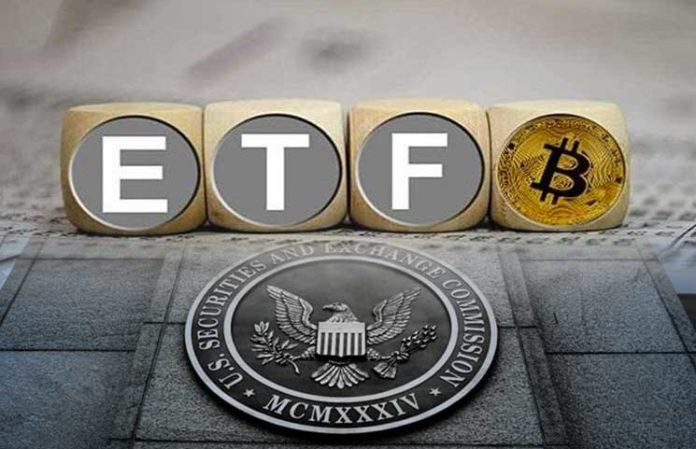
| Bitcoin: SEC's argument against spot ETF 'significantly weakened' Posted: 07 Apr 2022 04:53 AM PDT Last year, the U.S. SEC approved a Bitcoin futures ETF for the first time. Then this event became a catalyst for the growth of the main cryptocurrency to an all-time high of almost $70,000. After that, they began to talk that the next step would be the SEC's approval of the Bitcoin spot ETF. Time goes by, how are things in this direction? SEC's Stance Against Spot ETF WeakensThe Grayscale Fund does not give up trying to be one of the first to register an ETF for spot Bitcoin. But so far they have not been able to get approval. Nevertheless, CEO Michael Sonnenshein said that the SEC's argument against an exchange-traded fund that will directly track Bitcoins has "significantly weakened." Sonnenshein cited the recent regulatory approval of a Bitcoin futures ETF as a key factor behind his reasoning. The U.S. Securities and Exchange Commission on Wednesday allowed NYSE fund managers Arca and Teucrium to launch a bitcoin futures ETF. This is the fourth approved fund after Grayscale, VanEck, and Valkyrie. However, the regulator has repeatedly rejected proposals for a spot Bitcoin ETF, citing concerns about investor protection and uncertainty about the classification of cryptocurrencies. Grayscale is ready to sue the SECIn a series of tweets, Sonnenshein noted the controversy in the recent SEC approval of the Teucrium ETF. In his opinion, it weakens the argument against the spot ETF. The regulator has repeatedly invoked investor protection mandates from the 1940 law to reject applications for a spot ETF. But it is known that Teucrium ETF is registered under another bill from 1933. This indicates that the SEC's reference to the 1940 act may be less valid. Sonnenshein noted that Grayscale will now follow this line of reasoning in its bid for a Bitcoin Spot ETF. Earlier, Grayscale CEO argued that if the SEC approves a bitcoin futures ETF, then the Commission should also approve a bitcoin spot ETF. And they can no longer reasonably invoke the 1940 Act as a limiting factor. Grayscale has also threatened to sue the SEC if its next offer to register a Bitcoin spot ETF is rejected. The fund has repeatedly lobbied for approval of its spot ETF, even providing public comments on its application, which is currently under review. Can we expect spot ETFs in the U.S. in 2022?Canada and Europe have already allowed trading in products that directly track digital assets. These derivatives have proven to be vital in attracting institutional capital into cryptocurrencies. The SEC has yet to soften its rhetoric on cryptocurrencies and a direct public ETF. But with the growing adoption of this asset class and friendly federal regulation, the regulator may eventually change its tone. President Joe Biden's executive order last month was hailed as a major step forward in regulating the crypto industry in the U.S. Additionally, U.S. federal agencies will now cooperate in enacting "constructive" regulation of cryptocurrencies. Thus, there are hopes for the approval of spot ETFs, but it is still difficult to predict the timing. However, the expectation factor alone, as we saw it in 2021, can push the cryptocurrency market higher. Nevertheless, now the information field for this is still weak. But the very fact of creating ETFs on spot Bitcoin will open the way for institutional capital to the market, creating demand for the main cryptocurrency and pushing its price up.
|


| You are subscribed to email updates from Forex analysis review. To stop receiving these emails, you may unsubscribe now. | Email delivery powered by Google |
| Google, 1600 Amphitheatre Parkway, Mountain View, CA 94043, United States | |


Comments