Forex analysis review
Forex analysis review |
- April 20, 2022 : EUR/USD daily technical review and trading opportunities.
- XRPUSD continues to trade sideways since February.
- April 20, 2022 : EUR/USD Intraday technical analysis and trading plan.
- April 20, 2022 : GBP/USD Intraday technical analysis and significant key-levels.
- Ichimoku cloud indicator analysis on Gold for April 20, 2022.
- Forex forecast 04/20/2022 EUR/USD, USD/CAD, USDX, SP500 and Bitcoin from Sebastian Seliga
- Dollar index pulls back.
- Ichimoku cloud indicator analysis on EURUSD.
- How to trade the EUR/USD currency pair on April 21? Simple tips and analysis of deals for beginners.
- GBP/USD analysis on April 20. The pound cheered up a little on the news about the resumption of negotiations between Russia
- GBP/USD analysis on 21 April
- EUR/USD hot forecast on 20th April
- Most Asian indices rise slightly
- Wave analysis of EUR/USD on April 20. Kyiv and Moscow playing table tennis
- Technical analysis of GBP/USD for April 20, 2022
- Forecast for GBP/USD on April 20. For the third time in the last 8 days, the pound bounced off from 1.2980.
- EUR/USD outlook for April 20. Euro faces crisis
- US premarket on April 20, 2022
- Technical analysis of EUR/USD for April 20, 2022
- Evident reasons for uptrend in gold and bitcoin
- EUR/USD: Waiting for decisive debates in France and progress in Russia-Ukraine peace talks
- Trading plan for Silver for April 20, 2022
- Trading plan for GBPUSD for April 20, 2022
- Bitcoin has completely lost its status as a "fighter against inflation", but this does not prevent it
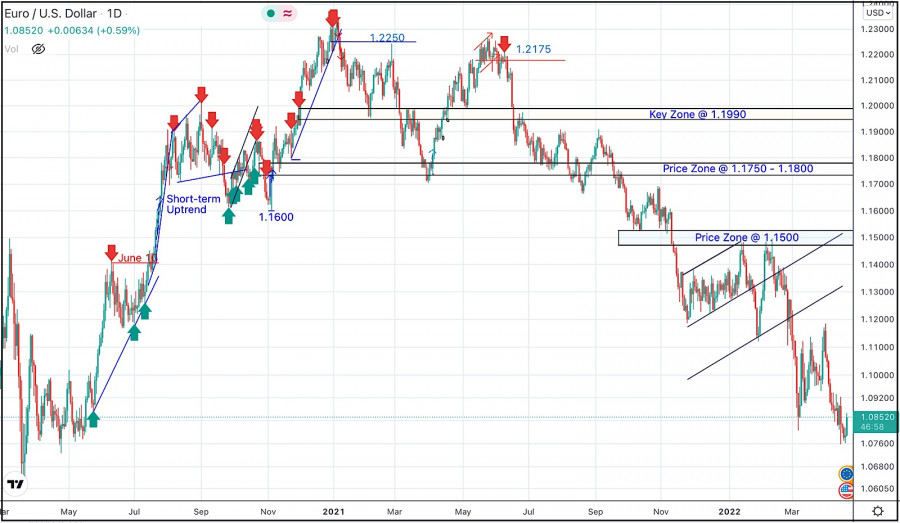
| April 20, 2022 : EUR/USD daily technical review and trading opportunities. Posted: 20 Apr 2022 02:51 PM PDT
Few Months ago, the EURUSD pair has been moving above the price levels of 1.1750-1.1800. In late September, Re-closure below the price level of 1.1700 has initiated another downside movement towards 1.1500. Price levels around 1.1700 managed to hold prices for a short period of time before another price decline towards 1.1200. Then the EURUSD has temporarily moved-up within the depicted movement channel until downside breakout occurred recently. Since then, the price zone around 1.1500 has been applying significant SELLING pressure on the pair where a valid SELL Entry was offered upon the previous ascending movement towards it. Shortly after, the EURUSD looked oversold while approaching the price levels of 1.0850. That's where the recent upside movement was initiated. Any movement towards 1.1200 should be considered for another SELL trade as long as sufficient SELLING pressure is demonstrated. The material has been provided by InstaForex Company - www.instaforex.com |
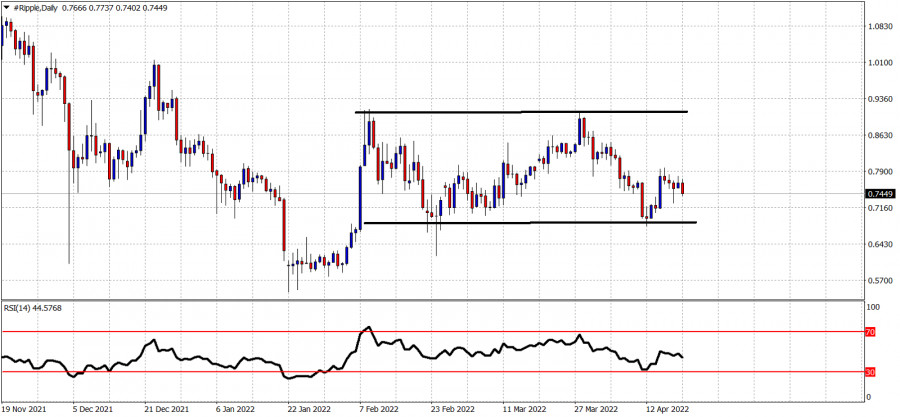
| XRPUSD continues to trade sideways since February. Posted: 20 Apr 2022 01:39 PM PDT XRPUSD is trading around $0.74 today, near the middle of the trading range it has been in for the last two and a half months. Price has made no real progress and that is why traders should be cautious.
XRPUSD is trapped inside the trading range as shown in the Daily chart above. Support is at $0.68 and resistance at $0.91. Until any of these levels breaks, traders need to be very cautious. Keep in mind also the long-term triangle pattern. This increases the importance of the $0.91 resistance. The material has been provided by InstaForex Company - www.instaforex.com |
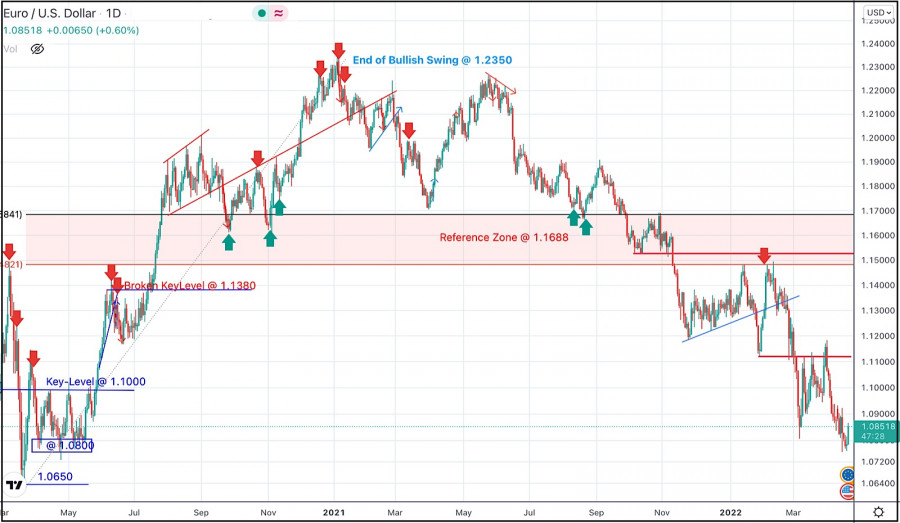
| April 20, 2022 : EUR/USD Intraday technical analysis and trading plan. Posted: 20 Apr 2022 01:28 PM PDT
Recent bullish pullback towards 1.1650-1.1680 (upper limit of the previous consolidation range) was expected to offer bearish rejection and a valid SELL Entry. Significant bearish decline brought the EURUSD pair again towards 1.1550 levels which failed to provide sufficient BUYERS for too long period. Hence, only a short- term sideway movement was demonstrated around 1.1550 before quick bearish decline could occur towards 1.1200. On the other hand, the price levels around 1.1520 stood as a reference zone that applied significant bearish pressure upon two successive bullish visits. Recent Bearish decline below 1.1100 was considered as a bearish continuation sign. That's why, downside movement was expected to proceed towards 1.1000 then 1.0920 where the recent bullish pullback was initiated. The price levels around 1.1150 ended the recent bullish move and a another bearish move is currently being expressed. However, failure to record a new LOW below 1.0850 will probably enable more bullish advancement at least towards 1.1320. The material has been provided by InstaForex Company - www.instaforex.com |
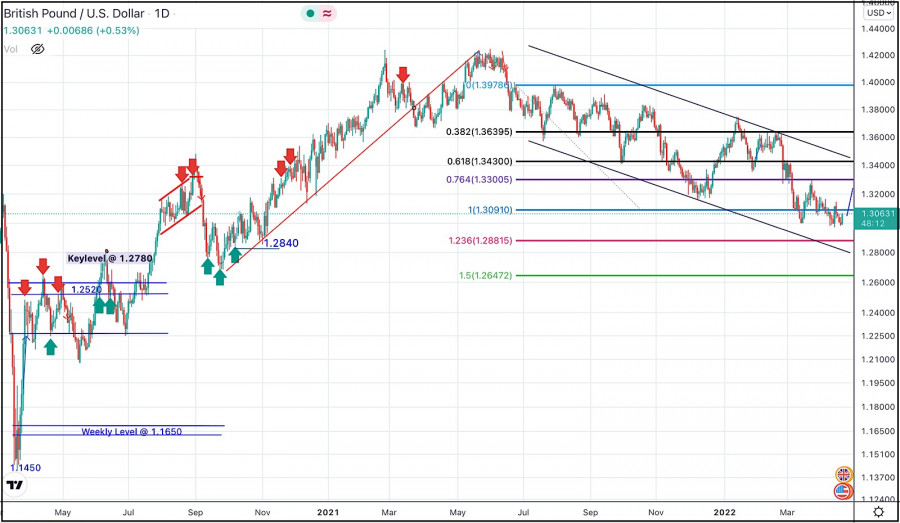
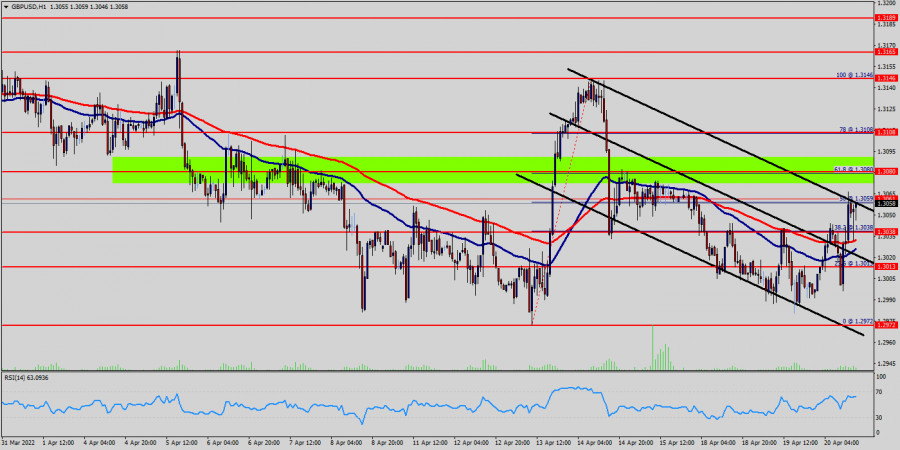
| April 20, 2022 : GBP/USD Intraday technical analysis and significant key-levels. Posted: 20 Apr 2022 01:26 PM PDT
The GBPUSD pair has been moving within the depicted bearish channel since July. Recently, BUYERS were watching the price levels of 1.3730 to have some profits off their trades as it stood as a key-resistance which offered significant bearish rejection recently. The short-term outlook turned bearish when the market went below 1.3600. This enhanced the bearish side of the market towards 1.3400 which brought the pair back towards 1.3600 for another re-test. Hence, the recent bullish pullback towards 1.3600 should have been considered for SELL trades as it corresponded to the upper limit of the ongoing bearish channel. It's already running in profits. Bearish persistence below 1.3090 was needed to enable further downside continuation towards 1.2900 (the lower limit of the movement channel). Instead, bullish rejection has arised many times around 1.3000 standing as a significant Daily Support where the current consolidation range has arised recently. However, bearish persistence below 1.3090 will probably enable more bearish extension at least towards 1.2890 unless bullish breakout above 1.3280 is achieved. This abolishes the bearish scenario and may enable quick bullish advancement towards 1.3400 and probably 1.3600 if sufficient bullish momentum is expressed. The material has been provided by InstaForex Company - www.instaforex.com |
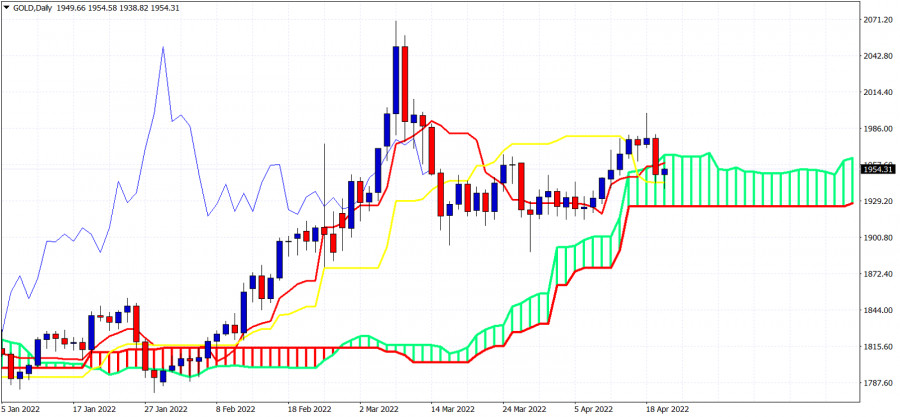
| Ichimoku cloud indicator analysis on Gold for April 20, 2022. Posted: 20 Apr 2022 01:21 PM PDT Gold price pulled back today as expected and as we warned bulls it would. Price had broken the short-term support indicators (tenkan-sen and kijun-sen). Price reached as low as $1,938 earlier today.
|
| Forex forecast 04/20/2022 EUR/USD, USD/CAD, USDX, SP500 and Bitcoin from Sebastian Seliga Posted: 20 Apr 2022 01:05 PM PDT Let's take a look at the technical picture of EUR/USD, USD/CAD, USDX, SP500 and Bitcoin. The material has been provided by InstaForex Company - www.instaforex.com |
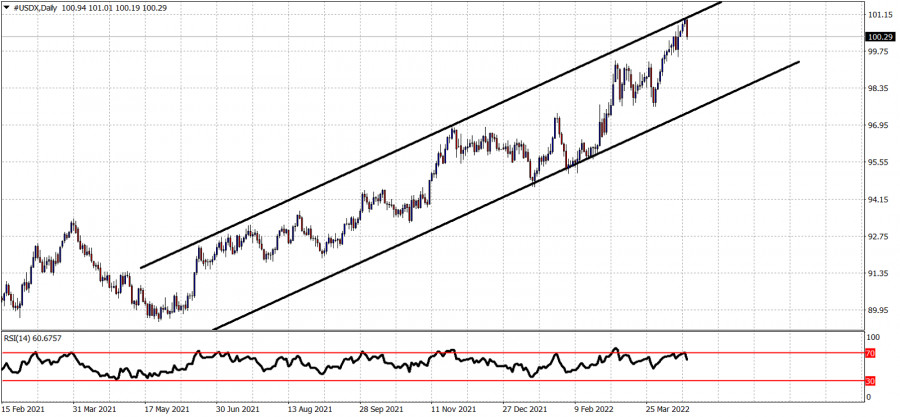
| Posted: 20 Apr 2022 01:03 PM PDT In previous posts we noted that we prefer to be neutral than bullish in the Dollar index because the upside potential is limited. Price is turning lower and this could be the start of a bigger pull back.
Technically trend remains bullish as price continues to trade inside the upward sloping channel. Price continues to form higher highs and higher lows. The bearish RSI divergence was the first warning. We noted that a pull back was justified. With a high at 101, price is now just above the 100 price level. There is potential for a move much lower towards 98-97. Bulls need to be very cautious. The material has been provided by InstaForex Company - www.instaforex.com |
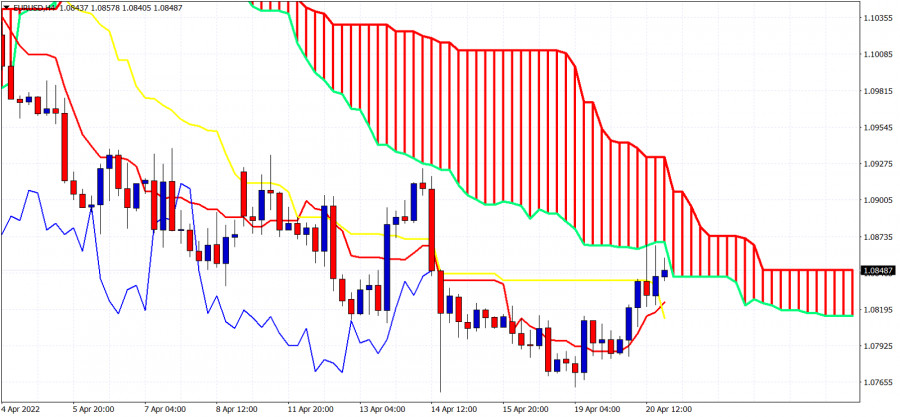
| Ichimoku cloud indicator analysis on EURUSD. Posted: 20 Apr 2022 12:59 PM PDT EURUSD yesterday gave us the first sign of strength by closing the 4 hour candlestick above the tenkan-sen. In previous posts we noted that a bounce higher was justified. Price reached the first important resistance level at 1.0870.
|
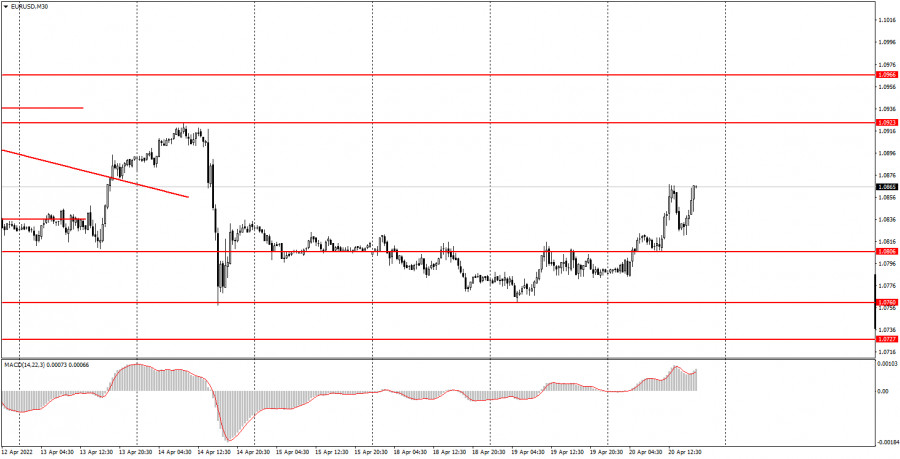
| How to trade the EUR/USD currency pair on April 21? Simple tips and analysis of deals for beginners. Posted: 20 Apr 2022 09:38 AM PDT Analysis of transactions Wednesday: 30M chart of the EUR/USD pair.
The EUR/USD currency pair on Wednesday, quite unexpectedly for many, did not continue its downward movement but began a long-awaited correction. During the day, the European currency rose by 80 points, which is much more than there was volatility on Monday or Tuesday. It cannot be said that there were a large number of important macroeconomic statistics or fundamental events on Wednesday. We can say that it was not at all. Neither the first nor the second. The report on industrial production in the European Union can hardly be considered an important event. And in any case, at the time of its publication, the pair has already begun to grow and has not yet begun to fall. Thus, there was no market reaction to it. And there were no other events scheduled for Wednesday. Even minor ones. The Fed's Beige Book economic review will be published tonight, but by that time traders will already have to close all transactions on the intraday system. This report rarely provokes a reaction in the market. As a result, the euro currency began to adjust, but so far this correction does not make it possible to count on a strong strengthening. We would start counting on the strong growth of the euro no earlier than overcoming the level of 1.0923. 5M chart of the EUR/USD pair. In a 5-minute timeframe, the technical picture does not look the best. Mainly because during the day the pair also showed a fairly strong segment of the downward movement. Therefore, there was a trend, but there was also a strong pullback that confused all the cards. It should also be noted that today's maximum has not yet been formed, but it may act tomorrow as one of the levels near which signals are formed. Now let's move on to today's signals. The first buy order was formed at the beginning of the European session when the price bounced almost perfectly from the level of 1.0806. After that, it overcame the level of 1.0837 and went up about 25 more points. Total - 50 points after signal formation. Since the nearest target level of 1.0905 is far enough away, this transaction could be closed manually. It would be naive to count on the volatility of 120 points out of the blue. The next sell signal near the 1.0837 level turned out to be false. The pair was able to go down only 6 points after its formation. It brought a loss to the newcomers. But the next buy signal could compensate for the loss on the previous deal, as the pair went up about 20 points and stopped near the previous local high of the day. In any case, a couple of dozen points of profit could be earned today. How to trade on Thursday: On the 30-minute timeframe, the trend remains downward, despite the increase in quotes today. So far, this is not even a correction, it is a pullback since the pair failed to overcome the 1.0760 level twice. However, in the near future, the fall of the European currency may resume, since nothing has changed for it in fundamental, geopolitical, and macroeconomic terms. On the 5-minute TF tomorrow, it is recommended to trade by levels 1.0727, 1.0760, 1.0806, 1.0837, 1.0905, and 1.0923. When passing 15 points in the right direction, you should set the Stop Loss to breakeven. On Thursday, the European Union will publish an inflation report for March, but this is only the second, final value of this indicator. The market has already won back the increase to 7.5% y/y. Also in the afternoon, there will be speeches by Christine Lagarde and Jerome Powell, which can quite strongly affect the movement of the euro/dollar pair. Basic rules of the trading system: 1) The strength of the signal is calculated by the time it took to generate the signal (rebound or overcome the level). The less time it took, the stronger the signal. 2) If two or more trades were opened near a certain level on false signals, then all subsequent signals from this level should be ignored. 3) In a flat, any pair can form a lot of false signals or not form them at all. But in any case, at the first signs of a flat, it is better to stop trading. 4) Trade transactions are opened in the period between the beginning of the European session and the middle of the American session when all transactions must be closed manually. 5) On a 30-minute TF, signals from the MACD indicator can be traded only if there is good volatility and a trend, which is confirmed by a trend line or a trend channel. 6) If two levels are located too close to each other (from 5 to 15 points), then they should be considered as a support or resistance area. What's on the charts: Price support and resistance levels - the levels that are the targets when opening purchases or sales. Take Profit levels can be placed near them. Red lines - channels or trend lines that display the current trend and show in which direction it is preferable to trade now. MACD indicator (14, 22, 3) - a histogram and a signal line – an auxiliary indicator that can also be used as a signal source. Important speeches and reports (always contained in the news calendar) can greatly influence the movement of a currency pair. Therefore, during their exit, it is recommended to trade as carefully as possible or exit the market to avoid a sharp price reversal against the previous movement. Forex beginners should remember that every trade cannot be profitable. The development of a clear strategy and money management are the keys to success in trading over a long period. The material has been provided by InstaForex Company - www.instaforex.com |
| Posted: 20 Apr 2022 09:06 AM PDT
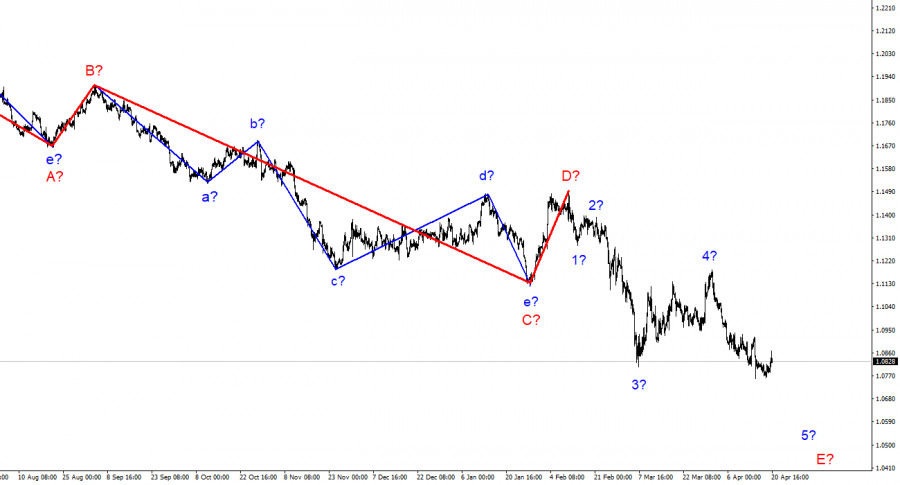
For the pound/dollar instrument, the wave markup continues to look very convincing, even taking into account the unexpected growth last week. The assumed wave d-E is completed, and there should be five waves in total inside the wave E, respectively, as in the case of the euro/dollar instrument, the downward trend section can continue its construction for some time within the wave e-E. An unsuccessful attempt to break through the low wave c-E does not allow the market to continue selling the instrument. Near this mark, the instrument turned sharply upwards and began a powerful increase, which also quickly ended. Thus, the wave e-E should be more extended than it is now. Since the low of the supposed wave c-E is still broken, then theoretically the wave e-E can end at any moment. However, I still expect that the decline in the British dollar within this wave will be much stronger, given the current situation in Ukraine and the economic background in the UK, USA, and Europe. I am not considering alternative options for wave marking yet, but I admit that in the near future the downward section of the trend may complete its construction. Moscow has sent new proposals to Kyiv The exchange rate of the pound/dollar instrument increased by 60 basis points on April 20. Thus, the instrument moved away from the previously achieved low and once again failed to continue building the proposed wave e-E. The longer the construction of this wave is delayed, the higher the chances that the entire downward trend section will be completed. After all, his last wave is being built now. Nevertheless, I believe that the market is still not counting on the purchases of a Briton or a European. The news background remains quite negative for these currencies. Today, during the day, a message was received from Dmitry Peskov about new proposals to Kyiv for a peaceful settlement of the conflict. A little later, Mikhail Podolyak commented on this message and said that the proposal would be considered. And although the chances of peace are catastrophically small, the market still reacted to this news, which gives a little hope. Let me remind you that the deterioration/continuation of the Ukrainian-Russian conflict is a downward factor for both instruments. But any news indicating an improvement in the situation can increase demand for the euro and the pound. My opinion is that there is absolutely nothing to be happy about right now. Negotiations between Kyiv and Moscow have officially stalled. And even if this did not happen, many issues cannot find compromise between the parties. Thus, you can continue negotiations as long as you like, but Moscow will not give up Crimea, and Kyiv will not recognize Crimea as Russian. I believe that the special operation will continue for a very long time, and negotiations are hoping for good luck. According to many military analysts, everything will be decided on the battlefield. Negotiations that can produce results are possible only after the battle in the Donbas, which began a few days ago and whose purpose is to define the Luhansk and Donetsk regions along their administrative borders, is over. General conclusions The wave pattern of the pound/dollar instrument still assumes the construction of wave E. I continue to advise selling the instrument with targets located around the 1.2676 mark, which corresponds to 100.0% Fibonacci, according to the MACD signals "down", since the wave e-E does not look fully equipped yet. Maybe this wave won't be too long, but it doesn't look complete right now.
On the higher scale, wave D looks complete, but the entire downward section of the trend does not. Therefore, in the coming weeks, I expect the instrument to continue to decline with targets well below the low of wave C. Wave E should take a five-wave form, so I expect to see the British quotes around the 27th figure. The material has been provided by InstaForex Company - www.instaforex.com |
| Posted: 20 Apr 2022 09:00 AM PDT
GBP/USD regained its traction after dipping below 1.3000 earlier in the day but faced resistance near 1.3070. The pair consolidates its gains around mid-1.3000s as the greenback stays under bearish pressure ahead of Fedspeak. Earlier in the day, GBP/USD fell sharply after rising toward 1.3050 (static level, 50-period SMA), highlighting the importance of this resistance. In case the pair rises above that level and starts using it as support, it could target 1.3070 (100-period SMA) and 1.3100 (200-period SMA next). On the downside, 1.3000 (psychological level, static level) aligns as key support. A daily close below that level could bring in sellers and cause the pair to fall toward 1.2970 (April 13 low) and 1.2920 (static level). The material has been provided by InstaForex Company - www.instaforex.com |
| EUR/USD hot forecast on 20th April Posted: 20 Apr 2022 08:59 AM PDT
EUR/USD has regained its traction and advanced above 1.0850 after retreating toward 1.0820 in the early American session. With the benchmark 10-year US T-bond yield falling more than 2% on the day, the greenback continues to weaken against its rivals and helps the pair edge higher. The EUR/USD pair is up for a second consecutive day but far from turning bullish. It has briefly surpassed the 23.6% retracement of its latest daily decline measured between 1.1184 and 1.0756 at 1.0856, an immediate resistance level. The next Fibonacci retracement comes at 1.0920, and recovery beyond it could put the pair on a near-term bullish path. Technical readings in the daily chart suggest that the risk is skewed to the downside. The 20 SMA heads are firmly lower, converging with the 38.2% retracement of the aforementioned decline, as technical indicators recover from near oversold readings, still well below their midlines. The 4-hour chart shows favors another leg north, particularly if the pair moves above the aforementioned Fibonacci resistance. The pair is developing above a now flat 20 SMA, while the longer ones maintain their bearish slopes well above the current level. Technical indicators, in the meantime, are neutral-to-bullish within positive levels, reflecting absent selling interest at the time being. Support levels: 1.0795 1.0760 1.0720 Resistance levels:1.0865 1.0920 1.0970 The material has been provided by InstaForex Company - www.instaforex.com |
| Most Asian indices rise slightly Posted: 20 Apr 2022 07:06 AM PDT
Most of the major Asian indices are showing slight growth in today's trading. Thus, Hong Kong Hang Seng Index added 0.72%, the Japanese Nikkei 225 gained 0.94%, Australian S&P/ASX 200 gained 0.28%, and the Korean KOSPI gained only 0.11%. At the same time, the Chinese Shanghai Composite and Shenzhen Composite indices declined by 0.21% and 0.37% respectively. Asia-Pacific region indices traditionally follow the US indicators' suit. Thus, the main US stock exchange indicators closed with growth yesterday on the background of favorable statistical data. Thus, the US housing construction rose by 0.3% in March. According to experts' forecasts, this indicator should have decreased rather than increased. The second positive moment was good corporate reports of companies for Q1 2022. This gives investors hope that they will be able to cope with a rather difficult environment caused by rising inflation. Good reporting is a signal that companies can navigate in the current environment and still generate and multiply their profits. The growth of the Nikkei 225 index is supported by the depreciation of the Japanese yen. Among the Nikkei 225 companies, Sumitomo Osaka Cement Co. added 19%, as well as Subaru added 5.5%, Nissan Motor increased by 4.7%, Mitsubishi Motors jumped by 4.4%, and Mazda Motor added 3,7%, which are engaged in the automobile industry. Sony, SoftBank Group, and Asia Fast Retailing showed slightly smaller increases in the value of their securities, adding 1.3%, 1.6%, and 2.3% respectively. The negative impact on Chinese indicators was caused by the information that the Central Bank of China left unchanged the interest rate on loans at 3.7%. Before that, it had been lowered several times because of the economic situation by 5 points in December 2021 and by another 10 points in January of this year, but in recent months it has not changed. Among the companies included in the Hang Seng Index, Li Ning Co. increased by 5.5%, Anta Sports Products, Ltd. added 3.1%, Geely gained 4.1%, and Sands China, Ltd. as well as Galaxy Entertainment Group, Ltd. added 4% each. At the same time, the value of securities of several other companies declined. Country Garden Holdings Co. decreased by 6%, China Overseas Land & Investment, Ltd. dropped by 5.1%, CNOOC, Ltd. lost 2.8%, and PetroChina fell by 1.9%. Korean companies did not show a significant increase in the value of securities. Shares of Hyundai Motor rose by 1.4%, while Samsung Electronics Co. fell by 0.3%. The Australian indicator reached almost an all-time high level. Among its components, Ramsay Health Care added 24%, which was the highest increase. This was due to the proposal of the upcoming purchase of the company by investors led by KRR. The value of the securities of Pro Medicus, Ltd. jumped by 6%, and Healius, Ltd. increased by 3.9%. Share prices of BHP fell by 1.3%, and Rio Tinto dropped by 2.3%. The material has been provided by InstaForex Company - www.instaforex.com |
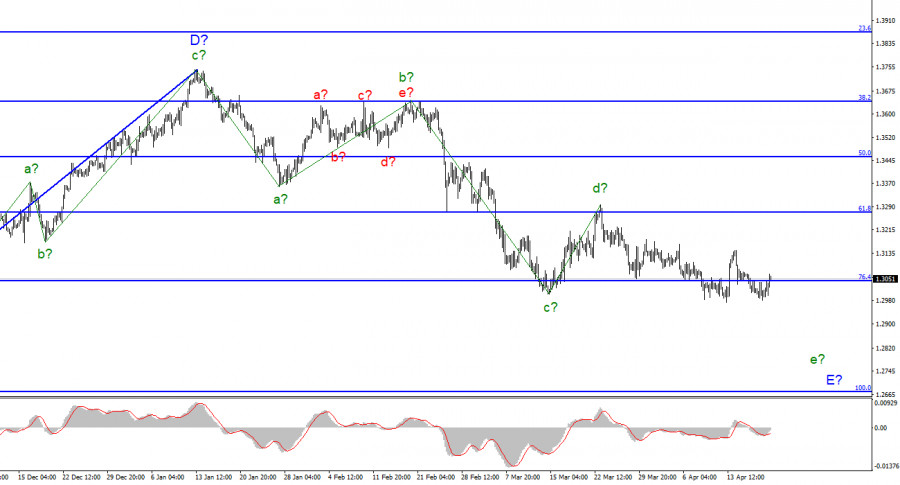
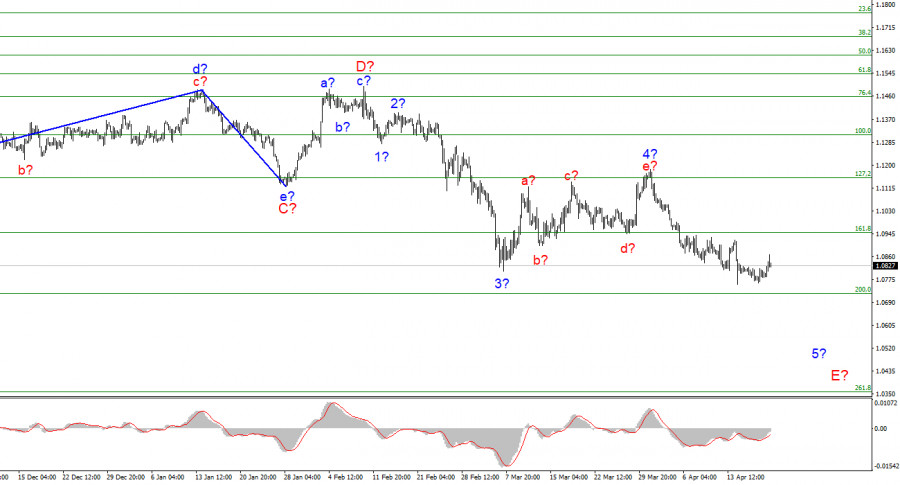
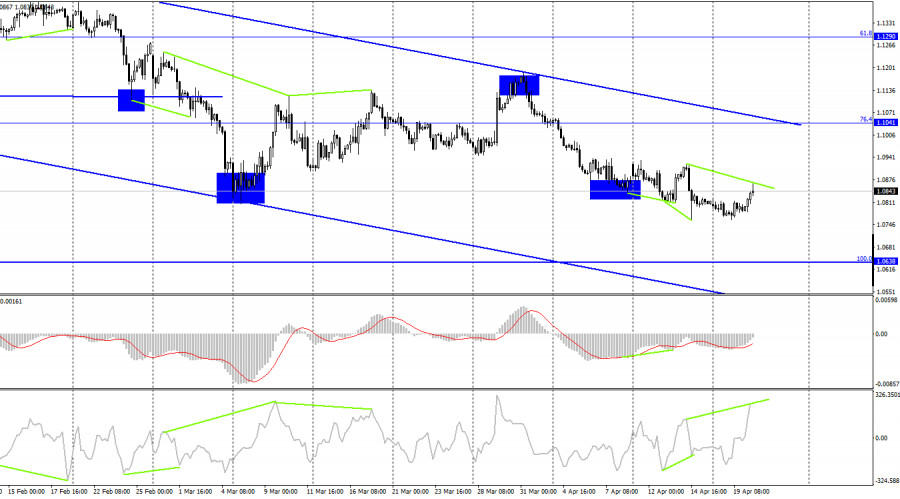
| Wave analysis of EUR/USD on April 20. Kyiv and Moscow playing table tennis Posted: 20 Apr 2022 07:02 AM PDT
A wave layout of the 4-hour chart still looks convincing for EUR/USD without any changes. Expected wave 4 is already complete. The trading instrument is keeping on with wave 5 inside E. If this is the case, EUR is likely to extend its decline for a few weeks ahead. The wave might develop an elongated shape and a 5-wave internal structure. On the other hand, it might get shorter than usual. For a while, we cannot consider wave E complete because its internal wave structure excludes such a conclusion. Thus, the trading instrument maintains bearish momentum. The first downward target is seen at 1.0721 that matches the 200.0% Fibonacci level. A failed attempt to break this level could push the price up off its lows and create internal correctional wave 5 inside E. The outlook for EUR/USD in the coming weeks will depend on a variety of factors: economic data, geopolitics, oi and gas prices, new sanctions on Russia from the US and the EU. Kremlin submits amended draft for peace talks to Kyiv EUR/USD grew 10 pips on Tuesday and gained another 50 pips on Wednesday. In means than demand for the single European currency is on the rise. Nevertheless, the currency pair is still unable to build an uptrend section or a strong bullish wave despite the fact that the current trend section could be complete if wave 5 inside E gets shorter than usual. The upward move today has nothing to do with the economic calendar. During the early European session, the EU reported that its industrial production expanded by 0.7% on month and by 2.0% on year. One of the readings was worse than expected and the other one was a bit better. It was the only report worth of attention, but the market took little notice of it. The market probably responded to the statement of Dmitry Peskov, who said that new proposals for a peaceful solution to the conflict had been submitted to Kyiv. From my point of view, the interpretation of "peaceful settlement" in itself no longer corresponds to reality, but this give a faint hope for the completion of the hostilities. Yesterday I said that the active stage of the "second phase" can be over in about 1-2 weeks. But many military analysts suppose that active hostilities in the Donbas can continue for 3-6 months. In this case, a peace treaty would be most welcome. Meanwhile, Kyiv and Moscow are now engaged in kind of throwing the tennis ball over the net to the other side. Adviser to the President of Ukraine Mikhail Podolyak said that his delegation voiced and sent to the Russian Federation its proposals for resolving the conflict back in Istanbul. Now the Russian side has sent its proposals to Kyiv. They will be scrunitized for several days, after which the Ukrainian side will send new proposals and its response to Moscow. Since we do not know what exactly these proposals are about, no conclusions can be drawn about the outcome of the negotiations. But it seems that the issues of Crimea and Donbass will remain unresolved. Conclusions Based on the analysis conducted, I draw a conclusion that building wave 5 inside E is still underway. If so, it is still good time to sell EUR/USD with targets at around 1.0721 that corresponds to the 200.0% Fibonacci level. Sell the pair at every downward signal from the MACD indicator. Correctional wave 5 inside E could appear in the new few days. Once it is finished, I expect a new bearish wave in EUR/USD.
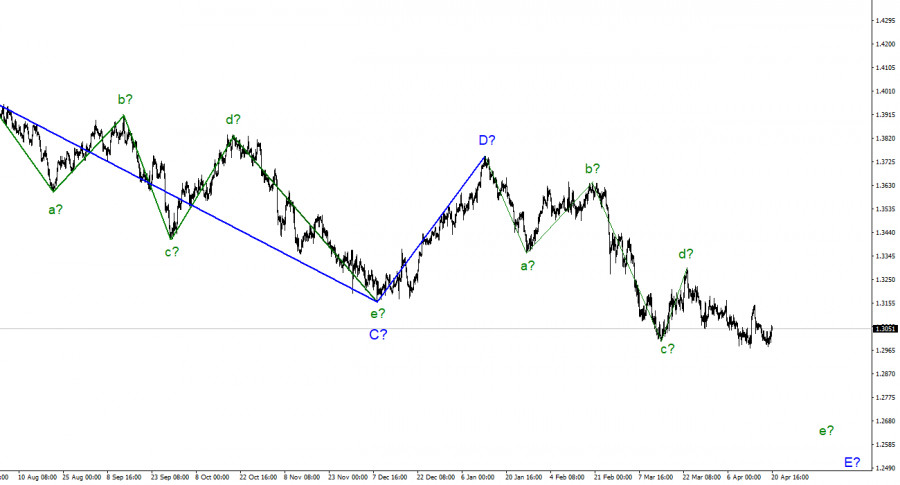
On a larger scale, it is clearly seen that expected wave D is complete. The currency pair is making lower lows. To sum it up, wave 5 of the non-impulsive downtrend section is coming into shape now. It could be as extended as wave C. If this assumption is true, EUR/USD is set to trade lower. The material has been provided by InstaForex Company - www.instaforex.com |
| Technical analysis of GBP/USD for April 20, 2022 Posted: 20 Apr 2022 06:40 AM PDT
The GBP/USD pair slipped below their immediate resistance levels of 1.3146 and 1.3108, opening the door for further downside. The GBP/USD pair has remained bearish, the declining balance of Pound on the market indicates that long-term investors are unperturbed and continue to accumulate at every available opportunity around the range of 1.3146 and 1.2972. The GBP/USD pair broke support which turned to strong resistance at the level of 1.3038. The level of 1.3038 coincides with a golden ratio (61.8% of Fibonacci), which is expected to act as major resistance today. The Relative Strength Index (RSI) is considered overbought because it is around 70 which indicates to a saturation for the Pound. The RSI is still signaling that the trend is downward - but it is still strong above the moving average (100). This suggests the pair will probably go up in coming hours for correction around the area of 1.3080 or/and 1.3108. Accordingly, the market is likely to show signs of a bullish trend temporary. If the GBP/USD pair fails to break through the resistance level of 1.3080, the market will decline further to 1.3013. This would suggest a bearish market because the RSI indicator is still in a positive area and does not show any trend-reversal signs. The pair is expected to drop lower towards at least 1.3013 with a view to test the daily pivot point. Thus, the market is indicating a bearish opportunity below 1.3080 for that it will be good to sell at 1.3080 with the first target of 1.3013. It will also call for a downtrend in order to continue towards 1.2972. The daily strong support is seen at 1.2972. On the contrary, if a breakout takes place at the resistance level of 1.3146 (the double top), then this scenario may become invalidated. Tips : Fundamental Analysis : Fundamental analysis is based on the idea that the price of an asset is determined by underlying factors such as the company's performance, management and market size ...etc. Technical Analysis : On the other hand, technical analysis does not consider any economic or fundamental factors. It is purely focused on the chart and the indicators like RSI, MACD and candlestick patterns ... etc. Technical analysis or fundamental analysis What is the difference between technical analysis and fundamental analysis? Technical analysis is a type of analysis looks at historical price movements to determine the current trading conditions and possibility price movement. At the same time, fundamental analysis is a type of analysis looks at economic, social, and political forces that impact the supply and demand of an asset. What is the relation between technical analysis and fundamental analysis? Technical analysis are pure technical aspect of trading, it is somehow virtual but accurate enough to make money. On the contrary, the fundamental analysis is the real aspect of trading because the market moves according to it. Overview about this thesis: Fundamental analysis is the real view of moving the market in the long term. On the opposite side, technical analysis plays an important role in continuing the work of fundamental analysis. Although it seems that technical analysis hypothetical but it works convincingly to a large extent, especially in the weekly analysis. Sometimes I expect the news through technical analysis, and then the news comes according to my expectations. The material has been provided by InstaForex Company - www.instaforex.com |
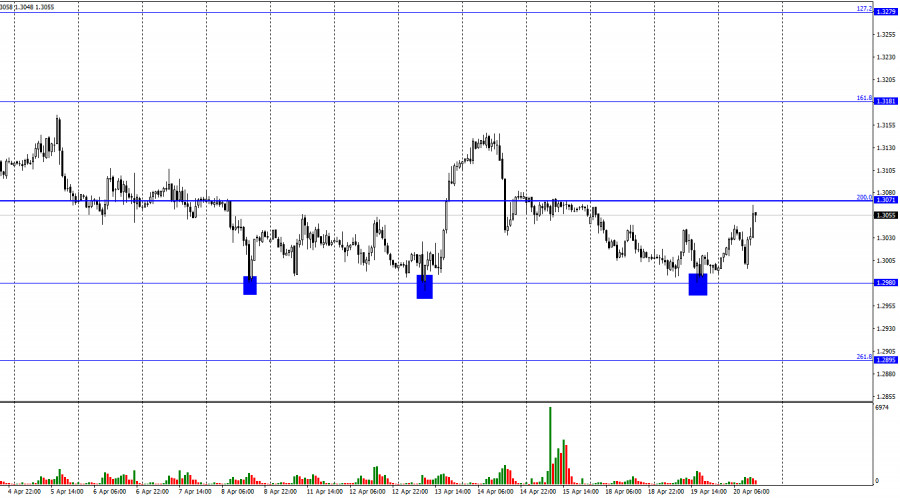
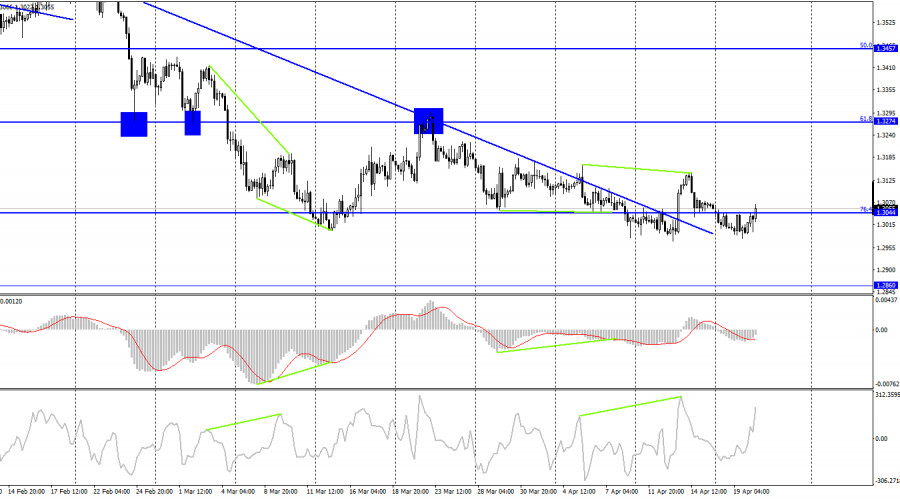
| Posted: 20 Apr 2022 06:36 AM PDT
According to the hourly chart, the GBP/USD pair on Tuesday performed the third drop in the last two weeks to the level of 1.2980, a new rebound, and began a new growth process in the direction of the corrective level of 200.0% (1.3071). In recent weeks, the pair does not like to trade above this level, so I expect a rebound from it and a fourth drop to the level of 1.2980. Fixing the pair's rate at 1.2980 will increase the chances of continuing the fall towards the next corrective level of 261.8% (1.2895). Meanwhile, there is an information lull in the UK. Almost all the news concerns politics, new sanctions against the Russian Federation, and new weapons for Ukraine. Boris Johnson, who again came under a barrage of criticism in Parliament for his parties at the height of the coronavirus pandemic and lockdown, promised to provide Ukraine with almost any weapons. In particular, now artillery and heavy, armored weapons are expected from partner countries to confront Russia and Ukraine since the conflict has shifted to the East of this country. According to representatives of President Zelensky's cabinet, up to 100,000 Russian soldiers are currently concentrated there. Arms supplies via Poland arrive in Ukraine almost every day. Just yesterday, 7 cargo planes from the United States landed in Poland, transporting military equipment and weapons. Thus, Kyiv is currently waiting. Negotiations are frozen, the offensive actions of the Russian Federation will sooner or later run out, and when the Russian army stops, then Ukraine can go on a counteroffensive. With new weapons, armored vehicles, and new planes. Unfortunately, this means that this conflict may drag on for another 5-6 months. This is the conclusion reached by representatives of Western intelligence. The battle in the Donbas may last about 2 months, after which both sides will take their positions and put them under protection, and only after that Ukraine will go to win back its lands. All this time, the British and the Europeans can continue a not too rapid fall.
On the 4-hour chart, the pair performed a reversal in favor of the UK currency and anchored above the descending trend line. And the "bearish" divergence of the CSI indicator allowed the pair to return to the corrective level of 76.4% (1.3044), and then close below it. Nevertheless, now the pair can neither continue the process of falling nor begin the process of growth. We are waiting for developments. Commitments of Traders (COT) Report:
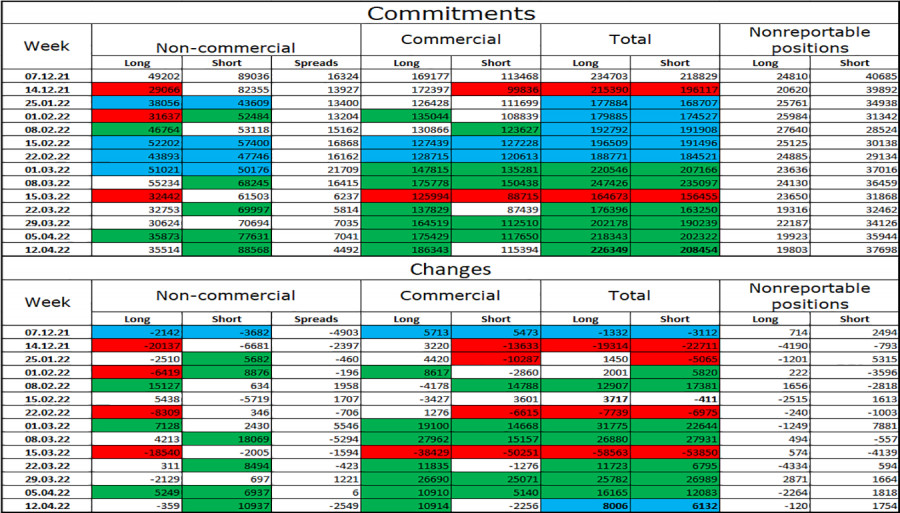
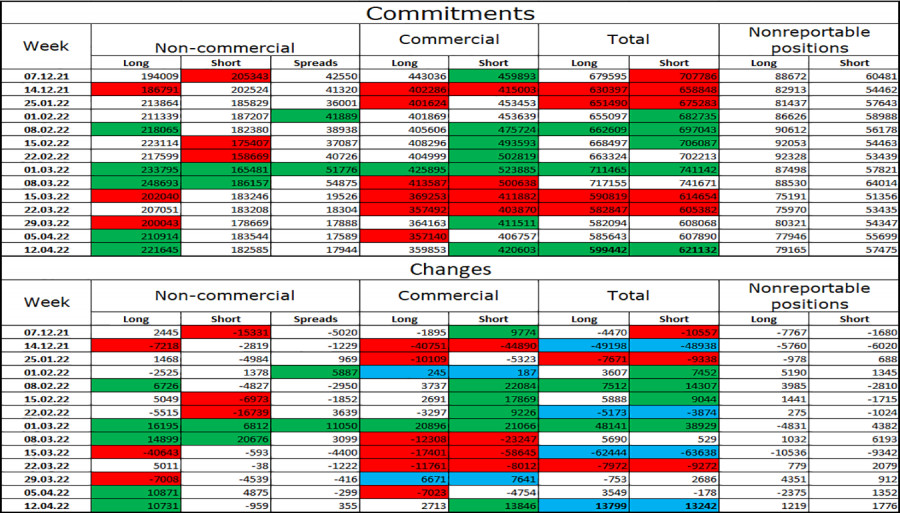
The mood of the "Non-commercial" category of traders has changed a lot over the past week. The number of long contracts in the hands of speculators decreased by 359, and the number of short contracts increased by 10,937. Thus, the general mood of the major players has become much more "bearish". The ratio between the number of long and short contracts for speculators still corresponds to the real state of things on the market - longs are 2.5 times more than shorts. The big players continue to get rid of the pound. Thus, I expect the pound to continue its decline. This forecast is made based on geopolitics, based on COT reports, and based on graphical analysis. News calendar for the USA and the UK: US - FOMC member Charles Evans will deliver a speech (16:05 UTC). US - FOMC member Mary Daly will give a speech (14:30 UTC). US - publication of the Fed's economic review by region "Beige Book" (18:00 UTC). On Wednesday, the calendar of economic events in the UK is empty. Charles Evans and Mary Daly will perform in America today. The speech of the latter may cause a lot of attention, but in general, I believe that the influence of the information background on the mood of traders today will be weak. GBP/USD forecast and recommendations to traders: I recommended selling the pound with a target of 1.2980 if a rebound from the level of 1.3071 is performed on the hourly chart. Now it is possible to sell the pound again for the same purpose with a new rebound from 1.3071. I recommended buying the British when rebounding from the 1.2980 level on the hourly chart with a target of 1.3071. Now, these deals can be closed. The material has been provided by InstaForex Company - www.instaforex.com |
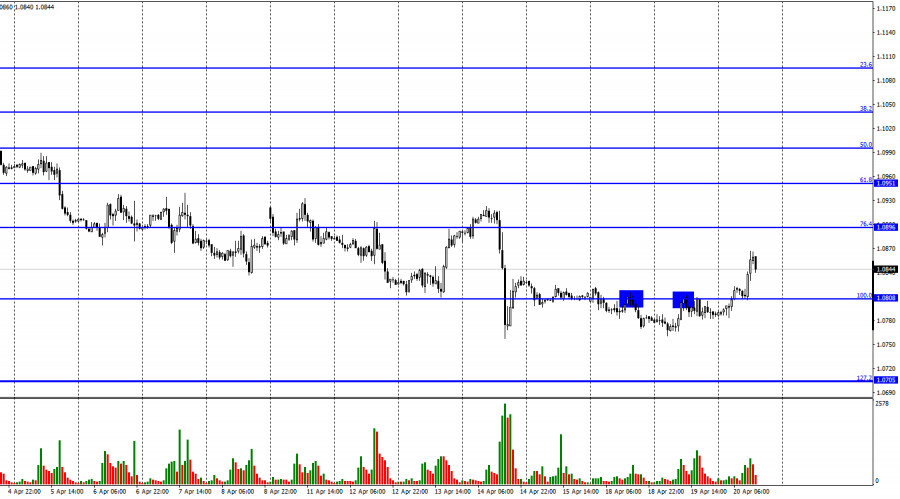
| EUR/USD outlook for April 20. Euro faces crisis Posted: 20 Apr 2022 06:24 AM PDT
Hello, dear traders! On Tuesday, the EUR/USD pair made a new rebound from the correction level of 100.0% at 1.0808. However, it failed to continue further declining. Today, the pair has already consolidated above the level of 100.0%. Moreover, the pair rose towards the correction level of 76,4% at 1,0896. I believe this aspect is very strange. Please focus on the pair's movements during the last weeks. Its fall is evident, but bear traders repeatedly retreat from the market trying to undermine the bulls' positions. They went down 20-30 pips, then they accelerated and declined by another 20-30 pips. Bull traders cannot or do not want to change this situation or they hope there will be some reasonable grounds to buy the European currency. However, there are no such grounds. On Monday, Tuesday, and Wednesday, the most significant events were the speeches of FOMC members, in particular, St. Louis Fed President James Bullard and Chicago Fed President Charles Evans. Both of them emphasized the need to raise the interest rates. Bullard urged the Fed to raise the rate dramatically and stressed that the necessary level was around 3.5%, while Evans did not express his views directly. For example, he voiced the following thought: if the Fed raises the interest rate by 0.5% several times, it will total 2.0-2.5% by the end of the year. Moreover, these conclusions were obvious. The question is what decision the Fed will eventually take concerning the rate hike. However, Evans noted that inflation would play a key role. If the Fed's neutral rate does not return inflation to the target level, then it will continue to rise until inflation stability is achieved.
On the 4-hour chart, the pair made a reversal in favor of the EU currency and started rising. However, the bearish divergence may be favorable for the US dollar again and the pair might resume its decline towards the correction level of 100.0% at 1.0638. The downward trend corridor further indicates traders' bearish sentiment. The euro's significant rise is unlikely until the pair consolidates above this level. COT report:
Last week, speculators opened 10,731 long contracts and closed 959 short contracts. This means that the bullish sentiment of major players has increased dramatically. The total number of long contracts held by major players is currently 211,000, while the total number of short contracts totals 182,000. Therefore, the general sentiment of "non-commercial" traders is considered bullish. In this case, the European currency should rise. However, on the contrary, it has been declining steadily. Consequently, it is currently impossible to make logical conclusions taking into account the COT reports. Traders' sentiment is seriously affected by further hostilities in Ukraine, deterioration in relations between the West and Russia, and new sanctions against Russia. US and EU economic news calendar: EU - Industrial Production Change (09-00 UTC). US - FOMC member Charles Evans to give a speech (16-05 UTC). US - FOMC member Mary Daley to deliver a speech (14-30 UTC). US - Publication of the Fed's Beige Book economic review (18-00 UTC). On April 20, the industrial production report was released in the EU. It turned out to be worse than traders' expectations. The euro was rising today. Therefore, there was no reaction of traders to this report. Today, the speeches of the FOMC members may provide significant data for the interest rate issue. EUR/USD outlook and recommendations for traders: I recommend new sales of the pair if a bearish divergence is formed on the 4-hour chart or the pair rebounds from the level of 1.0896 on the hourly chart with targets 1.0808 and 1.0705. I do not recommend buying the pair as the euro will most likely fall again. The material has been provided by InstaForex Company - www.instaforex.com |
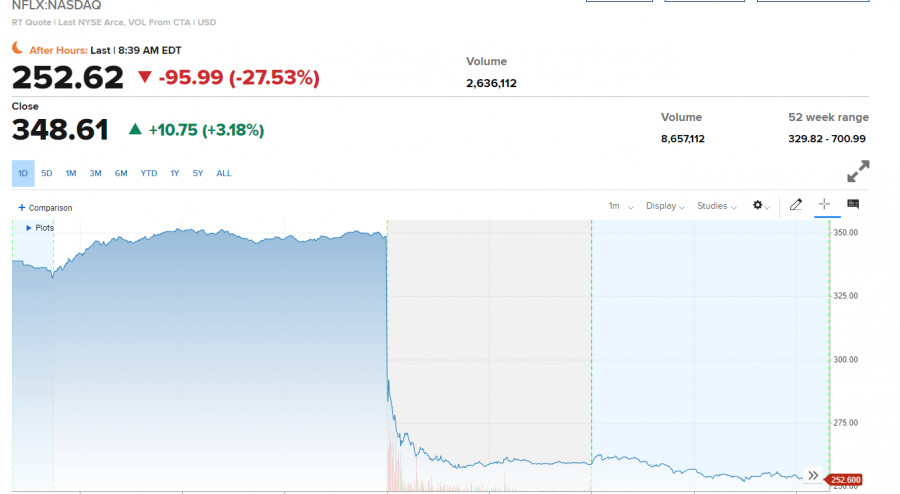
| US premarket on April 20, 2022 Posted: 20 Apr 2022 06:21 AM PDT US stock index futures increased on Wednesday, ignoring the slump of Netflix's stocks and several other disappointing earnings reports by other companies. Dow Jones Industrial Average futures increased by 126 points or 0.3%, S&P 500 futures gained 0.4%, and Nasdaq 100 futures rose by 0.5%.
Shares of Netflix crashed by 25% during the premarket after the streaming giant reported a loss of 200,000 subscribers in the first quarter of 2022. Numerous analysts have slashed their ratings on Netflix following its first-quarter results. Other streaming companies, such as Disney, Roku, Warner Bros. Discovery, and Paramount also suffered losses.
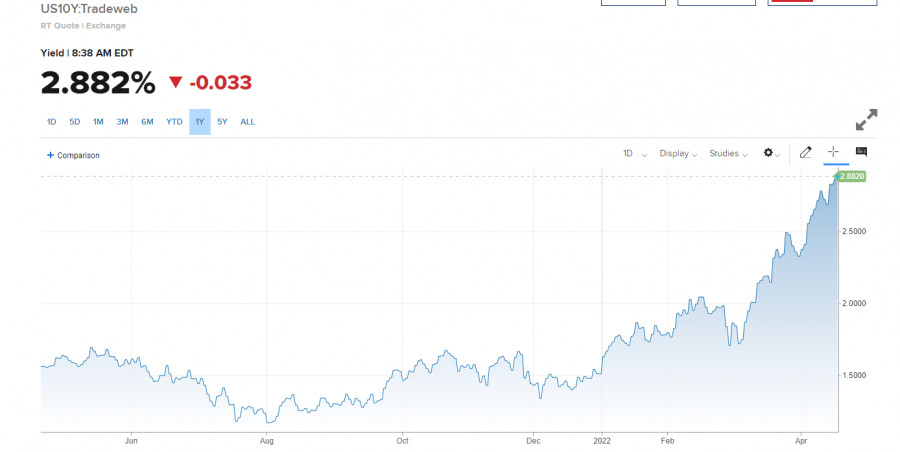
Procter & Gamble gained about 1% after increasing its revenue forecast for fiscal year 2022. 10-year US Treasury yields retreated slightly today after hitting a 3-year high of 2.94% on Tuesday. Major indexes advanced strongly yesterday, posting their best day since March 16. The Nasdaq Composite rose by 2.15%, while the Dow Jones Industrial Average jumped by 499.51 points or 1.45%. The S&P 500 gained 1.61%.
Traders also welcomed falling oil prices. The commodity decreased on average by 5% after the International Monetary Fund lowered its global economic growth outlook and warned about risks related to higher inflation. Premarket movers Shares of streaming companies Walt Disney (DIS), Roku (ROKU), and Warner Brothers Discovery (WBD) lost 5%, 6.7%, and 4.3% respectively in premarket trading following the nosedive of Netflix stock. Baker Hughes fell 5 cents short of earning estimates, with adjusted quarterly earnings of 15 cents per share. Its revenue also missed forecasts. The oil field service company said its results reflected a volatile operating environment. As a result, the stock fell by 2% in premarket action. IBM has reported an adjusted quarterly profit of $1.40 per share, which is 2 cents above estimates. Revenue has also exceeded analyst forecasts. IBM's results got a boost from strong hybrid cloud platform business. As a result, IBM shares gained 2.7% during the premarket. Shares of Teva Pharmaceutical fell by 4.8% during the premarket after the FDA rejected the company's new drug application for a schizophrenia treatment. Teva has announced it was studying possible next steps and will work with the FDA to address the agency's concerns. On the technical side, S&P 500 bulls managed to break above $4,433, fully focusing on the next resistance level of $4,488. If the index breaks through this level, it could quell the bearish trend in the market, which began in early April. It is too early to say that a new uptrend has begun. However, a breakout above $4,488 would allow the index to regain $4,539 and $4,589. On the other hand, if bearish sentiments prevail, the S&P 500 would test $4,433 - there are no positive news at the moment except for corporate earnings reports. A breakout below $4,433 would push the S&P 500 towards $4,376. If bulls fail to hold on to this level, the index would fall towards the lows at $4,319 and $4,265. The material has been provided by InstaForex Company - www.instaforex.com |
| Technical analysis of EUR/USD for April 20, 2022 Posted: 20 Apr 2022 06:18 AM PDT
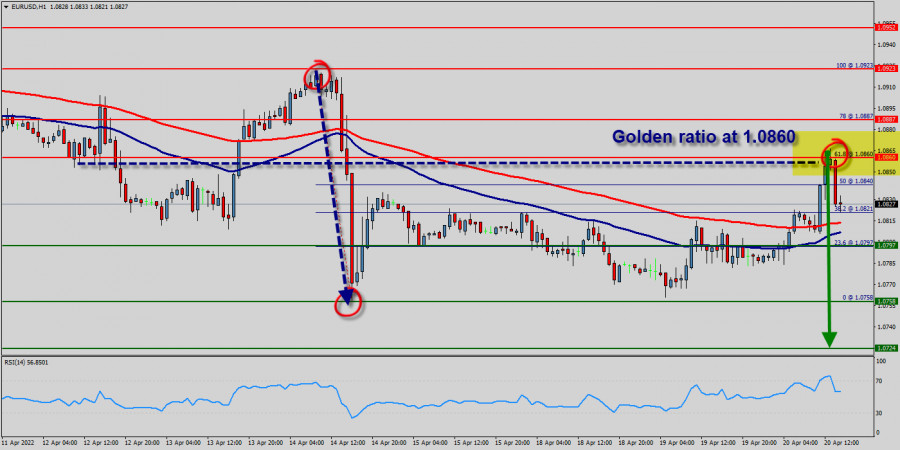
Pivot : 1.0860. The EUR/USD price has shown considerable strength as it bounces off a crucial resistance confluence. This bounce is similar to the last two retests that led to a massive upswing around the area of 1.0860. The bulls attempted to test and break above the 1.0860 resistance level but failed, because the price of 1.0860 represents a golden ration on the hourly chart. Price is testing major resistance at 1.0860 (61.% of Fibonacci retracement, bearish bar harmonic formation). We expect to see a strong reaction off this level to push price down towards 1.0797 before 1.0758 support (Fibonacci retracement, horizontal swing low support). The EUR/USD pair is in a falling trend channel in the medium long term. This signals increasing pessimism among investors and indicates further decline for Euro currency. The currency has support at points 1.0758 and resistance at points 1.0860. The currency is assessed as technically slightly negative for the medium long term. Today, in the one-hour chart, the current rise will remain within a framework of correction. However, if the pair fails to pass through the level of 1.0860, the market will indicate a bearish opportunity below the strong resistance level of 1.0860. Since there is nothing new in this market, it is not bullish yet. Sell deals are recommended below the level of 1.0860 with the first target at 1.0797. If the trend breaks the support level of 1.0797, the pair is likely to move downwards continuing the development of a bearish trend to the level 1.0758 in order to test the daily support 2 (horizontal green line). Tip : RSI is a (momentum indicator). It works by comparing the magnitude of the recent growth to recent downturns to measure the speed and change of price movements. RSI oscillates between 1 and 100. It is a general belief that RSI should be under 30 for buying and over 70 for selling. On our trading today the RSI (14) sets under 70. So, RSI (14) sees a bearish exit of our ascending support-turned-resistance line signalling that we'll likely be seeing some bearish momentum from here. To conclude, The EUR/USD pair trading is definitely an exciting pair, one that many people want to get involved in. However, it is important to understand the movement market before you begin trading. Forecast : Sell below the spot of 1.0860 with the targets of 1.0797 and 1.0758. Stop loss should be placed at 1.0970 (above the double top 1.0923). The material has been provided by InstaForex Company - www.instaforex.com |
| Evident reasons for uptrend in gold and bitcoin Posted: 20 Apr 2022 05:42 AM PDT Currently, traders are trying to puzzle out what policy moved the US Fed will take and how fast it will raise interest rates this year. One thing is obvious that aggressive monetary tightening will cause a large correction in the US stock market. However, someone is certain that the crypto market and bitcoin in particular will benefit from the Fed's hawkish policy. Experts at Allianz believe that the Fed's counter measures against soaring inflation will lead to the bullish trend of bitcoin, ethereum, and other altcoins. As soon as investors realize everything about inflation, they will have to cushion their savings, analysts at Allianz noted. Analysts at the think tank point out three problems: persistent runaway inflation, a serious lag of the Federal Reserve from the real economy (talking about interest rates); the lack of tools for smooth taming and slowing down inflationary pressure. Let me remind you that quite recently the investment bank Goldman Sachs warned that there is a 35 percent chance of a recession in the US in the next two years.
Against this background, the long-term prospects for the cryptocurrency market do not seem to be as bad as many analysts foresee. In fact, the problem is not only in inflation, but in the challenge to the dollar's dominance in the world market. The recent plunge in the bitcoin value and its divergence from gold, and BTC's more serious correlation with the US stock market, has already made a lot of noise. For the time being, investors have so far classified bitcoin as a risky asset, and it has completely lost its status as an "inflation fighter", which gold has not lost yet. However, the main argument in favor of cryptocurrency is diversification. At the time of sky-high inflation, this is very attractive. Considering that cryptocurrency has never played a serious role in this process, it is possible that it is the new progressive direction that will become the key for investors when choosing and searching for assets in which it is safer to sit out jitters unfolding. Allianz believes that the reason why crypto, unlike gold, has benefited so much from all the liquidity injections is a tug of war between recognizing that liquidity is leaving the system and attractive investment opportunities in crypto as a diversifier. In simple words: free global liquidity is already gradually starting to flow into the crypto market where it is now in abundance. This will push prices higher and higher. As cryptocurrencies are recognized, the demand for them will only increase and the current prices are more attractive than ever before. In 3-5 years, it will not matter whether you bought bitcoin at $40,000 or at $50,000. Allianz is sure that both gold and bitcoin will enjoy the maximum popularity among investors in the next few years. In this context, we will watch a rapid rally of these assets and it cannot be avoided. Technical picture of bitcoin The bulls entered the market urgently when BTC price retreated to the April lows. Although investors' still voice concerns, keeping the price above $39,000 calmed them down a bit. The bull market, which has been going on since the beginning of March of this year, has not gone away. Yes, the downward correction is quite large, but the bulls made it well and pushed the price above $41,200. This price action changed everything dramatically. The 200-day moving average around $48,550 doesn't seem so far away anymore, but active action around the 100-day moving average at about $41,220 is needed for the bulls to regain control over the market. Only a breakout of this range will open the door to the highs at $43,200 and $43,530. The fact that bitcoin is already receiving more support from large players may soften its fall after the recent data on inflation in the US, which seriously affected the US stock market, which is highly correlated with the cryptocurrency market. In the event of a decrease in the trading instrument, only a breakout of the level of $39,290 will push the trading instrument lower to a low at $37,500 and deeper to $36,000. Technical picture of Ethereum The focus remains on the new resistance of $3,140. A breakout of this level will quickly return Ethereum to $3,306, very close to a 200-day moving average, which is in the $3,480 area. If the price settles above this level, ETH will continue the uptrend. A breakout of $3,480 will serve as a new impetus that will open the door to higher levels: $3,540 and $3,685. If ETH comes again under downward pressure, traders might go long in the area of a major support of $2,950 where big players will again enter the market. The material has been provided by InstaForex Company - www.instaforex.com |
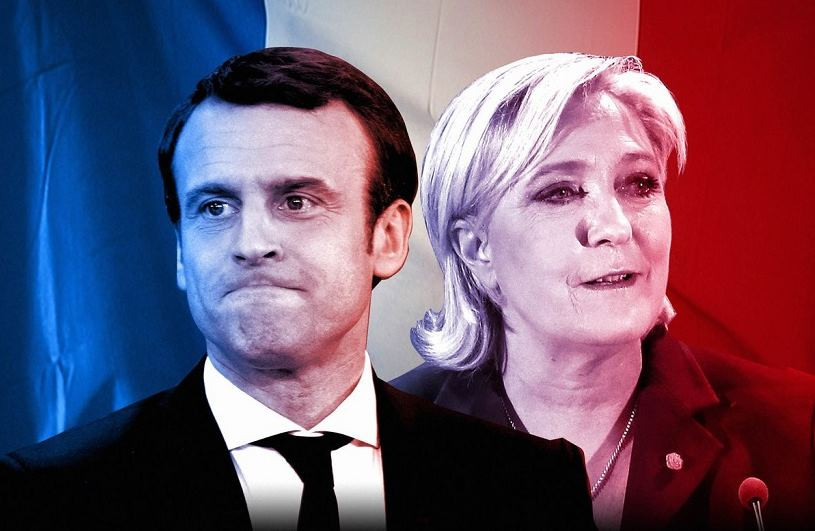
| EUR/USD: Waiting for decisive debates in France and progress in Russia-Ukraine peace talks Posted: 20 Apr 2022 05:35 AM PDT The 7th figure turned out to be a tough nut for the bears of the EUR/USD pair. Since last Friday, sellers have been trying to gain a foothold below the 1.0800 mark, but in vain – as soon as they cross this support level, the downward momentum fades. Traders take profits and open longs, showing excessive caution in the area of two-year price lows. As a result, the pair is actually marking time, in the 100-point range of 1.0760-1.0860. Price fluctuations are undulating – the pair alternately pushes off from the upper and lower boundaries of the corridor. Looking ahead, it should be noted that the euro did not have any arguments for a reversal of the downward trend, and still does not. Moreover, the European currency may significantly weaken throughout the market tonight if the debate between Emmanuel Macron and Marine Le Pen ends in favor of the latter. France is on the threshold of the second round of the presidential elections, which will be held next Sunday, that is, on April 24th. Credit Suisse currency strategists said if Le Pen wins, the EUR/USD pair will fall to 1.0500. The fact is that Macron's rival is still a Euroskeptic, although not as radical as in 2017, during the previous presidential campaign. At present, Le Pen does not lobby for the idea of France leaving the European Union or the idea of withdrawing the country from the eurozone. At the same time, Le Pen is in favor of restoring the supremacy of French law over European law. She proposes to transform the EU into a Union of Nations, which will not be covered by a single legislative field. This is, so to speak, the "maximum program" in this context. The minimum program is to reduce France's contribution to the overall European budget by 5 billion euros.
Recent polls show Emmanuel Macron leading in the second round. Sociologists say that he has from 53% to 56% support. While 44 to 47 percent of French citizens surveyed are ready to vote for Marine Le Pen. But there are at least two factors to consider here. Firstly, this is the statistical error of the survey, and secondly, a significant number of undecided citizens. According to relevant experts, they can seriously affect the final result of the current election campaign. Marcon and Le Pen will fight for this electoral layer. Today's debate is the most important event in this context. If Marine Le Pen, following the results of today's meeting, can accumulate the sympathies of undecided citizens, then Marcon will cease to be a clear favorite of the election race. This fact will put the strongest pressure on the EUR/USD pair. Therefore, the current corrective growth should be treated with great caution. All the fundamental factors that contributed to the strengthening of the euro are quite unstable. For example, buyers of EUR/USD reacted positively to today's macroeconomic reports. Germany's producer price index for March was published, which is an early signal of a change/confirmation of inflationary trends. The numbers came out in the green zone, significantly exceeding the forecast values. On a monthly basis, the indicator reached 4.9% with a growth forecast of 2.7% (in February, the index rose to just 1.4%). In annual terms, the indicator reached a 31 percent mark with a forecast of growth up to 28%. The volume of industrial production in the EU countries was also published today. This indicator also came out in the green zone, leaving the negative area – both on an annual and monthly basis. However, it should be taken into account here that we are talking about the February report: given the recent geopolitical events and the impending energy crisis, it can be assumed that the March and April figures will not please investors. Today's growth of the pair was also associated with another event – this time of a geopolitical nature. Press secretary of the Russian President Dmitry Peskov said that as part of the negotiation process, Ukraine received a draft document "with clear wordings." According to Peskov, now the ball is on Ukraine's side – Moscow is waiting for Kyiv's reaction. Negotiations between the parties have been practically frozen lately – legal subgroups of delegations have been working, but in general, an information vacuum has formed around the negotiation process again. Peskov's statement in this context was evidence that there is still some progress in this direction. Although excessive optimism should not be shown, at least until the parties have announced the achievement of a comprehensive compromise solution. Thus, despite the vigorous step of corrective growth, longs for the EUR/USD pair still look risky. The shaky fundamental background does not allow us to say that buyers will be able to reverse the downward trend. Therefore, it is advisable for the pair to take a wait-and-see position now, at least until tomorrow, when the preliminary results of the French debates will become clear. The material has been provided by InstaForex Company - www.instaforex.com |
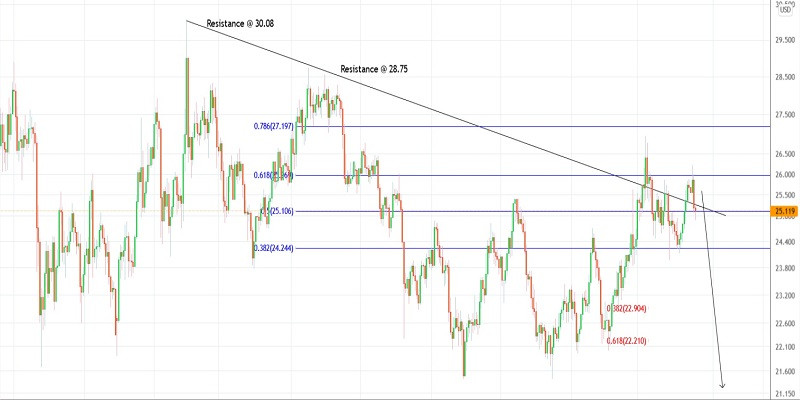
| Trading plan for Silver for April 20, 2022 Posted: 20 Apr 2022 05:33 AM PDT
Technical outlook:Silver seems to have finally resumed its downtrend after finding resistance just above the $26.00 mark early this week. The metal was projected to rally through $25.85 mark before reversing lower again. Bears will now remain poised to hold prices below $26.30 to keep the immediate downside momentum intact. Silver has been in a larger degree downtrend since $30.08 highs as labelled on the daily chart here. The metal has already completed a major downswing from $30.08 through $21.42 levels. The recent downswing between $28.75 and $21.42 has also been retraced by a corrective rally toward $26.95. Also note that fibonacci 0.618 of the recent downswing has been tested along with the down trend line around $26.95. Ideally prices should now stay below the $26.95 high and continue printing lower lows and lower highs through $22.00 and below $21.00 mark going forward. Only a push above $26.95 will delay matters further. Trading plan:Potential drop through $22.00 and $21.00 against $28.75. Good luck! The material has been provided by InstaForex Company - www.instaforex.com |
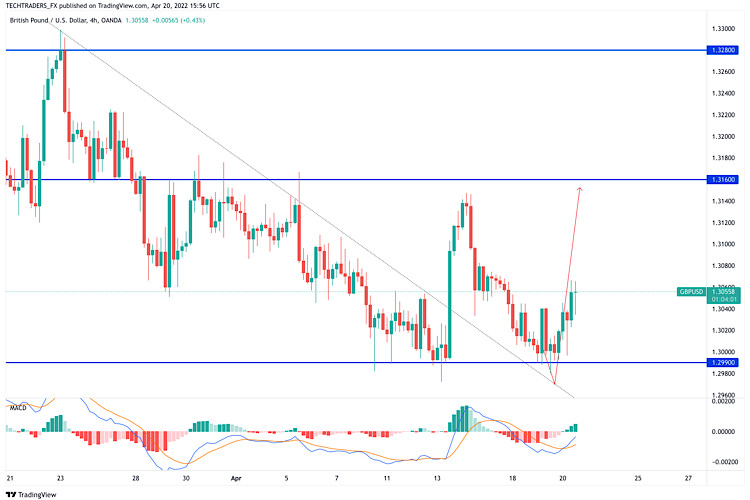
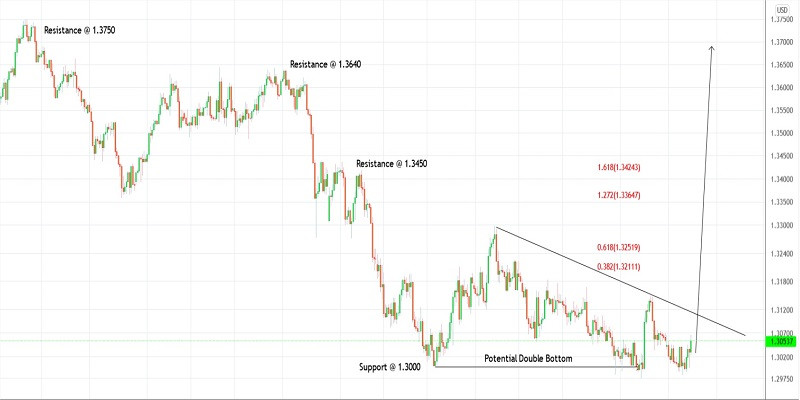
| Trading plan for GBPUSD for April 20, 2022 Posted: 20 Apr 2022 05:17 AM PDT
Technial outlook:GBPUSD rallied through 1.3065 highs intraday on Wednesday. The currency pair had earlier dropped through 1.2970 lows before finding support. Also note that a higher low has been carved around 1.2995 early this week before resuming its rally. Looks like bulls are poised to pushprices through 1.3300 initial resistance. GBPUSD seems to have carved a potential double bottom just below the 1.3000 level in the past few trading sessions. If the above structure holds well, bulls will remain inclined to push through 1.3300 and 1.3450, which is next resistance in-line. A push above 1.3150 will accelerate towards 1.3300 and confirm that bulls are back in control. GBPUSD has completed its drop since 1.3750 highs around 1.2970 levels over the past few trading sessions. A break above 1.3300 initial resistance will confirm that trend has changed and it is a safe strategy to keep buying on dips thereafter. Aggressive traders might have initiated long positions already against 1.2970. Trading plan:Potential rally towards 1.3450 against 1.2970 Good luck! The material has been provided by InstaForex Company - www.instaforex.com |
| Posted: 20 Apr 2022 04:59 AM PDT Bitcoin is breaking above $ 41,200 and is now aiming for the return of the next major resistance at $ 43,200, to which the growth will be quite rapid. But the ether is not so good with the $ 3,150 level, which the trading instrument rested on in the middle of this month. But before we talk about the technical picture, I would like to note several statements by the beloved author of the bestseller "Rich Dad, Poor Dad" Robert Kiyosaki. In his recent interview, he talked a lot about hyperinflation and depression, advising investors to buy gold, silver, and Bitcoin. Previously, he was an ardent opponent of cryptocurrencies, calling them another bubble and Ponzi scheme.
Robert Kiyosaki issued several warnings about the US economy, pointing to the biggest financial bubble while referring to hyperinflation and depression that will come in the near future for investors and consumers. The author of the book "Rich Dad'' also said that the pensions of the baby boomer generation are simply disappearing into thin air due to high inflation and that $ 10 trillion, apparently referring to the bloated balance sheet of the Fed, is already gradually coming to an end. He also called the US government, Wall Street, and the Federal Reserve thieves. Kiyosaki also drew attention to the inversion of the bond yield curve, which was last in 2008. "In 2008, I borrowed $ 300 million to buy a great property at a bargain price. Time to get rich again. It's time to become smart, not greedy," he said. In his opinion, weak businesses and greedy investors will fail very soon. It is worth noting that recently more and more economists have been saying that serious problems await the US economy and a recession is not far off. However, the more people talk about it, the more calmly the stock markets and the cryptocurrency market react to everything, which has recently had a crazy correction with the NASDAQ market. This suggests that investors have definitely attributed bitcoin to a risky asset, and it has finally lost its status as a "fighter against inflation". The risk that the Federal Reserve's actions will plunge the US economy into recession has increased significantly recently, as the fight against inflation implies higher interest rates and tight monetary policy. But don't take Kiyosaki's words too seriously. Recently, he has warned many times about massive stock market crashes and bubbles about to burst. He also predicted a "giant stock market crash" in October last year, and before that, he said that the US would soon slide into a new depression. Last month, the author of the book "Rich Dad, Poor Dad" said that the US dollar is about to collapse, and recommended investors buy more gold, silver, bitcoin, Ethereum, and Solana. None of this, as you can see, has happened. As for the technical picture of bitcoin The bulls gave a serious rebuff when the exchange rate returned to the April lows. Although investors' fear remains, holding the rate above $ 39,000 calmed them down a little. The bull market that we have been seeing since the beginning of March this year has not gone away. Yes, the downward correction is quite large, but the bulls coped with the task and broke above $ 41,200 - this changed everything dramatically. The 200-day average around the $ 48,550 mark already seems not so far away, but to return the initiative from buyers, active actions are needed in the area of the 100-day average, which is just located in the area of $ 41,220. Only a breakdown of this range will open the possibility of reaching the highs in the area: $ 43,200 and $ 43,530. The fact that bitcoin is already beginning to gradually enjoy support from major players may mitigate its fall after recent data on inflation in the United States, which seriously affected the American stock market, strongly correlated with the cryptocurrency market. In the event of a decline in the trading instrument, only a breakdown of the $ 39,290 level will fail the trading instrument below the minimum of $ 37,500, and there it is close to $ 36,000. As for the technical picture of the ether The focus remains on the new resistance of $ 3,140. A breakthrough of this level will quickly return the ether to $ 3,306, and there is a 200-day moving average very close, which passes in the area of $ 3,480. Only the consolidation above will continue the upward trend for the trading instrument. The breakdown of $ 3,480 will serve as a new impulse to reach the levels of $ 3,540 and $ 3,685. In case of a return of pressure on ETH, purchases in the area of large support of $ 2,950 are not excluded. A break in this range will be a reason to go to the lows: $ 2,740 and $ 2,500, where the major players will again begin to actively act. The material has been provided by InstaForex Company - www.instaforex.com |


| You are subscribed to email updates from Forex analysis review. To stop receiving these emails, you may unsubscribe now. | Email delivery powered by Google |
| Google, 1600 Amphitheatre Parkway, Mountain View, CA 94043, United States | |


Comments