Forex analysis review
Forex analysis review |
- Ichimoku cloud indicator analysis on Gold for April 5, 2022.
- Short-term EURUSD analysis for April 5, 2022.
- XRPUSD vulnerable to another move lower towards $0.50.
- Oil: Uncertainty looms in the market
- Trading plan for Silver for April 05, 2022
- Trading plan for GBPUSD for April 05, 2022
- Analysis and trading tips for GBP/USD on April 5
- Bitcoin to become world's digital gold
- Analysis and trading tips for EUR/USD on April 5
- Analysis of Gold for April 05,.2022 - Watch for the breakout of the contraction
- Trading plan for Gold for April 05, 2022
- BTC update for April 05,.2022 - Buyers in control
- Technical analysis recommendations on EUR/USD and GBP/USD for April 5, 2022
- Trading plan for Ethereum for April 05, 2022
- Trading plan for USDJPY for April 05, 2022
- US stocks post rally on Monday
- End of globalization!
- Stablecoins' decreasing share in crypto market capitalization may negatively affect Bitcoin's bullish rally
- Review of USD, NZD and AUD: Commodity currencies rally amid improving risk appetite
- Daily Video Analysis: AUDCAD, H4 Bearish Reversal Setup
- AUD/USD analysis and forecast on April 5, 2022
- Trading plan for starters of EUR/USD and GBP/USD on April 5, 2022
- Indicator analysis of GBP/USD for April 5, 2022
- Forex forecast 04/01/2022 AUD/USD, USD/JPY, Oil and SP500 from Sebastian Seliga
- Indicator analysis of EUR/USD for April 5, 2022
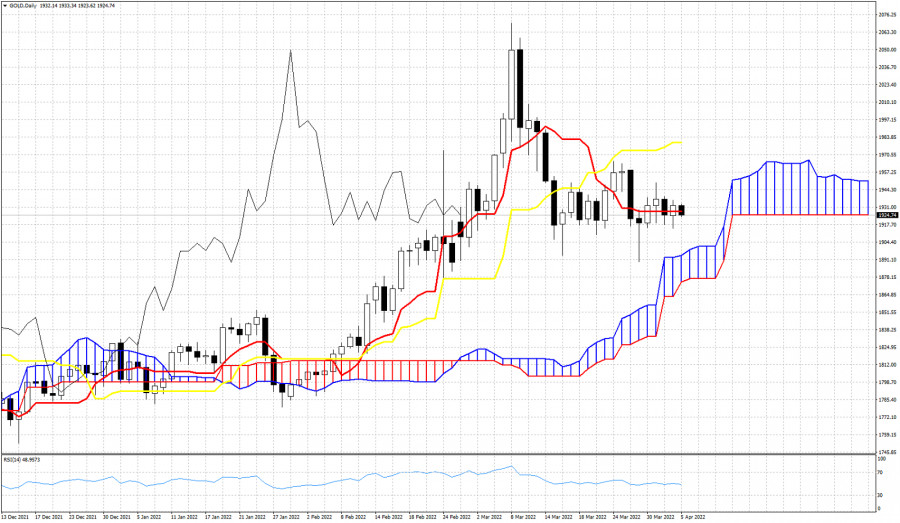
| Ichimoku cloud indicator analysis on Gold for April 5, 2022. Posted: 05 Apr 2022 06:11 AM PDT Gold price is trading around $1,935. Gold price in the Daily chart remains in a bullish trend as price continues to stay above the Daily Kumo (cloud). Gold price is trading around the tenkan-sen (red line indicator) and if price $1,920, we should expect a move lower towards the cloud at $1,900.
|
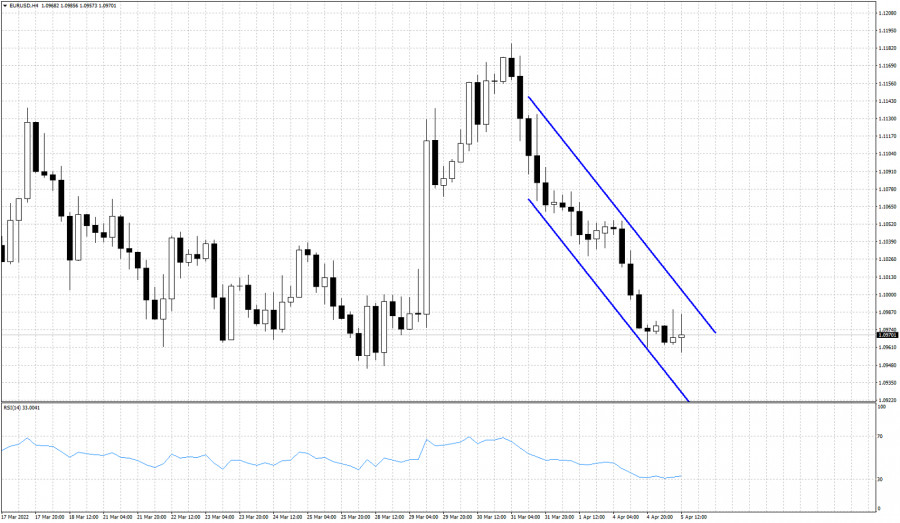
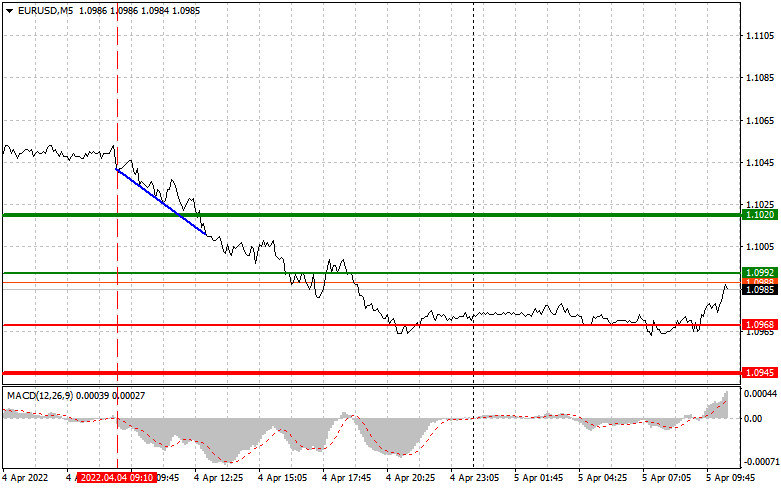
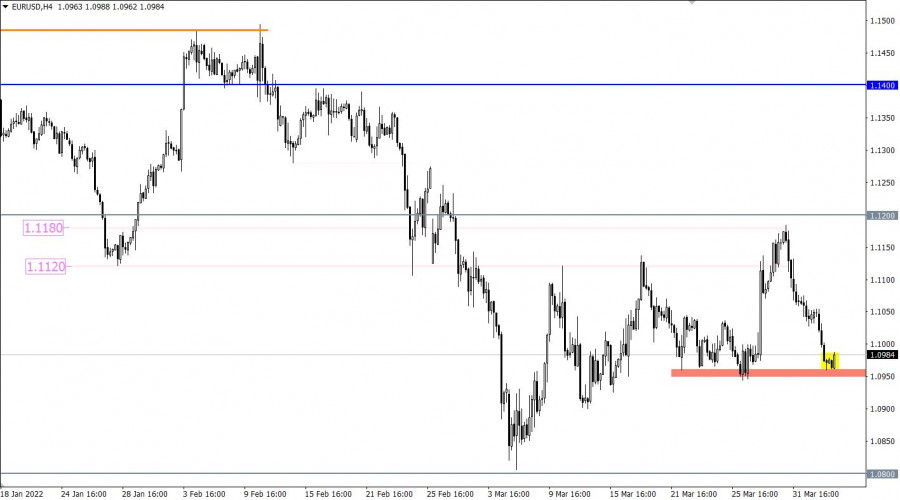
| Short-term EURUSD analysis for April 5, 2022. Posted: 05 Apr 2022 06:05 AM PDT EURUSD is trading around 1.0965. Price has formed a bearish channel and is making lower lows and lower highs. There is no sign of a reversal. Bears remain in control of the trend. EURUSD is trading just above the recent key low of 1.0945.
Blue lines- bearish channel As long as price is inside the bearish channel, bears will be in control. Resistance is at 1.10 and next at 1.11. A bounce towards 1.10 is justified as the RSI in the 4 hour chart has reached oversold levels and is turning upwards. Next downside target and support is found at the lower channel boundary at 1.0925. The material has been provided by InstaForex Company - www.instaforex.com |
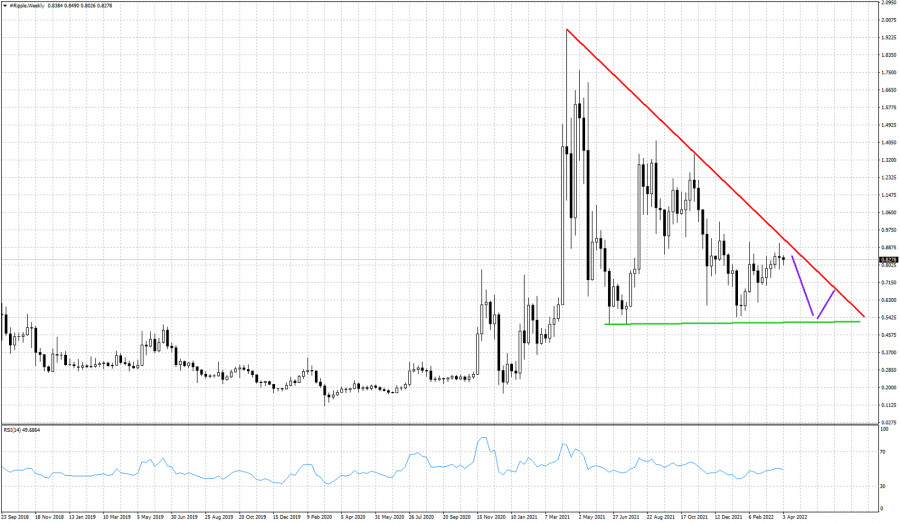
| XRPUSD vulnerable to another move lower towards $0.50. Posted: 05 Apr 2022 06:00 AM PDT XRPUSD has moved higher towards the upper triangle boundary as expected. Price is now trading below the key triangle resistance of $0.90-$0.93. Short-term trend remains bullish but if price does not eventually push above the triangle resistance, we should expect another move lower.
Green line -lower triangle boundary support Purple lines- expected price movement XRPUSD continues to remain trapped inside the long-term triangle pattern. Price continues making lower highs but the support at $0.50 remains intact. A rejection at current levels is expected to lead price back to the horizontal support shown as the green line in the weekly chart above. Bulls need to break above the red downward sloping trend line.in order to produce a bullish signal. Trading near the key resistance offers chance for bears to open new short positions with minimum risk. The material has been provided by InstaForex Company - www.instaforex.com |
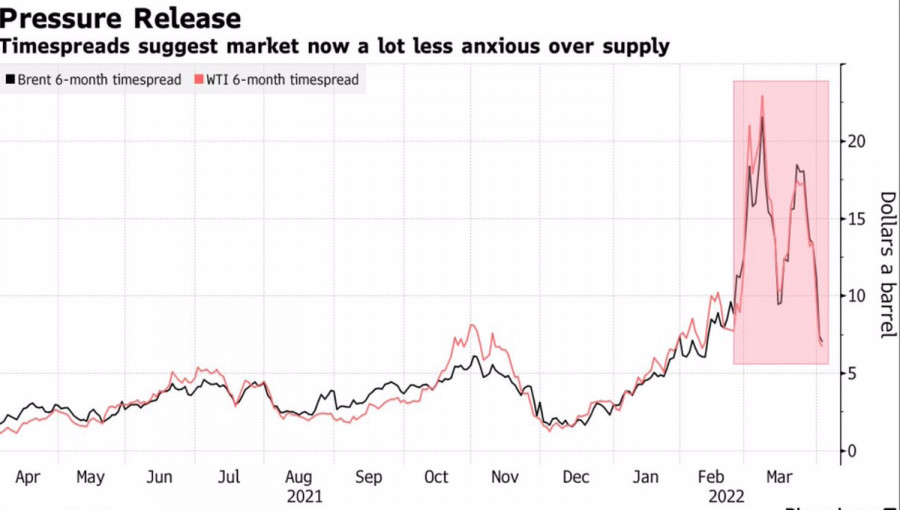
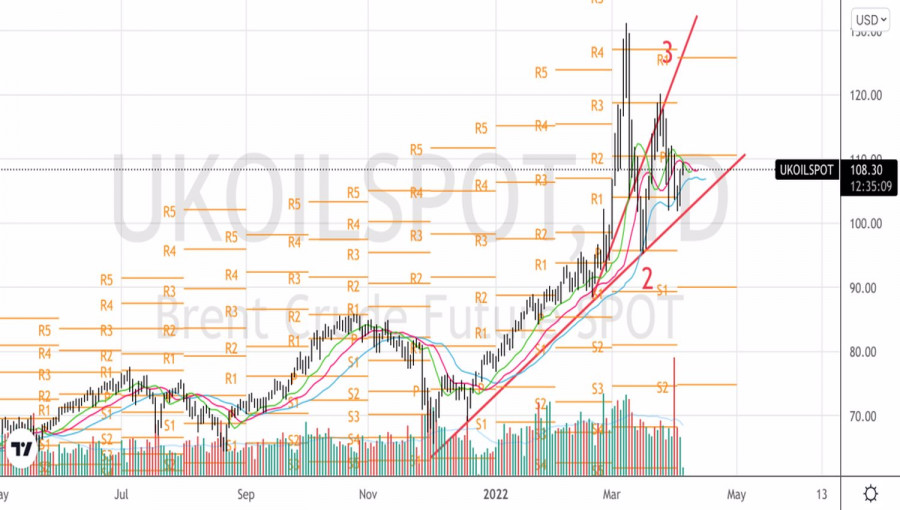
| Oil: Uncertainty looms in the market Posted: 05 Apr 2022 05:59 AM PDT The US and the EU intend to punish Russia, which leads to an increase in oil prices. This is unprofitable for the American and global economy and forces Washington to take unprecedented measures - the largest sale of oil from strategic reserves. As a result, a vicious circle arises when, after the fall of Brent quotes, their growth occurs. The decision of the White House to sell 180 million barrels of oil within 6 months from strategic reserves, which is equivalent to 1 million b/d, or 1% of global demand, provoked a drop in quotes of the North Sea variety to a 2-week bottom. Information about the largest outbreak of COVID-19 in China, where about 25 million people were isolated, added fuel to the fire of sales. China is the largest oil consumer in the world, so the deterioration of the epidemiological situation in this country is a negative for Brent. The sales were also facilitated by the news that negotiations on a nuclear deal with Iran have reached an impasse. At the beginning of the week, by April 4, everything turned upside down again. The topic of additional sanctions has been revived. The latter could affect EU imports of Russian oil, which would deal a devastating blow to the supply. In fact, the EU's dependence on energy supplies is so great that Brussels is unlikely to take drastic measures. This is also signaled by the "bullish" conjuncture of the oil market. Six-month spreads between WTI near-term versus longer-term contracts are currently around $6, compared to $13 prior to Washington's announcement of the sale of oil from strategic reserves. The same applies to Brent, where the difference has returned to the levels that took place at the beginning of the armed conflict in Ukraine. Dynamics of backwardation in the oil market
Based on the backwardation, the recovery of the upward trend for the North Sea variety looks unlikely. SaxoBank believes that Brent will trade in the $90-120/bbl range in the second quarter, given a number of market uncertainties. In particular, risk factors for buyers include progress in negotiations on a nuclear deal with Iran, which could bring an additional 1.3 million b/d to the market; allowing Venezuela to increase production; and growth in US shale oil production. At the same time, not everyone is sure that oil will not be able to rewrite the March maximum. Vitol, the world's largest independent crude oil trader, believes the risks of a total Russian exclusion from the market are not yet fully priced in, while Goldman Sachs draws attention to a 1.5 million b/d deficit and the lowest demand-adjusted global inventories in the latest stories. Technically, on Brent's daily chart, consolidation within the 1-2-3 model indicates high risks of the formation of the Splash and Shelf pattern. The borders of the "shelf" are located at $103.5 and $118.7 per barrel. At the same time, a break of resistance at $110.5 could be a signal to buy in the direction of the upper one. Brent, Daily chart
|
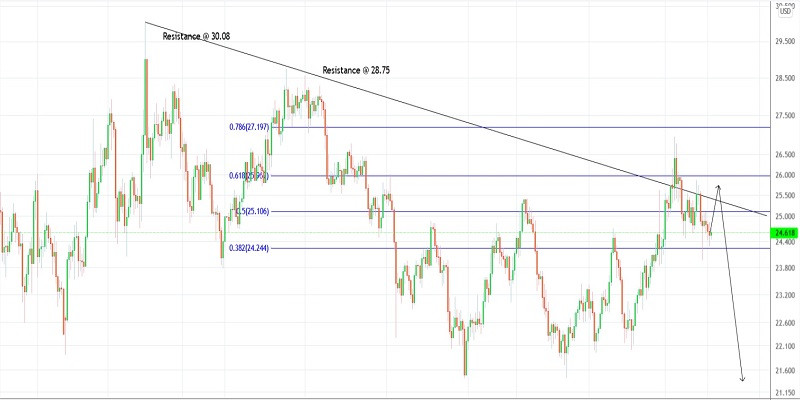
| Trading plan for Silver for April 05, 2022 Posted: 05 Apr 2022 05:48 AM PDT
Technical outlook:Silver might be preparing for a counter trend rally towards $25.80 levels before turning lower again. The metal has been in a down trend since $30.08 highe and it has carved yet another higher low around $26.95 mark on March 08, 2022. Ideally, prices should stay below that price and drag lower $21.00 and further. Silver had earlier dropped from $28.75 highs through $21.50 lows, carving a meaningful downswing. Prices also produced a counter trend rally through $26.95 levels testing the down trend line and fibonacci 0.618 retracement of the above downswing. High probability remains for prices to resume lower from here and drag below $21.00. Siver could produce a short term rally towards $25.80 carving yet another lower high before turning bearish. Bottom line for the above bearish structure to hold good is the $28.75 resistance, which should remain intact. Only a push beyond $28.75 could turn the structure to medium term bullish and delay the expected drop. Trading plan:Potential drop below $21.00 against $28.75 Good luck! The material has been provided by InstaForex Company - www.instaforex.com |
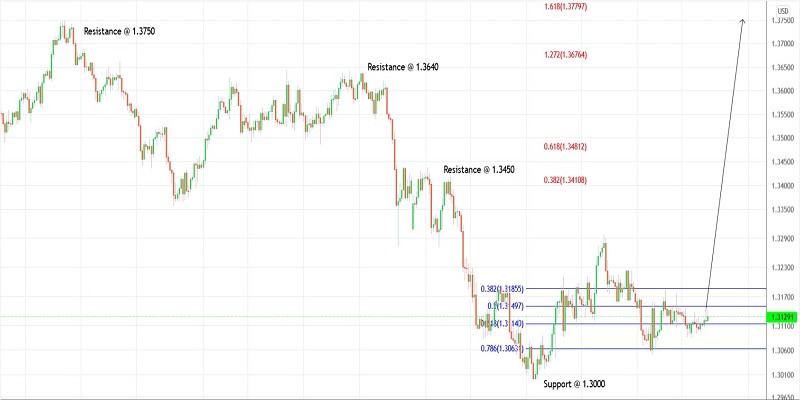
| Trading plan for GBPUSD for April 05, 2022 Posted: 05 Apr 2022 05:13 AM PDT
Technical outlook:GBPUSD is preparing to stage an impressive rally towards 1.3500 and 1.3750 levels in the next few trading sessions. A push above 1.3300 interim resistance will accelerate and confirm further upside. Bulls will remain poised to hold prices above 1.3000 handle to keep the immediate bullish structure intact. GBPUSD has carved a recent upswing between 1.3000 and 1.3300 levels as seen on th 4H chart here. Prices have also retraced through the Fibonacci 0.786 levels around 1.3060 mark producing a bullish bounce (Engulfing bullish candlestick pattern). If the above structure holds well, prices would resume higher anytime soon and push through 1.3450 resistance. GBPUSD bulls will be considered to be back on control on a break above 1.3450. It will open open the door to further upside towards 1.3750, which is the next in-line resistance on the chart here. Only a break below 1.3000 interim support will delay matters further as bears might gain upper hand over the short term. Trading plan:Potential rally through 1.3500 and 1.3700 against 1.3000 Good luck! The material has been provided by InstaForex Company - www.instaforex.com |
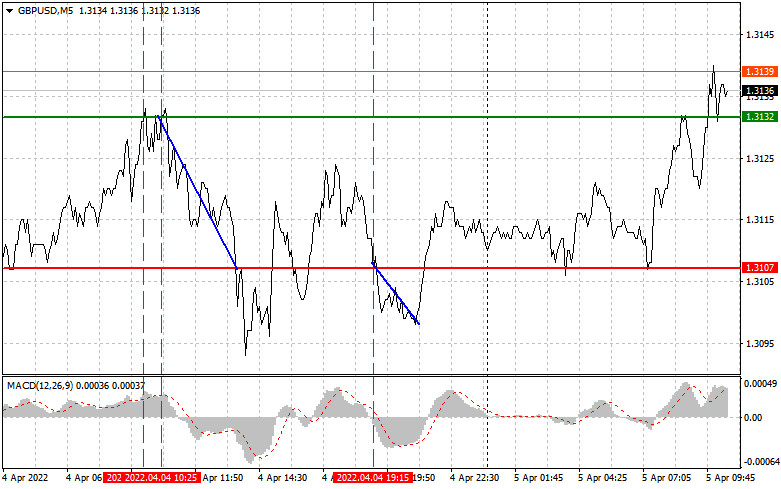
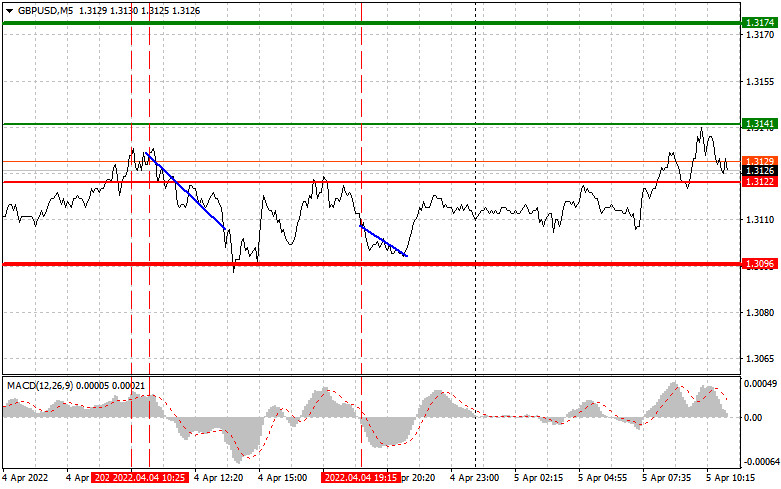
| Analysis and trading tips for GBP/USD on April 5 Posted: 05 Apr 2022 04:58 AM PDT Analysis of transactions in the GBP / USD pair A signal to buy emerged after GBP/USD hit 1.3132. However, there was no sharp increase because the MACD line being far from zero limited the upside potential of the pair. Some time later, another test of this range took place, but this time the signal that emerged was to sell. Since the MACD was already in the overbought area, the pair fell by 25 pips, to the support level of 1.3107. The test of this range in the afternoon led to another decline, but only a little.
The statements of Bank of England members did not lead to a significant surge in volatility, keeping GBP/USD within the sideways channel. US data on manufacturing orders also did not result in anything, most likely because the worsening geopolitical situation is driving the markets. Today, investors should pay attention to the upcoming PMI reports from the UK. The US will also release similar data, but more important are the foreign trade balance and business activity in the services sector. Statements from FOMC members Lael Brainard and John Williams could increase demand for dollar, resulting in another decline in GBP/USD. The Fed's aggressive interest rate policy will also affect the markets. For long positions: Buy pound when the quote reaches 1.3141 (green line on the chart) and take profit at the price of 1.3174 (thicker green line on the chart). A rally will occur if upcoming PMI data exceed expectations. When buying, make sure that the MACD line is above zero, or is starting to rise from it. It is also possible to buy at 1.3122, but the MACD line should be in the oversold area as only by that will the market reverse to 1.3141 and 1.3174. For short positions: Sell pound when the quote reaches 1.3122 (red line on the chart) and take profit at the price of 1.3096. Pressure is likely to continue, especially since the attempt to break through 1.3141 failed. The outlook for the UK economy is also getting gloomier every day. But before selling, make sure that the MACD line is below zero, or is starting to move down from it. Pound can also be sold at 1.3141, however, the MACD line should be in the overbought area, as only by that will the market reverse to 1.3122 and 1.3096.
What's on the chart: The thin green line is the key level at which you can place long positions in the GBP/USD pair. The thick green line is the target price, since the quote is unlikely to move above this level. The thin red line is the level at which you can place short positions in the GBP/USD pair. The thick red line is the target price, since the quote is unlikely to move below this level. MACD line - when entering the market, it is important to be guided by the overbought and oversold zones. Important: Novice traders need to be very careful when making decisions about entering the market. Before the release of important reports, it is best to stay out of the market to avoid being caught in sharp fluctuations in the rate. If you decide to trade during the release of news, then always place stop orders to minimize losses. Without placing stop orders, you can very quickly lose your entire deposit, especially if you do not use money management and trade large volumes. And remember that for successful trading, you need to have a clear trading plan. Spontaneous trading decisions based on the current market situation is an inherently losing strategy for an intraday trader. The material has been provided by InstaForex Company - www.instaforex.com |
| Bitcoin to become world's digital gold Posted: 05 Apr 2022 04:46 AM PDT
As the adoption of cryptocurrencies into the economies of the world continues, and prices also continue to rise, the cryptocurrency market is maturing, and Bitcoin is on its way to becoming the world's digital gold, according to Bloomberg Intelligence. Despite lagging behind gold, Bitcoin will most likely outstrip the precious metal by the end of the year. Since the beginning of the year, Bitcoin has fallen by about 2%, while gold has risen by almost 6%. In his April outlook, Bloomberg Intelligence senior commodity strategist Mike McGlone said that Bitcoin's price trajectory remains in an upward trend due to the declining supply of the cryptocurrency and growing adoption of the cryptocurrency. And that, most likely, bitcoin is approaching $100,000.
According to McGlone, it is unlikely that Bitcoin will stumble or be prevented from getting ahead of gold. And the reduction in supply, if the rules of the economy are applied, contributes to the increase in the price of cryptocurrency. New coins are limited to 900 a day by code until 2024, then they will be halved. In 2020, the supply was halved, from 1800 coins per day. What sets Bitcoin apart is its 21 million Bitcoin limit, with 90% of those already mined. Bitcoin reached a new milestone last week, with records showing that 19 million Bitcoins have been minted so far. The next halving is expected to take place in May 2024. And based on the halving schedule, the last Bitcoin is predicted to be mined in 2140. The geopolitical situation in Ukraine could be an important moment for Bitcoin and the level of volatility. At around 5x the 260-day volatility of gold, Bitcoin's relative risk declines and compares to similar peaks of around 10x in 2018 and 12x in 2011. Most of the signs point to higher Bitcoin prices in the near term. The material has been provided by InstaForex Company - www.instaforex.com |
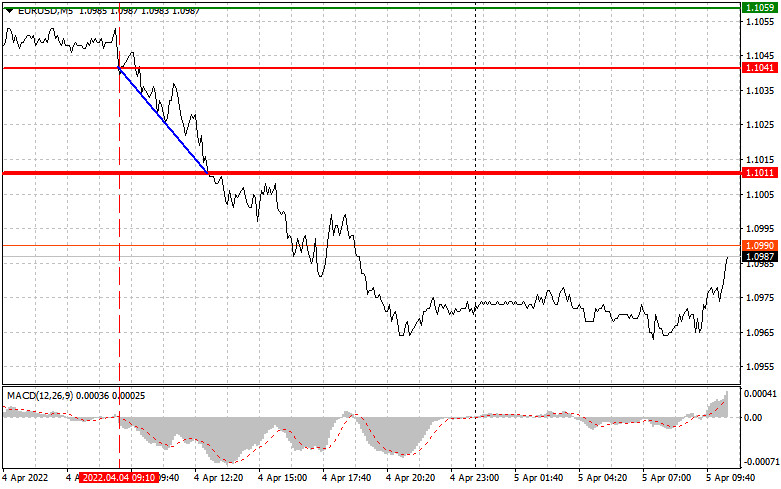
| Analysis and trading tips for EUR/USD on April 5 Posted: 05 Apr 2022 04:46 AM PDT Analysis of transactions in the EUR / USD pair A signal to sell emerged after EUR/USD hit 1.1031. Coincidentally, the MACD line was starting to move below zero, so the pair fell by about 30 pips. It went all the way to 1.1011. Meanwhile, long positions led to losses because pressure on the euro continued further.
Investor confidence in the Euro area turned out to be much worse than expected, leading to a sharp sell-off in EUR/USD yesterday morning. Meanwhile, the volume of manufacturing orders in the US did not affect the market in any way, most likely because the worsening geopolitical situation is currently driving everything. Today, investors should pay attention to the upcoming PMI reports from Germany, France, Italy and the eurozone. The US will also release similar reports, but more important are the data on foreign trade balance and business activity in the services sector. Statements from FOMC members Lael Brainard and John Williams could increase demand for dollar, resulting in another decline in EUR/USD. The Fed's aggressive interest rate policy will also affect the markets. For long positions: Buy euro when the quote reaches 1.0992 (green line on the chart) and take profit at the price of 1.1020 (thicker green line on the chart). However, a further increase is unlikely today, except if the PMI data turns out much better than expected and if the situation in the world improves. In any case, when buying, make sure that the MACD line is above zero or is starting to rise from it. It is also possible to buy at 1.0968, but the MACD line should be in the oversold area as only by that will the market reverse to 1.0992 and 1.1020. For short positions: Sell euro when the quote reaches 1.0968 (red line on the chart) and take profit at the price of 1.0945. Pressure will return if data on the EU economy comes out much weaker than expected. Deterioration of the situation in the political area will also lead to a decline. But before selling, make sure that the MACD line is below zero, or is starting to move down from it. Euro can also be sold at 1.0992, however, the MACD line should be in the overbought area, as only by that will the market reverse to 1.0968 and 1.0945.
What's on the chart: The thin green line is the key level at which you can place long positions in the EUR/USD pair. The thick green line is the target price, since the quote is unlikely to move above this level. The thin red line is the level at which you can place short positions in the EUR/USD pair. The thick red line is the target price, since the quote is unlikely to move below this level. MACD line - when entering the market, it is important to be guided by the overbought and oversold zones. Important: Novice traders need to be very careful when making decisions about entering the market. Before the release of important reports, it is best to stay out of the market to avoid being caught in sharp fluctuations in the rate. If you decide to trade during the release of news, then always place stop orders to minimize losses. Without placing stop orders, you can very quickly lose your entire deposit, especially if you do not use money management and trade large volumes. And remember that for successful trading, you need to have a clear trading plan. Spontaneous trading decisions based on the current market situation is an inherently losing strategy for an intraday trader. The material has been provided by InstaForex Company - www.instaforex.com |
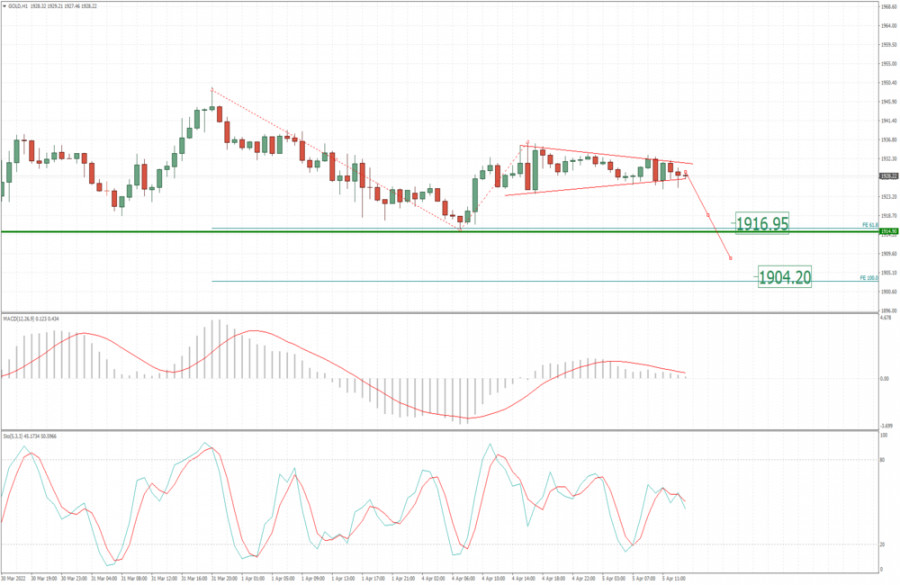
| Analysis of Gold for April 05,.2022 - Watch for the breakout of the contraction Posted: 05 Apr 2022 04:30 AM PDT Technical analysis:
Gold has been trading sideways at the price of $1.928. There is potential for the downside breakout of the contraction. Trading recommendation: Due to the mid-term downside cycle in the play, I see potential for the downside continuation. Watch for selling opportunities on the potential breakout of support at $1.924. Downside objectives are set at the price of $1.916 and $1.904. Stochastic is showing fresh bear cross, which is another sign and confirmation for the downside movement. Key resistance is set at $1.935 The material has been provided by InstaForex Company - www.instaforex.com |
| Trading plan for Gold for April 05, 2022 Posted: 05 Apr 2022 04:27 AM PDT
Technical outlook:Gold prices have remained subdued since early this week trading within a tight range between $1,930 and $1,935 levels. The yellow metal can take a dip towards $1,915-20 zone from current levels before turning higher again. Bulls will remain poised to hold prices above $1,890 mark to keep its immediate bullish structure intact. Gold prices have carved a lower high around $2,070 mark in March 2022. Since then, bears have regained control and dragged prices lower through $1,890 levels over the last week. After dropping lower for almost a month, the yellow metal might be producing a counter trend rally in the next several trading sessions. Gold prices could reach up to $2,000 levels, which is fibonacci 0.618 retracement of the entire drop between $2,070 and $1,890 levels respectively. Potential also remains for a push through $2,030 mark, which is also converging with fibonacci 0.786 retracement. Bears will remain inclined to drag prices lower below $1,890 mark thereafter. Trading plan:Potential rally through $2,000 mark, then reversal. Good luck! The material has been provided by InstaForex Company - www.instaforex.com |
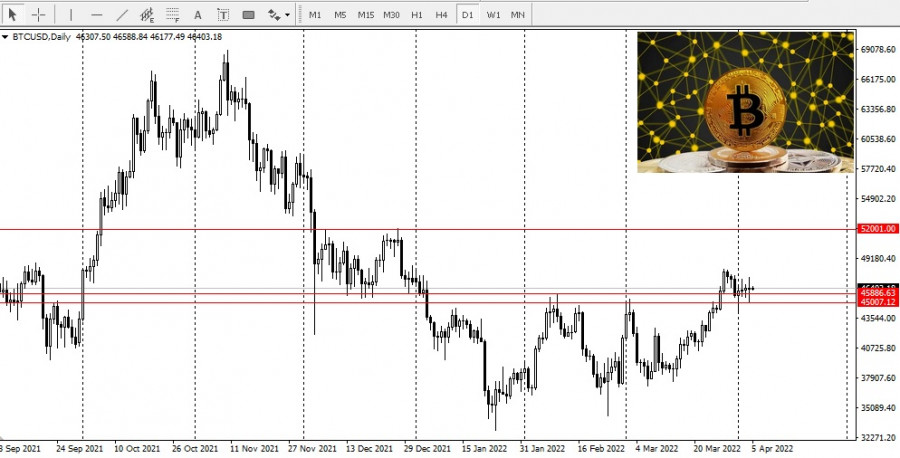
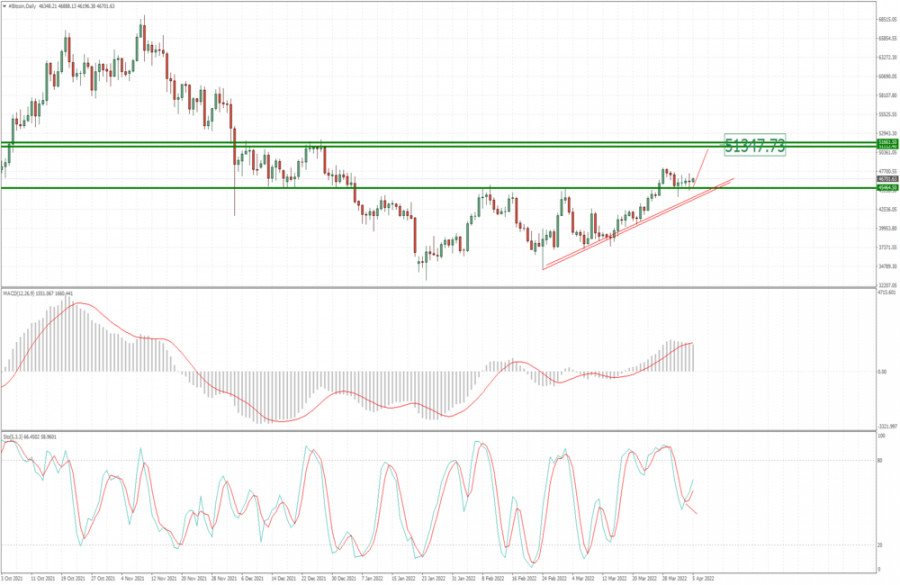
| BTC update for April 05,.2022 - Buyers in control Posted: 05 Apr 2022 04:25 AM PDT Technical analysis:
BTC has been trading sideways at the price of $46.680. There is potential for the bigger rally due to the breakout of the main pivot in the background. Trading recommendation: Due to the upside momentum and the breakout of the key pivot at $45.565, I see potential for the upside continuation. Watch forbuying opportunities on the pullbacks with the upside objective at $51.350 Stochastic is showing fresh bull cross, which is another sign and confirmation for the upside movement. MACD is showing upside reading, which is confirmation that upside cycle is present. Key support is set at $45.565 The material has been provided by InstaForex Company - www.instaforex.com |
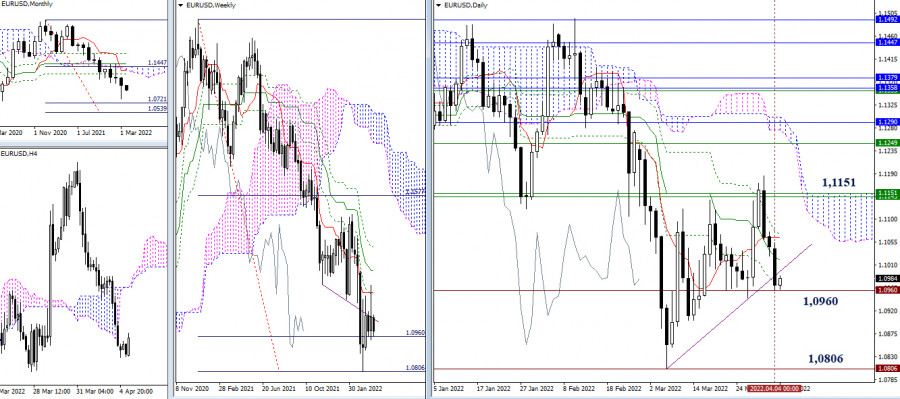
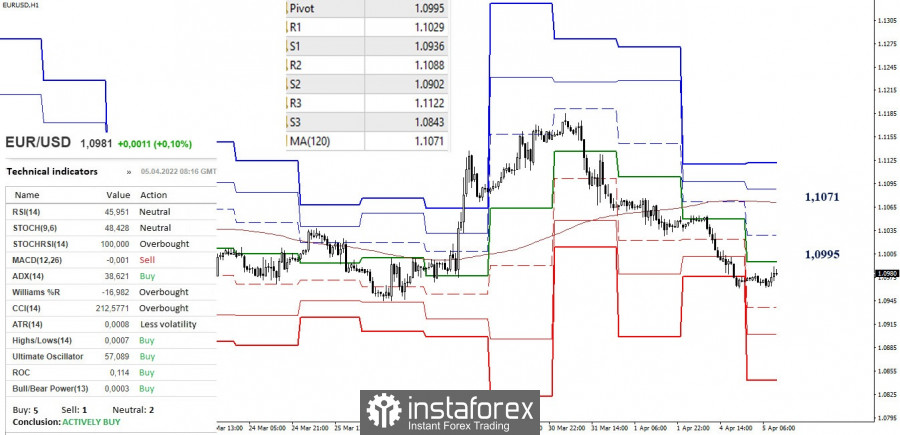
| Technical analysis recommendations on EUR/USD and GBP/USD for April 5, 2022 Posted: 05 Apr 2022 04:05 AM PDT EUR/USD
The pair again went down to the support of 1.0960. The further development of the situation now depends on the ability of the bears to consolidate under the correction trend line, then directing their efforts to exit the zone and restore the downward trend (1.0806). Deceleration, consolidation and the formation of a rebound from the tested support (1.0960) will complicate, perhaps even cancel the exit from the correction zone, helping bulls for a new approach to conquer weekly resistances (1.1144 – 1.1151).
The main advantage in the lower timeframes currently belongs to bears. The reference points for the continuation of the decline within the day today are at 1.0936 – 1.0902 – 1.0843 (support of classic pivot points). Nevertheless, despite the bearish advantage, it should be noted that the pair is in the correction zone, approaching the testing of the central pivot point (1.0995). The next reference points for the development of the correction are R1 (1.1029) and the weekly long-term trend (1.1071). Fixing the above will require a new assessment of the situation, as the current balance of power will be disrupted. *** GBP/USD
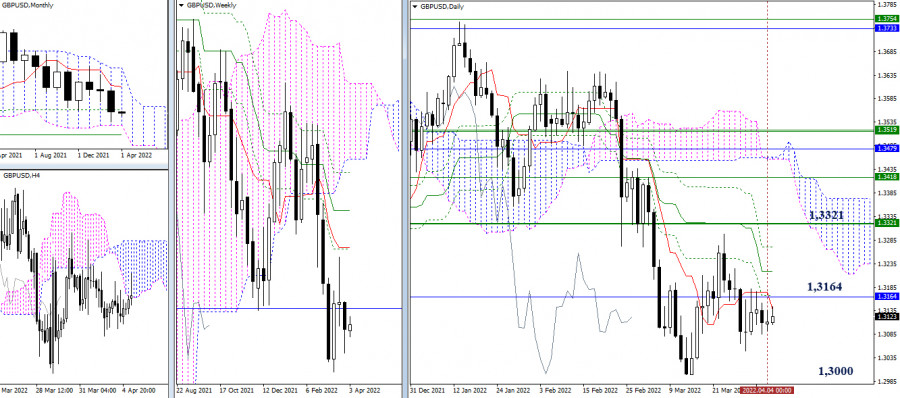
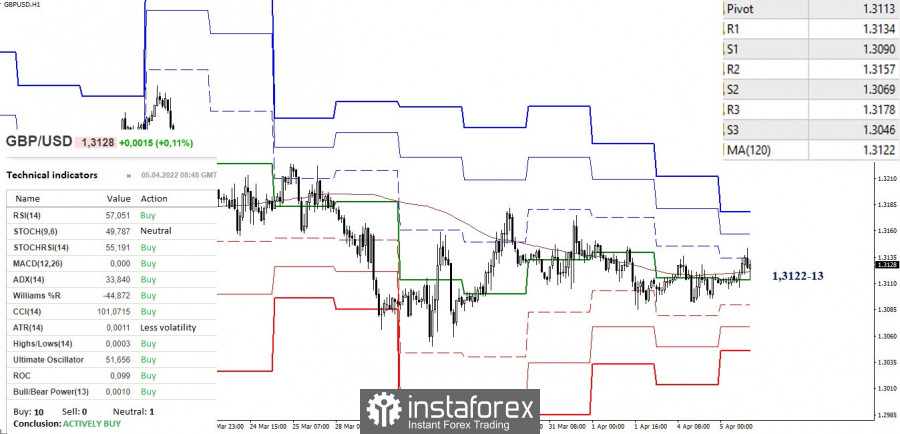
Consolidation, which is developing under the accumulation of resistance at the turn of 1.3164, is preserved. At the same time, the location of the main landmarks of this site is also preserved. The reference points for the decline are the minimum extremum (1.3000) and monthly supports at 1.2950 and 1.2830. The most important upside target remains at 1.3321 (weekly levels), while 1.3218 and 1.3270 (daily levels) may act as intermediate resistances during the rise.
On the lower timeframes, daily consolidation continues to be expressed in uncertainty, and the pair remains tied to key levels around 1.3122-13 (weekly long-term trend + central pivot point). Working above the levels favors the bulls. Their additional references within the day are located today at 1.3157 - 1.3178 (classic pivot points). Consolidation and work below key levels will strengthen bearish sentiment. The intraday supports for this movement will be 1.3090 – 1.3069 – 1.3046 (classic pivot points). *** In the technical analysis of the situation, the following are used: higher timeframes – Ichimoku Kinko Hyo (9.26.52) + Fibo Kijun levels H1 - Pivot Points (classic) + Moving Average 120 (weekly long-term trend) The material has been provided by InstaForex Company - www.instaforex.com |
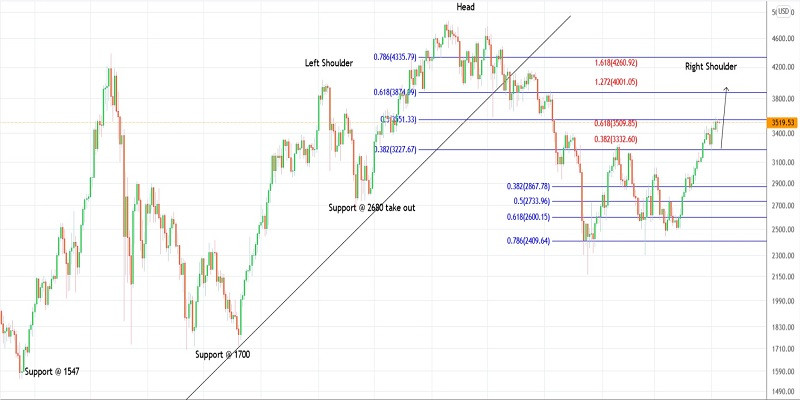
| Trading plan for Ethereum for April 05, 2022 Posted: 05 Apr 2022 04:03 AM PDT
Technical outlook:Ethereum bulls have managed to push prices higher through $3,500 mark on Tuesday, falling in line with expectations. The initial fibonacci target have been hit around $3,510 level as seen on the daily chart here. Potential still remains for yet another high close to $3,800-4,000 mark, which is fibonacci 0.618 retracement of initial drop. Ethereum had earlier dropped from $4,850 highs through $2,100 lows, carving a meaningful larger degree downswing. The above drop is being worked upon as bulls are unfolding a counter trend rally towards $3,800-4,000 zone. The counter trend is progressing since $2,100 lows and seem to be into its last leg higher. Ethereum is also close to carving a potential right shoulder through $3,800-4,000 levels before turning lower again. The conventional Head and Shoulder reversal pattern is close to terminating its potential Right Shoulder before bears are back in control.They would remain poised to drag prices below $2,100 mark going forward. Trading plan:Potential profit booking seen close to $3,800-4,000 level. Good luck! The material has been provided by InstaForex Company - www.instaforex.com |
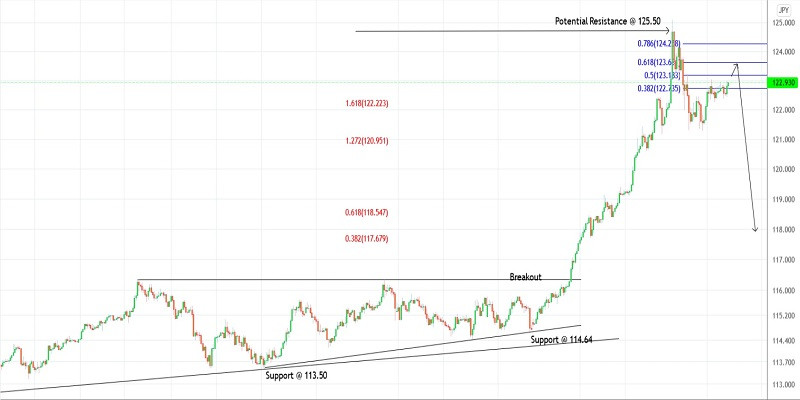
| Trading plan for USDJPY for April 05, 2022 Posted: 05 Apr 2022 03:45 AM PDT
Technical outlook:USDJPY is producing a counter trend rally toward 123.60-124.00 zone before it could find resistance. The currency pair might have carved a formidable resistance around 125.00 levels and could be soon on its way lower through 116.35 at least. Bears need to hold prices below 125.10 mark to keep the bearish structure intact. USDJPY had been in a triangle consolidation earlier, which got burst above 116.35 mark as bulls regained control. The currency had produced a religious rally towards 125.00 mark in a thrust wave after triangle breakout. It could be the last leg higher before reversing sharply and drag below 116.35 mark going forward. Also note that potential remains for a break below 114.60 initial support. If the above unfolds accordingly, it will confirm a bearish trend reversal as prices head lower through 109.00 i the next several trading sessions. Watch out for a bearish turn around 123.60-124.00 zone in the next 1-2 trading sessions. Trading plan:Potential drop through 116.35 against 125.50 Good luck! The material has been provided by InstaForex Company - www.instaforex.com |
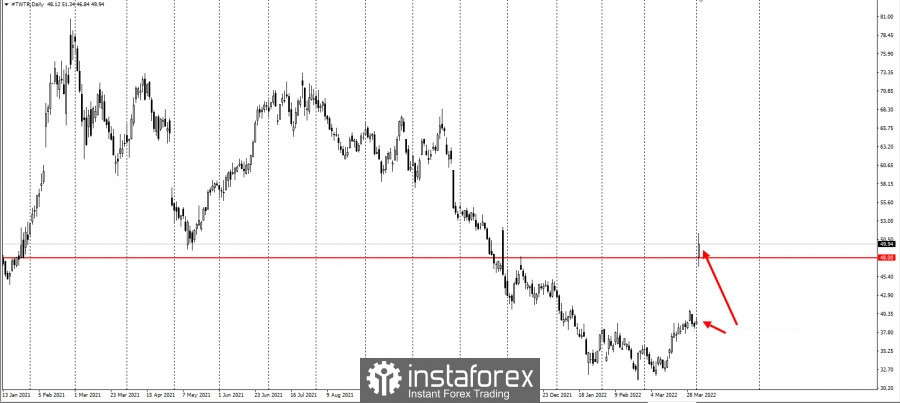
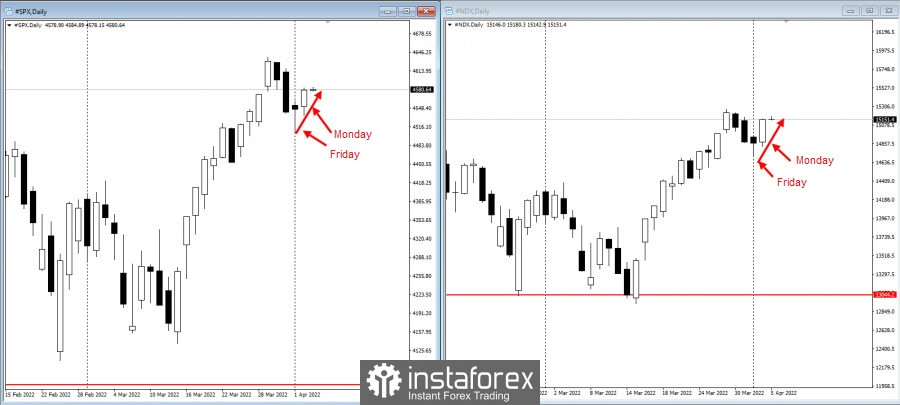
| US stocks post rally on Monday Posted: 05 Apr 2022 03:44 AM PDT
US stocks rose on Monday after Twitter shares soared 31%, thanks to Tesla CEO Elon Musk taking a 9.2% stake in the company.
Meanwhile, Starbucks saw a decline after founder Howard Schultz suspended a share buyback plan. US-listed Chinese stocks, such as Baidu and Tencent Holdings, also posted an increase after China cleared a key hurdle to give the US full access to audits.
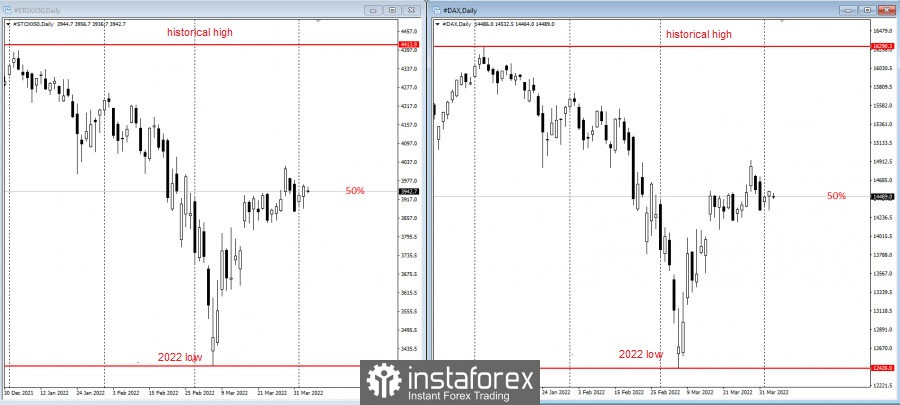
Morgan Stanley chief strategist Michael Wilson said the bear market is now over, leaving investors more constructive on bonds rather than equities in the near term as "growth concerns take center stage". Meanwhile, even though European indices are growing less actively, the bullish trend remains. Both the Stoxx50 and Dax have retraced 50% from their all-time highs and lows this year.
Key events to watch this week: - Fed Governor Lael Brainard's speech on Tuesday; - FOMC minutes on Wednesday; - China composite and service PMIs on Wednesday; - EIA Crude Oil Inventory Report on Wednesday; - Philadelphia Fed President Patrick Harker's speech on Wednesday; - James Bullard, Raphael Bostic and Charles Evans' speeches on Thursday; - Rate decision of the Reserve Bank of India on Friday. The material has been provided by InstaForex Company - www.instaforex.com |
| Posted: 05 Apr 2022 03:26 AM PDT
The geopolitical situation is not weakening, but there are already serious consequences. According to some economists, this is the end of globalization. They said this because even if the conflict in Eastern Europe ends, there will be a relationship between current allies and adversaries that will not be easily reversed. Also, global commodity markets are in turmoil already because many countries seek to create their own domestic supply chains. The biggest impact is felt in the energy sector, particularly in Europe, as it seeks to cut its dependency on Russia regarding oil and gas supplies. But if Russia really slash its supplies, some economists say Europe, already teetering on the brink, could fall into a full-blown recession. Agriculture and non-ferrous metals have also been affected by the growing geopolitical tensions. Many economists and market analysts also see a growing trend, where countries wary of the US, as well as its Western allies, begin to reduce their reliance on the US dollar. But USD accounts for about 60% of all world reserve assets right now, so it is likely that decades will pass before the US will lose its reserve currency status. This, though, will not stop governments and central banks from diversifying their assets now. Not only are countries trying to isolate themselves through diversification, but it is likely that the development of domestic supply chains will lead to higher consumer prices. The material has been provided by InstaForex Company - www.instaforex.com |
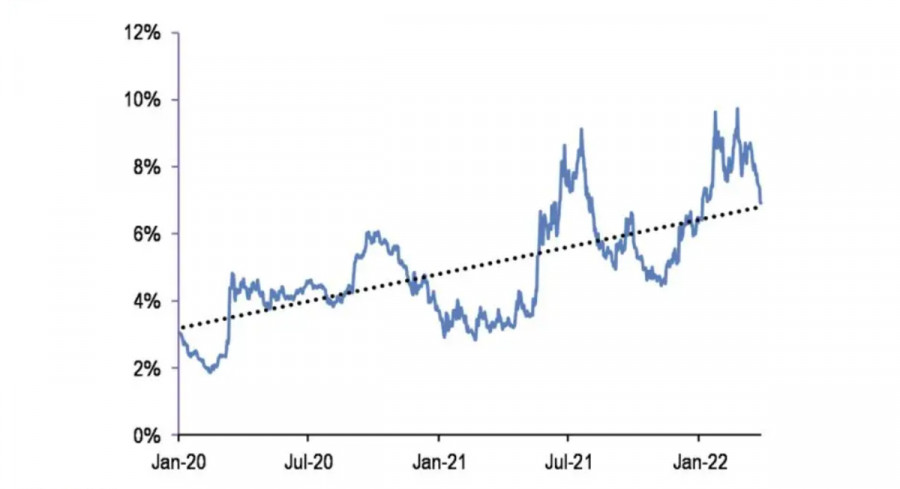
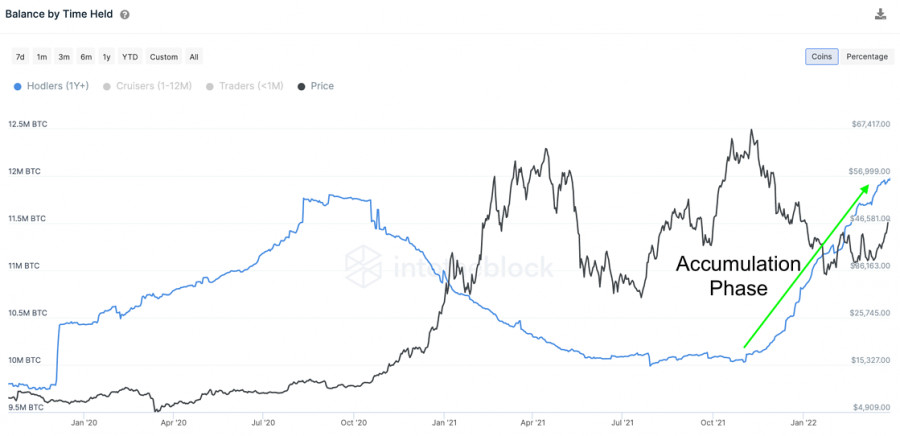
| Posted: 05 Apr 2022 03:23 AM PDT Long-term holders and large investors have become the main driving force behind the current rally in Bitcoin and the cryptocurrency market. After the outbreak of the war in Ukraine, there was a gradual increase in the number of stablecoins in the total share of capitalization. Initially, this maneuver of investors could be regarded as an opportunity to save capital in a digital asset pegged to the U.S. dollar. However, there was another version, which is that stablecoin stocks are much easier to convert into a specific cryptocurrency. After a month, it can be stated that the main reason for the growth of the cryptocurrency market was the planned and lengthy preparation for the accumulation of stablecoins. At the peak, the share of stablecoins in cryptocurrency capitalization reached 10%+. Subsequently, some long-term holders, Russians under sanctions, as well as miners began to sell their cryptocurrency reserves for various reasons. As a result, a huge supply of BTC coins was formed on the market. Large investors and other holders turned out to be ready for this, having large stocks of stablecoins. We see the results of volume absorption in the market capitalization, which reached $2.1 trillion.
Between the end of February and mid-March, large investors accumulated about 12 million BTC, which is equivalent to $551 billion. Thanks to this, BTC/USD quotes reached a local high at $48k, and the fear and greed index reached the greed mark for the first time in several months. However, as of April 5, Bitcoin has stopped its upward movement, as has the cryptocurrency market. Faced with a strong zone of bear interest, the asset fell to the local support zone. The altcoin market also stopped growing due to the influence of the first cryptocurrency. JPMorgan's chief strategist Nikolaos Panigirtzoglou is confident that this is due to a gradual decrease in the investment activity of buyers and a further slowdown in growth.
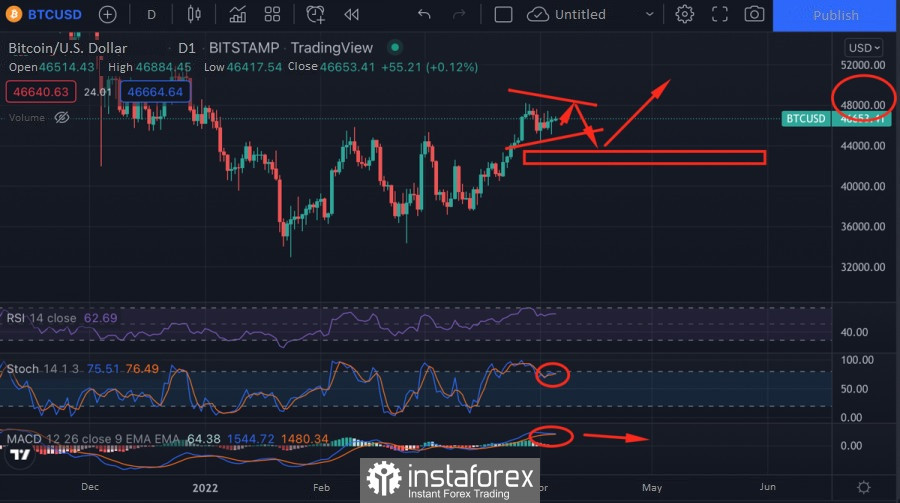
In other words, Panigirtzoglou believes that the growth of the cryptocurrency market has stalled. He considers the share of stablecoins in market capitalization as fuel for the growth of cryptocurrencies. According to him, when the share of stablecoins reaches 10%, the market showed active growth. As of April 5, the share of stablecoins has fallen to 7%, indicating a decrease in purchasing power. Panigirtzoglou is sure that all further growth of Bitcoin and the market will be limited due to the lack of necessary liquidity. There is some truth in the words of the JPMorgan expert, but I would like to note that the market still has not lost its potential for growth. In addition to stablecoins, which have apparently become liquidity from the outside, the market has its own reserves. First of all, this can be seen from the indicators of funding rates, which are in neutral positions. Given the bullish sentiment, keeping rates at average values indicates the presence of shorts, which is the "fuel" for a further price rally. In addition, market participants continue to take profits locally when BTC reaches $48k. With this in mind, there is a period of consolidation and additional accumulation before further upward movement. We see the same thing on the Bitcoin charts. The cryptocurrency has been in a consolidation phase since March 28. Buying activity really declined, and the asset failed to break through the $48k milestone. Despite this, BTC is fixing in the $46k area and consolidating the price for a further assault on $48k. Technical indicators point to continued flat dynamics over the next few days with the possibility of a second decline to $44k. This is hinted at by a local bearish crossover on the MACD and the stochastic oscillator. Therefore, in the near future, we should expect a local decrease for additional liquidity collection and a retest of $48k.
|
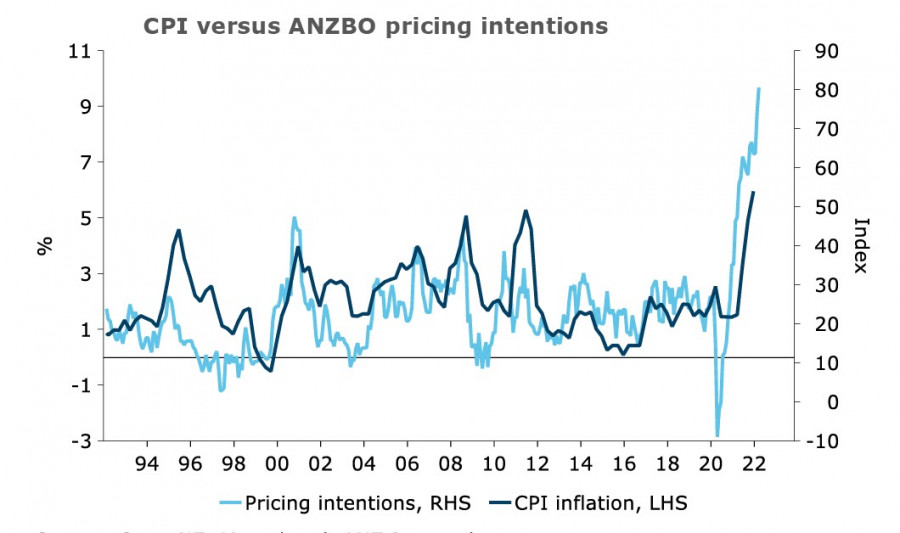
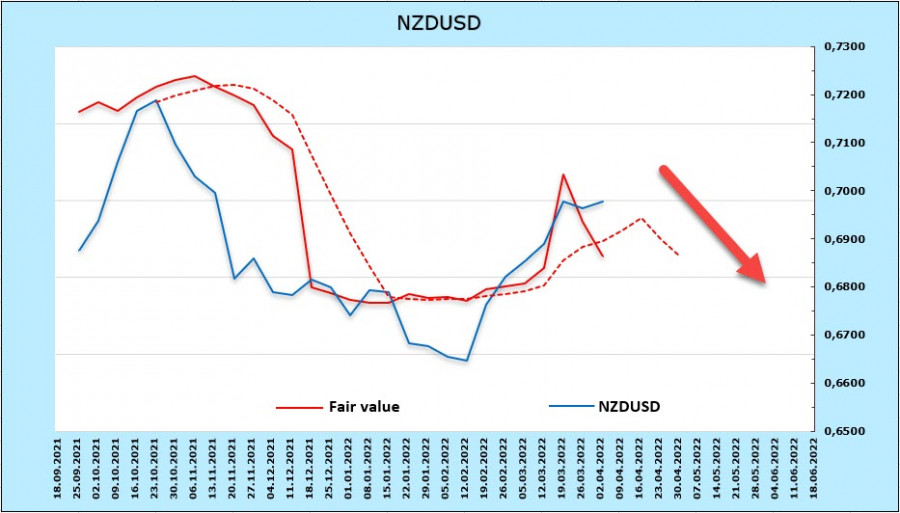
| Review of USD, NZD and AUD: Commodity currencies rally amid improving risk appetite Posted: 05 Apr 2022 03:01 AM PDT Commodity currencies started this week as neutral, but with a slight bullish edge. US indices have shown some gains on Monday, Asian indices traded in the green zone on Tuesday, while yields, on the other hand, posted low dynamics. Oil prices also increased once again, primarily due to the current geopolitical situation and manoeuvres. Most likely, these movements will continue today, along with some rollback in demand for dollar. NZD/USD Business confidence and business activity expectations stabilized in March, after falling in February, which is good news for the kiwi. However, inflation expectations also rose, which is definitely bad news. The RBNZ has already raised the rate three times, but so far the price growth has not been stopped and, according to forecasts, inflation will reach 7.1% y/y in the 1st quarter.
Consumer confidence also dipped to a record low of 77.9 points, from a pre-COVID average of 120 points. This means that businesses and households do not expect inflationary pressures to ease. As such, the ANZ Bank believes that the 0.25% rate hike is not enough, so it forecasts the RBNZ to impose another 0.5% increase in April and May. This should not have a noticeable effect on the economy because the labor market is very strong, with the unemployment rate currently being at 3.2% and may decrease to 2.9% by mid-2022. Be that as it may, the momentum for kiwi has clearly slowed down. As follows from the CFTC report, the weekly change in NZD is -236 million. A bearish overweight of -60 million has formed, which, albeit minimal, shows that the dynamics is negative. The settlement price also went below the long-term average, indicating the likelihood of a bearish reversal.
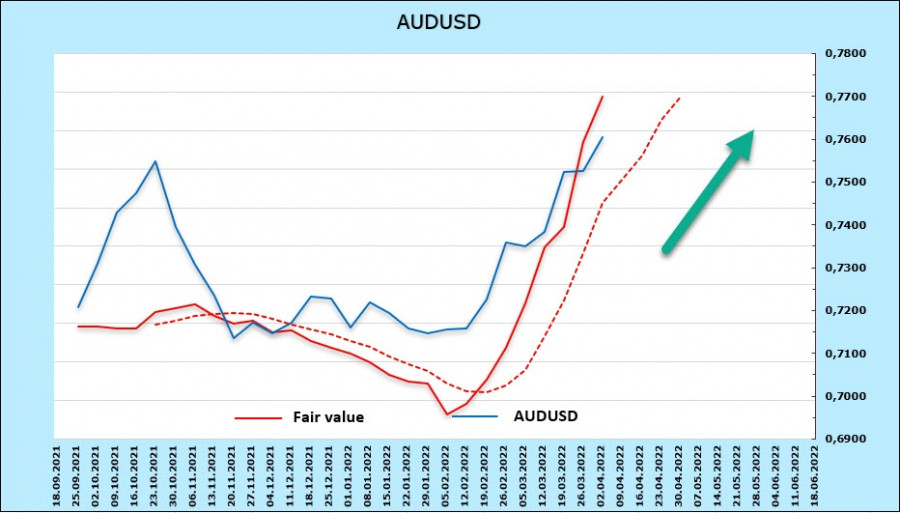
But if positive expectations come to the markets, the pair could rise to 0.7030/50. And even though the further dynamics will be determined by the position of the RBNZ, which, obviously, has every chance to change, support will be 0.6880/6900. AUD/USD The RBA meeting, which ended this morning, did not bring any surprises. The rate remained at 0.1%, primarily because the central bank did not see the current inflation risks more significant than in February. They said wages are growing at a low pace, so there is enough time to reassess the prospects. As for inflation, the University of Melbourne said it rose by 0.6% m/m and increased by 1.1% on a quarterly basis. Taking into account that the February forecast assumed a growth of 0.8%, it can be concluded that inflation is currently higher than the RBA calculated. Although there was no reaction to this risk in today's meeting, expectations for the next meeting will shift in favor of a rate increase, which may cause additional demand for the AUD. For now, the change in AUD positioning for the reporting week is minimal. The net short position decreased by 99 million to -3.725 billion, showing a bearish edge. However, the settlement price is still up, which means that the bullish momentum has not ended.
AUD/USD came close to 0.7620. Perhaps, it would increase further soon towards 0.7898. However, after that, the pair will return to 0.7560. The material has been provided by InstaForex Company - www.instaforex.com |
| Daily Video Analysis: AUDCAD, H4 Bearish Reversal Setup Posted: 05 Apr 2022 02:49 AM PDT Today we take a look at AUDCAD. Combining advanced technical analysis methods such as Fibonacci confluence, correlation, market structure, oscillators and demand/supply zones, we identify high probability trading setups. The material has been provided by InstaForex Company - www.instaforex.com |
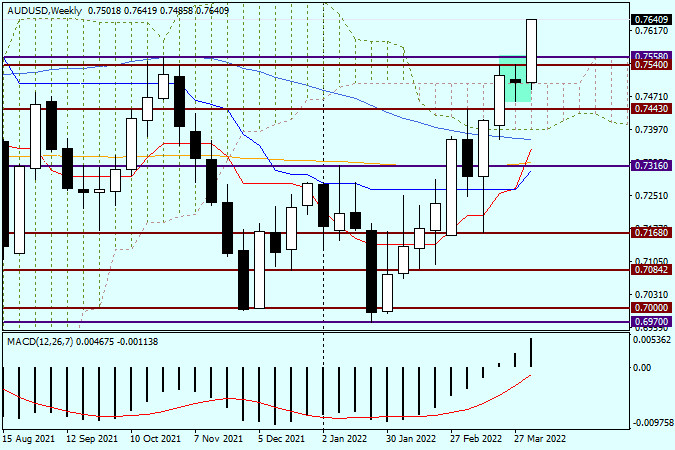
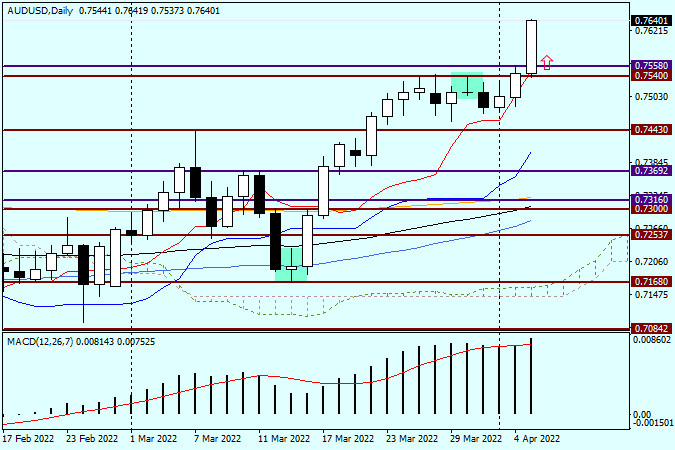
| AUD/USD analysis and forecast on April 5, 2022 Posted: 05 Apr 2022 02:22 AM PDT AUD/USD continues its uptrend I will start my review of the AUD/USD pair by discussing the decision of the Reserve Bank of Australia (RBA) on the interest rate. This is the most significant event for the pair along with tomorrow's minutes of the latest FOMC meeting. As expected, the RBA left its monetary policy unchanged and kept the interest rate at 0.10%. At the same time, the Australian regulator noted that inflation would continue to rise in the near future. The RBA will carefully evaluate inflationary factors and will also continue to support the labor market. The unemployment rate is expected to fall below 4%, but not until the next year. To start the rate hike, the RBA wants to see inflation stabilizing in the target range of 2-3%. The RBA considers the uncertainty in the global financial and energy markets to be the main risk factor along with the supply-demand imbalance. The Australian central bank also noted the accelerated wage growth and increased demand for labor. In general, the decision of the RBA and the comments of its head, Philip Lowe, can be described as neutral-positive, which has definitely affected the trajectory of the Australian dollar. Let's start our review by analyzing the technical picture of the previous trading week. Weekly chart
Judging by the current strong uptrend in the Aussie, traders have simply ignored the reversal candlestick pattern formed at the end of last week. If the uptrend persists, the AUD/USD pair may rise to the resistance level of 0.7891. Of course, this will not happen straight away as the pair has a long way ahead. Let's see how the pair will react to the publication of tomorrow's FOMC minutes. At this stage of trading, we can witness a strong breakout of the key resistance zone at 0.7540-0.7558. Today is only Tuesday, and there is plenty of time for the pair to change its direction by the end of the week. However, given a rather strong bullish sentiment, the trend is unlikely to reverse. The current weekly candlestick may actually form an upper shadow, but a lot will depend on its size. Daily chart
Yesterday, the Aussie bulls tested the key resistance level of 0.7558 but did not rush to break through it, preferring to wait for today's events related to the RBA. Apparently, the market appreciated the rhetoric of the central bank or simply found a reason to continue the upward movement. I would suggest that the main trading idea on the pair will be to buy the Australian dollar after a rebound to the tested resistance level of 0.7558. It is still too early to say whether this is a true breakout. Yet, we can keep this scenario in mind. Good luck! The material has been provided by InstaForex Company - www.instaforex.com |
| Trading plan for starters of EUR/USD and GBP/USD on April 5, 2022 Posted: 05 Apr 2022 02:05 AM PDT Details of the economic calendar from April 4Monday was traditionally accompanied by an empty macroeconomic calendar. Analysis of trading charts from April 4The EURUSD currency pair managed to partially restore dollar positions during the price rebound from the resistance range level of 1.1120/1.1180. This movement returned the quote to the psychologically important area of 1.1000, where there was a slight stagnation. The GBPUSD currency pair is moving in a closed amplitude of 1.3105/1.3180 for the fifth day in a row, showing low activity. This indicates the indecision of traders and the process of accumulation of trading forces. At the same time, when comparing EURUSD and GBPUSD pairs, there is a discrepancy, which should not be due to the positive correlation. This once again proves the fact of the characteristic uncertainty among traders.
Economic calendar for April 5Final data on business activity in Europe, Britain, and the United States are expected today, where no drastic changes are expected. The market reaction is highly likely to be moderate, since the indicators are already taken into account in the quotes. Time targeting EU Services PMI (Mar) - 08:00 UTC UK Services PMI (Mar) - 08:30 UTC US Services PMI (Mar) - 13:45 UTC Trading plan for EUR/USD on April 5At the moment, the market is experiencing a reduction in the volume of short positions due to the variable pivot point in the area of 1.0940/1.0965. This step may lead to a local pullback towards the previously passed level of 1.1000. A subsequent downward move is expected in the market after the price holds below the value of 1.0940 in a four-hour period.
Trading plan for GBP/USD on April 5In this situation, trading tactics still consider the method of breaking through one or another border of the established flat. In this regard, buy positions will be valid after the price holds above 1.3185 in a four-hour period, and sell positions will arise after the price holds below 1.3100 in a four-hour period.
What is reflected in the trading charts?A candlestick chart view is graphical rectangles of white and black light, with sticks on top and bottom. When analyzing each candle in detail, you will see its characteristics of a relative period: the opening price, closing price, and maximum and minimum prices. Horizontal levels are price coordinates, relative to which a stop or a price reversal may occur. These levels are called support and resistance in the market. Circles and rectangles are highlighted examples where the price of the story unfolded. This color selection indicates horizontal lines that may put pressure on the quote in the future. The up/down arrows are the reference points of the possible price direction in the future. The material has been provided by InstaForex Company - www.instaforex.com |
| Indicator analysis of GBP/USD for April 5, 2022 Posted: 05 Apr 2022 01:51 AM PDT Trend analysis (Fig. 1). The market may move up from the level of 1.3111 (close of yesterday's daily candle) to the target at 1.3173, the 50.0% retracement level (red dotted line). In case of testing this level, the price may continue to move upward with the target of 1.3201, the 61.8% retracement level (red dotted line).
Fig. 1 (daily chart). Comprehensive analysis:
General conclusion: The price may move down from the level of 1.3111 (close of yesterday's daily candle) to the target at 1.3173, the 50.0% retracement level (red dotted line). In case of testing this level, the price may continue to move upward with the target at 1.3201, the 61.8% retracement level (red dotted line). Alternative scenario: from the level of 1.3111 (close of yesterday's daily candle), the price may move up with the target at 1.3144, the 38.2% retracement level (red dotted line). In case of testing this level, the price may move down with the target at 1.3050, the lower fractal (red dotted line). Upon reaching this level, upward movement is possible with the target at 1.3085, the 14.6% retracement level (red dotted line). The material has been provided by InstaForex Company - www.instaforex.com |
| Forex forecast 04/01/2022 AUD/USD, USD/JPY, Oil and SP500 from Sebastian Seliga Posted: 05 Apr 2022 01:46 AM PDT Let's take a look at the technical picture of AUD/USD, USD/JPY, Oil and SP500 The material has been provided by InstaForex Company - www.instaforex.com |
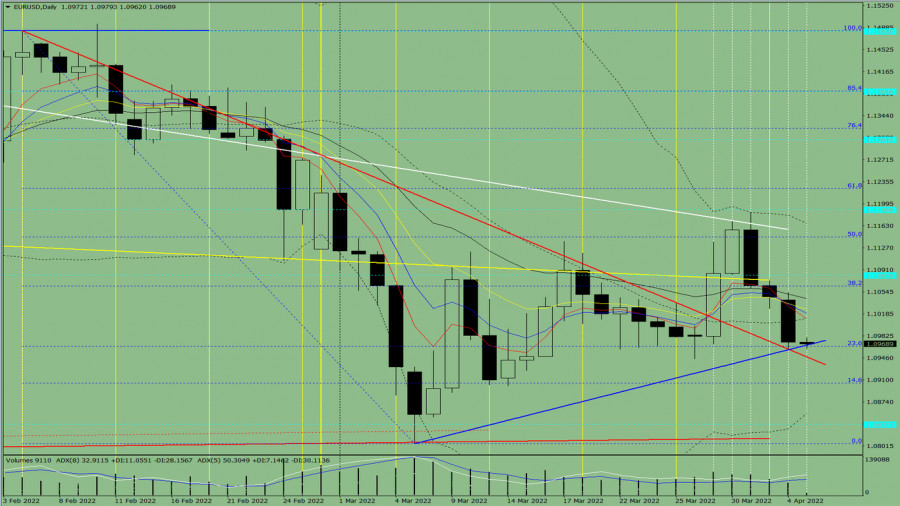
| Indicator analysis of EUR/USD for April 5, 2022 Posted: 05 Apr 2022 01:39 AM PDT Trend analysis (Fig. 1). The market may move up from the level of 1.0972 (close of yesterday's daily candle) to 1.1026, the 13-period EMA (yellow thin line). In case of testing this level, the price may continue to move upward to 1.1064, the 38.2% retracement level (blue dotted line). From this level, downward movement is possible.
Fig. 1 (daily chart). Comprehensive analysis:
General conclusion: The price may move up from the level of 1.0972 (close of yesterday's daily candle) to 1.1026, the 13-period EMA (yellow thin line). In case of testing this level, the price may continue to move upward to 1.1064, the 38.2% retracement level (blue dotted line). From this level, downward movement is possible. Alternative scenario: from the level of 1.0972 (close of yesterday's daily candle), the price may move down to the resistance level of 1.0948 (thick red line). In case of testing this level, the price may move up to 1.0965, the 14.6% retracement level (blue dotted line). From this level, upward movement is possible. The material has been provided by InstaForex Company - www.instaforex.com |


| You are subscribed to email updates from Forex analysis review. To stop receiving these emails, you may unsubscribe now. | Email delivery powered by Google |
| Google, 1600 Amphitheatre Parkway, Mountain View, CA 94043, United States | |


Comments