Forex analysis review
Forex analysis review |
- Is there a high probability of a new fall in bitcoin due to the deterioration of the geopolitical situation in Ukraine?
- Bitcoin continues to circle around its own pivot of $ 40,746, but the prospects for a fall have intensified this week.
- BTC/USD Analysis for 23 April 2022
- Analysis of April 18-22 trading week on GBP/USD. COT report. Pound sterling nosedives sharply
- Analysis of April 18-22 trading week on EUR/USD. COT report. ECB turmoils and euro gradually slides to 5-year lows
- AUD/USD reaches another downside target
- GBP/USD plunges on hawkish Fed
- April 22, 2022 : EUR/USD daily technical review and trading opportunities.
- April 22, 2022 : EUR/USD Intraday technical analysis and trading plan.
- April 22, 2022 : GBP/USD Intraday technical analysis and significant key-levels.
- Trading Signal for GBP/USD for April 22 - 25, 2022: buy in case of rebound 1.2850 (monthly support)
- Technical analysis of GBP/USD for April 22, 2022
- USD/JPY: corrective phase below 127.73 low
- Technical analysis of EUR/USD for April 22, 2022
- GBP/USD analysis on 22 April
- EUR/USD hot forecast on 22 April
- Bitcoin challenges major short-term support.
- Short-term technical analysis on Gold for April 22, 2022.
- Short-term technical analysis on EURUSD for April 22, 2022.
- AUDUSD under pressure.
- EUR/USD: Lagarde and Powell cool down bullish zeal
- Litecoin: bearish continuation pattern
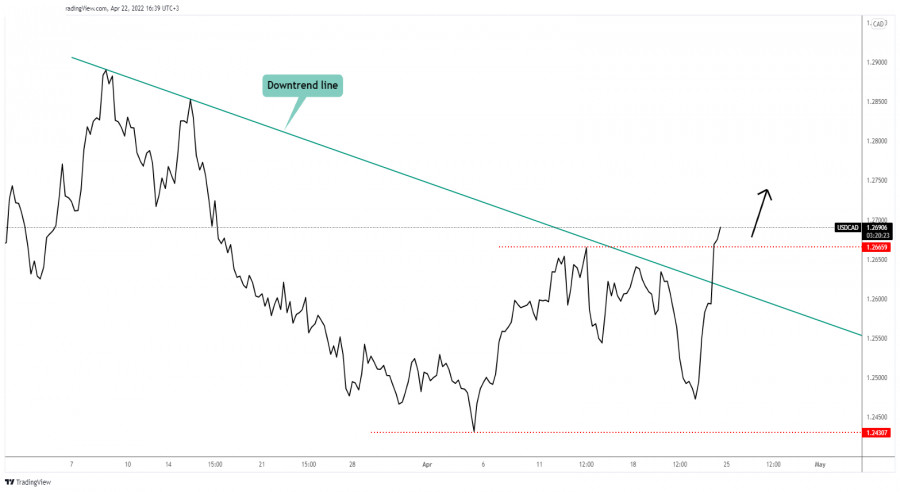
- USD/CAD targeting new highs
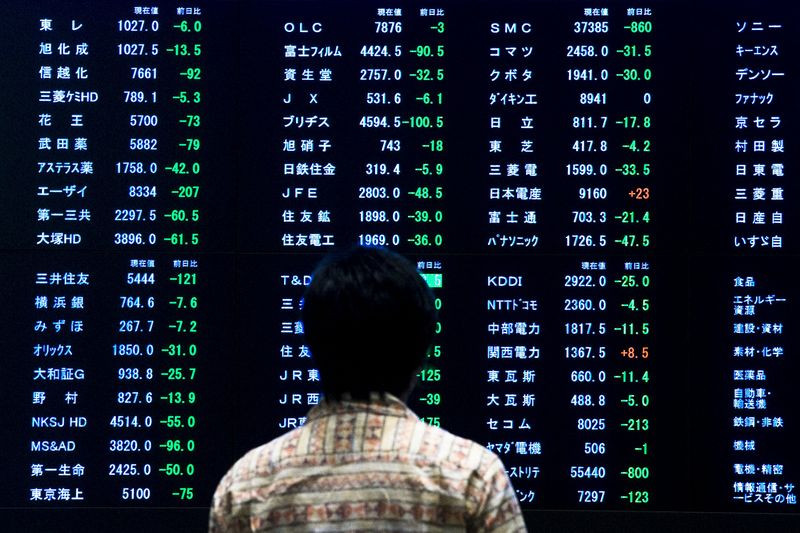
- Major Asian indicators decline
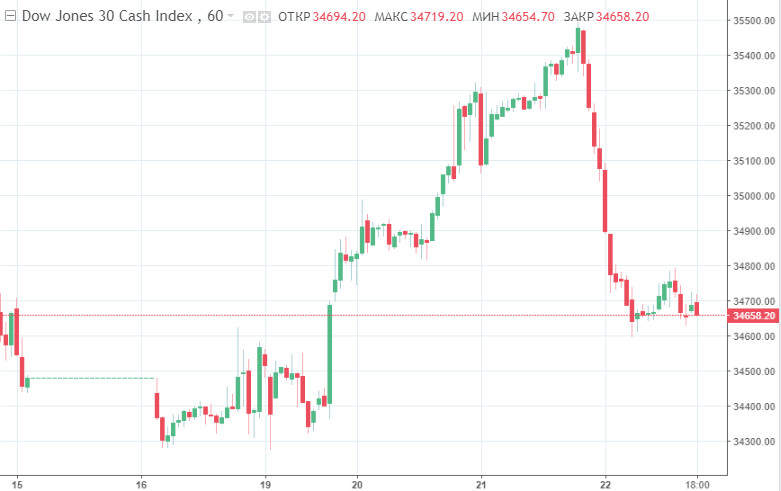
- US stock market declines strongly on Thursday
| Posted: 23 Apr 2022 01:09 PM PDT
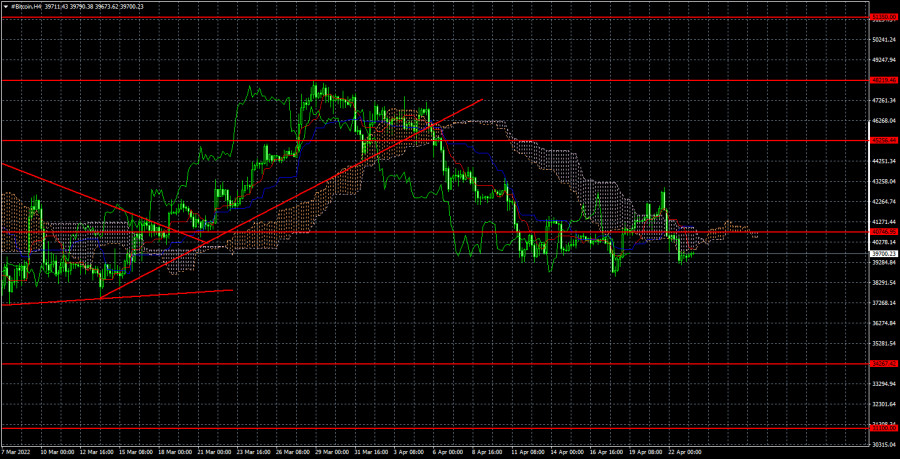
On the 4-hour TF, the technical picture for bitcoin is more eloquent. After the cryptocurrency quotes fell below the ascending trend line, a new downward trend began to form. However, this week bitcoin was unable to continue falling and spent most of the time inside the side channel, the middle of which is the level of $ 40,746, which we now consider a pivot. In the near future, a descending trend line may be formed, which will facilitate an understanding of what is happening. So far, we can say that market participants have taken a break and are waiting. Perhaps they are just waiting, perhaps they are waiting for new important messages or events. Unfortunately, they can wait for them. The geopolitical conflict in Ukraine will only escalate in the coming weeks. After the "first phase" of the "special operation" was completed, during which Russian troops failed to "take Kyiv in three days", as well as any other city in the North and East of Ukraine, according to Russian Defense Minister Sergei Shoigu, the "second phase" began. Until now, it is not entirely clear what goals Moscow has achieved in the "first phase" since it is clear to the whole world that no "denazification" and "demilitarization" of the whole of Ukraine has been carried out. Now the "second phase", the purpose of which is called the expansion of the LPR and DPR to the borders of their administrative regions. How "denazification" correlates with the expansion of the LPR and the DPR at the hands of the Russian army is also unclear. But in the coming weeks, fierce battles will take place in the East of Ukraine, the outcome of which is not obvious. If two months ago even Ukraine's allies did not believe that the country would be able to stand for more than a week or two, now the whole world believes in the Ukrainian army and supplies it with almost any weapons. Thus, now the AFU is a well-equipped army with the latest Western weapons, which Ukraine simply did not have at its disposal two months ago. However, the AFU managed to repel the attacks of the Russian army from Kyiv and other cities, even with the available weapons. At least because defending is always easier than attacking. According to many military experts, to capture the whole of Ukraine, Moscow had to send at least a million troops. Now, when Ukraine has a huge number of weapons, armored vehicles, MANPADS, air defense, and so on at its disposal, it will be much easier to fight back. But all this also means that there are a lot of soldiers and civilians in the East of Ukraine, and the geopolitical situation may worsen even more. Especially if the Kremlin does not achieve a single significant victory in the East of Ukraine. Sanctions will continue to be imposed, and relations between Russia and half the world will deteriorate. Bitcoin may one day react to everything that is happening in the world. And it can react to a new fall.
On the 4-hour timeframe, the quotes of the "bitcoin" are fixed below the trend line and continue to fall. Thus, we expect a drop in cryptocurrencies with targets of $ 34,267 and $ 31,100 andq recommend selling. The material has been provided by InstaForex Company - www.instaforex.com |
| Posted: 23 Apr 2022 01:09 PM PDT
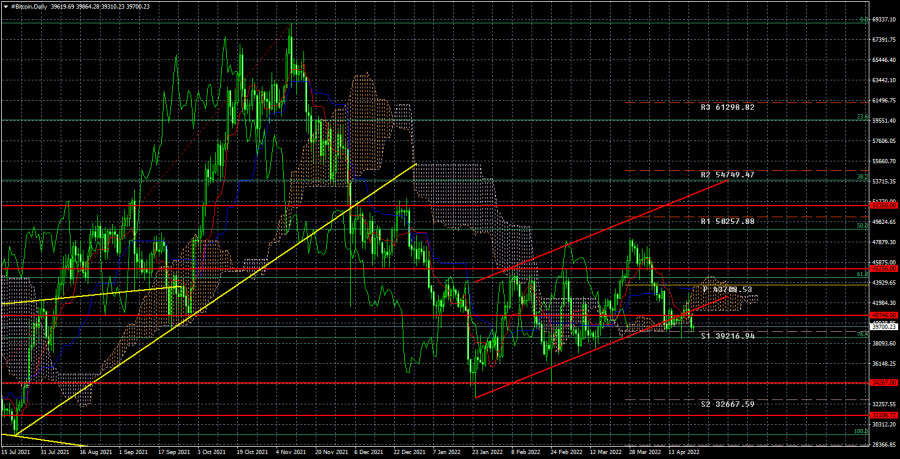
During the current week, the main cryptocurrency in the world has not shown anything special. It seems that bitcoin needs the same boost as the British pound this Friday. The pound sterling also could not overcome an important support level for many weeks, but when negative factors piled on it from all sides, it immediately collapsed by 200 points. Bitcoin also continues to walk on the edge of the abyss. If earlier it was at least supported by an ascending channel, and as for the fundamental background, it could be said that it is ambiguous, now the quotes of the "bitcoin" have fallen below the channel, as well as below the Ichimoku cloud, so technical signals are now talking about a new drop in the cryptocurrency, and not about the beginning of new growth. And it turns out that now the fundamental background continues to oppose all risky assets, and the support of the technical factor is leveled. We continue to expect a new drop in the value of the first cryptocurrency. What about the "foundation"? The news of the last week can hardly be called important for the cryptocurrency market. Just as it is difficult to link all the fundamental events of the past week with the movement of bitcoin. However, if we consider that bitcoin fell by $ 2,000 on Thursday and Friday, then we can assume that Jerome Powell's speeches were not received by crypto traders with a bang. Recall that the main risk for "bitcoin" is the tightening of the Fed's monetary policy in the next one and a half to two years. Moreover, we are not talking about one or two rate increases, but at least 10 increases. At the end of the entire policy tightening cycle, the rate should be at least 3.5%. By the end of this year, it should reach a neutral level of about 2.5%. In addition, starting from July, the Fed may start selling bonds from its balance sheet by launching the QT - "anti-QE" program. That is, now the Fed will withdraw excess liquidity from the economy to extinguish inflation. Even if you don't understand how the tightening of monetary policy affects the economy or the cryptocurrency market, just draw a simple parallel. In 2020-2021, the Fed conducted a $ 120 billion-a-month QE program. And these are the funds that entered the economy under this program. In total, the money supply would increase only in the USA by one and a half times in two years. The rates were lowered to almost zero. During the same period, bitcoin grew from $ 6,000 to $ 70,000. Thus, if rates are going to rise now, and the excess money supply is withdrawn, then bitcoin will have to become cheaper. Of course, the big question is exactly how much "extra money" will be withdrawn? However, considering that the QT program has not even started yet, and the rate has been raised only once, the worst for the cryptocurrency market is ahead. We are still waiting for bitcoin to be near the level of $ 31,100.
On the 24-hour timeframe, the quotes of the "bitcoin" were fixed below the Ichimoku cloud and the ascending channel. Thus, sales with targets of $ 34,267 and $ 31,100 have become relevant again at this time. The level of $ 40,746 now acts as a kind of pivot, around which the price has been spinning in the last few months. In a way, this level is the weighted average price of bitcoin. However, we believe that this level will not save the cryptocurrency from a new fall. The material has been provided by InstaForex Company - www.instaforex.com |
| BTC/USD Analysis for 23 April 2022 Posted: 23 Apr 2022 11:15 AM PDT
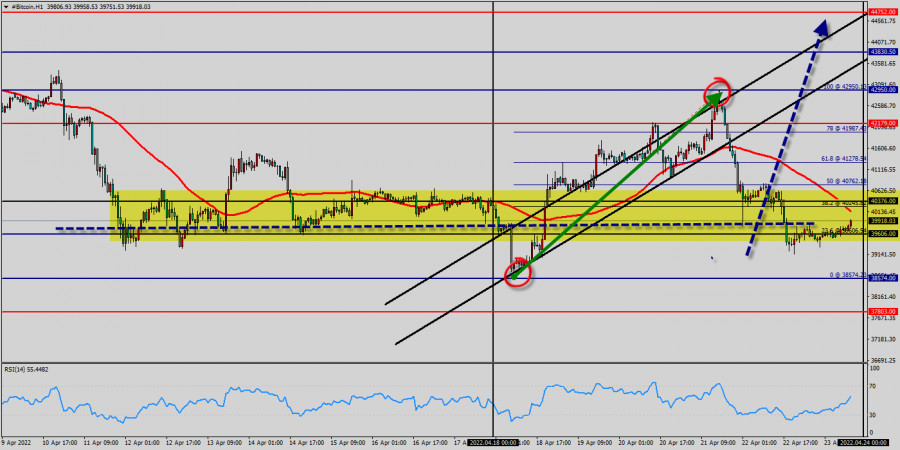
Technical market outlook of Bitcoin (cryptocurrency) : Trading Bitcoin (BTC/USD) : Bitcoin is at highest against the dollar around the spot of $ 39k since weeks - Bitcoin is inside in upward channel. Since three weeks BTC/USD decreased within an up channel, for that Bitcoin its new highest $ 39k. Consequently, the first support is set at the level of $ 33,9606. Hence, the market is likely to show signs of a bullish trend around the area of $ 38k and $ 39k. Bitcoin price could be awaiting a major upswing if the digital savings manages to slice above a fatal line of the first resistance that sets at the price of $ 33,9606 (Horizontal blue line). The prevailing chart pattern suggests that if the leading cryptocurrency could be expecting to rebound from the levels of $ 39k and $ 42k. Moreover, if the BTC/USD fails to break through the support prices of $ 39k today, the market will rise further to $ 42k so as to try to break it. Bitcoin is one the best overall investment for 2022. However, if you want to try to improve the growth of Bitcoin, thus it seems great to buy above the last bearish waves of $ 39k. Buy orders are recommended above the majors sypport rates of ($ 39k) with the first target at the level of $ 42k. Furthermore, if the trend is able to breakout through the first resistance level of $ 42k (41,987 - to test the 61.8% of Fibonacci retracement levels). . We should see the pair climbing towards the next target of $ 42,950. The pair will move upwards continuing the development of the bullish trend to the level $ 41,987 - golden ratio 61.8%. It might be noted that the level of $ 42,950 is a good place to take profit because it will form a new double top in coming hours. The material has been provided by InstaForex Company - www.instaforex.com |
| Analysis of April 18-22 trading week on GBP/USD. COT report. Pound sterling nosedives sharply Posted: 23 Apr 2022 01:48 AM PDT Long term outlook
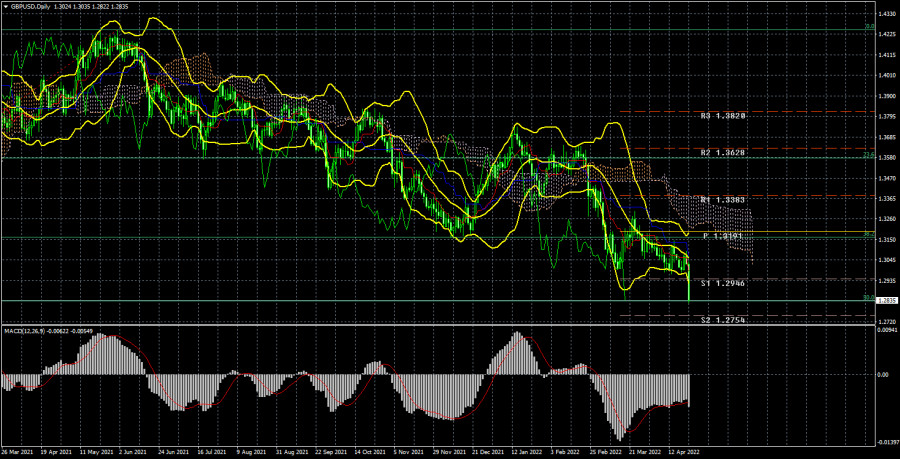
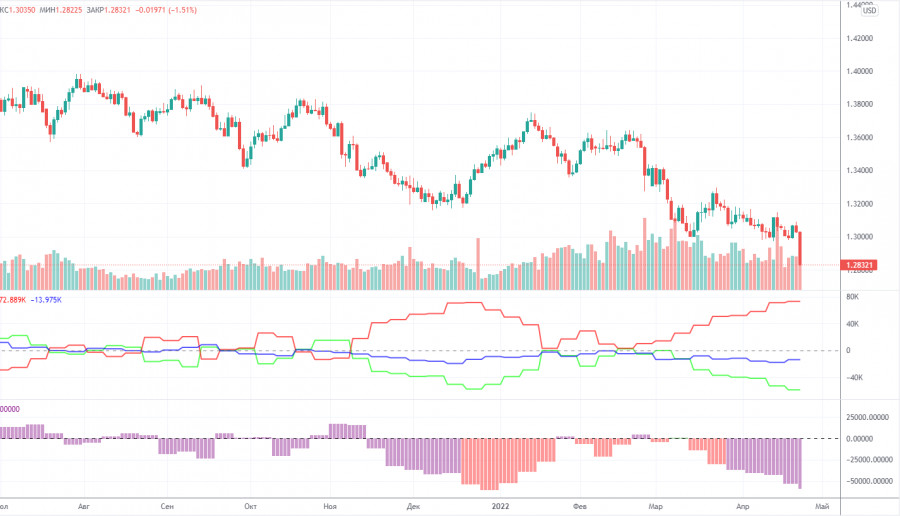
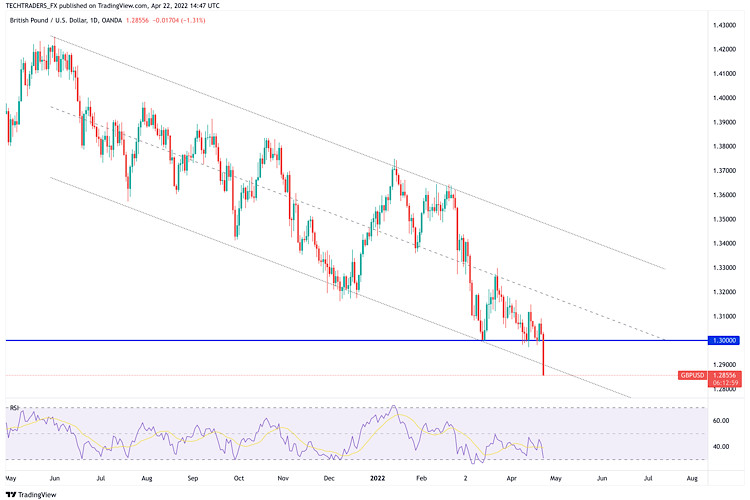
The GBP/USD pair fell by 220 pips during the current week. The UK currency fell by 200 pips on Friday. This was a "black" day for the pound, but the reasons for such a powerful fall are not obvious. Let's try to analyze them from the very beginning. We have been saying for a long time that there is only one good reason for the British pound to show growth. It is the hawkish sentiment of the Bank of England, which has already raised the key rate three times. However, the pound growth factors come to an end here, and the US currency has much more at its disposal. The Fed can catch up and overtake the Bank of England in 2 to 3 months. The US economy is much stronger than the British economy according to their GDPs. The geopolitical conflict in Eastern Europe is more likely to negatively affect the British economy than the US one. The US dollar is in demand because of its safe-haven status, unlike the pound. Therefore, based on all these factors, we have predicted a further decline in the pound/dollar pair. The reason for the collapse of this currency on Friday, as it seems to us, lies on the plane of the set of problems, which we have listed above. It seems that traders were waiting for a convenient opportunity to resume the sales of the pound, and they got it on Friday when there was nothing interesting in the macroeconomic and fundamental background. The UK retail sales report was published in the morning, which was worse than the forecasted value. How many times can you remember when an average report triggered a decline of 200 points? Also, probably, the 1.3000 level factor" kicked in. Traders have tried to get above this level several times in recent weeks and failed. On Friday, bears made more effort to break through it, which led to such a strong downward move. COT report analysis
The latest COT report on the British pound showed a new intensification of the bearish sentiment among professional traders. During the week, the Non-commercial group opened 1,300 buy contracts and 7,100 sell contracts. Thus, the net position of non-commercial traders decreased by another 6,000. Such changes are significant for the pound. The Non-commercial group has already opened a total of 95,700 sell contracts and only 36,800 buy contracts. Thus, the difference between these numbers is almost threefold. It means that the sentiment of professional traders now is clearly bearish. Thus, this is another factor, which speaks in favor of the continuation of the decline of the British currency. Let us note that in the case of the pound, the COT report data reflects very accurately what is happening in the market. The sentiment of the big players on the pound is changing every couple of months, but at the moment it is fully consistent with the movement of the pound/dollar pair. The net position of the Non-commercial group has already fallen to the levels where the previous decline in the pound falling has finished (green line in the first indicator). Therefore, it is even possible to assume that in the coming weeks, the pound will try to start a new rise. However, the current fundamental and geopolitical background does not give strong reasons to expect strong growth of the British currency. Fundamental events analysisThere were almost no macroeconomic statistics in the UK during the reporting week. There were no important ones. We can mark only the retail sales report on Friday, after which the British pound collapsed. Indexes of business activity in manufacturing and services in the UK and the US turned out to be quite neutral. Only the US service sector PMI, which unexpectedly fell to 54.7, was noted by the market. Therefore, the most important events were the speeches of Jerome Powell and Andrew Bailey. However, the head of the Fed only confirmed that the Fed was ready to raise the rate in May by 0.5%. At this time, the market is already actively discussing the possibility of a 0.75% rate hike. And the BA head said that the regulator would launch the QE program only when the markets are stable. Actually, these statements were definitely not the ones that could trigger a strong movement. On Friday, it was not required as the pound was falling all day at a great pace. Trading plan for April 25-29:1) The pound/dollar pair fell to 1.2830 - 50.0% Fibo, which we talked about in the last weekly reviews. Now, if the pair bounces from it, it may start an upward correction to the critical line. However, taking into consideration the general market sentiment, the COT reports, geopolitical and fundamental background, we can hardly expect a strong rise in the British currency now. Hence, there is a big probability of breaking through that level and further downside with the target at 1.2500. 2) The GBP/USD pair's outlook is still rather unclear and there is no reason to buy the pair so far. Even the technical indicators speak about it, as the price did not manage to renew its previous local peak or overcome the critical line during the last growth spurt. Geopolitics speaks of it, as the pound remains a riskier currency, than the US dollar. The macroeconomics confirms this, as the economy in the UK is in a worse condition than in the US. There are no reasons to buy the pair on a strong downtrend. Notes to screenshots:Price levels of support and resistance, Fibonacci levels, which are targets for the opening of long or short positions. Take-profit orders can be placed near them. Ichimoku indicator (standard settings), Bollinger Bands (standard settings), MACD (5, 34, 5). Indicator 1 on the COT charts - the size of the net position of each category of traders. Indicator 2 on the COT charts - the size of the net position for the non-commercial group. The material has been provided by InstaForex Company - www.instaforex.com |
| Posted: 22 Apr 2022 11:32 PM PDT Long term outlook
During the current week, the EUR/USD pair failed to start an upward correction. In the middle of the week, the euro received support from ECB Vice-President Luis de Guindos, who said that the key rate could be raised in July. Earlier, ECB President Christine Lagarde had announced the weakness of the European economy, high risks due to the pandemic, military conflict in Eastern Europe, and unwillingness to follow the Fed's course. After the last ECB meeting, Lagarde noted that it could be weeks to months from the time the stimulus programs wind down until the first rate hike. Then, de Guindos says that rates will be raised in July. The next day, Lagarde, who spoke at the IMF summit, did not confirm this information, which confused the market even more. The euro eventually fell to its swing and 15-month lows. The market believes Lagarde's words. Thus, the euro is left with an extremely unsightly array of factors, none of which supports it. Even a possible key rate hike this summer would not mean anything good for the euro. By that time, the Fed could raise its rate already to 1.5%, so a serious divergence between the monetary policies of the US and EU central banks will persist in any case. Moreover, the deposit rate is currently at -0.5%. Thus, the first hike could be to 0%. In addition, it is unlikely that the euro will receive strong market support. COT report analysis
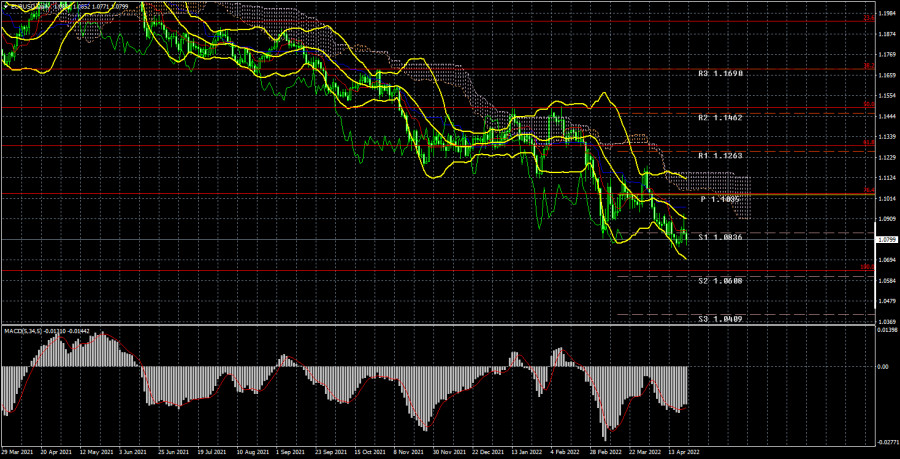
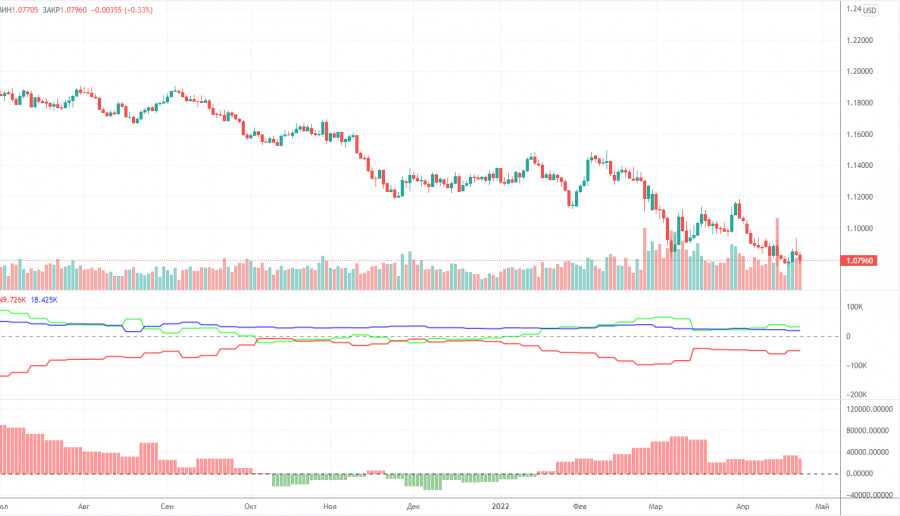
The latest COT reports on the euro raised more questions. The big players have been maintaining bullish sentiment since January 2022. The Euro has been trading within a downtrend since January 2022. During the reporting week, the number of Buy-contracts decreased by 600, while the number of Non-commercial positions increased by 7,000. Thus, the net position decreased by 6,000 contracts. This means that the bullish sentiment has weakened a bit. However, it is still bullish, since the number of buy contracts now exceeds the number of sell contracts of non-commercial traders by 32,000. Accordingly, the paradox is that professional players buy more euros than they sell, but the euro keeps falling almost continuously, which can be seen in the screenshot above. We already explained earlier that this effect is due to a higher demand for USD. The demand for the US dollar is higher than the demand for the euro, which is why the US currency is growing against the euro. This situation arises due to the geopolitical conflict in Ukraine. Therefore, the COT reports on the euro do not allow predicting the further movement of the pair now. The longer the phase of active hostilities in Ukraine persists, the higher the probability that the EU will face a food and energy crisis, and the US dollar will continue to rise because of its safe-haven status. Fundamental events analysis During the current week, only the inflation report for March was published in the European Union. And even then, only its final value, so traders were ready for the value of 7.4%. According to the results of March, inflation accelerated by 1.5%. The index of business activity in the service sector and manufacturing remained in the green zone above the level of 50.0, so no reaction was triggered. So, everything for the euro this week came down to the speeches of Lagarde and de Guindos. Initially, nobody expected de Guindos's speech to be interesting. There has been less and less geopolitical news lately. "The battle for the Donbas" has begun, and many military experts believe that it will determine the outcome of this conflict. The UK and the US intelligence do not see Russian troops advancing deep into Ukraine. Boris Johnson has stated that the military conflict will continue at least until the end of 2022. The EU may announce the sixth package of sanctions next week, which should include restrictions on oil imports. All this indicates an escalation of the conflict and deterioration of relations between the EU and Russia. Trading plan for April 25 - 29: 1) On the daily chart, the pair has resumed its downward movement and is preparing to descend to 1.0636, the 100.0% Fibo. All factors still speak in favor of a rising US dollar. The price is trading below the Ichimoku cloud, so there is still not much chance for the growth of the euro. At the moment, short positions remain the most relevant. 2) As for long positions on the EUR/USD pair, it is not recommended to consider them now. There is no technical signal that an uptrend can begin. Fundamentals and macroeconomic data continue to put strong pressure on the euro. The geopolitical situation may continue to put pressure on traders and investors, who continue to believe that they should buy the US dollar in any uncertain situation. Europe is on the verge of an energy and food crisis. Only a breakthrough of the Senkou Span B line we would consider as a basis for a new uptrend. Notes to screenshots: Price levels of support and resistance, Fibonacci levels, which are targets for the opening of purchases or sales. Take-Profit orders can be placed near them. Ichimoku Indicator (standard settings), Bollinger Bands (standard settings), MACD(5, 34, 5). Indicator 1 on the COT charts - the size of the net position of each category of traders. Indicator 2 on the COT charts - the size of the net position for the non-commercial group. The material has been provided by InstaForex Company - www.instaforex.com |
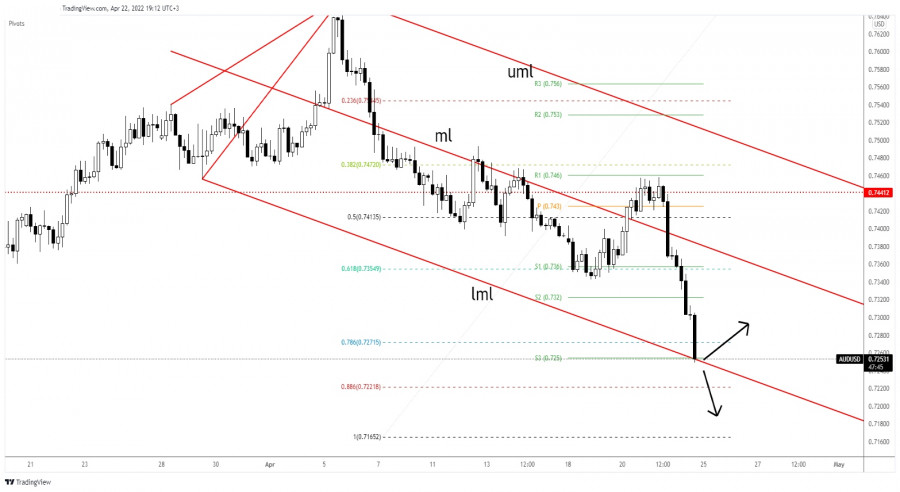
| AUD/USD reaches another downside target Posted: 22 Apr 2022 09:40 AM PDT The AUD/USD pair plunges as the Dollar Index reached fresh new highs after erasing its minor losses. As you already know, the pair rebounded in the short term but it was only a temporary one. Now, it's traded at 0.7251 level at the time of writing far below 0.7458 yesterday's high. AUD/USD dropped by 2.81% from yesterday's high to 0.7248 today's low. The USD is strongly bullish as the FED is expected to continue hiking rates as the inflationary pressure continues to grow. Fundamentally, the Aussie drops even if the Australian Flash Manufacturing PMI came in at 57.9 points above 57.7 in the previous reporting period, while the Flash Services PMI was reported higher at 56.6 points in April versus 55.6 in March. AUD/USD Strongly Bearish!
As you can see on the H4 chart, the price is extremely bearish. It has ignored the near-term downside obstacles and now it challenges the descending pitchfork's lower median line (lml) and the weekly S3 (0.7250). A valid breakdown may signal more declines towards 88.6% (0.7221) or down to 100% (0.7165). Staying above the lower median line (lml) may signal that the sellers could be exhausted. AUD/USD Prediction!After its massive drop, a temporary rebound is somehow expected. False breakdowns below the lower median line (lml) could signal a potential rebound. Still, the pressure is high, AUD/USD could drop deeper anytime. Personally, I would like the price to rebound, to increase towards the 0.73 psychological level before selling the pair again. A valid breakdown below the S3 (0.7250) could confirm more declines and could bring short opportunities on lower timeframes. The material has been provided by InstaForex Company - www.instaforex.com |
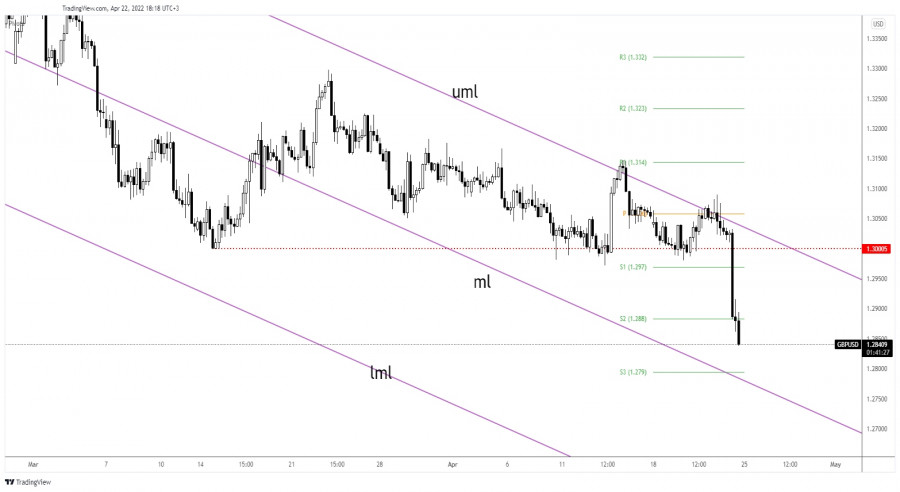
| GBP/USD plunges on hawkish Fed Posted: 22 Apr 2022 09:08 AM PDT The GBP/USD pair drops like a rock in the short term as the USD is strongly bullish. The greenback dominates the currency market as the Federal Reserve is expected to continue hiking rates in the upcoming monetary policy meeting. The pair is traded at the 1.2846 level at the time of writing. GBP/USD dropped by 1.92% from yesterday's high of 1.3089 level. Fundamentally, the Pound took a hit from the Retail Sales which reported a 1.4% drop, and from the Flash Services PMI which came in at 58.3 points below 59.9 expected. In addition, the GFK Consumer Confidence dropped deeper to -38 points versus -33 points expected. On the other hand, the US Flash Services PMI came in worse than expected, while the Flash Manufacturing PMI reported better than expected data. GBP/USD Attracted By The Median Line!
GBP/USD moved somehow sideways above the 1.3000 psychological level but unfortunately, it has failed to make a valid breakout above the upper median line (uml) of the descending pitchfork which represented a dynamic resistance. Being rejected once again by the upper median line (uml), it has signaled a potential sell-off. The Dollar Index's strong growth forced the pair to drop. It has ignored the 1.29 psychological level and the weekly S2 (1.2880) downside obsatcles. GBP/USD Forecast!Its aggressive breakdown below 1.3 signaled more declines and it was seen as a short opportunity. The 1.28 and the median line (ml) represent potential downside obsatcles. A new selling opportunity could appear if the rate increases a little after its massive drop. The material has been provided by InstaForex Company - www.instaforex.com |
| April 22, 2022 : EUR/USD daily technical review and trading opportunities. Posted: 22 Apr 2022 08:42 AM PDT
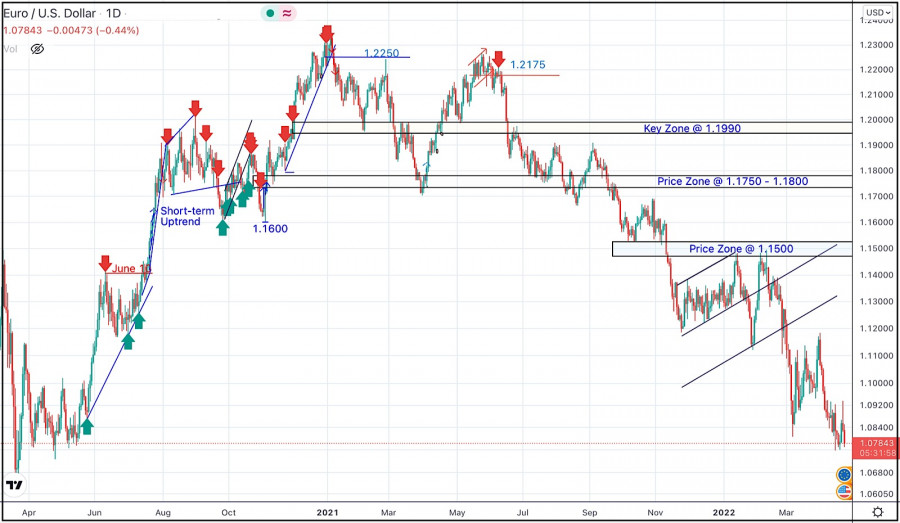
Few Months ago, the EURUSD pair has been moving above the price levels of 1.1750-1.1800. In late September, Re-closure below the price level of 1.1700 has initiated another downside movement towards 1.1500. Price levels around 1.1700 managed to hold prices for a short period of time before another price decline towards 1.1200. Then the EURUSD has temporarily moved-up within the depicted movement channel until downside breakout occurred recently. Since then, the price zone around 1.1500 has been applying significant SELLING pressure on the pair where a valid SELL Entry was offered upon the previous ascending movement towards it. Shortly after, the EURUSD looked oversold while approaching the price levels of 1.0850. That's where the recent upside movement was initiated. Any movement towards 1.1200 should be considered for another SELL trade as long as sufficient SELLING pressure is demonstrated. The material has been provided by InstaForex Company - www.instaforex.com |
| April 22, 2022 : EUR/USD Intraday technical analysis and trading plan. Posted: 22 Apr 2022 08:37 AM PDT
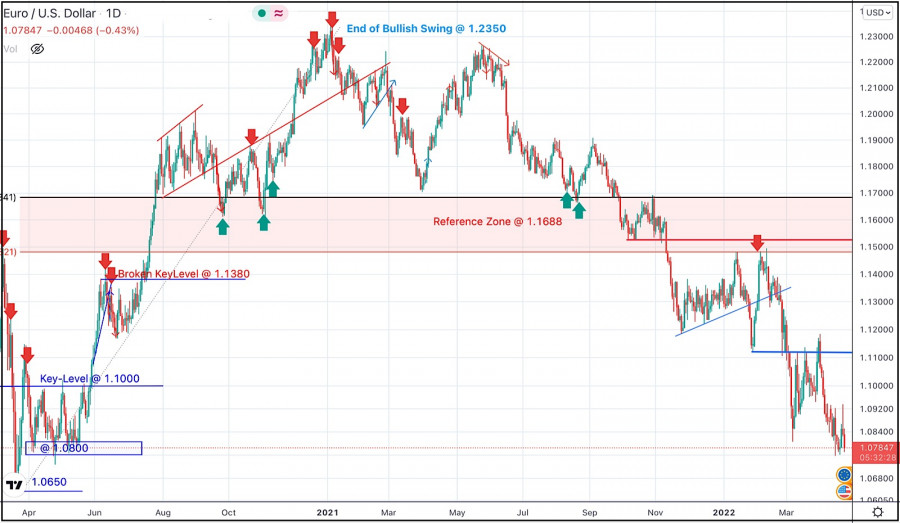
Recent bullish pullback towards 1.1650-1.1680 (upper limit of the previous consolidation range) was expected to offer bearish rejection and a valid SELL Entry. Significant bearish decline brought the EURUSD pair again towards 1.1550 levels which failed to provide sufficient BUYERS for too long period. Hence, only a short- term sideway movement was demonstrated around 1.1550 before quick bearish decline could occur towards 1.1200. On the other hand, the price levels around 1.1520 stood as a reference zone that applied significant bearish pressure upon two successive bullish visits. Recent Bearish decline below 1.1100 was considered as a bearish continuation sign. That's why, downside movement was expected to proceed towards 1.1000 then 1.0920 where the recent bullish pullback was initiated. The price levels around 1.1150 ended the recent bullish move and a another bearish move was recently expressed. However, failure to record a new LOW below 1.0850 will probably enable more bullish advancement at least towards 1.1320. The material has been provided by InstaForex Company - www.instaforex.com |
| April 22, 2022 : GBP/USD Intraday technical analysis and significant key-levels. Posted: 22 Apr 2022 08:36 AM PDT
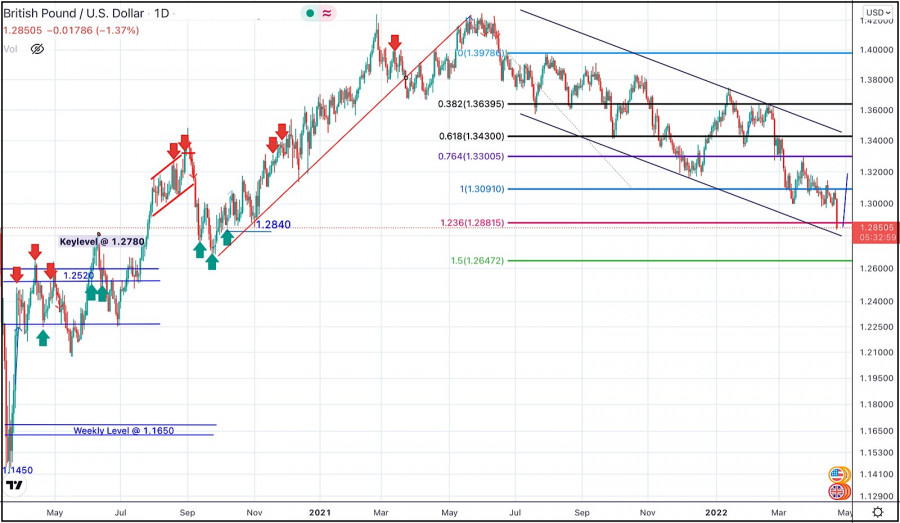
The GBPUSD pair has been moving within the depicted bearish channel since July. Recently, BUYERS were watching the price levels of 1.3730 to have some profits off their trades as it stood as a key-resistance which offered significant bearish rejection recently. The short-term outlook turned bearish when the market went below 1.3600. This enhanced the bearish side of the market towards 1.3400 which brought the pair back towards 1.3600 for another re-test. Hence, the recent bullish pullback towards 1.3600 should have been considered for SELL trades as it corresponded to the upper limit of the ongoing bearish channel. It's already running in profits. Bearish persistence below 1.3090 was needed to enable further downside continuation towards 1.2900 (the lower limit of the movement channel). Instead, bullish rejection has arised many times around 1.3000 standing as a significant Daily Support where the previous consolidation range has arised. However, as expected, bearish persistence below 1.3090 enabled bearish extension towards 1.2880 where some bullish recovery should be anticipated. Bullish breakout above 1.3090 abolishes the short-term bearish scenario and may enable quick bullish advancement towards 1.3300 and probably 1.3600 if sufficient bullish momentum is expressed. The material has been provided by InstaForex Company - www.instaforex.com |
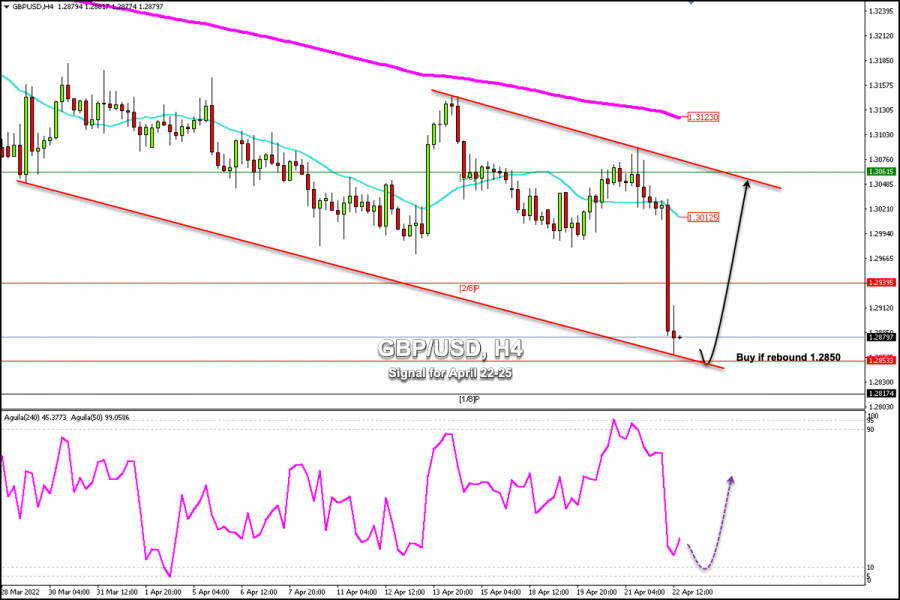
| Trading Signal for GBP/USD for April 22 - 25, 2022: buy in case of rebound 1.2850 (monthly support) Posted: 22 Apr 2022 08:34 AM PDT
Early in the American session, the British pound reached a new low around 1.2862. This level was last seen since November 2020. Currently, GBP/USD is trading at 1.2879. However, the bearish move could continue and it is expected that the currency pair will stop its fall around 1.2853 and a consolidation will follow. This level represents a monthly support which could give the pair a technical bounce. GBP/USD is weighed down by cautious comments from officials of Bank of England (BoE) and disappointing UK data. The pair has been under strong downward pressure and is expected to find support around 1.2850 or 1/8 Murray at 1.2817. From a technical viewpoint, sustained weakness below the psychological level 1.3000 was seen as a key trigger for the bears and prompted aggressive selling. The key will be to wait for a daily close below 1.2850. In this case, the pound is expected to weaken in the coming days. On the 4-hour chart, we can see that the pound is trading inside a downtrend channel formed since the end of March. The support of this channel coincides with the level of 1.2850, the pound is likely to rebound around this area and it will be an opportunity to buy whenever it consolidates and shows a sign of exhaustion. The eagle indicator is still giving a bearish signal. Therefore, we should expect further declines in GBP/USD. The signal is expected to reach the oversold level around 5-points, then it will be an opportunity to buy the pound. The material has been provided by InstaForex Company - www.instaforex.com |
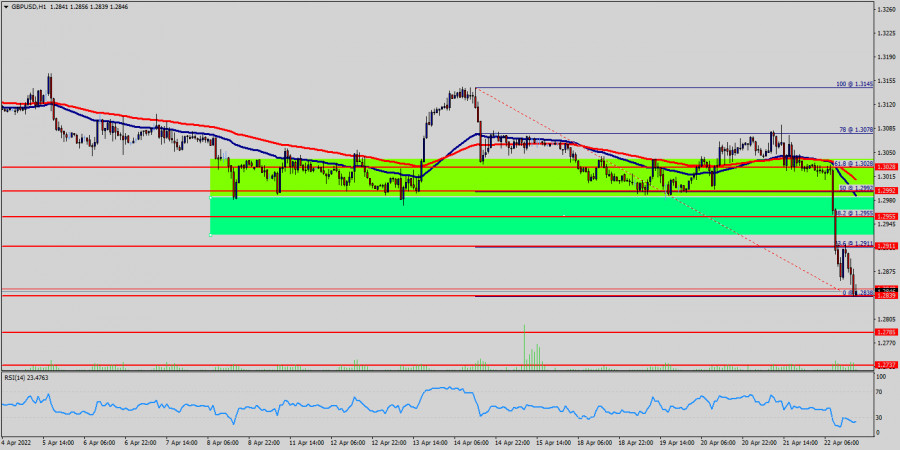
| Technical analysis of GBP/USD for April 22, 2022 Posted: 22 Apr 2022 08:18 AM PDT
The GBP/USD pair has dropped sharply from the 1.2911 level towards 1.2838. Now, price is set at the 1.2838 to act as a minor support. It should be noted that the volatility is very high for that the price of the GBP/USD pair is still moving between 1.2911 and 1.2737 in the coming hours. Furthermore, the price has been set below the strong resistance at the levels of 1.2911 and 1.2955 which coincide with the 23.6% and 38.2% Fibonacci retracement levels respectively. Additionally, currently the price is in a bearish channel. According to the previous events, the pair is still in a downtrend. From this point, the GBP/USD pair is continuing in a bearish trend from the new resistance of 1.2911. Thereupon, the price spot of 1.2911 remains a significant resistance zone. Therefore, the possibility that the Pound will have a downside momentum is rather convincing and the structure of the fall does not look corrective. In order to indicate a bearish opportunity below 1.2911, it will be a good signal to sell below 1.2911 with the first target of 1.2785. It is equally important that it will call for downtrend in order to continue bearish trend towards 1.2785. However, the stop loss should be located above the level of 1.3028. Tips : Important tips to remember about trend lines: When constructing a channel, both trend lines must be parallel lines to each other. Predominantly, the bottom of channel is considered a buy area while the top of channel is considered a sell area. Like in drawing trend lines, do not ever force the price to the channels that you draw! A channel limit that is slanting at one angle while the corresponding (parallel) channel limit is slanting at another is not correct and could lead to bad trades. Channels are just another tool in technical analysis which can be used to determine good places to buy or sell. Both the tops and bottoms of channels represent potential areas of support or resistance. The material has been provided by InstaForex Company - www.instaforex.com |
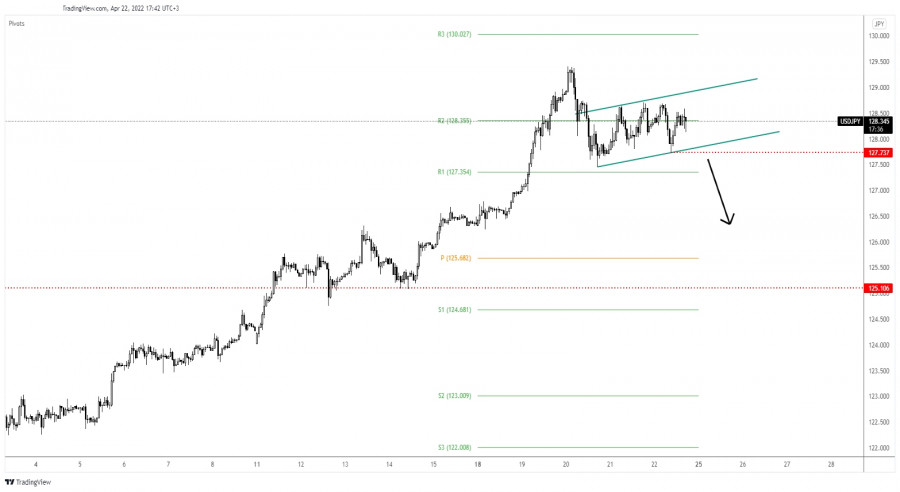
| USD/JPY: corrective phase below 127.73 low Posted: 22 Apr 2022 08:16 AM PDT The USD/JPY pair retreated a little in the short term but the bias remains bullish. It's traded at 128.42 and it tries to come back higher. Technically, the price action developed an ascending channel. Registering a valid breakdown from this pattern may announce a corrective phase. Today, the Japanese Flash Manufacturing PMI came in at 53.4 points above 53.3 expected but below 54.1 in the previous reporting period signaling a slowdown in expansion, while the National Core CPI rose by 0.8% matching expectations. On the other hand, the US data came in mixed. The Flash Services PMI dropped unexpectedly from 58.0 to 54.7 below 58.0 estimates, while the Flash Manufacturing PMI increased unexpectedly from 58.8 to 59.7 points even if the traders expected a potential drop to 58.1. USD/JPY Up Channel!
USD/JPY is trapped within an up-channel pattern. It could resume its growth as long as it stays above the uptrend line. A new higher high, making a valid breakout above the 128.70 and through the channel's upside line could signal an upside continuation. Staying below 128.70 and making a downside breakout from the chart formation could activate a larger downside movement. USD/JPY Outlook!Dropping below 127.73 could bring new selling opportunities. On the other hand, a new higher high, a valid breakout above 129.42 could announce an upside continuation. The material has been provided by InstaForex Company - www.instaforex.com |
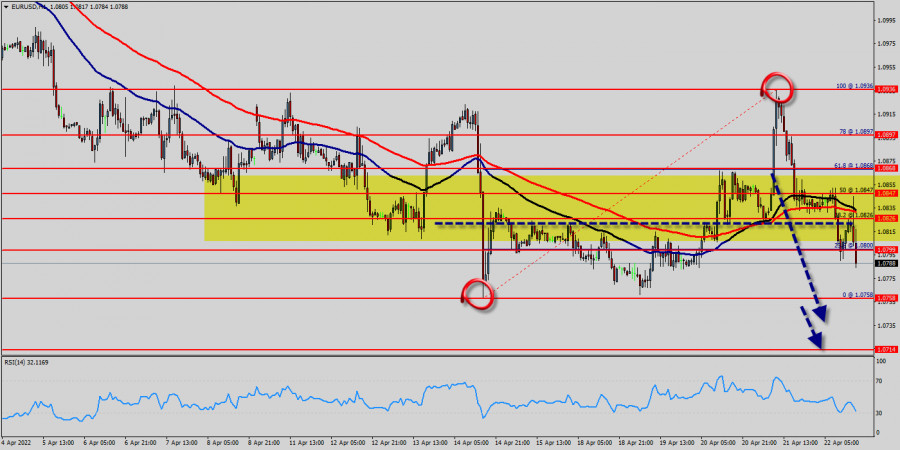
| Technical analysis of EUR/USD for April 22, 2022 Posted: 22 Apr 2022 08:04 AM PDT
The general trend shows a strong bearish market since three days from the levels of 1.0828, 1.0847 and 1.0868. The EUR/USD pair price moved into a bearish zone below the prices of 1.0828, 1.0847 and 1.0868. The EUR/USD pair even extended decline below the 1.0828 level before somewhat recovering. It is currently showing bearish signs below 1.0847 and still might extend losses. Similarly, most major pair such as GBP/USD and AUD/USD are trading in a negative zone. The EUR/USD pair is testing the 1.0800 support zone. The EUR/USD pair is showing signs of frequency at the bottom lip of a key resistance range between 1.0847 and 1.0714. The pair also - discontinued around these levels in both April of 2022. However, if the pair fails to pass through the level of 1.0847, the market will indicate a bearish opportunity below the new strong resistance level of 1.0847 (the level of 1.0847 coincides with the ratio of 50% Fibonacci). Moreover, the RSI is becoming to signal a downward trend, as the trend is still showing strong above the moving average (100) and (50). Thus, the maket is indicating a bearish opportunity below the 1.0847 level so it will be a good sign to sell at 1.0847 with the first target of 1.0758. It will also call for a downtrend in order to continue towards 1.0714. The daily strong support is seen at 1.0714. On the other hand, it is also worth noting that the price at 1.0714will possibly form a strong support. Accordingly, saturation around 1.0714 to rebound the pair is likely to occur. Furthermore, it is possible that the market is going to start showing the signs of bullish market from the area of 1.0714. However, the stop loss should always be taken into account, for that it will be reasonable to set your stop loss at the price of 1.0936. ---------------------------- Tips Technical Analysis : In technical analysis: history usually repeats itself at certain level. So it will be of the wisdom to use historic rates to determine future prices. The technical analysis based only on the technical market data (quotes) with the help of various technical indicators. Moreover, in this book we will be touching on a variety of new techniques for applying numerical strategies, equations, formulas and probabilities. Additionally, we will be sharing some of classical analysis such as breakout strategy and trend indicators. The material has been provided by InstaForex Company - www.instaforex.com |
| Posted: 22 Apr 2022 07:50 AM PDT
Following the sharp decline witnessed in the early European session, GBP/USD managed to recover above 1.2900 but came under renewed bearish pressure in the American trading hours. The pair remains on track to register its lowest weekly close since September 2020. The Relative Strength Index (RSI) indicator on the four-hour chart fell below 30 early Friday. Although this development suggests that the pair could stage a correction before the next leg lower, buyers are likely to stay on the sidelines until the pair clears 1.2970 (former static support) and 1.3000 (psychological level). On the downside, 1.2850 (static level from October 2020) aligns as the next bearish target ahead of 1.2800 (psychological level) and 1.2730 (static level from October 2020). The material has been provided by InstaForex Company - www.instaforex.com |
| EUR/USD hot forecast on 22 April Posted: 22 Apr 2022 07:50 AM PDT
EUR/USD has lost its traction after rising toward 1.0850 in the early American session but continues to trade above 1.0800. The data from the US showed that the business activity in the private sector expanded at a softer pace than expected in early April with the S&P Global Composite PMI declining to 55.1 from 57.7. With the latest drop witnessed in the early European session, EUR/USD crossed below the 20-period and the 50-period SMAs on the four-hour chart. Additionally, the Relative Strength Index (RSI) indicator retreated below 50, pointing to a bearish shift in the near term. On the downside, 1.0800 (psychological level) aligns as the first support. In case this level turns into resistance, further losses toward 1.0760 (post-ECB low) and 1.0730 (April 24, 2020, low) could follow. 1.0830 (20-period SMA, 50-period SMA) forms the initial resistance ahead of 1.0850 (Fibonacci 23.6% retracement of the April downtrend) and 1.0880 (100-period SMA). The material has been provided by InstaForex Company - www.instaforex.com |
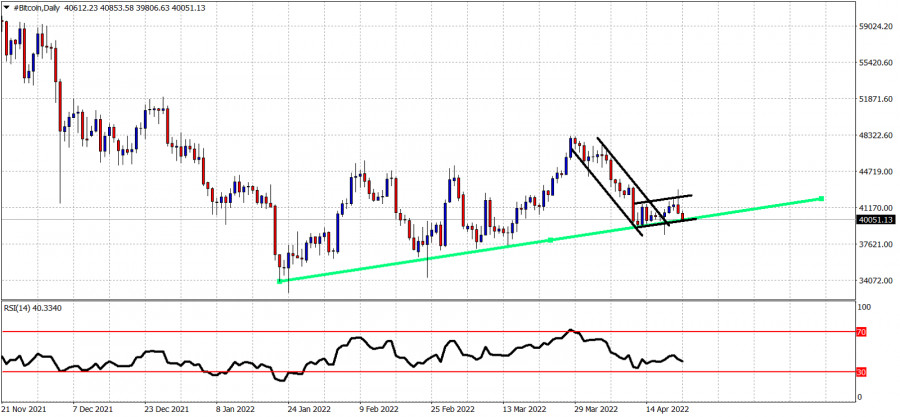
| Bitcoin challenges major short-term support. Posted: 22 Apr 2022 07:46 AM PDT Bitcoin is trading once again below $40,000. Price has formed a bearish flag pattern and price is now challenging key short-term support.
Black lines - Bearish flag pattern Bitcoin is trading just above the green support trend line. Bitcoin is also close in activating the bearish flag pattern. Failure to hold above $39,000 could lead price to a move towards $32,000-$30,000. Resistance is at $43,000. Bulls need to recapture this level in order to avoid the chances of a deeper pull back. The material has been provided by InstaForex Company - www.instaforex.com |
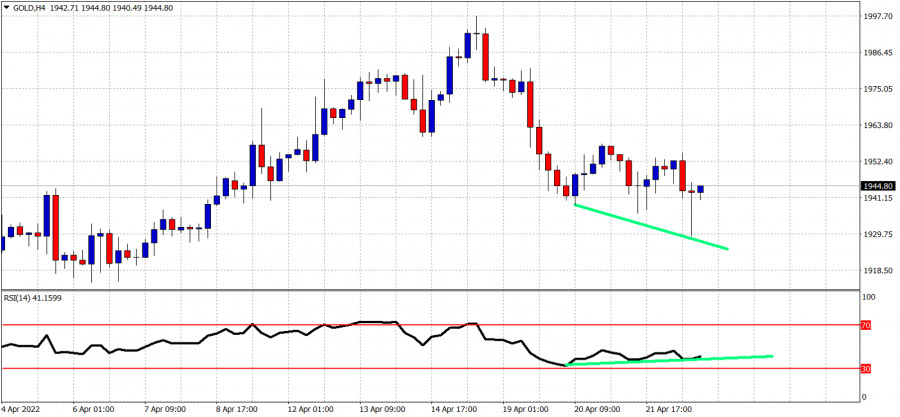
| Short-term technical analysis on Gold for April 22, 2022. Posted: 22 Apr 2022 07:43 AM PDT Gold price is trading around $1,940. Gold price made a low earlier today around $1,929 just above the $1,925 key short-term support.
Despite the new lower lows in price, the RSI is providing bullish divergence signals. This is not a reversal sign but a warning that the down trend is weakening. Gold price has resistance at $1,955. Bulls need to recapture $1,955 in order to reclaim control of the trend. If $1,925 fails to hold, we expect Gold price to move towards $1,900 next. The material has been provided by InstaForex Company - www.instaforex.com |
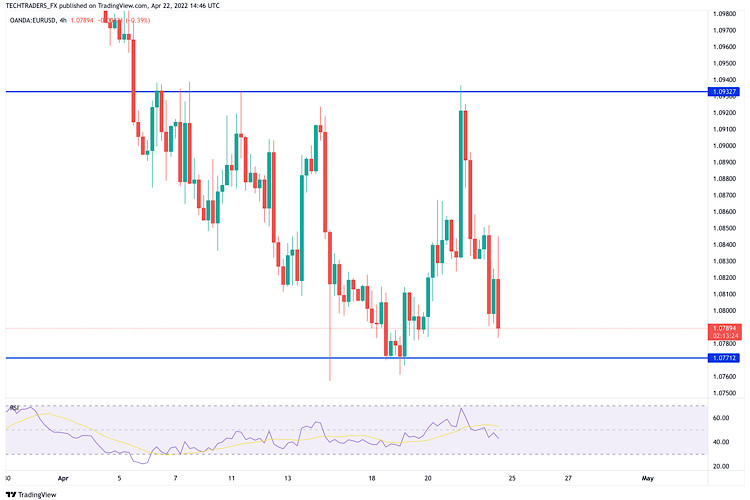
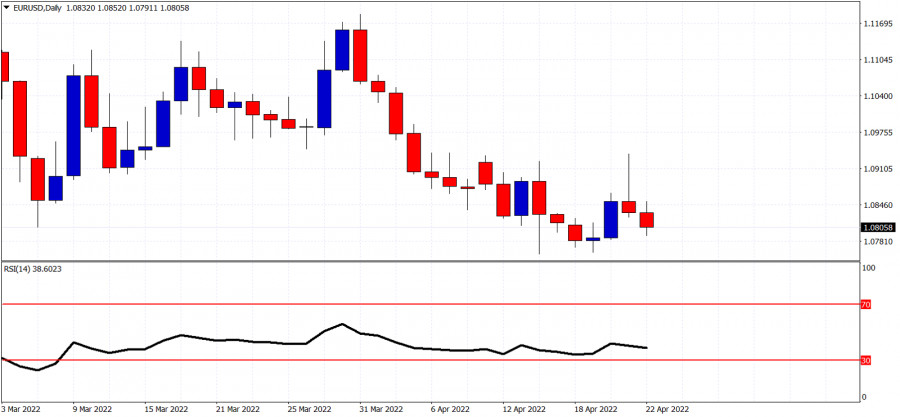
| Short-term technical analysis on EURUSD for April 22, 2022. Posted: 22 Apr 2022 07:38 AM PDT EURUSD is under heavy pressure. Despite yesterday's bounce above 1.09 bulls were not able to hold price above the support of 1.0870 and the pair is now trading below 1.08.
|
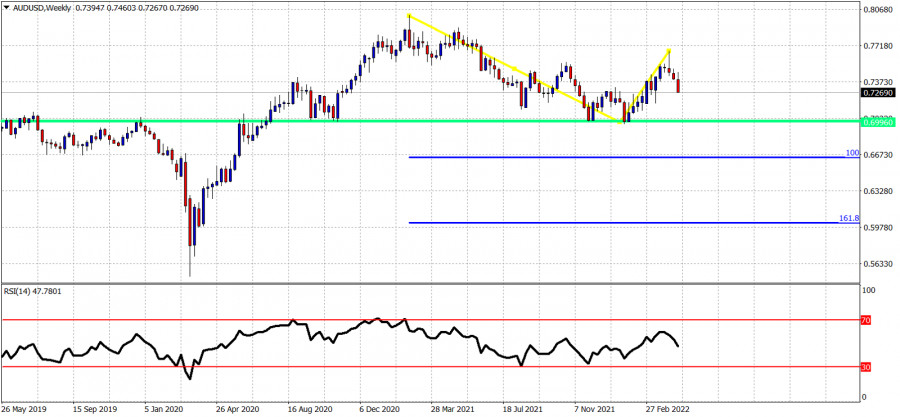
| Posted: 22 Apr 2022 07:32 AM PDT A few weeks ago when AUDUSD made a high around 0.7663 and ended the week near its lows around 0.7460 we warned traders that the price action was bearish and a move lower should be expected.
Blue lines -Fibonacci extension targets Following the bearish hammer candlestick pattern at the beginning of April, we are onto the the third week of April and price already has lost more than 200 pips. Price is trading around 0.7270 and it remains vulnerable to a move lower towards the horizontal support around 0.70. It is too early to tell if this support will be broken, but if it does get broken, our first target would be the 100% extension around 0.66-0.67. Until then trend remains bearish with 0.70 as the potential target. The material has been provided by InstaForex Company - www.instaforex.com |
| EUR/USD: Lagarde and Powell cool down bullish zeal Posted: 22 Apr 2022 07:23 AM PDT EUR/USD is still assaulting 1.0700. After a failed attempt of a correctional growth, the bears regained control and pushed to price below 1.0800. It is a challenging task because most traders fix profits at about 1.0750, a two-year low, and open long positions, thus dampening the downtrend.
Nevertheless, the overall sentiment on EUR/USD is bearish. The pair has not found any plausible excuse to wreck the downtrend. At the same time, correctional retracements don't contradict the rule. It makes sense to use upward retracements as an excuse to open short positions at a lower price. During April, EUR/USD buyers tried a few times to settle at around 1.0900. However, each time the price dropped 1.0800 with consequent testing of the levels above 1.0700. It proves that the downtrend is still underway despite the fact the bears are not able to break support of 1.0750 and settle below this target. This week, the single European currency found temporary support from the ECB. Vice President Luis de Guindos and later member of the ECB Governing Council Martins Kazaks said that interest rates could be increased as soon as in mid-summer, in July in particular. Such a twist caught investors off-guard. Indeed, recently, at the April policy meeting, Christine Lagarde stated that he regulator would make a pause from a few weeks to a few months before raising interest rates after the APP program is complete. In this context, remarks from Guindos and Kazaks surprised traders. As a result, EUR/USD spiked to about 1.0900. To sum up, the ECB leader is still cautious and hesitant unlike the Fed's Chairman Jerome Powell who actually advocated for aggressive monetary tightening yesterday. First, he stated that the odds were that the funds rate would be raised by 0.5% in May. Second, Powell said that it would make sense to push ahead in this direction. Importantly, the market is almost certain that the regulator would increase the key interest rate by 50 basis points at a time at the policy meeting in May. Recently, traders have high expectations that a 0.5% rate hike is very probable at the meeting in June. Jerome Powell actually confirmed the feasibility of such forecasts. Thus, the differential in the rhetoric of the Federal Reserve and the ECB is getting stronger, thus putting pressure on EUR/USD. The US dollar index is pinned at about two-year highs (testing 101 points) which mirrors buoyant demand for the greenback. In contrast, the single European currency is under pressure of fundamental factors such as futile peace talks between Ukraine and Russia, the energy crisis, stagflation risks, and the indecisive stance of the ECB. Amid global risk aversion, the greenback is the evident winner while the euro cannot find any support. For this reason, all efforts of the EUR/USD buyers to settle above 1.0900 are to no avail. It proves that we could use correctional retracements to open short positions.Technical analysis suggests the same. On all longer timeframes (from 4-hour and higher), EUR/USD is either on the lower border of the Bollinger bands or between the medium and lower lines of this indicator. It means the overall downtrend. On the 4-hour and daily charts, the Ishimoku indicator created the bearish signal when the price is below all of the indicator's lines, including the Kumo cloud. This signal confirms the bearish sentiment. The key support, that is also a downward target, is seen at 1.0750 that matches the lower border of the Bollinger bands on the daily chart. It is too early to speak about lower downward targets because the bears are not able to surpass that downward obstacle. The material has been provided by InstaForex Company - www.instaforex.com |
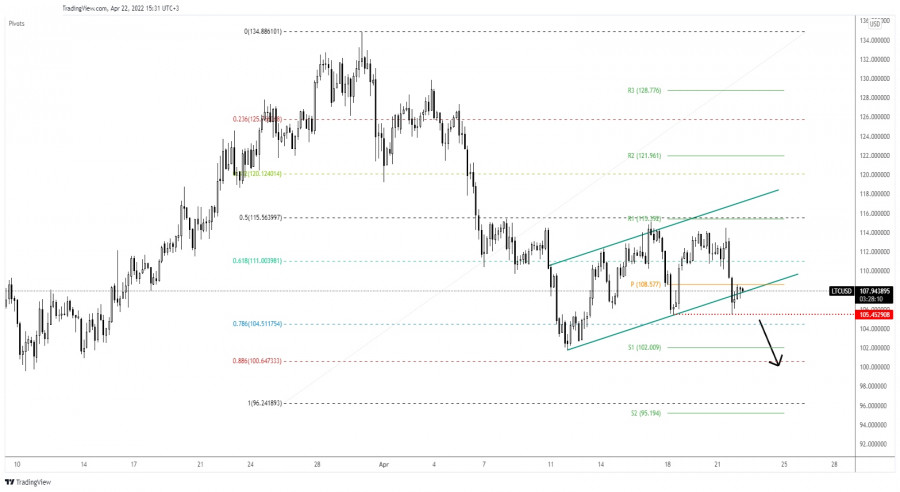
| Litecoin: bearish continuation pattern Posted: 22 Apr 2022 06:43 AM PDT Litecoin is trading at 107.93 at the time of writing. In the short term, it could move somehow sideways before deciding direction. Actually, the bias remains bearish, it could extend its drop anytime. LTC/USD dropped by 7.90% in yesterday's trading session. Now, it tries to rebound and recover. In the last 24 hours, Litecoin is down by 4.32% and by 2.39% in the last 7 days. Bitcoin's deeper drop could force the altcoins to drop as well. LTC/USD Temporary Rebound!
LTC/USD found support at 101.76 and now it has tried to rebound. It has developed an up-channel pattern that could represent a bearish continuation pattern. Still, we'll have to wait for strong confirmation before taking action. After its strong drop, a temporary rebound was natural and expected. Stabilizing below the weekly pivot point (108.57) and under the uptrend line, LTC/USD could develop a new sell-off. LTC/USD Outlook!A new lower low, making a valid breakdown below 105.452 could open the door for more declines. This scenario could bring new short opportunities. The material has been provided by InstaForex Company - www.instaforex.com |
| Posted: 22 Apr 2022 06:41 AM PDT
USD/CAD Upside Breakout!The USD/CAD pair registered a strong upwards movement after failing to reach and retest the 1.2430 lower low. Now, it's located at the 1.2681 level and it seems determined to resume its growth. As you can see on the H4 chart, it has ignored the downtrend line and the 1.2665 level which represented upside obsatcles. Breaking above these levels signaled strong buyers and potential upside continuation. USD/CAD Trading Conclusion!Stabilizing above 1.2665 could signal further growth. Jumping above the downtrend line signaled that the downside movement ended and that the pair could develop an upwards movement. A minor sideways movement above the 1.2665 could bring new buying opportunities. The material has been provided by InstaForex Company - www.instaforex.com |
| Major Asian indicators decline Posted: 22 Apr 2022 06:24 AM PDT
Major Asian indicators are falling at the end of the week. China's Shenzhen Composite lost almost 1%, down 0.92%, Shanghai Composite dropped by 0.07%, and Hong Kong's Hang Seng Index was down 0.54%. Other indicators of the region dropped more significantly: the Japanese Nikkei 225 fell by 1.75%, the Australian S&P/ASX 200 Index went down 1.58% and the Korean KOSPI declined by 0.91%. Asian indicators in their movement mostly duplicate the sentiment of US markets. Decline of the US stock markets was caused mainly by the Federal Reserve Chairman's statement about his intention to raise the interest rate by 50 basis points as early as next month. The pace of US inflation amounted to 8.5% last month. This news led to traders' more cautious attitude. Japan's statistics was another reason for investors' pessimism. The growth of consumer prices accelerated to 1.5% from the previous reading of 0.9%. Therefore, inflation hit its high for the last 3.5 years. According to experts' forecasts, the price growth was expected not to exceed 0.8%. Notably, the price growth rate remains within the central bank's target of 2%. As for the constituents of Nikkei 225, shares of Sumitomo Metal Mining Co. declined by 5.2%, stocks of Pacific Metals Co. and M3 Inc. fell by 4.6% and 4,8% respectively. Moreover, Sony shares were down 2.8%, SoftBank Group stocks dropped by 2.9%, Asia Fast Retailing shares lost 2.6% as well as automakers Nissan Motor and Toyota Motor shares declined by 1.9% and 1.6% respectively. Among the companies included in the Hang Seng Index indicator, shares of Galaxy Entertainment Group, Ltd. dropped by 3.9%, stocks of Sands China, Ltd. fell by 2.3% and Techtronic Industries Co. and Tencent Holdings, Ltd. shares lost 2.4% each. Other stocks declined slightly, Geely went down 2% and Alibaba fell by 1.9%. Among South Korean companies included in the KOSPI index, Samsung Electronics Co. declined by 0.7% and Hyundai Motor lost 1.1%. As for S&P/ASX 200 index components, Megaport shares plunged with its stock prices dropping by 10% due to the release of a negative corporate report. BHP and Rio Tinto declined slightly, down 4% and 3% respectively. The material has been provided by InstaForex Company - www.instaforex.com |
| US stock market declines strongly on Thursday Posted: 22 Apr 2022 06:00 AM PDT US indexes dropped sharply on Thursday, erasing all gains made early on during the session. The slump was triggered by a massive sell-off of US Treasury bonds. Losses in the oil & gas, technology, and basic materials sectors propelled shares lower. Stock movers The Dow Jones Industrial Average lost 1.05% and fell to 34,792.76 points. On the DJIA, the best performing stocks were Dow Inc (+2.92%), International Business Machines (+1.11%), and Verizon Communications Inc (+1.10%). The worst performing stocks were Salesforce.com Inc (-4.83%), Chevron Corp (-4.61%), and Walt Disney Company (-2.34%). The S&P 500 decreased by 1.48% to 4393,66 points. On the S&P 500, the top performers were United Airlines Holdings Inc (+9.31%), and American Airlines Group (+3.80%). The worst performers were Enphase Energy Inc (-12.31%) and SolarEdge Technologies Inc (-9.75%). The NASDAQ Composite slid down by 2.07% to 13,174.65 points. On the NASDAQ Composite, the biggest winners of the session were Cyngn Inc (+96.30%), Swvl Holdings Corp (+47.89%), and Revelation Biosciences Inc (+23.08%). The biggest losers included Voyager Therapeutics Inc (-28.15%), GWG Holdings Inc (-27.80%), and Elys Game Technology Corp (-23.04%).
Shares of Netflix Inc continued to decline after the company released disappointing first-quarter reports on Wednesday. The stock lost 3.5% on Thursday after Pershing Square sold its stake in the streaming giant. The market capitalization of Freeport-McMoRan Copper and Gold Inc dived by 10%, despite the company posting strong Q1 results. In the first quarter of 2022, the company's net income more than doubled. The adjusted earnings per share and earnings also exceeded market forecasts. However, the quote came under pressure from worsening outlooks for copper in 2022. Shares of Xerox Holdings Corp slumped by 15.7%. The company has not changed its outlook for 2022, despite reporting losses in the first quarter. Union Pacific Corp. lost 1.1.%, despite increased net income and revenues in Q1 2022. Shares of Tesla Inc. increased by 3.2% on Thursday. The automaker's revenues surged by 81% in the first quarter, greatly exceeding market expectations. The net income of Tesla increased to $3.32 billion, well above the forecasted $2.2 billion. AT&T gained 4.1%. Revenues of the world's biggest telecommunications company decreased by 36% in Q1 2022. However, adjusted earnings per share exceeded expectations of investors. Shares of American Airlines Group rose by 3.8%, despite the company's net loss increasing by 31% in the first quarter of 2022. The airline expects to turn profitable in the ongoing quarter. Philip Morris International increased by 2%, thanks to its adjusted earnings and revenues exceeding market expectations.
On the NYSE, declining stocks outnumbered rising ones by 2,508 to 617, while 119 ended unchanged. On the Nasdaq Stock Exchange, 2,991 stocks fell and 897 advanced, while 194 ended unchanged. The CBOE Volatility Index, which measures the implied volatility of S&P 500 options, was up 11.61% to 22.68. Growth and decline factors The US stock market advanced early, thanks to positive earning reports. Despite monetary tightening, the highest inflation rate in decades, and persistent price growth, US companies managed to advance in the first quarter. However, investors became increasingly wary over the expected Fed interest rate hike on Thursday. Earlier, Fed chairman Jerome Powell signaled that the Fed would hike the rate by 0.5% at its next meeting on May 3. The yield of 10-year US Treasury bonds jumped to 2.917% on Thursday, reaching the highest level since the winter of 2018. On Wednesday, the 10-year yield was at 2.836%. As the yield of US Treasuries rises, equities decline - growing interest rates make bonds more attractive to investors compared to risky assets. However, many market experts are sure that the US stock market has upside potential thanks to the good state of the US economy. According to financial data provider FactSet, 12% of companies on the S&P 500 have already published their first-quarter results. 80% of these reports exceeded market expectations. This indicates that earnings of key US companies remains steady, despite negative macroeconomic factors like geopolitical tensions in Eastern Europe, inflation, and lockdowns in China. The US stock market also found support in US data releases. According to the US Labor Department, the number of initial jobless claims decreased to 186,000 from 184,000 the week before. Economists expected jobless claims to fall to 185,000. The material has been provided by InstaForex Company - www.instaforex.com |


| You are subscribed to email updates from Forex analysis review. To stop receiving these emails, you may unsubscribe now. | Email delivery powered by Google |
| Google, 1600 Amphitheatre Parkway, Mountain View, CA 94043, United States | |


Comments