Forex analysis review
Forex analysis review |
- Solana vulnerable to a move towards $93.
- Our plan for SPX for next week.
- Bearish pattern in Bitcoin?
- USDCHF close to breaking out.
- Weekly EURUSD analysis.
- USD/CAD in buyers territory
- USD/CHF: upside continuation expected
- Technical analysis of GBP/USD for April 15, 2022
- Trading Signal for Gold (XAU/USD) for April 15 - 18, 2022: buy above $1,960 (21 SMA - 38.2% Fibonacci)
- Trading Signal for Nasdaq-100 (#NDX) for April 15 - 18, 2022: buy in case of rebound off 13,750 (6/8 Murray)
- Technical analysis of EUR/USD for April 15, 2022
- GBP/USD to explode soon
- April 15, 2022 : EUR/USD daily technical review and trading opportunities.
- April 15, 2022 : EUR/USD Intraday technical analysis and trading plan.
- April 15, 2022 : GBP/USD Intraday technical analysis and significant key-levels.
- The main news of the crypto market for April 15
- European stock indexes up on Thursday following ECB policy decision
- GBP/USD on April 15, 2022
- Analysis of EUR/USD, April 15. Bears take upper hand
- Bitcoin trying to consolidate near $40,000, but investors show weak activity
- Gold under strong buying pressure
- USD/JPY: natural growth, aims at 127.00
- Technical analysis of EUR/USD and GBP/USD on April 15, 2022
- Bitcoin: attention at support
- Analysis of Gold for April 15,.2022 - Breakout of upside channel in the background
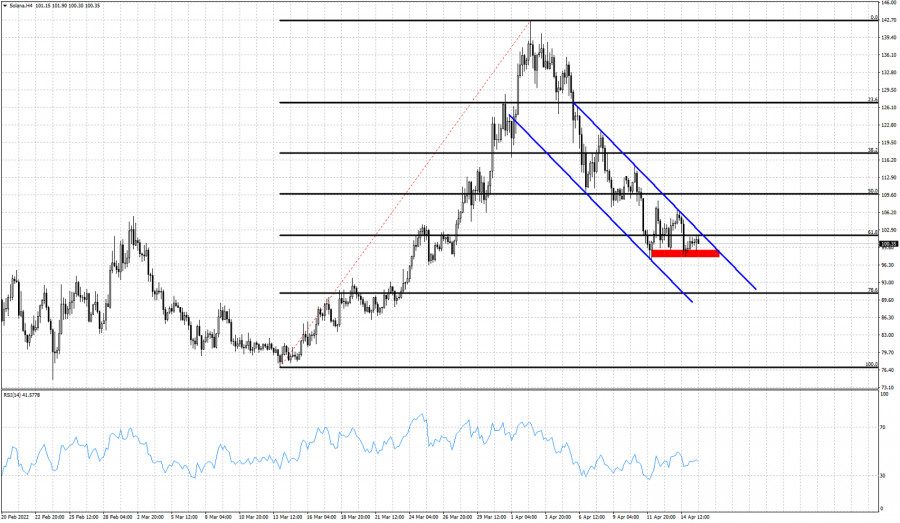
| Solana vulnerable to a move towards $93. Posted: 15 Apr 2022 01:05 PM PDT Solana continues to trade inside a downward sloping bearish channel. Price is now challenging short-term support at $97.75. Failure to hold above this level could lead Solana price towards $91-$93.The RSI has reached oversold levels but has still not provided a clear bullish divergence.
Black lines- Fibonacci retracements Red rectangle- support If support at the red rectangle is broken then Solana continues lower towards $91-93. Price is now around the 61.8% Fibonacci retracement and the chances of a reversal to the upside are high. Resistance is at $103 and a daily close above this level would be a first step for bulls. The material has been provided by InstaForex Company - www.instaforex.com |
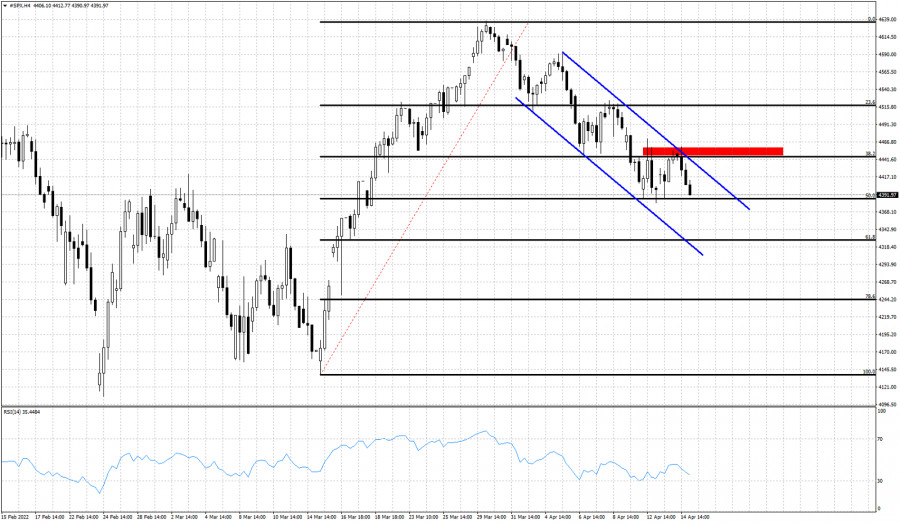
| Our plan for SPX for next week. Posted: 15 Apr 2022 01:01 PM PDT SPX ended the week below 4,400 within the area we were expecting it reach as a pull back. The warning signals were given some time now and we were prepared for the pull back. Price has now retraced 50% of the entire rise and there is potential to move even lower towards 4,325.
Blue lines- bearish channel Black lines -Fibonacci retracements As long as price is below the red rectangle bears are in control. Price is inside a bearish channel and is making lower lows and lower highs. Resistance is at 4,450. What was once support is now resistance. Recent low at 4,380 if broken should push price towards the 61.8% Fibonacci retracement at 4,325. With current market conditions we reach the conclusion that only a break above 4,450 would provide a new trading signal for SPX. The material has been provided by InstaForex Company - www.instaforex.com |
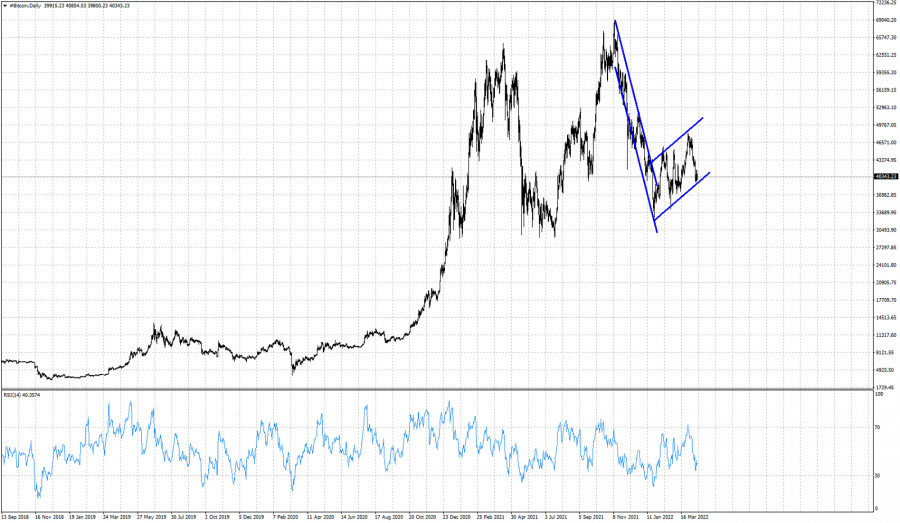
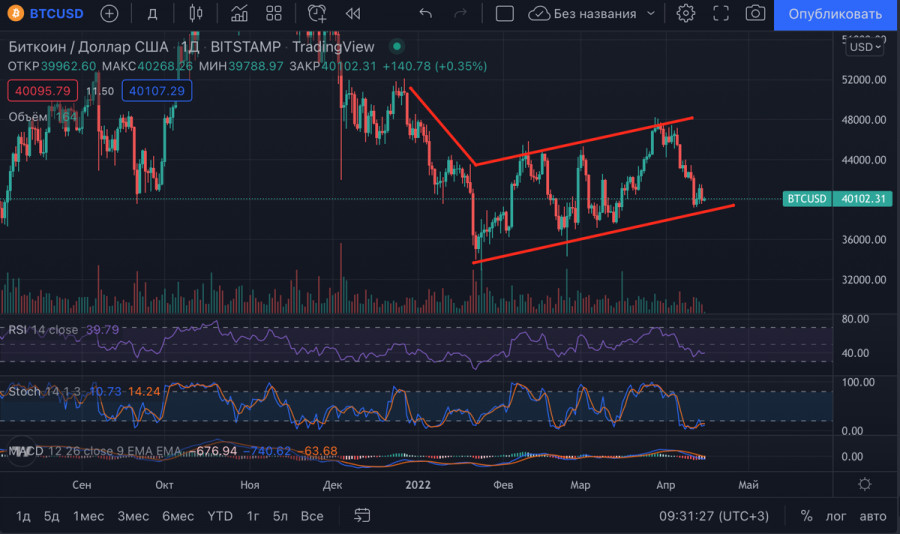
| Posted: 15 Apr 2022 12:56 PM PDT Has Bitcoin formed a bearish flag pattern? If this is the case, a break below $39,000 would be a major bearish signal. Bitcoin for the last couple of months has made no real progress after bottoming at the end of January around $32,800.
Blue lines -bearish flag Bitcoin is close to the bearish flag lower boundary. Price has exited the bearish channel it was in but the upside react has been mild and not as strong as we expected. Bulls find it difficult to recapture $45,000-$50,000. This is a sign of weakness. If followed by a break below $39,000 then we should should expect $30,000 to be challenged. The material has been provided by InstaForex Company - www.instaforex.com |
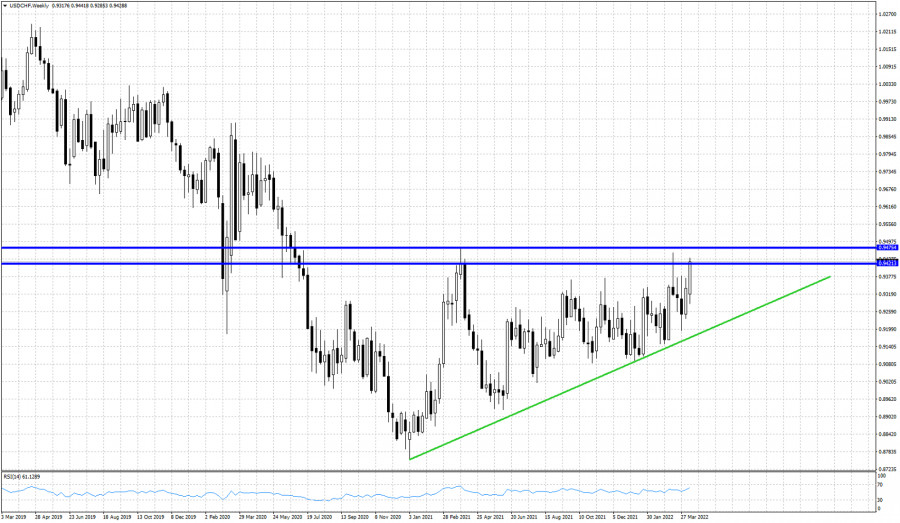
| Posted: 15 Apr 2022 12:44 PM PDT USDCHF is trading around 0.9420. Price is challenging important horizontal resistance. The area between 0.9420 and 0.9475 is very important resistance. Price has so far managed to make higher lows and respect the upward sloping support trend line.
Blue lines- resistance USDCHF has the potential to rise towards 0.9750-0.98 if bulls manage to recapture 0.9475 and stay above it. Price is starting to make higher highs and higher lows since the last touch of the green support trend line back in January of 2022. I'm bullish USDCHF as long as it holds above the green support trend line and I will be even more bullish if the blue resistance area is broken upwards. The material has been provided by InstaForex Company - www.instaforex.com |
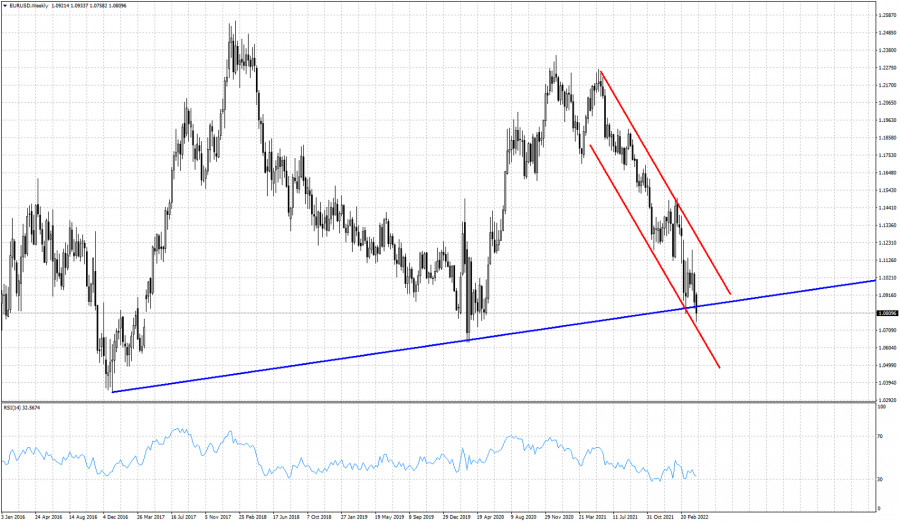
| Posted: 15 Apr 2022 12:38 PM PDT Trading has been light today Friday the 15th of April due to Easter Holiday. EURUSD on a weekly basis is challenging important trend line support coming from 2016. Trend remains bearish as price continues to trade inside the bearish channel.
Red lines- bearish channel EURUSD is inside a bearish channel and is now trading below the blue support trend line. The weekly RSI continues to provide bullish divergence warning signals and that is why we prefer to be neutral and not bearish as we believe the downside potential is limited. Resistance by the channel is at 1.12-1.1180. So a bounce towards that level is justified as we are at oversold levels. Next week I expect EURUSD to bounce higher. The material has been provided by InstaForex Company - www.instaforex.com |
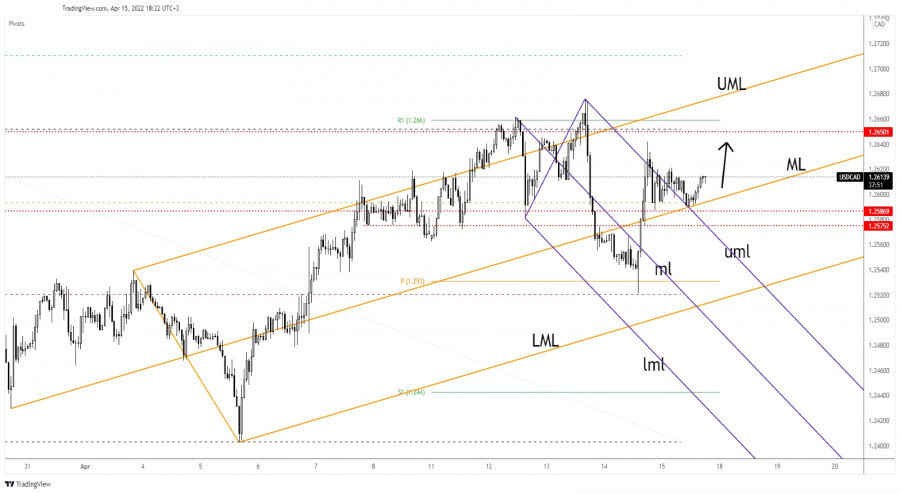
| Posted: 15 Apr 2022 09:35 AM PDT The USD/CAD pair plunged after the BOC but it has failed to stay in the sellers' territory. The price erased the short-term losses and now it seems determined to come back to its former highs. It's traded at 1.2611 and it could climb higher if the Dollar Index resumes its growth after better than expected US data reported earlier. USD/CAD retreated a little but the bulls took the lead again after the US Industrial Production rose by 0.9% beating the 0.4% expected, Capacity Utilization Rate came in at 78.3% exceeding 77.88% estimates, while the Empire State Manufacturing Index was reported at 24.6 points above 0.9 points forecasts. USD/CAD 1.2650 As Target!
USD/CAD stands above the median line (ML) of the ascending pitchfork after escaping from the descending pitchfork's body. It has retested the 38.2% (1.2593), the upper median line (uml), and the median line (ML), and now it tries to resume its growth. 1.2575 and 1.2586 levels are seen as static support levels. In the short term, it could grow as long as it stays above the median line (ML). USD/CAD Forecast!After its minor retreat, USD/CAD could climb higher towards the 1.2650 key level. As long as it stays above the median line (ML), the pair could be attracted by the upper median line (UML). The 38.2% retest was seen as a potential long opportunity. Only a valid breakdown below 1.2575 could invalidate an upside continuation. The material has been provided by InstaForex Company - www.instaforex.com |
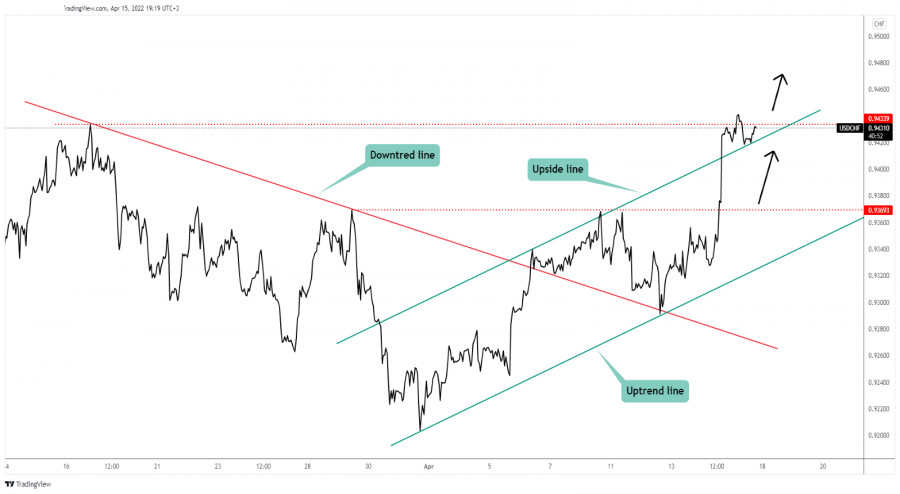
| USD/CHF: upside continuation expected Posted: 15 Apr 2022 09:34 AM PDT
USD/CHF Strong Buyers!The USD/CHF pair registered strong growth in the short term. Now, it's traded at 0.9429 below 0.9433 high which represents an upside obstacle. The price jumped above this level but it has failed to stabilize above it signaling that the buyers are exhausted. Still, the USD/CHF pair could climb towards new highs anytime as long as it stays above the up channel's upside line. Breaking above this dynamic obstacle signaled potential further growth. USD/CHF Trading Conclusion!Staying above the upside line and jumping above the 0.9442 today's high could signal an upside continuation. This scenario could bring new buying opportunities. Staying below 0.9433 and dropping below the upside line may signal a new downside movement. The material has been provided by InstaForex Company - www.instaforex.com |
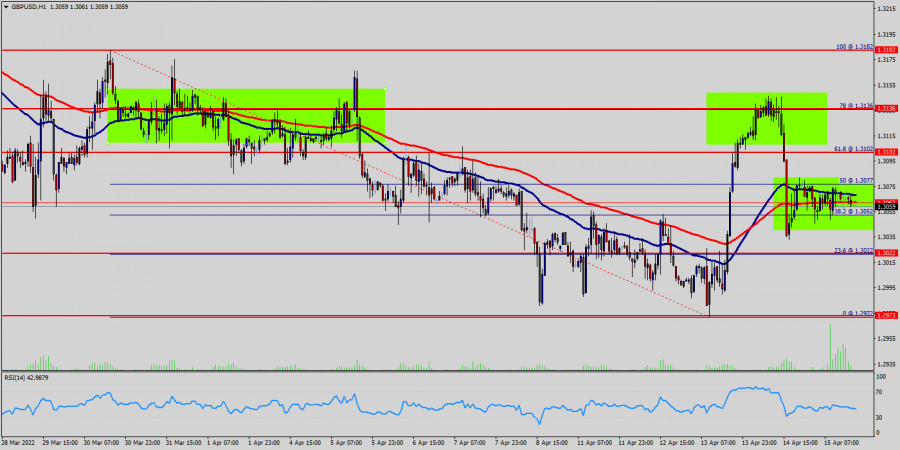
| Technical analysis of GBP/USD for April 15, 2022 Posted: 15 Apr 2022 09:26 AM PDT
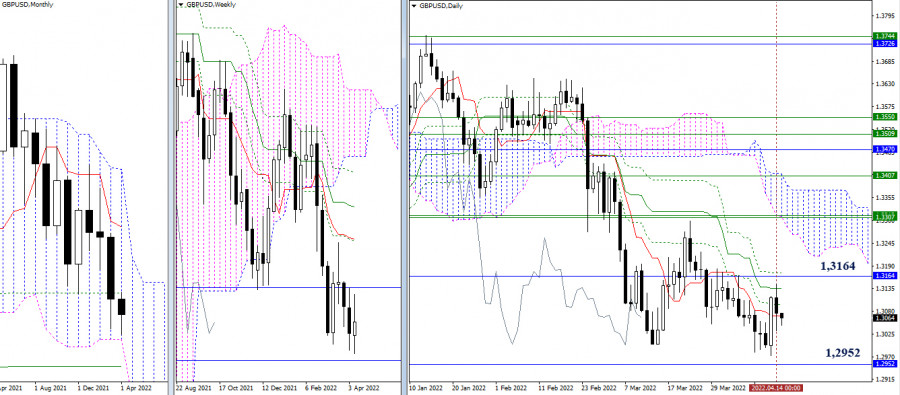
The GBP/USD traded higher and closed the day in positive territory around 1.3059. Today it has also slightly increased, having risen to the level of 1.3164, but the trend rebounded to 1.3059. The GBP/USD pair has broken resistance at the level of 1.3052 which acts as support now. Thus, the pair has already formed minor support at 1.3052.The strong support is seen at the level of 1.3022 because it represents the weekly support 1. On the hourly chart, the GBP/USD is testing resistance - the moving average line MA (100) H1 (1.3059). It may be necessary to look for entry points for selling at the end of the correction. The trend of GBP/USD pair movement was controversial as it took place in a narrow sideways channel, the market showed signs of instability. Amid the previous events, the price is still moving between the levels of 1.3166 and 1.3022. Also, the daily resistance and support are seen at the levels of 1.3166 and 1.3022 respectively. Therefore, it is recommended to be cautious while placing orders in this area. So, we need to wait until the sideways channel has completed. Yesterday, the market moved from its bottom at 1.3035 and continued to rise towards the top of 1.3060. Today, in the one-hour chart, the current rise will remain within a framework of correction. However, if the pair fails to pass through the level of 1.3102, the market will indicate a bearish opportunity below the strong resistance level of 1.3102 (the level of 1.3136 coincides with the double top too). Since there is nothing new in this market, it is not bullish yet. Sell deals are recommended below the level of 1.3102 with the first target at 1.3022. If the trend breaks the support level of 1.3022, the pair is likely to move downwards continuing the development of a bearish trend to the level 1.2973 in order to test the daily support 2 (horizontal red line). On the contrary, if a breakout takes place at the resistance level of 1.3136 (the double top), then this scenario may become invalidated. The material has been provided by InstaForex Company - www.instaforex.com |
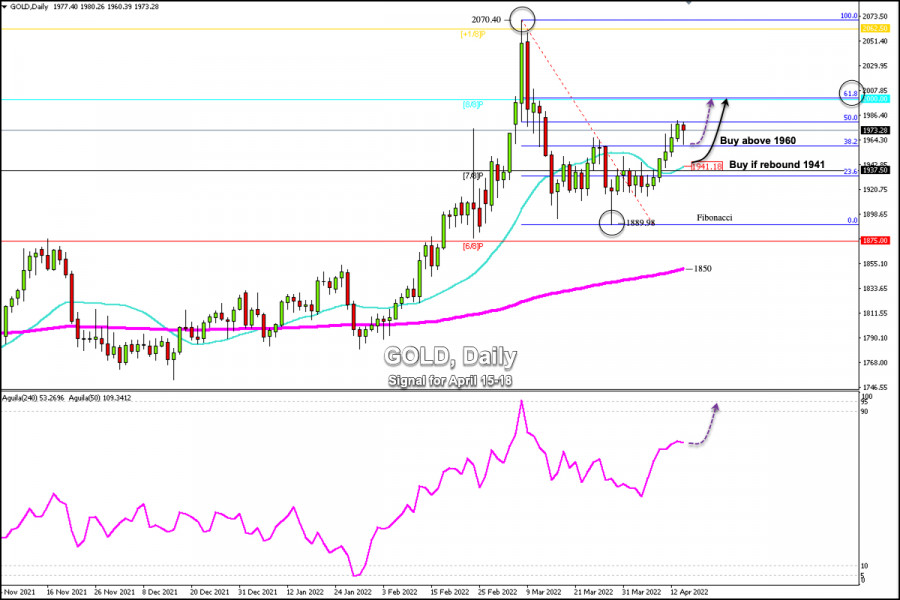
| Posted: 15 Apr 2022 09:26 AM PDT
From the high of 2,070.40 and the low of 1,889.98, gold (XAU/USD) has retraced to reach the 50% Fibonacci. According to the daily chart, gold is trading above the 21 SMA located at 1,941 and above 200 EMA located at 1,850. This gives gold a bullish outlook and it is likely to continue its uptrend until in the coming days, reaching the 61.8% Fibonacci retracement around the psychological level of $2,000. Yesterday the data that gave volatility to the market was the ECB policy decision which disappointed those who were looking for aggressive clues. The Executive Board left the current policy unchanged, without indicating any need to speed up the rate of adjustment. This outcome limited the strength of gold and we saw a correction towards the 38.2% Fibonacci. Then, the price bounced back and closed around 1,973. The next week will be decisive for gold. The price is expected to continue the upward movement towards 8/8 Murray located at $2,000. A daily close above this zone could accelerate the bullish movement and the price could reach +1/8 Murray around 2,062. On the other hand, yesterday the US currency (USDX) extended its positive momentum reaching a high at 100.74, a level that was last seen on May 2020. The dollar looks overbought and a technical correction is likely next week which could favor gold. According to the daily chart, the intraday decline looks corrective after the metal advanced for six straight days. Therefore, any setback towards 1,960 or 1,941 will be an opportunity to buy gold in the coming days. The material has been provided by InstaForex Company - www.instaforex.com |
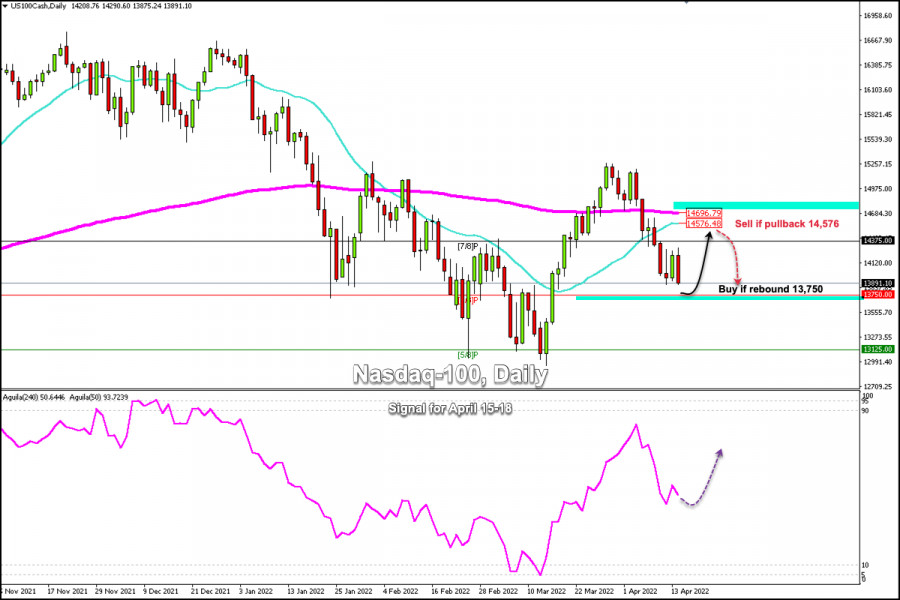
| Posted: 15 Apr 2022 09:23 AM PDT
Since March 29, the Nasdaq-100 (#NDX) has been falling after reaching 15,275. It is currently trading at 13,891 on the daily chart and is located below the 200 EMA and below the 21 SMA which adds a negative outlook for the Nasdaq-100. The Nasdaq 100, was the worst performer among the main US indices, accumulating a loss of around 2.3% on Thursday, retreating below the level of 14,000, and targeting the support of 6/8 Murray at 13,750. The equity market will receive a barrage of new releases of profit or loss results from major companies that make up the Nasdaq-100 next week. These reports could give the Nasdaq a technical bounce and its price reach the 21 SMA at 14,576. US markets will be closed on Friday for the Easter holidays. The news that moved the market on Thursday can be digested from the Asian session on Monday. Our trading plan for the next few days is to wait for a consolidation around 6/8 Murray at 13,750 to buy with targets at 14,120, and 14,375 as the index could hit the 200 EMA at 14,696. A pullback towards 14,576 could be a selling opportunity as long as it consolidates or trades below 14,700. Additionally, with a sharp break below 13,750, the index could continue the downward movement and reach 13,125 (5/8 Murray). The eagle indicator is with a negative bias, but it maintains the bullish signal which could favor the recovery of the Nasdaq-100 in the next few days. The material has been provided by InstaForex Company - www.instaforex.com |
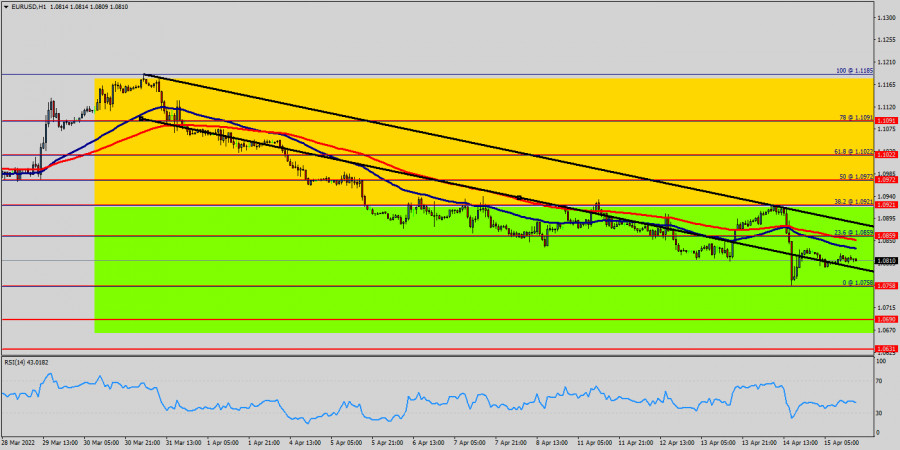
| Technical analysis of EUR/USD for April 15, 2022 Posted: 15 Apr 2022 08:58 AM PDT
The main scenario for the EUR/USD pair's promotion, the pair may decline to next support levels of 1.0758 and 1.0690. The EUR/USD pair continues to move downwards from the level of 1.0921. The pair dropped from the level of 1.0921 (this level of 1.0921 coincides with the double top - pivot point - 38.2% Fibo) to the bottom around 1.0802. Moreover, the double bottom (1.0802) is also coinciding with the major support this week. Additionally, the RSI is still calling for a strong bullish market as well as the current price is also above the moving average 100. The EUR/USD pair couldn't hit the weekly pivot point and resistance 1, because of the series of relatively equal highs and equal lows. Hence, the pair has dropped down in order to bottom at the point of 1.0802. Today, the first resistance level is seen at 1.0921 followed by 1.0972 (weekly resistance), while daily support 1 is found at 1.0758. Also, the level of 1.0921 represents a weekly pivot point for that it is acting as major resistance/support this week. Amid the previous events, the pair is still in a downtrend, because the EUR/USD pair is trading in a bearish trend from the new resistance line of 1.0921 towards the first support level at 1.0758 in order to test it. If the pair succeeds to pass through the level of 1.0758, the market will indicate a bearish opportunity below the level of 1.0758. However, if a breakout happens at the resistance level of 1.1022, then this scenario may be invalidated. The material has been provided by InstaForex Company - www.instaforex.com |
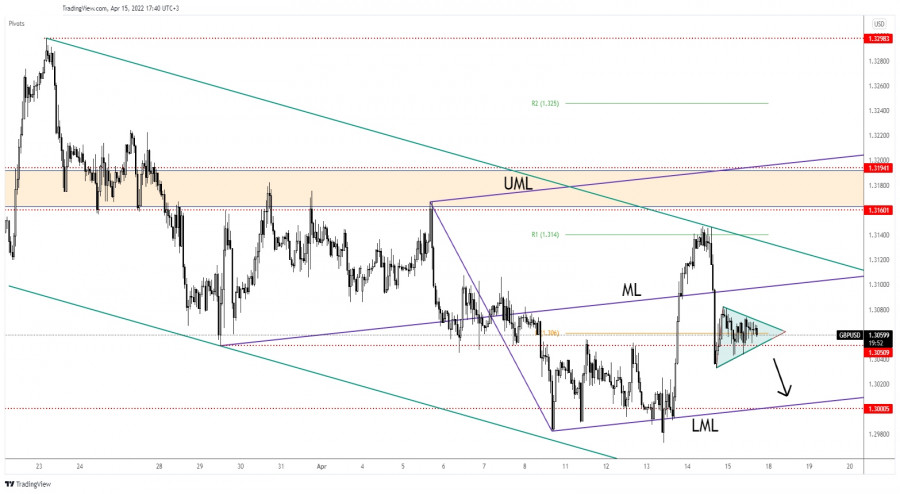
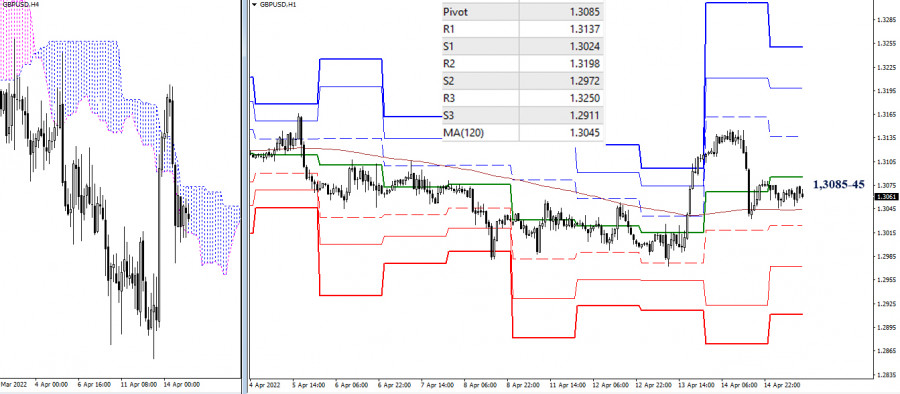
| Posted: 15 Apr 2022 08:11 AM PDT The GBP/USD pair is moving sideways in the short term. It's trapped within a minor triangle pattern. Escaping from this formation could bring a clear direction. It's trading at 1.3059 at the time of writing above the 1.3050 key level. The downside pressure remains high as the Dollar Index remains bullish. The greenback received a helping hand from the US data. Industrial Production rose by 0.9% in March versus 0.4% expected, Capacity Utilization Rate was reported higher at 78.3% versus 77.8% forecasts, while the Empire State Manufacturing Index came in at 24.6 points above 0.9 estimates. GBP/USD Undecided!
As you can see on the H4 chart, the GBP/USD pair rallied after registering only false breakdowns below 1.3. The British Pound was strongly bullish after the UK inflation came in higher than expected. The pair is trapped within a down-channel pattern. GBP/USD failed to stabilize above the ascending pitchfork median line (ML) which is seen as a dynamic resistance. 1.3050 former low represents static support. GBP/USD Outlook!As long as it stays under the median line (ML) and below the downtrend line, GBP/USD could drop deeper anytime. In the short term, registering a valid breakdown from the minor triangle, dropping and stabilizing below 1.3050 could open the door for more declines. This scenario could help the sellers to catch a new sell-off towards 1.3. The material has been provided by InstaForex Company - www.instaforex.com |
| April 15, 2022 : EUR/USD daily technical review and trading opportunities. Posted: 15 Apr 2022 07:49 AM PDT
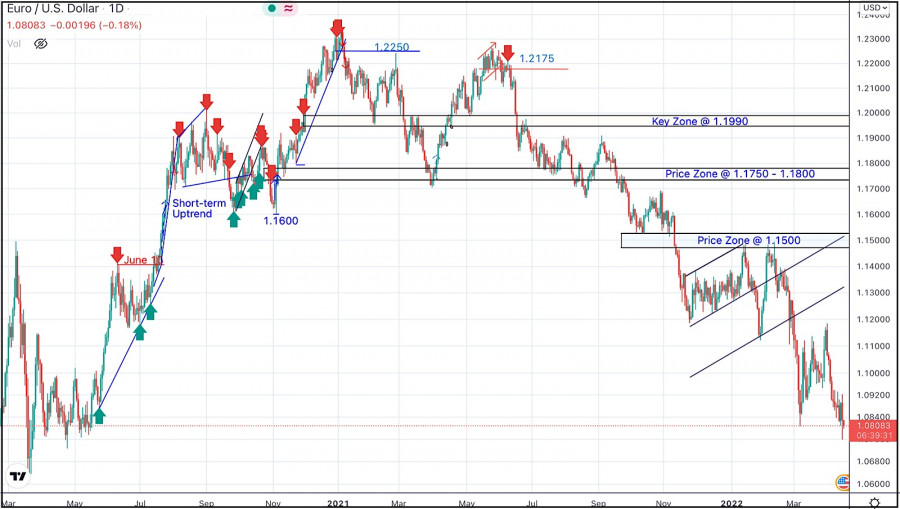
During the past few weeks, the EURUSD pair has been trapped within a consolidation range between the price levels of 1.1700 and 1.1900. In late September, Re-closure below the price level of 1.1700 has initiated another downside movement towards 1.1540. Price levels around 1.1700 managed to hold prices for a short period of time before another price decline towards 1.1200. Since then, the EURUSD has been moving-up within the depicted movement channel until bearish breakout occurred by the end of last week's consolidations. Few weeks ago, the price zone of 1.1350 failed to offer sufficient bearish rejection that's why it was bypassed until 1.1500 which applied significant bearish pressure on the pair. A possible SELL Entry was offered upon the previous ascending movement towards 1.1500 which provided significant bearish pressure. Shortly after, the EURUSD looked oversold while approaching the price levels of 1.0850. That's where the recent upside movement was initiated. Any movement towards 1.1200 should be considered for another SELL trade as long as sufficient SELLING pressure is demonstrated. The material has been provided by InstaForex Company - www.instaforex.com |
| April 15, 2022 : EUR/USD Intraday technical analysis and trading plan. Posted: 15 Apr 2022 07:48 AM PDT
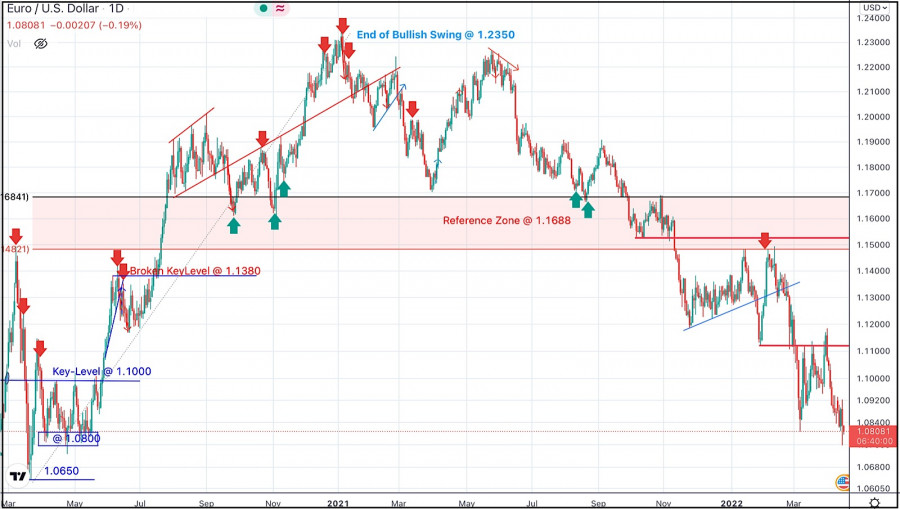
Recent bullish pullback towards 1.1650-1.1680 (upper limit of the previous consolidation range) was expected to offer bearish rejection and a valid SELL Entry. Significant bearish decline brought the EURUSD pair again towards 1.1550 levels which failed to provide sufficient BUYERS for too long period. Hence, only a short- term sideway movement was demonstrated around 1.1550 before quick bearish decline could occur towards 1.1200. On the other hand, the price levels around 1.1520 stood as a reference zone that applied significant bearish pressure upon two successive bullish visits. Recent Bearish decline below 1.1100 was considered as a bearish continuation sign. That's why, downside movement was expected to proceed towards 1.1000 then 1.0920 where the recent bullish pullback was initiated. The price levels around 1.1150 ended the recent bullish move and a another bearish move is currently being expressed. However, failure to record a new LOW below 1.0850 will probably enable more bullish advancement at least towards 1.1320. The material has been provided by InstaForex Company - www.instaforex.com |
| April 15, 2022 : GBP/USD Intraday technical analysis and significant key-levels. Posted: 15 Apr 2022 07:47 AM PDT
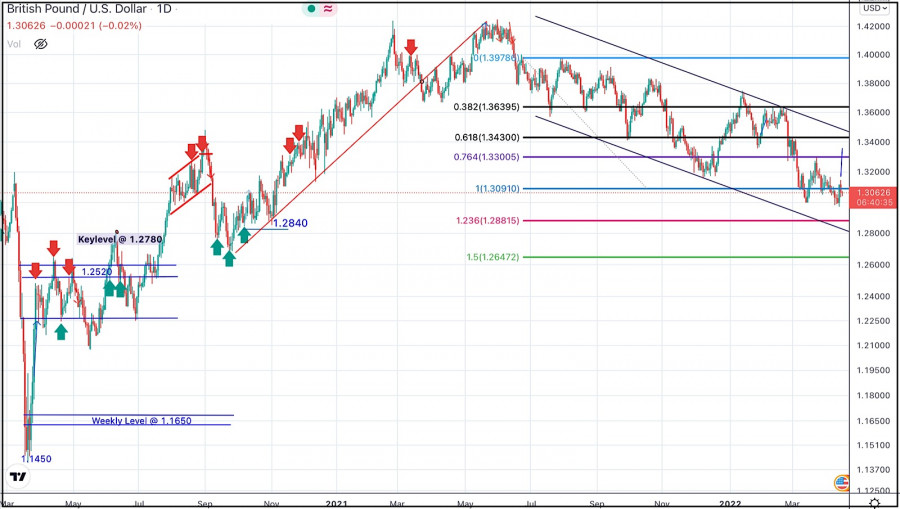
The GBPUSD pair has been moving within the depicted bearish channel since July. Recently, BUYERS were watching the price levels of 1.3730 to have some profits off their trades as it stood as a key-resistance which offered significant bearish rejection recently. The short-term outlook turned bearish when the market went below 1.3600. This enhanced the bearish side of the market towards 1.3400 which brought the pair back towards 1.3600 for another re-test. Hence, the recent bullish pullback towards 1.3600 should have been considered for SELL trades as it corresponded to the upper limit of the ongoing bearish channel. It's already running in profits. Bearish persistence below 1.3090 was needed to enable further downside continuation towards 1.2900 (the lower limit of the movement channel). Instead, bullish rejection has arised many times around 1.3000 standing as a significant Daily Support where the current consolidation range has arised recently. However, another bearish breakout below 1.3090 will probably enable more bearish extension at least towards 1.2890. On the other hand, bullish breakout above 1.3280 is needed to enable quick bullish advancement towards 1.3400 and probably 1.3600 if sufficient bullish momentum is expressed. The material has been provided by InstaForex Company - www.instaforex.com |
| The main news of the crypto market for April 15 Posted: 15 Apr 2022 07:43 AM PDT
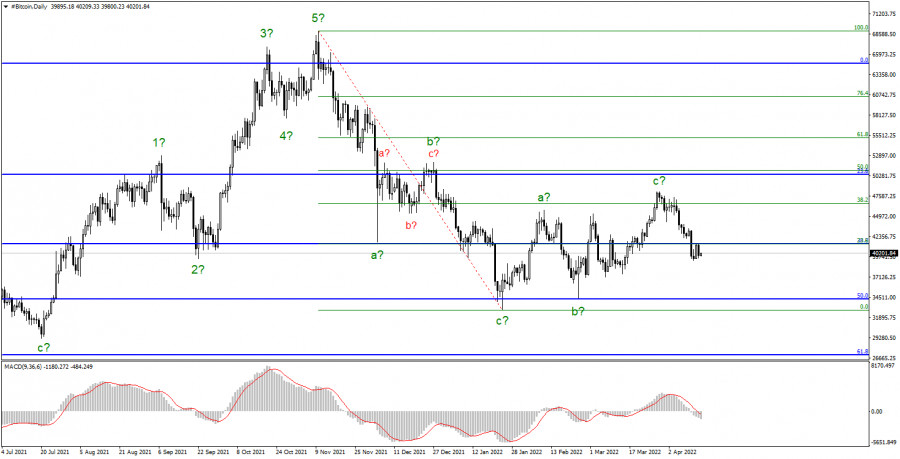
Bitcoin has managed to grow in price by almost $ 2,000 over the past 24 hours. However, the current wave marking does not give an unambiguous answer to the question of which section of the trend is currently being built. Let me remind you that the upward section of the trend, which originates on January 24, may turn out to be a three-wave and in this case has already been completed. Or it may turn out to be a five-wave, then in the coming weeks, the increase in bitcoin quotes should resume with targets located near the estimated mark of $ 50,364, which equates to 23.6% Fibonacci. I think that the chances of building an a-b-c-d-e structure are still a little more. About 60 by 40. However, at this time, the news background for the cryptocurrency market is very weak. There is no news of this magnitude that could suggest how the market mood will change in the near future. The Fed should raise the rate by 0.5% in May, and in June - raise the rate by 0.5% and reduce its balance sheet by $ 95 billion. In my opinion, this means that the stock and cryptocurrency markets may be under pressure. I think that in the next year or two we will observe the flow of capital from stocks and cryptocurrencies into bonds and deposits. However, some analysts say that the flow will be observed from the stock market to bitcoin. Bitcoin is still predicted to have a great future One of the ardent fans of bitcoin, the president of the Celsius Network, Alex Mashinsky, said that the cryptocurrency could grow in price to $ 100,000 this year. He believes that due to the actions of the Fed to tighten monetary policy, investors will flee from the stock market. Mashinsky does not currently see a correlation between the stock and the cryptocurrency market, which "may speak of bitcoin as a safe-haven." Mashinsky believes that all assets that are somehow connected with the dollar are now very much inflated due to QE programs. In his opinion, investors will not transfer capital from the "bloated" stock market to the no less "bloated" real estate market, bond market, or any other. Inflation is observed everywhere. Another thing is bitcoin, Mashinsky believes, it is not connected with the US dollar, and its emission is limited. The Fed cannot influence him in any way either with rates or with "games with liquidity". Elon Musk moves cryptocurrencies Just the other day, the head of Tesla, Elon Musk, voiced his opinion. He wrote on Twitter that he continues to hold bitcoins, Ethereum, and dogecoin due to fears of high inflation and the rising cost of raw materials due to the isolation of Russia. Musk advised everyone to buy "physical" or "scarce" assets, as well as shares of companies that make "good products." That is, Musk voiced an opinion directly opposite to what Mashinsky said. In my opinion, this once again proves the fact that even billionaires, investors, and analysts of large banks and agencies have different opinions on the cryptocurrency market. Therefore, one cannot blindly believe any one of them.
The construction of the downward section of the trend has been completed, it has taken a three-wave form. An unsuccessful attempt to break through the $ 34,238 mark, which corresponds to 50.0% on the senior Fibonacci grid, allowed bitcoin to start building a new upward section, which is also corrective. The only question is, what kind will it take: three-wave or five-wave? In the first case, the decline in quotations has already begun within the first wave of a new downward trend segment with targets located around $ 34,238. The targets of the entire descending set of waves are located much lower. In the second case, the instrument can already start building a wave e with targets of about $ 50,364 from the current price marks. I don't expect the current trend segment to take on an impulsive look. Accordingly, I do not expect a BTC quote above $ 50,364. In the perspective of the next two or three months, I expect a strong drop in demand for the first cryptocurrency and its decline is much lower than the low of the previous downward trend segment, located at around $ 32,840. The material has been provided by InstaForex Company - www.instaforex.com |
| European stock indexes up on Thursday following ECB policy decision Posted: 15 Apr 2022 06:16 AM PDT
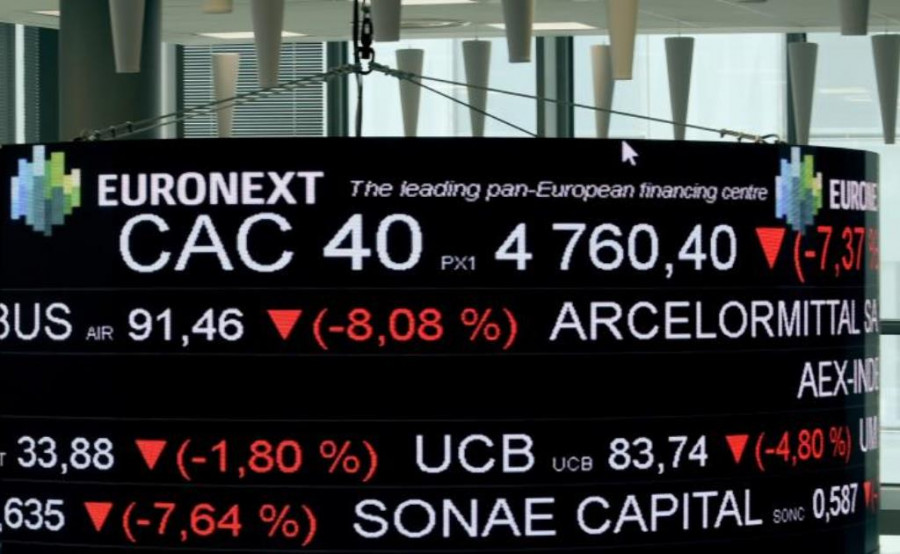
Major European indexes finished Thursday in positive territory, with the STOXX Europe 600 adding 0.67%. The DAX increased by 0.62% and the CAC 40 rose by 0.72%. The FTSE 100 gained 0.47%, recovering from early losses. The IBEX 35 and the FTSE MIB advanced by 0.94% and 0.57% respectively. Due to Easter, stock exchanges in Europe will be closed on Friday and Monday. Yesterday, the European Central Bank published its policy decision, leaving the interest rate unchanged at 0% despite high inflation. The ECB has kept the interest rate at zero for the past 6 years. Furthermore, the regulator announced it would finish the APP bond-buying program in Q2 2022. Asset purchases would be reduced to €20 billion by June from the current level of €40 billion. The ECB's decision has boosted optimism among investors amid attempts by US and UK regulators to quell high inflation by hiking interest rates. The earnings season for Q1 2022 has begun. On the STOXX Europe 600, the best performers were Auto1 Group (+12.08%), WizzAir Holdings (+7.75%), and Deliveroo PLC (+6.8%). Shares of Ericsson lost 4.7% after the company announced a loss of 7.3% in Q1 2022, missing market estimates. Hermes advanced by 2.7% thanks to increased sales across all market segments and regions, which pushed the company's revenue up by 33%. Shares of Volkswagen shed 0.3% after the company released its preliminary earnings report. The German automaker increased its operating profit to €8.5 billion, compared to €4.5 billion in 2021. Shares of ArcelorMittal and Voestalpine AG increased by 12.3% and 1.5% respectively, after ArcelorMittal announced it would acquire a stake in the company for $1 billion. Atlantia gained 4.3% after Italy's Benetton family and US investment fund Blackstone said they will spend up to €19 billion to take the company private. The material has been provided by InstaForex Company - www.instaforex.com |
| Posted: 15 Apr 2022 06:16 AM PDT
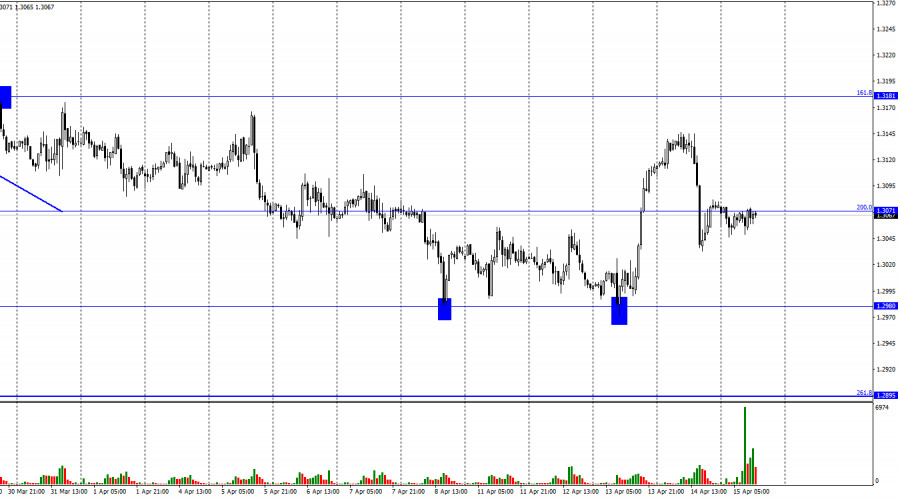
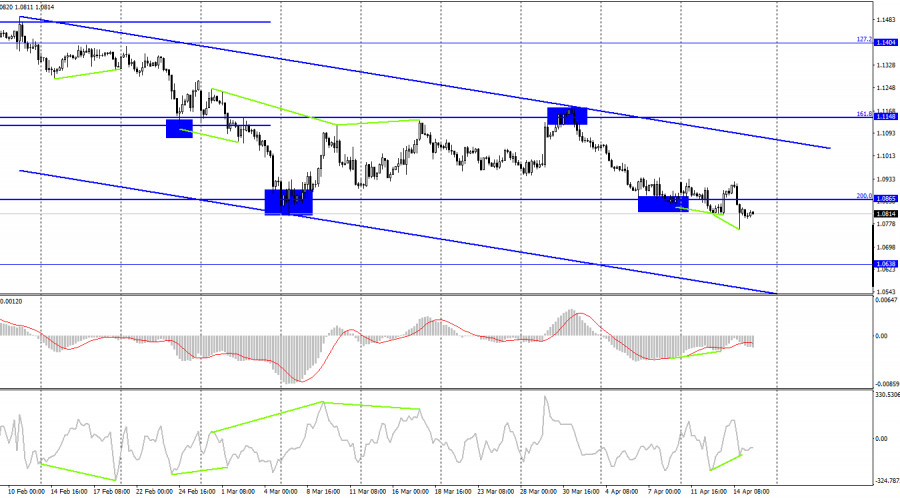
Hi, dear traders! According to the H1 chart, GBP/USD reversed downwards on Thursday and fell below the retracement level of 200.0% (1.3071). The pair remains below this level today - it can resume its downward movement towards 1.2980 within the next few trading days. It is the third attempt by GBP/USD to settle below 1.2980, and the odds of the pair falling below this level are increasing with every such attempt. The situation for the pound has not changed over the past 2 days, similar to the euro - GBP is likely to fall in the near future. There were not many events recently related to the pound sterling or the US dollar recently. Yesterday, US retail sales data were released. Sales increased by 0.5% month-over-month in March, slightly below expectations of economists. The number of initial jobless claims slightly exceeded forecasts, reaching 185,000. The University of Michigan's consumer sentiment index was higher than previously estimated. Two out of three data releases turned out to be slightly worse than expected, while the other was somewhat better than expected. However, USD late on Thursday moved the same way it did on Wednesday. The US dollar advanced strongly on Wednesday, reversed downwards after the ECB meeting on Thursday, and reversed again upwards later on. Eventually, GBP/USD slowed down near 1,3071, with US data releases failing to influence traders. In international news, Finland and Sweden are ready to apply for NATO membership in summer of 2022 due to Russia's war against Ukraine, ending 80 years of their policy of neutrality. Russia, which started the "special military operation" in response to NATO encroaching on its borders, now faces the possibility of having NATO military bases near St. Petersburg. Putin's press secretary Peskov and former president Dmitry Medvedev have already made comments about both countries facing "serious consequences" for joining the alliance. Whether Russia would launch another preemptive strike before summer remains to be seen.
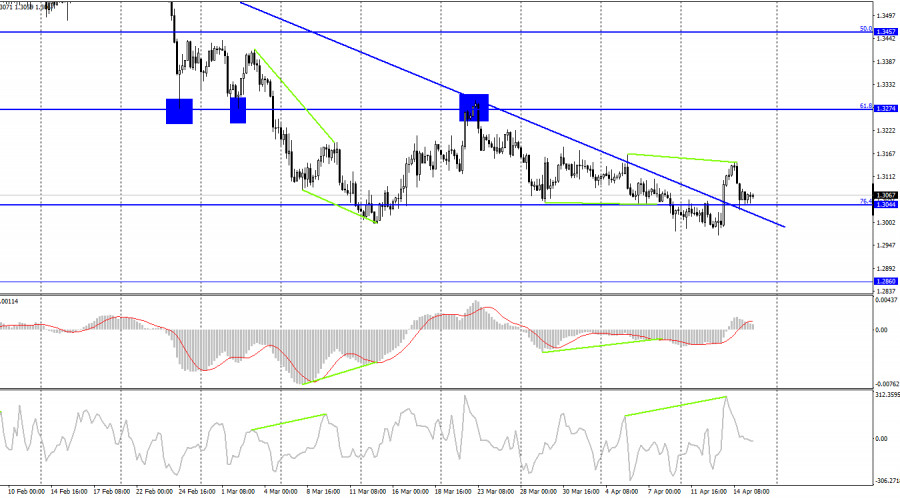
According to the H4 chart, the pair reversed upwards and settled above the descending trend line. GBP/USD returned to the retracement level of 76.4% (1.3044) due to the bearish CCI divergence. If the pair bounces off this level, it would rise towards the retracement level of 61.8% (1.3274). However, if GBP/USD settles below 1.3044, it would resume its downward movement towards 1.2860. Commitments of Traders (COT) report:
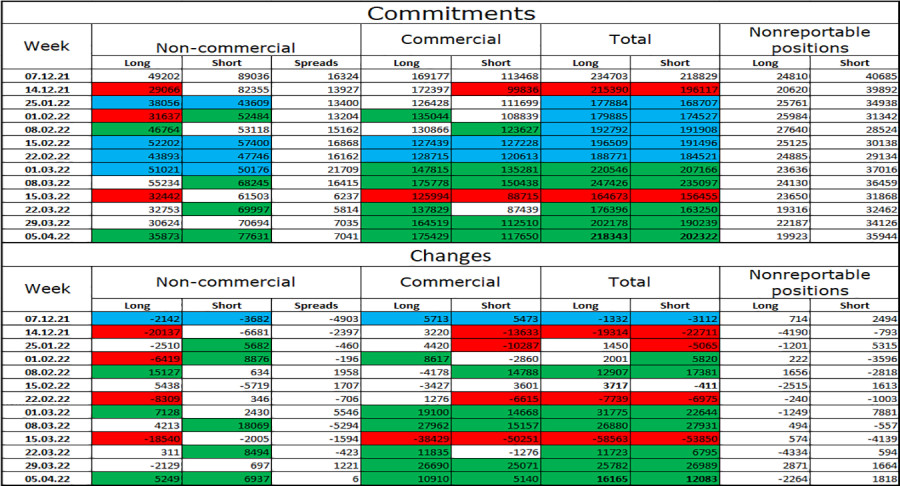
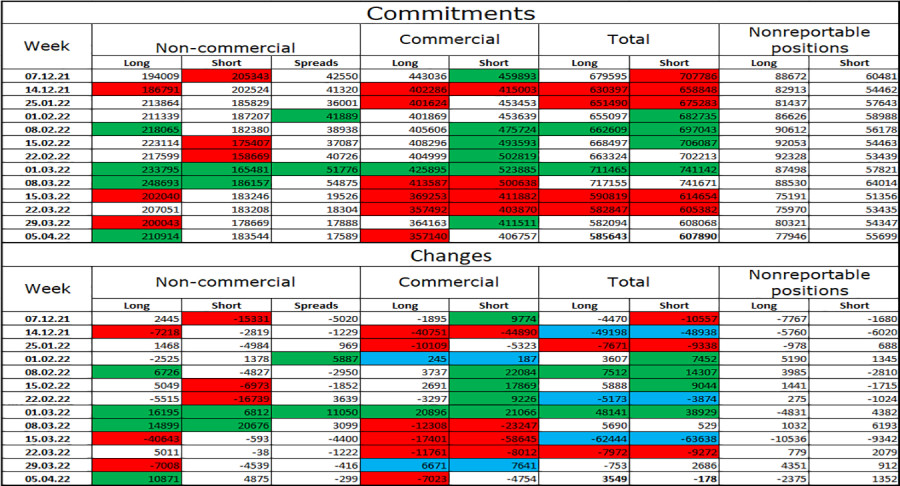
During the last week covered by the report, the mood of Non-commercial traders did not change significantly. 5,249 Long positions and 6,937 Short positions were opened, indicating an increasingly bearish sentiment in the market. The total amount of open Long positions is currently twice the amount of Short ones, matching the current situation in the market. The pair is declining, and major market players are largely opening short positions. Geopolitical factors, COT reports, and technical analysis suggests GBP/USD will likely continue its fall. US and UK economic calendar: US - industrial production data (13-15 UTC). There are no events in the UK, and the sole US data release is unlikely to influence traders. Outlook for GBP/USD: Traders are recommended to open short positions if the pair bounces off 1.3071 on the H1 chart, with 1.2980 being the target. Long positions can be opened if GBP/USD closes above 1.3071, targeting 1.3181. The material has been provided by InstaForex Company - www.instaforex.com |
| Analysis of EUR/USD, April 15. Bears take upper hand Posted: 15 Apr 2022 06:11 AM PDT
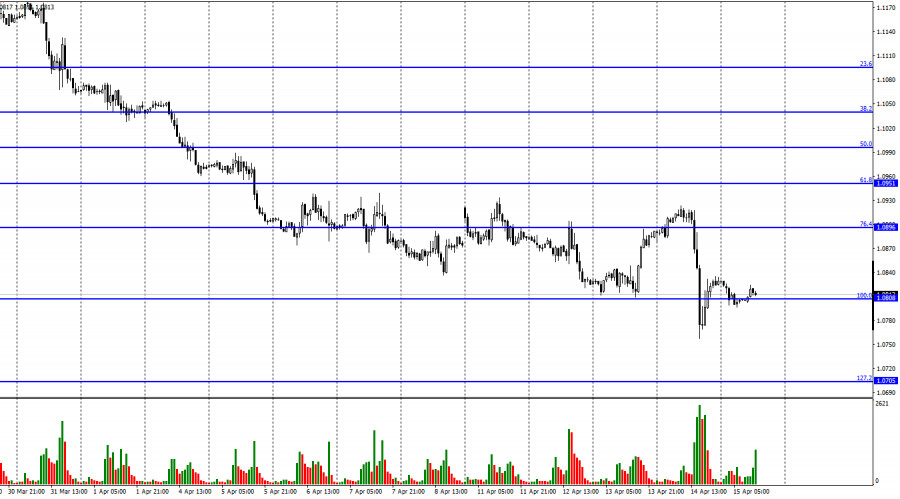
Good afternoon, dear traders! The euro/dollar pair performed a downward reversal on Thursday. So, it slid down below Wednesday's low. Thus, in just half a day, bears recouped all Wednesday's losses when the euro unexpectedly jumped. Now, the pair is trading near 1.0808, the Fibonacci correction level of 100.0%. If the price consolidates below this level, it may decline to 1.0705, the next Fibo level of 127.2%. Yesterday, there was one crucial event. The ECB summed up the results of the meeting. After the release of these results and during a press conference with Christine Lagarde, the euro went down 160 pips. For this reason, analysts are certain that this was the main reason for the drop. However, I would like to note that this conclusion may not be entirely correct. The ECB left all the parameters of monetary policy unchanged. Christine Lagarde again spoke about the risks to the EU economy, the military conflict between Ukraine and Russia, and the completion of the stimulus program. She also said that the bank would not raise the key rate in the near future. Thus, the ECB has not made any crucial changes. Christine Lagarde just repeated all the same statements that she had said in the last few months. Then why did the euro fall if traders did not get new hints? I assume that they used the ECB meeting as an excuse for new sales. A day earlier, the euro showed strong growth. Short positions would be more profitable on Thursday than on Wednesday. Apparently, speculators inflated the rate so that later they could sell it at higher prices. The fundamental background remained the same. There has also been no geopolitical news over the past few days. So, there have been no drivers for the euro and the US dollar.
On the 4H chart, the euro/dollar pair consolidated below 1.0865, the Fibonacci correction level of 200.0%. The CCI indicator signals the formation of a second bullish divergence. It means that the pair is likely to rise. However, a downtrend corridor has also appeared, which indicates the mood of traders is bearish. Thus, as long the pair does not grow above 1.0865, it will continue its downward movement. Commitments of Traders (COT): Last week, speculators opened 10,871 Long contracts and 4875 Short contracts. This means that the mood of the major market players has become more bullish. The total number of Long contracts concentrated in their hands now amounts to 211,000, while the number of Short contracts totals 183,000. Thus, the mood of the "Non-commercial" category of traders remains bullish. In this scenario, the euro is supposed to have been climbing for several weeks. Instead, it continues to either fall or trade at swing lows. To this end, it is hard to forecast its future trajectory based on COT reports. Geopolitical news and the US dollar as the main reserve currency greatly impact market sentiment. Macroeconomic calendar for the US and the EU: US – Industrial production (13:15 UTC). On April 15, the economic calendar is almost empty. There will be only one crucial report. After two days of very active trading, I think that today, trading is going to be sluggish. The report on industrial production will hardly trigger volatility. Outlook for EUR/USD and trading recommendations: It is recommended to open short positions on the pair if it closes below 1.0808 on the 1H chart with a downward target of 1.0705. It is better to reframe from opening long positions as the probability of a new fall is too high. The material has been provided by InstaForex Company - www.instaforex.com |
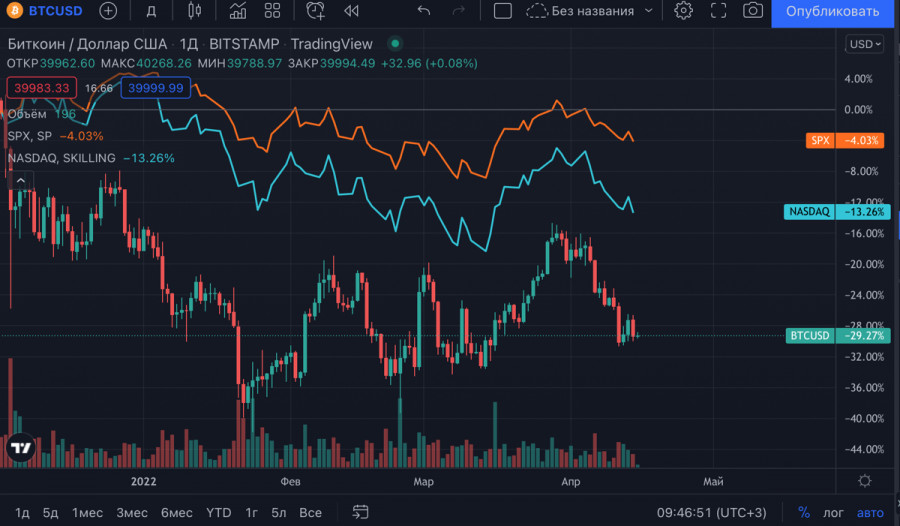
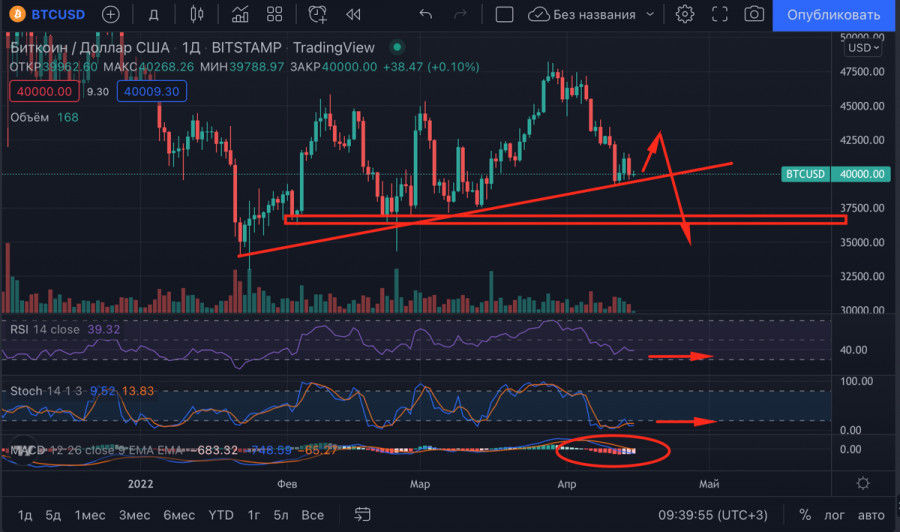
| Bitcoin trying to consolidate near $40,000, but investors show weak activity Posted: 15 Apr 2022 06:04 AM PDT Bitcoin has slowed down its downtrend within a local bearish trend. However, the situation remains tense due to the fact that the asset may plummet significantly. If Bitcoin breaks through $40,000, it would open the way to the next Fibo level, which is below $37,000. Despite this, there are other options for BTC/USD price movement. Currently, investors should take into account Bitcoin's increased correlation with stock markets. The cryptocurrency is moving in tandem with inflated stock indices like the SPX, and is likely to decline more as monetary policy tightens. In addition, there is a period of passive BTC accumulation by large investors. However, the positive trend remains due to the fact that some players and miners are locking in profits. With this in mind, the current accumulation cannot be called a purposeful increase in BTC volumes. This is rather a forced measure provoked by the emergence of free volumes that allow to average the price of the asset.
The technical picture reflects the impact of the negative fundamental background. Buying activity is low, and current volumes are barely enough to hold the price above the support of $40,000. Bitcoin has already broken through support levels of the two-week uptrend, but BTC decline below $40,000 may trigger a bigger correction. On the cryptocurrency's daily time frame, a bearish flag pattern appeared. The price managed to reach the lower boundary of this pattern, and in case the price breaks through the lower boundary of the pattern, the price may plummet to $25,000-$30,000.
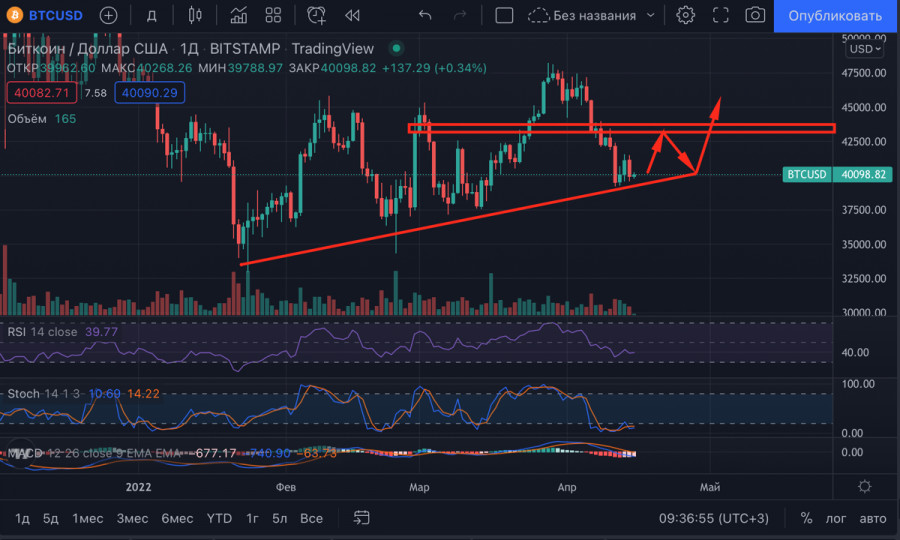
Despite the complexity and pessimism of the situation, let's first consider a positive scenario for the BTC/USD pair. If institutional investors are supported by increased activity of buyers, the price may resume upward movement. In that case, the closing of the weekly candle above $43,000 will be a signal to open long positions. This is possible due to pressure from traditional markets and institutional investors. Since more than 18% of BTC investors are retail traders, there is every reason to believe that Bitcoin will manage to resume its uptrend.
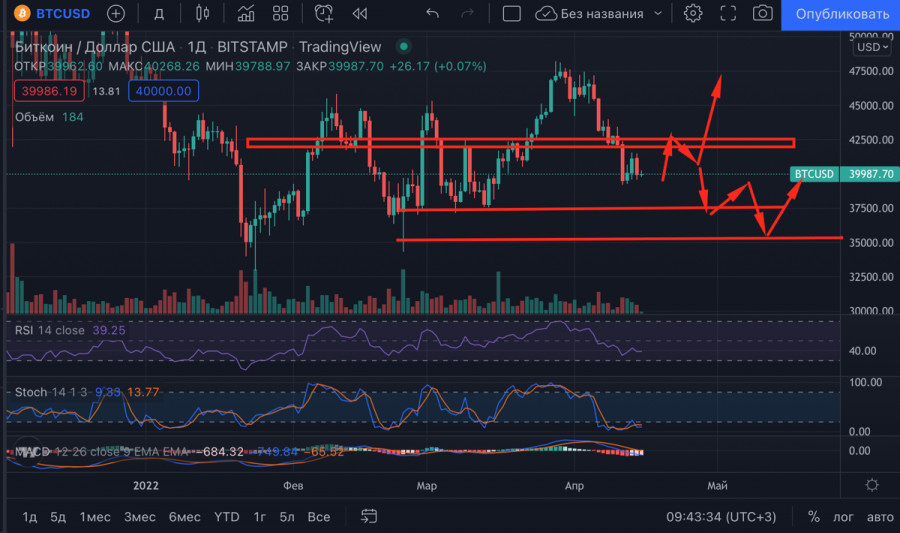
Let's consider the pessimistic scenarios, which look more likely to occur. The cryptocurrency withstood the fourth attempt to break through support at $40,000 in the fourth day. Nobody canceled the rule that the more often the price tests the zone, the more probable its future breakthrough. Therefore, it is quite probable that after trading above $40,000, we may see a local rebound to the area of $41,000-$42,500, where the 7 EMA and the Fibo level of 0.382 are located. Subsequently, the price will start to decline again due to dominating sellers' positions and passive accumulation by large investors. The price may drop to $35,000.
The second scenario could be positive, as it implies a rebound to $43,000. If bulls become more active, there will be a chance to consolidate above $43,000 and continue the upward movement towards the range of $44,000-$45,000. But in that case, the price has to break the 365 EMA and the strong 0.5 Fibo resistance level. Given the current state of the market and the fear of declining liquidity, the price will make a reversal near $43,000 and will start to decline to the range of $35,000-$36,000. Then there is a possibility of premature price recovery if some of the big investors like Luna Foundation want to protect their capital acquired during the last month. However, given the political and economic instability, it doesn't make sense to predict for such a broad period. At the current stage, the flagship cryptocurrency is much closer to a bearish price movement scenario due to the continued migration of capital by investors.
|
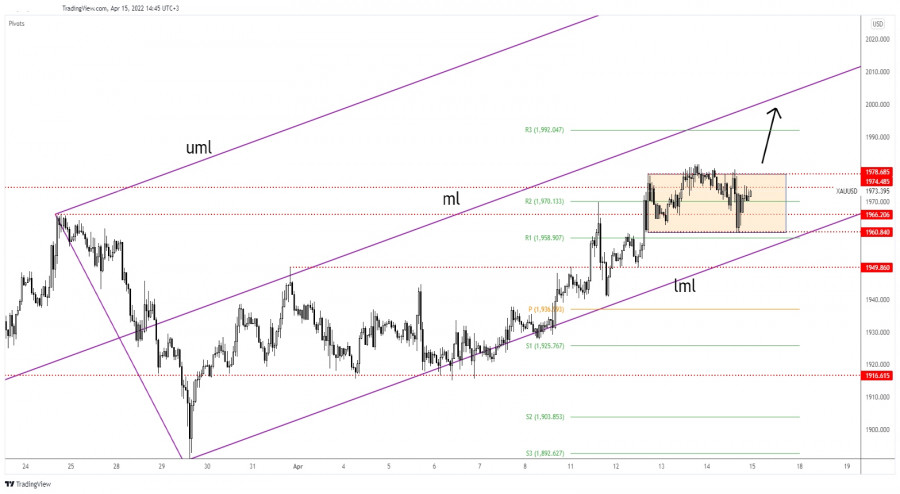
| Gold under strong buying pressure Posted: 15 Apr 2022 05:12 AM PDT The price of gold is trading in the green on the H1 chart. It's located at 1,973 at the time of writing and it seems determined to resume its growth after failing to stabilize below the 1,966 key level. In the short term, it has registered a minor retreat which is natural in an uptrend. Today, the US economic data could bring some volatility and strong moves. Industrial Production could report a 0.4% growth in March, while the Capacity Utilization Rate is expected at 77.8% versus 77.6% in the previous reporting period. XAU/USD Range!
Technically, the yellow metal developed a range pattern between 1,978 and 1,960 levels. As you already know, the bias remains bullish as long as it stays above the pitchfork's lower median line (lml). 1,966 stands as strong static support. XAU/USD could climb higher after failing to make a new lower low or to stabilize under this downside obstacle. XAU/USD Outlook!Making a valid breakout above the 1,978 static resistance, a new higher high could signal further growth at least towards the R3 (1,992). This scenario could bring new long opportunities. Also, please keep in mind that the median line (ml) acts as a magnet, so it could attract the price. The material has been provided by InstaForex Company - www.instaforex.com |
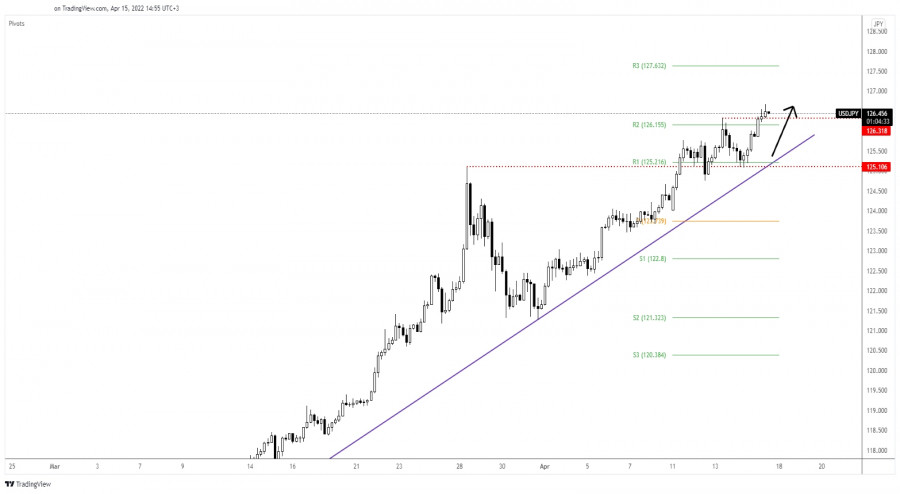
| USD/JPY: natural growth, aims at 127.00 Posted: 15 Apr 2022 05:11 AM PDT The USD/JPY pair climbed as much as 126.68 today. It has resumed its growth as expected as the Dollar Index is bullish while the Yen Basket maintains a bearish bias! You knew from my previous analysis that the currency pair could extend its growth as long as it stays above the 125.10 key level and above the uptrend line. So, the bias is bullish, but it remains to see how it will react later after the US data. Poor economic figures could force the Dollar Index to retreat. The Empire State Manufacturing Index could be reported at 0.9 points versus -11.8 in the previous reporting period. In addition, the Capacity Utilization Rate could be reported at 77.8%, while Industrial Production may report a 0.4% growth in March. USD/JPY Targeting New Highs!
USD/JPY tested and retested the 125.10 former high before resuming its growth. Its failure to reach and retest the uptrend line signal that the buyers are very strong in the short term. Now, it has passed above the weekly R1 (126.15) and above the 126.31 former high. Taking out these upside obstacles signals that the USD/JPY could resume its growth. Better than expected US data could boost the USD, so the pair could approach and reach new highs. USD/JPY Outlook!Validating the current breakout, testing, and retesting 126.31 could confirm more gains and could bring new buying opportunities with the first upside target at the 127.00 psychological level. The material has been provided by InstaForex Company - www.instaforex.com |
| Technical analysis of EUR/USD and GBP/USD on April 15, 2022 Posted: 15 Apr 2022 04:32 AM PDT EUR/USD
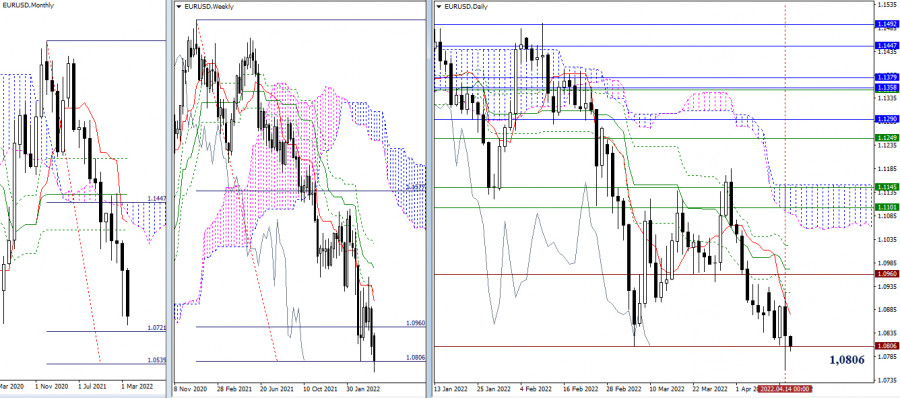
Higher time frames Yesterday, bulls failed to push the pair up from support at 1.0806 after the price had rebounded. Consequently, bears were able to test the mark and attempted to break through it. The next downward target stands in the range of 1.0721 – 1.0539. The market closes for the weekend today. Therefore, in case of a breakout of the weekly target, bearish activity may well increase. Resistance is seen at 1.0874 (daily short-term trend) – 1.0921 (daily Fobo Kijun) – 1.0960-72 (daily mid-term trend).
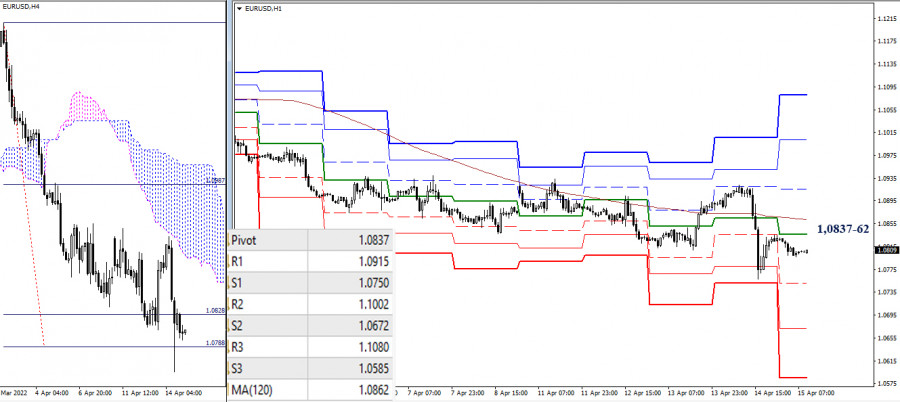
H4 – H1 Yesterday, bulls failed to consolidate at the achieved levels, and sentiment turned bearish. Should the price break through support at 1.0788 in the 4-hour time frame, classical Pivot levels will become support (1.0750 – 1.0672 – 1.0585). Bullish sentiment will return if buyers consolidate above the key support levels of lower time frames. They now stand in the 1.0837-62 range (central Pivot level + weekly long-term trend). *** GBP/USD
Higher time frames Bulls failed to push the pair up after a rebound on Wednesday. Yesterday, they partially incurred losses. The instrument now trades in the range between 1.3135 Kijun-sen and 1.3069 Tenkan-sen. Bulls will try to break through the daily cross and settle above monthly resistance at 1.3164. The downward target is still the same – to break through support, in line with the lower limit of the monthly cloud, 1.2952.
H4 – H1 The quote now trades in the range between 1.3085 (central Pivot level) and 1.3045 (weekly long-term trend). Upward intraday targets are seen at 1.3137 – 1.3198 – 1.3250 (classical Pivot resistance levels). Downward targets stand at 1.3024 – 1.2972 – 1.2911 (classical Pivot support levels). *** Technical indicators used: Higher time frames – Ichimoku Kinko Hyo (9.26.52) + Fibo Kijun levels H1 – Pivot Points (classical) + Moving Average 120 (weekly long-term trend) The material has been provided by InstaForex Company - www.instaforex.com |
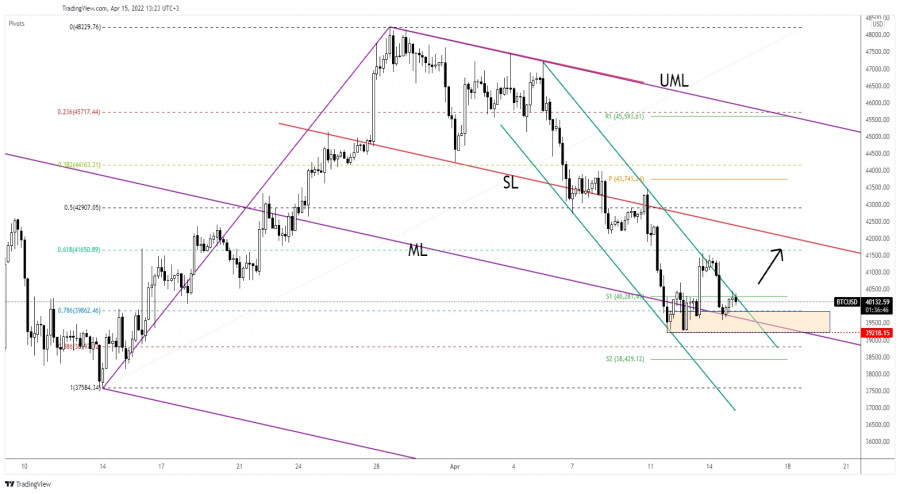
| Posted: 15 Apr 2022 04:23 AM PDT The price of bitcoin was in a corrective phase in the short term. It's traded at 40,168 at the time of writing and is fighting hard to rebound. Technically, the BTC/USD hovers right above a demand zone. In the last 24 hours, BTC/USD is down by 2.28% and by 7.66% in the last 7 days. Bitcoin's drop forced the altcoins to drop as well. The price action signaled that the correction could be over. BTC/USD Bullish Pattern!
As you can see on the H4 chart, BTC/USD found support on the median line (ML) of the descending pitchfork and on the 78.6% (39,862). Now, it challenges the downtrend line and the S1 (40,281). Staying above the median line (ML) and making a valid breakout above the downtrend line may signal that downside movement ended and that BTC/USD could develop a bullish movement. BTC/USD Outlook!Technically, the down channel could represent a bullish pattern. Staying above the support zone, making a valid breakout above the downtrend line, and registering a strong consolidation could bring new long opportunities. A potential upside movement could be invalidated by a new lower low, if the BTC/USD drops and closes below 39,218. The material has been provided by InstaForex Company - www.instaforex.com |
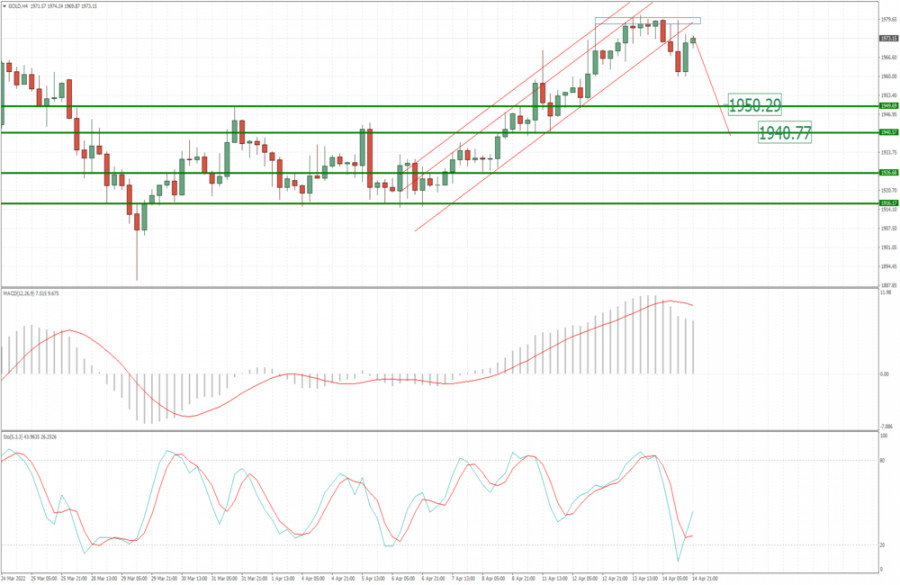
| Analysis of Gold for April 15,.2022 - Breakout of upside channel in the background Posted: 15 Apr 2022 04:23 AM PDT Technical analysis:
Gold has been trading downside yesterday and there is the breakout of the rising channel. I see potential for further downside movement. Trading recommendation: Due to the breakout of rising channel in the background, I see potential for further drop. Watch for selling opportunities on the rallies with the downside objectives at 1$1.950 and $1.940. Resistance is set at the price of $1.980 The material has been provided by InstaForex Company - www.instaforex.com |

| You are subscribed to email updates from Forex analysis review. To stop receiving these emails, you may unsubscribe now. | Email delivery powered by Google |
| Google, 1600 Amphitheatre Parkway, Mountain View, CA 94043, United States | |


Comments