Forex analysis review
Forex analysis review |
- April 8, 2022 : EUR/USD daily technical review and trading opportunities.
- April 8, 2022 : EUR/USD Intraday technical analysis and trading plan.
- April 8, 2022 : GBP/USD Intraday technical analysis and significant key-levels.
- Weekly bearish candlestick formation in AUDUSD.
- Ichimoku cloud indicator analysis on Gold for April 8, 2022.
- Ichimoku cloud indicator analysis on EURUSD for April 8, 2022.
- Bitcoin analysis using the Ichimoku cloud indicator.
- Technical analysis of EUR/USD for April 06, 2022
- Gold new bullish momentum
- Trading Signal for USD/CAD for April 08-11, 2021: sell below 1.2606 (200 EMA - overbought)
- Technical analysis of GBP/USD for April 06, 2022
- Trading Signal for Crude Oil (WTI - #CL) for April 08-11, 2021: buy above $95.60 (downtrend channel)
- The 3.0% rate is the goal of some representatives of the US Federal Reserve System by the end of the year
- Trading Signal for Gold (XAU/USD) for April 08-11, 2021: buy above $1,937 (downtrend - 7/8 Murray)
- Forecast for EUR/USD on April 8. The euro currency has slipped to the strategically important level of 1.0865
- Forecast for GBP/USD on April 8
- EUR/USD: 1.0860 is key to development of downward trend
- Trading tips for gold
- Trading tips for EUR/USD
- Dollar shone with a new luster
- Trading plan for Silver for April 08, 2022
- Global markets stumble on more aggressive Fed policy
- GBP/USD: trading plan for American session on April 8. Overview of morning trading. GBP drops below 1.3050
- Trading plan for GBPUSD for April 08, 2022
- EUR/USD: trading plan for US session on April 8 (morning trades analysis). Bulls protect 1.0852 and pair gives good buy signal
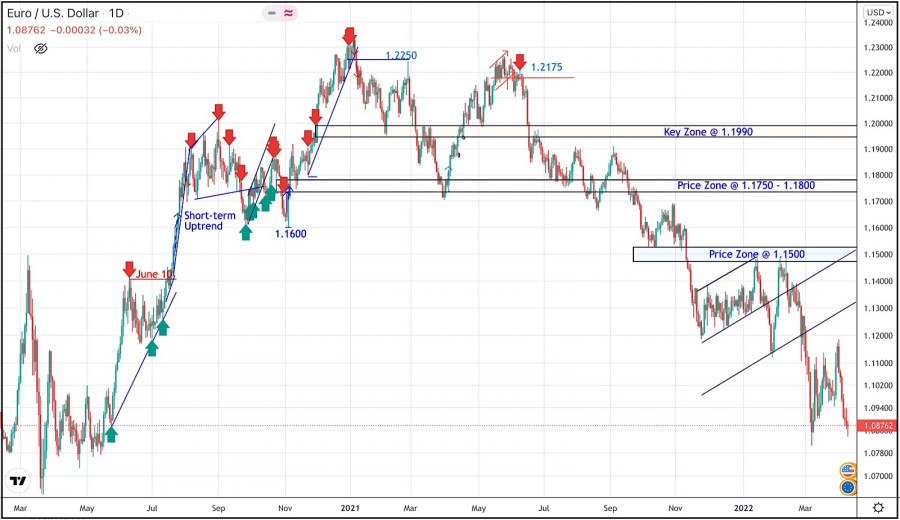
| April 8, 2022 : EUR/USD daily technical review and trading opportunities. Posted: 08 Apr 2022 02:35 PM PDT
During the past few weeks, the EURUSD pair has been trapped within a consolidation range between the price levels of 1.1700 and 1.1900. In late September, Re-closure below the price level of 1.1700 has initiated another downside movement towards 1.1540. Price levels around 1.1700 managed to hold prices for a short period of time before another price decline towards 1.1200. Since then, the EURUSD has been moving-up within the depicted movement channel until bearish breakout occurred by the end of last week's consolidations. Few weeks ago, the price zone of 1.1350 failed to offer sufficient bearish rejection that's why it was bypassed until 1.1500 which applied significant bearish pressure on the pair. A possible SELL Entry was offered upon the previous ascending movement towards 1.1500 which provided significant bearish pressure. Shortly after, the EURUSD looked oversold while approaching the price levels of 1.0850. That's where the recent upside movement was initiated. Any movement towards 1.1200 should be considered for another SELL trade as long as sufficient SELLING pressure is demonstrated. The material has been provided by InstaForex Company - www.instaforex.com |
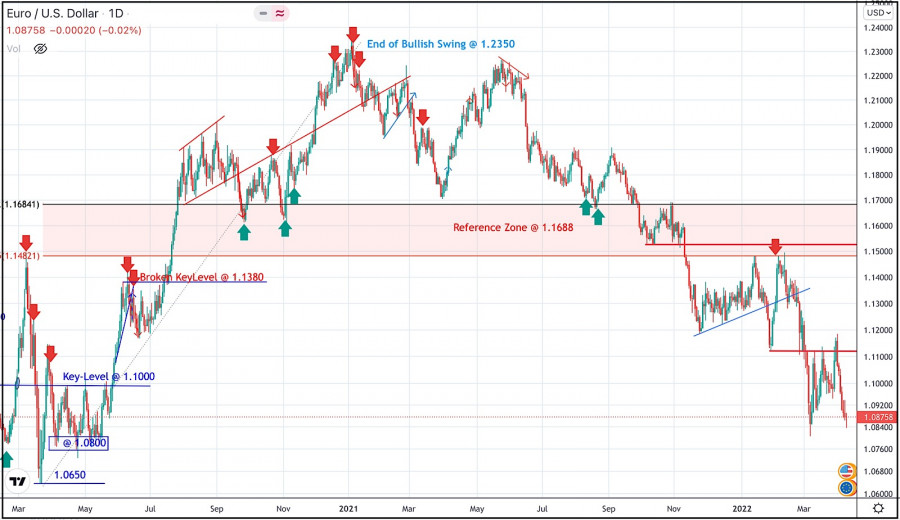
| April 8, 2022 : EUR/USD Intraday technical analysis and trading plan. Posted: 08 Apr 2022 02:34 PM PDT
Recent bullish pullback towards 1.1650-1.1680 (upper limit of the previous consolidation range) was expected to offer bearish rejection and a valid SELL Entry. Significant bearish decline brought the EURUSD pair again towards 1.1550 levels which failed to provide sufficient BUYERS for too long period. Hence, only a short- term sideway movement was demonstrated around 1.1550 before quick bearish decline could occur towards 1.1200. On the other hand, the price levels around 1.1520 stood as a reference zone that applied significant bearish pressure upon two successive bullish visits. Recent Bearish decline below 1.1100 was considered as a bearish continuation sign. That's why, downside movement was expected to proceed towards 1.1000 then 1.0920 where the recent bullish pullback was initiated. The price levels around 1.1150 ended the recent bullish move and a another bearish move is currently being expressed. However, failure to do so will probably enable more bullish advancement towards 1.1320. The material has been provided by InstaForex Company - www.instaforex.com |
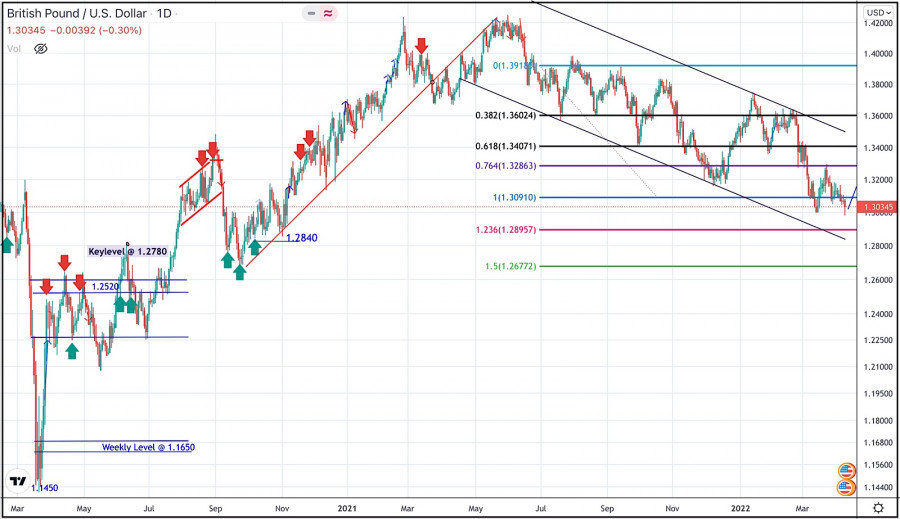
| April 8, 2022 : GBP/USD Intraday technical analysis and significant key-levels. Posted: 08 Apr 2022 02:33 PM PDT
The GBPUSD pair has been moving within the depicted bearish channel since July. Recently, BUYERS were watching the price levels of 1.3730 to have some profits off their trades as it stood as a key-resistance which offered significant bearish rejection recently. The short-term outlook turned bearish when the market went below 1.3600. This enhanced the bearish side of the market towards 1.3400 which brought the pair back towards 1.3600 for another re-test. Hence, the recent bullish pullback towards 1.3600 should have been considered for SELL trades as it corresponded to the upper limit of the ongoing bearish channel. It's already running in profits. Bearish persistence below 1.3090 was needed to enable further downside continuation towards 1.2900 (the lower limit of the movement channel). Instead, bullish rejection has arised many times around 1.3000 standing as a significant Daily Support where the current consolidation range has arised. On the other hand, another bearish breakout below 1.3090 will probably enable more bearish extension at least towards 1.2890. Bullish breakout above 1.3280 can enable quick bullish advancement towards 1.3400 and probably 1.3600. The material has been provided by InstaForex Company - www.instaforex.com |
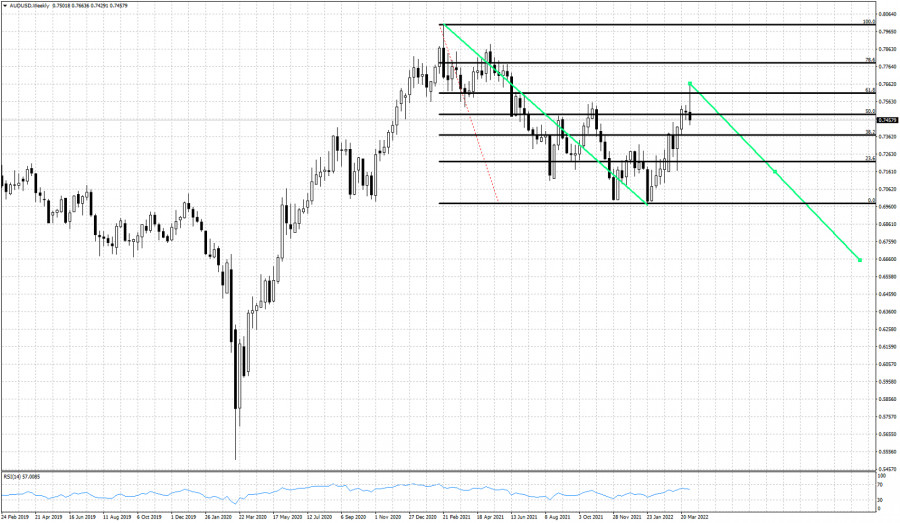
| Weekly bearish candlestick formation in AUDUSD. Posted: 08 Apr 2022 11:29 AM PDT AUDUSD is ending the week close to its weekly lows. Price is at 0.7459 with a weekly high of 0.7663 and a low at 0.7429. The long upper tail (shadow) in the weekly candlestick pattern is a bearish sign. Price also retraced 61.8% of the entire decline and got rejected at key Fibonacci resistance.
Green lines- expected path if price remains below 0.7663 AUDUSD has most probably formed an important high at 0.7663. I expect price to continue lower towards 0.67. As long as price is below this week's high I expect AUDUSD to continue lower at least towards 0.70. If the week following such a bearish candlestick pattern is negative, then the chances for our bearish scenario towards 0.70 and 0.66 will increase. The material has been provided by InstaForex Company - www.instaforex.com |
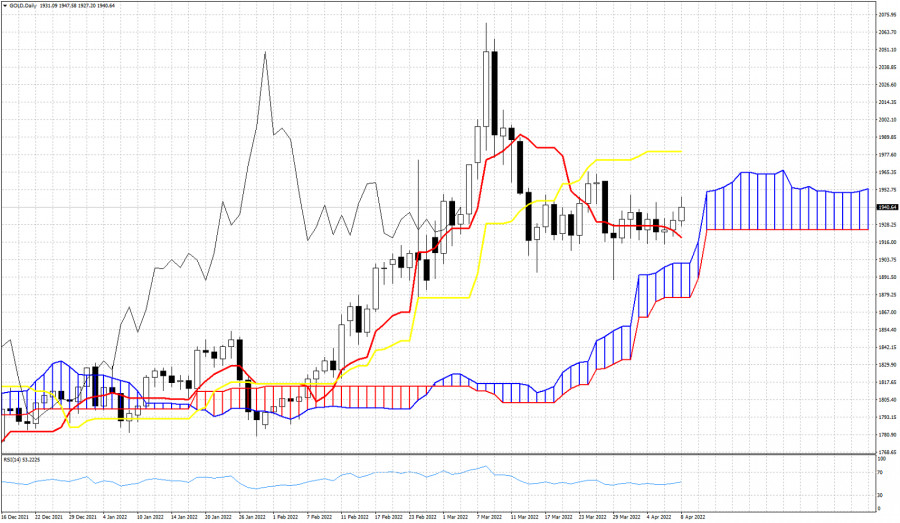
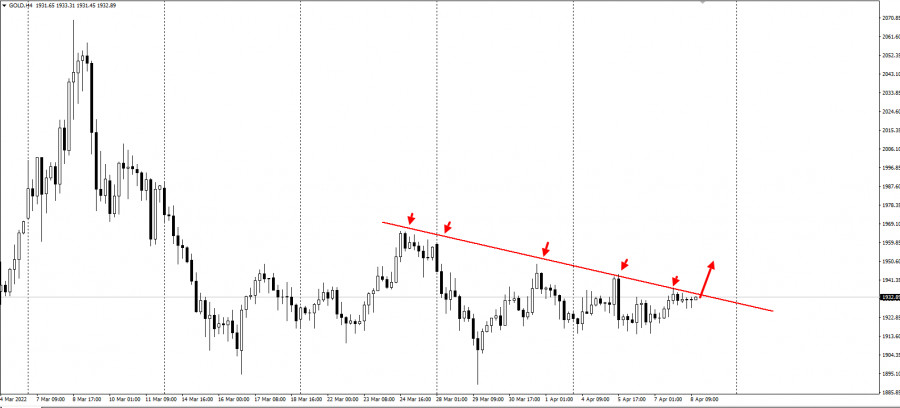
| Ichimoku cloud indicator analysis on Gold for April 8, 2022. Posted: 08 Apr 2022 11:15 AM PDT Gold price is moving higher towards the resistance of $1,950-60. According to the Ichimoku cloud indicator, trend is bullish as price continues to trade above the Daily Kumo (cloud). Price so far has respected the cloud and the last couple of days price is steadily above the tenkan-sen (red line indicator).
As we mentioned in previous posts, Gold trend is mostly sideways. Resistance by the kijun-sen (yellow line indicator) is at $1,979. In order for trend to remain bullish, price must continue trading above the cloud support. Price is approaching the cloud and the cloud is rising. In order for bulls to remain in control of the trend, price will need to rise accordingly. So far $1,900 remains a key support and trend change level. The material has been provided by InstaForex Company - www.instaforex.com |
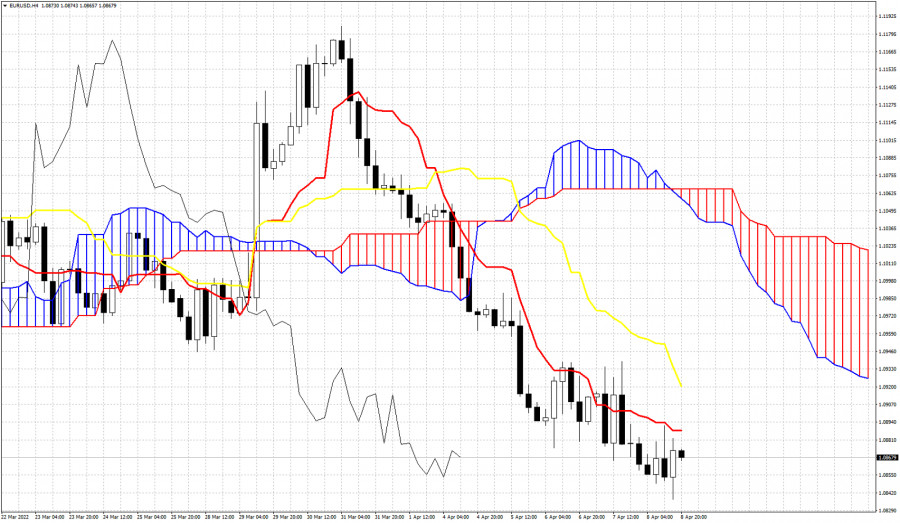
| Ichimoku cloud indicator analysis on EURUSD for April 8, 2022. Posted: 08 Apr 2022 11:05 AM PDT EURUSD remains in a bearish trend making lower lows and lower highs. Price is below 1.09 with potential to reach 1.0750 as we mentioned in previous posts. Price is making new lows but the RSI provides bullish divergence signals. This is a warning for the bears but not a reversal signal.
|
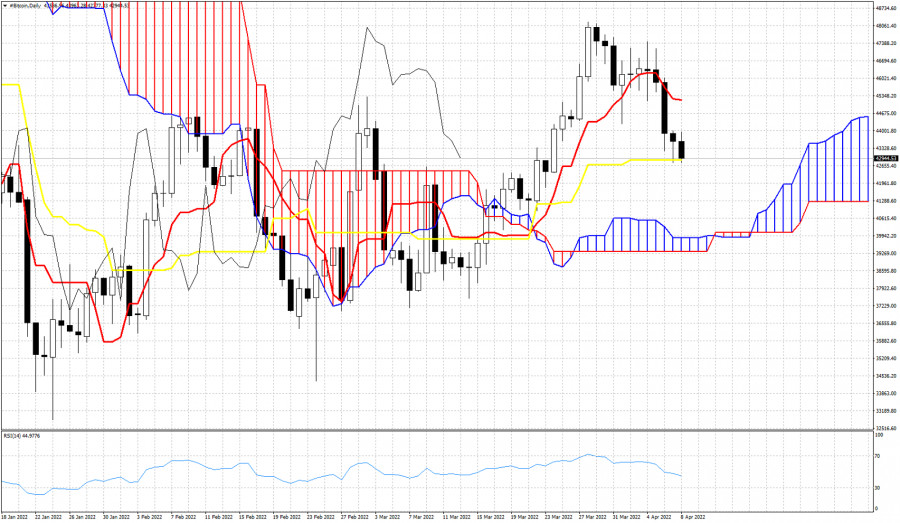
| Bitcoin analysis using the Ichimoku cloud indicator. Posted: 08 Apr 2022 11:01 AM PDT Bitcoin is trading below $43,000 right on top of the kijun-sen (yellow line indicator). Trend remains bullish as price is still above the Kumo (cloud), but price is vulnerable to a move towards the cloud support. This will be the case if the kijun-sen is broken downwards.
|
| Technical analysis of EUR/USD for April 06, 2022 Posted: 08 Apr 2022 09:48 AM PDT
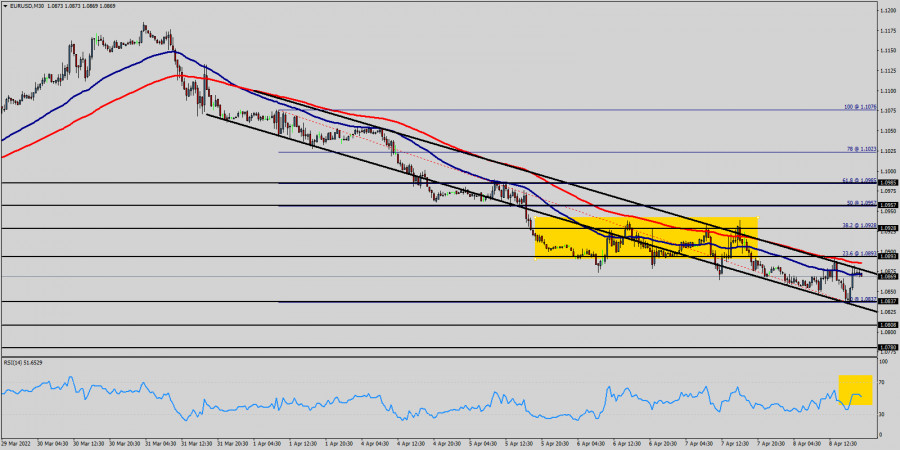
The EUR/USD pair continues to trend lower and extend continued recovery from a lower base at 1.0874. The EUR/USD pair will remain with bears while the action holds below key resistance level at 1.0893, but caution if the price approaches this level, as break higher would sideline bears on completion of daily failure swing pattern. Today, we note that the market opens below the level of 1.0893. Please, note that the resistance stands at the levels of 1.0893 and 1.0928 in the M30 time frame. In the longer term, the strong resistance at 1.0893 (- high, see also the long-term declining trendline since last week peak) continues to represent a major hurdle. Therefore, right now the first descending impulse is forming the first one; the market is being corrected from the area of 1.0893 and 1.0928 this week. In our opinion, the EUR/USD pair may grow up to test 1.0893 from below and then form the second descending impulse with a target at 1.0837 to test the daily support (weekly low -last bearish wave). If the trend is able to close below the level of 1.0893, the price will fall into the bearish market in order to go further towards the strong support at 1.0837 and 1.0808 to test them again. Furthermore, the level of 1.0837 will form a double bottom which represents the major support level this week. In the the daily time frame, the pair will probably go down because a downward trend is still strong and the RSI indicator is still signaling that the trend is downward. Conclusion
|
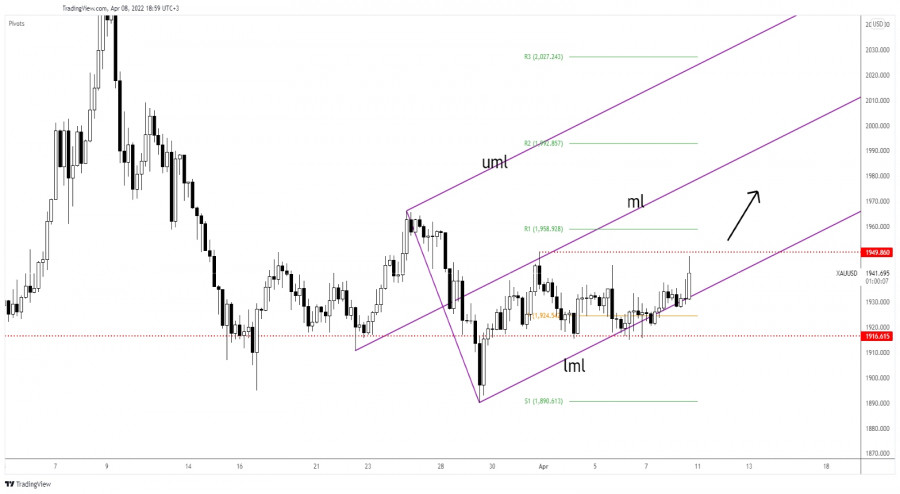
| Posted: 08 Apr 2022 09:35 AM PDT The price of gold rallied in the last hours as the Dollar Index has retreated. XAU/USD is trading at the 1,942 level at the time of writing below 1,948 today's high. In the short term, the yellow metal is moving sideways, that's why we still have to wait for a clear direction. Gold remains attractive for buyers despite the last downside movement as the inflationary pressure remains high. Also, the war in Ukraine is far from being over, so the global economy could suffer if this situation continues. Also, the US and UK are to release their inflation data next week, maybe this is the reason why the XAU/USD has started to move. Also, the RBNZ, ECB, and BOC could bring high volatility in the coming week. XAU/USD Range Movement!
XAU/USD found strong support on the 1,916 level and now is almost to hit 1,949 static resistance. Actually, in the short term, the price of gold is trapped between these levels. Gold could resume its growth as long as it stays within the ascending pitchfork's body. You can see that XAU/USD tested and retested the ascending pitchfork's lower median line (lml) which stands as a dynamic support. XAU/USD Forecast!Staying above the lower median line (lml) and making a valid breakout above the 1,949 obstacles could activate an upside continuation and could bring new long opportunities. The ascending pitchfork's median line (ml) is seen as a potential upside target. The material has been provided by InstaForex Company - www.instaforex.com |
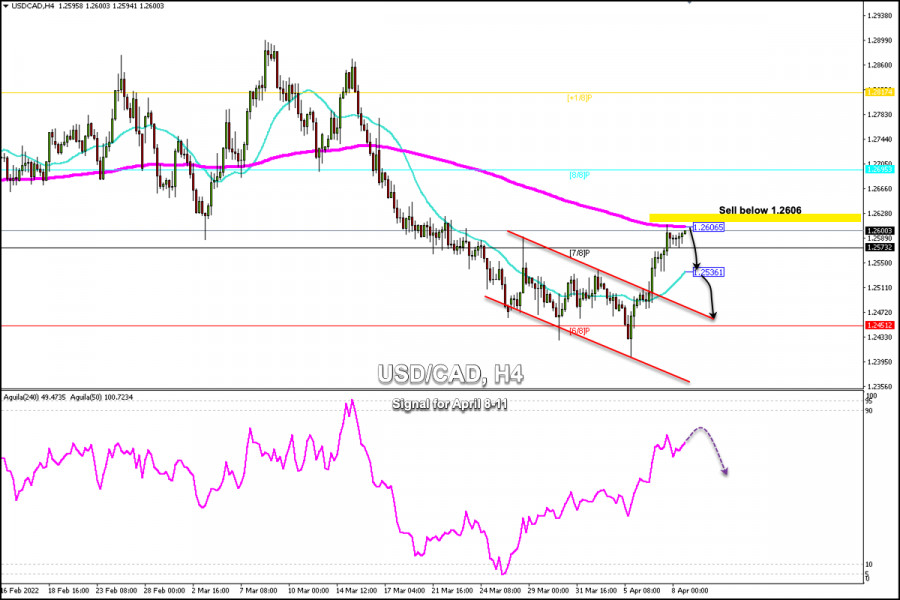
| Trading Signal for USD/CAD for April 08-11, 2021: sell below 1.2606 (200 EMA - overbought) Posted: 08 Apr 2022 09:31 AM PDT
USD/CAD is trading around 1.2600. The pair is expected to test the strength of the 200-period moving average around 1.2606. The aggressive statements from the FED have fueled the rally of USD/CAD from the low of 1.2401. In less than 3 days, the pair has gained over 200 pips. This is a sign of weakness for the Canadian dollar. USD/CAD could reach the psychological level of 1.3000 in the coming days. In the American session, USD/CAD seems determined to test the 200 EMA. The latest data on Canada's employment change was better than expected. This could favor the CAD correction and the price could fall towards the 21 SMA at 1.2536. The main driver to the firm USD and the weak CAD was because hawkish comments this week, especially from Fed Vice President Lael Brainard and James Bullard. Their remarks caused a rally in the USD/CAD pair. This trend is likely to continue next week. The Canadian dollar has also been affected and weak against the US dollar due to sliding global oil prices. The main driver for the fall was the recent announcements about oil reserve releases from EIA nations. The 4-hour technical chart shows that USD/CAD is showing overbought signs. Hence, a technical correction is possible towards the 21 SMA at 1.2536 or the top of the downtrend channel that was broken around 1.2451. This corrective move could invite the bulls and give them an opportunity to buy back the Canadian dollar around the psychological level of 1.25 or around 6/8 Murray at 1.2450. Our trading plan for the next few hours is only sell if the pair manages to stay below the 200 EMA located at 1.2606, with targets at 1.2536 (21 SMA) and 1.2460 (6/8). The eagle indicator is giving an overbought signal which could support our bearish strategy. The material has been provided by InstaForex Company - www.instaforex.com |
| Technical analysis of GBP/USD for April 06, 2022 Posted: 08 Apr 2022 09:29 AM PDT
The GBP/USD pair can still form an descending impulse, it continues to drop downwards. The major resistance level is seen at 1.3059 which coincides with the ratio of 61.8% Fibonacci. According to the main scenario, it may start forming correctional structures. Today, we foresee the price to move towards the level of 1.3030 and then reach a new minimum again around the price of 1.2981. Please, note that the strong support stands at the level of 1.2981. If the price breaks the level of 1.2981, we expect potential testing of 1.2961. The current descending structure implies that the market may reach the level of 1.2961. In this area, the trend is challenging a major support level. The descending impulse is strong enough to sell below the resistance level of 1.3059 .Therefore, the price is expected to reach a low once again. It is rather gainful to sell at 1.3059 with the targets at 1.2981 and 1.2961. So, it is recommended to place take profit at the price of 1.2961 as the first target today. On the contrary, stop loss should be placed at the price of 1.3079 (above the daily resistance). The bullish outlook remains the same as long as the RSI indicator is pointing to the upside on the M30 chart. The material has been provided by InstaForex Company - www.instaforex.com |
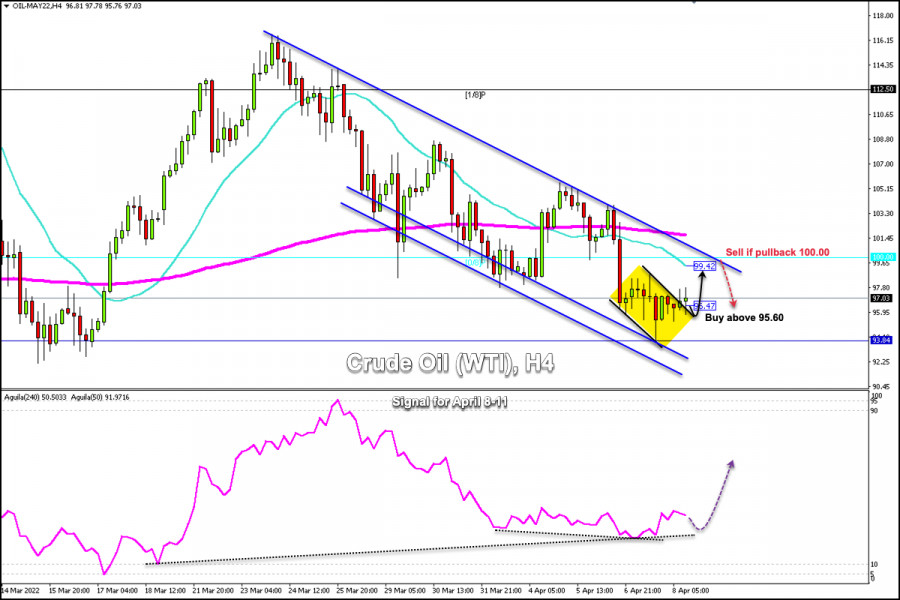
| Trading Signal for Crude Oil (WTI - #CL) for April 08-11, 2021: buy above $95.60 (downtrend channel) Posted: 08 Apr 2022 08:44 AM PDT
Barrel of WTI is trading at 97.03 with a slight technical rebound. Yesterday the price of Crude oil fell to $93.82, the lowest level since March 17. The drop in the price of crude oil (WTI-#CL) had occurred after the announcement by several nations about the use of their strategic reserves, in response to the rise in prices. Stocks are trading in oversold territory. With equity markets under pressure as a result of the announcement of monetary policy by FED, it could affect the strength of crude as there is some correlation. On the contrary, if the equity market in the American session recovers and makes a technical bounce, it could give some stability to crude oil and it could consolidate around 95.60 and could reach the psychological level of $100.00. According to the 4-hour chart, we can see that crude oil is consolidating and breaking a downtrend channel. The price could pull back to the support of this channel. We could have an opportunity to buy around 95.60. Our trading plan is to wait for crude oil to retrace towards the 95.60 area where the 61.8% Fibonacci level is located. We could have an opportunity to buy with targets at 99.42 (21 SMA). In case crude oil reaches the level of 99.42 (21 SMA) or 0/8 Murray around the psychological level of $100, we will have an opportunity to sell. Given that a downtrend channel is located at this level, as long as the price cannot break, we can sell with targets at 96.47 and 93.84. The eagle indicator is consolidating which is a positive sign for crude oil. Hence, a recovery could occur in the next few days. So, WTI can resume its overall uptrend. The material has been provided by InstaForex Company - www.instaforex.com |
| Posted: 08 Apr 2022 08:12 AM PDT The euro fell to another monthly low in pair with the US dollar, and the British pound again hung with its whole chest on the lower border of the side channel, which it has been since the end of March this year. Yesterday's statements by American politicians, as well as fairly strong data on the labor market, led to the strengthening of the US dollar.
The president of the Federal Reserve Bank of St. Louis, James Bullard, said during an interview that he supports a sharp increase in interest rates. This needs to be done to withstand the highest inflation in four decades. Bullard supported the projected increase of half a percent in May, as well as the beginning of the reduction of the Fed's bloated balance sheet. "I would like the rates to reach 3-3.25% in the second half of this year," Bullard told reporters after a speech at the University of Missouri. "We must act decisively to bring the interest rate to the right level, which will allow us to quickly cope with inflation." Let me remind you that last month the Fed raised rates by 25 basis points, to a target range of 0.25% to 0.5%. Bullard was the only dissenter in the vote and advocated raising the rate by half a point. At the moment, Fed officials expect to raise rates to 1.9% by the end of the year. The head of the St. Louis Fed also noted that he did not want to anticipate the May meeting and would consider new data before it began, but it is obvious that during the March meeting he was right when he insisted on a more significant increase in rates. The minutes of the meeting published on Wednesday showed that many officials agreed, but supported a smaller increase only out of caution in light of Russia's special operation in Ukraine. The protocols also showed that one or more increases of half a point at once may be appropriate in the near future. "It is absolutely clear that we need to raise the rate as soon as possible if we want to prevent a sharp slowdown and recession of the economy in the future, as well as stagflation," Bullard said. Bullard has previously stated that his forecast is the most hawkish in the committee, as his goal is a 3% rate for 2022. Statements by other Fed representatives - Charles Evans from Chicago and Rafael Bostic from Atlanta - also related to monetary policy, which supported the dollar. Evans, speaking at a conference on employment, said he would advocate changing rates to a neutral level, which, according to Fed officials, is about 2.4%. "This level should be reached by the end of 2022 or the beginning of 2023. A lot of what we're seeing are supply chain issues and they're going to go away soon," Evans said. The chairman of the Federal Reserve System, Jerome Powell, spoke about the same thing all last year. What did it lead to? To 8.0% inflation already now, not to mention what its peak value will be. Another Fed official, Bostic, said that he also favored raising rates to a neutral level, but it should be done in a balanced way - by analyzing new data and assessing uncertainty about future economic prospects.
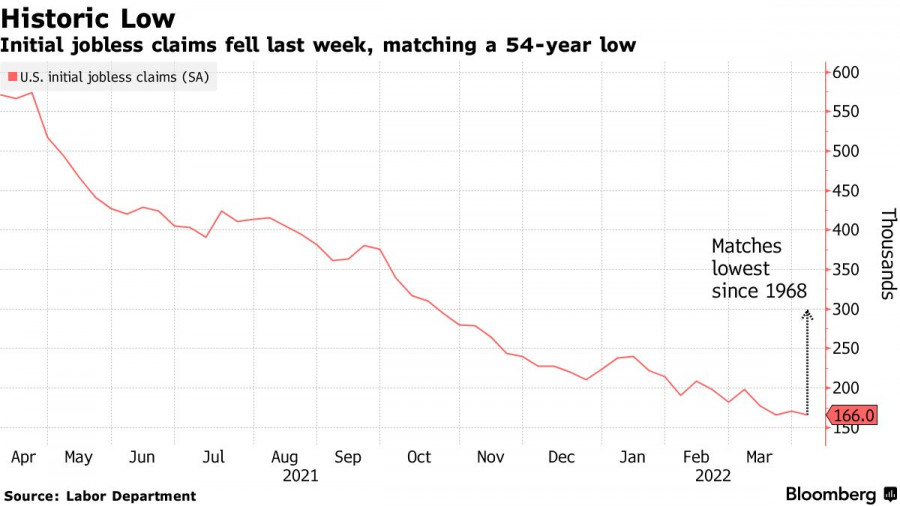
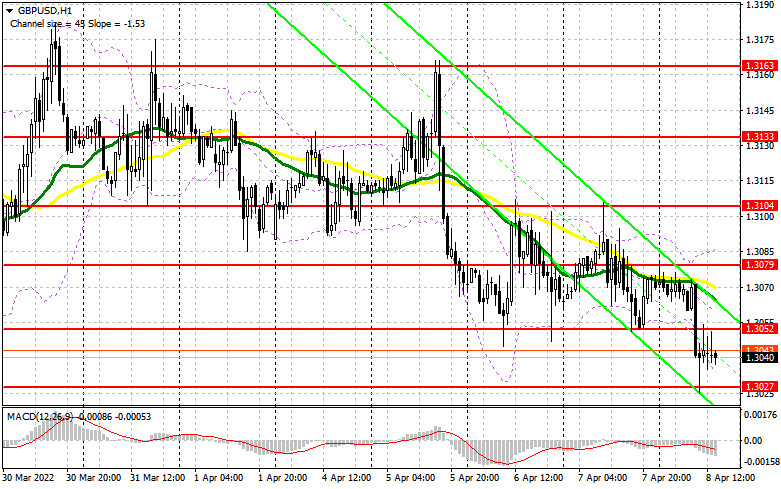
As for the fundamental statistics, which also provided fairly good support to the US dollar yesterday, weekly applications for unemployment benefits fell more than predicted. This indicates that employers are retaining workers in an increasingly tense labor market. According to the Ministry of Labor, initial applications for unemployment benefits fell by 5,000 to 166,000 in the week ended April 2. The level corresponds to the lowest in the last 54 years. The average estimate in the survey of economists is 200,000 applications. The reduction in the number of new applications is another sign of positive dynamics in the labor market. Weekly applications for unemployment benefits have been falling for most of this year after a sharp decline in the number of COVID-19 infections and steady consumer demand. As for the technical picture of the EURUSD pair The geopolitical tension around Russia and Ukraine has again grown to a rather serious level, as Kyiv is delaying negotiations. Given the aggressiveness of the Fed's policy, it is best to bet on further strengthening of the dollar. To return the market under their control, euro buyers need a break above 1.0900, which will allow them to build a correction to the highs: 1.0940 and 1.1010. In case of a decline in the trading instrument, buyers will be able to count on support around 1.0850. Its breakdown will quickly push the trading instrument to the lows of 1.0810 and 1.0770. As for the technical picture of the GBPUSD pair The pound remains in a wide side channel and for the bulls to continue to grow, they need to think about how to return the resistance to 1.3080. A break in this range will open the way to 1.3105 and then to 1.3140. If the bears achieve a breakdown of 1.3050 - the lower limit of the channel in which the pair has been since the end of March this year, you can safely catch the pound in the areas of 1.3000 and 1.2960. The material has been provided by InstaForex Company - www.instaforex.com |
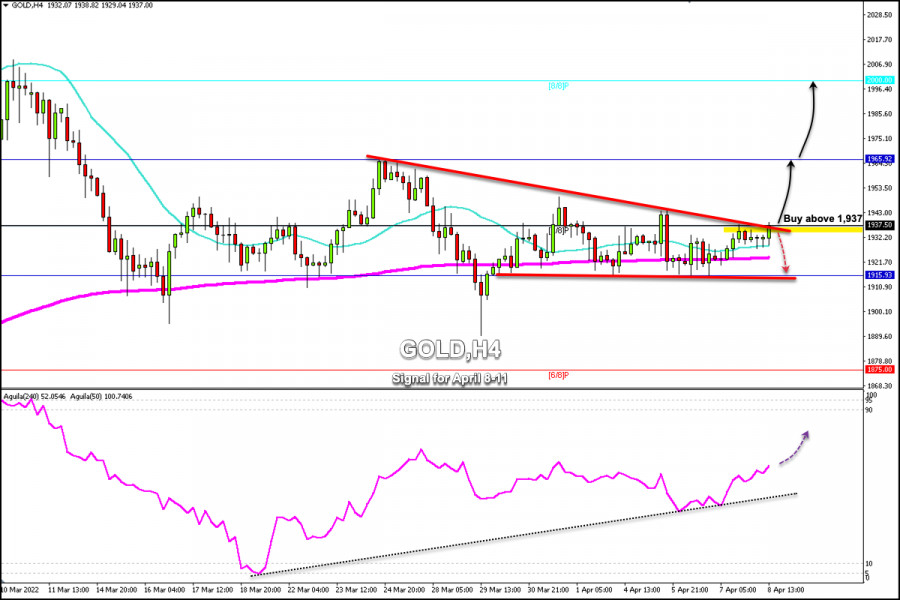
| Trading Signal for Gold (XAU/USD) for April 08-11, 2021: buy above $1,937 (downtrend - 7/8 Murray) Posted: 08 Apr 2022 07:35 AM PDT
Early in the American session, gold (XAU/USD) is trading around 1,935 approaching the top of the downtrend channel that has been formed since March 23. On the 4-hour chart, we can see that gold has been consolidating for several days now above the 200 EMA and above the 21 SMA. Gold has strong support at 1,915 and has repeatedly tested this level. The price has been bouncing to reach the zone of 1,937-1,945, forming a price range. Given that there have been several attempts to break the strong resistance of 1,937, a consolidation on the 4-hour chart above this area could accelerate the bullish movement. On codition of a daily close above 7/8 Murray (1,937), gold could reach the zone 1,965 and even the psychological level of 2,000 in the next few days. The United Nations voted to suspend Russia from the UN Human Rights Council, following allegations of atrocities committed by Russian soldiers during the war in Ukraine. The possibilities of a diplomatic solution to the conflict have diminished, due to the irreconcilable demands which weigh on the talks. The odds are that the attack will resume. Such fundamental factors could benefit gold that will once again be the haven asset for investors in view of the increasing fear and risk in the equity market. Our trading plan for the next few hours is to wait for a breakout and consolidation above 7/8 Murray around 1,937. A close on 4-hour charts above this level will be an opportunity to buy with targets at 1,950 and 1,965. The price could even hit the psychological level of 2,000 next week. The eagle indicator is giving a positive signal which supports our bullish strategy. The material has been provided by InstaForex Company - www.instaforex.com |
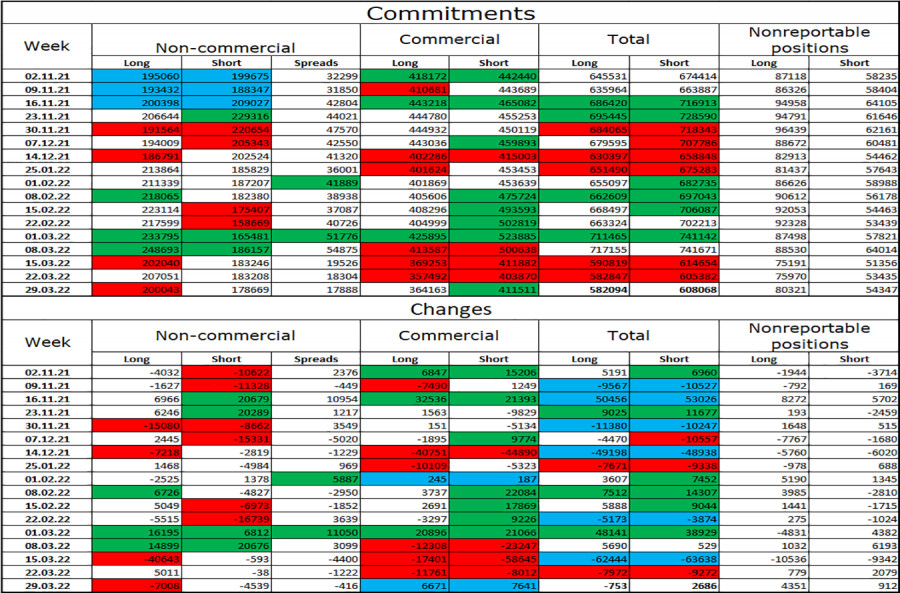
| Posted: 08 Apr 2022 07:11 AM PDT
The EUR/USD pair on Thursday and Friday continued the process of falling in the direction of the corrective level of 0.05 (1.0808) at a very slow pace. I want to note right away that during the entire current week, bull traders did not have enough strength even for one attack, thanks to which the euro currency would have shown growth. The euro has been falling for five days in a row, from time to time rolling back a maximum of 40-50 points. The rebound of quotes from the level of 1.0808 will allow us to count on a reversal in favor of the EU currency and some growth in the direction of the corrective level of 23.6% (1.0970). The consolidation of quotes at 1.0808 will allow us to expect a further fall in the euro currency. The information background this week was very weak. There was loud news, but they were mainly concerned with geopolitics and the Fed's monetary policy. It was after the statements of James Bullard, Mary Daly, and Lael Brainard that a new fall in the euro began, which is also the growth of the dollar. Let me remind you that all three members of the FOMC said that in May the rate could be raised by 0.5% at once, which traders have been waiting for a long time from the committee. There was also talk that the Fed could start unloading the balance sheet as early as May, although earlier it was said about the second half of the year. Well, the Fed minutes on Wednesday made it clear that the regulator's balance sheet can be unloaded at a rate of $ 95 billion per month. This is about as much as it has grown during the duration of the quantitative stimulus program, which has been working in recent years. That is, traders have received a tightening of the rhetoric not only of individual FOMC members but also of the entire organization as a whole. Therefore, the dollar received a new demand for itself, which led it to new growth. And there was no positive news for the European currency this week. Not a single speech by an ECB member, not a single important economic report - nothing. Even in those days when absolutely no information was received, traders at best suspended new sales of the pair. Bull traders are now simply refusing to work with the euro.
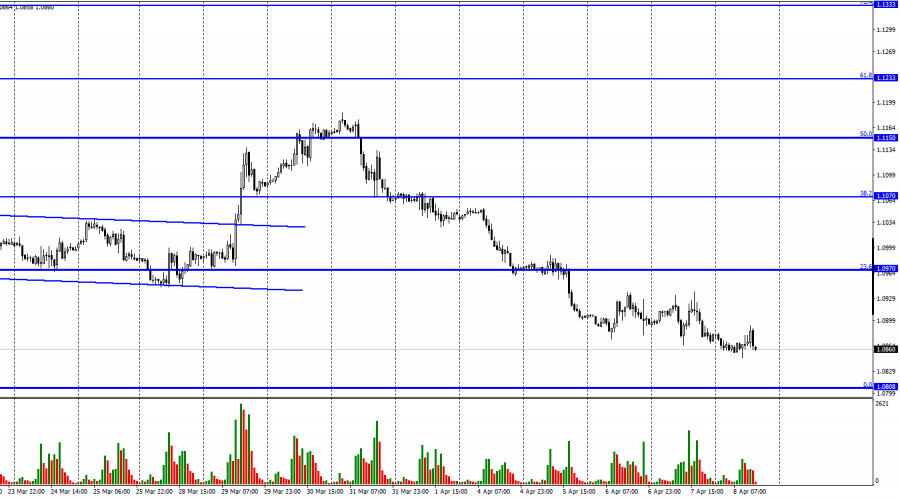
On the 4-hour chart, the pair performed a drop to the corrective level of 200.0% (1.0865). The rebound of the pair's exchange rate from this level will allow us to expect a reversal in favor of the European currency and some growth in the direction of the corrective level of 161.8% (1.1148). The consolidation of quotes below the level of 1.0865 will increase the likelihood of a further fall towards the next level of 1.0638. Brewing divergences are not observed in any indicator today. Commitments of Traders (COT) Report:
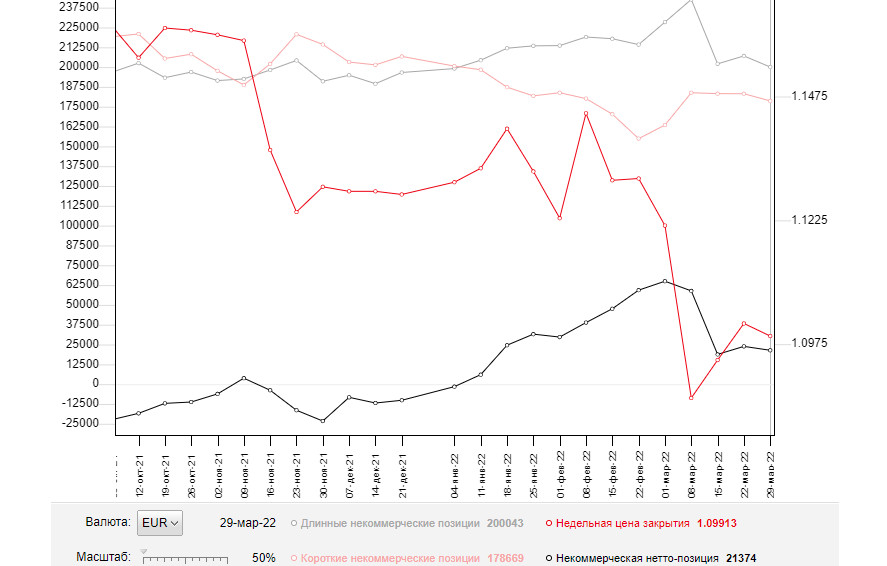
Last reporting week, speculators closed 7,008 long contracts and 4,539 short contracts. This means that the bullish mood of the major players has weakened slightly, but the changes are generally insignificant for the second week in a row. The total number of long contracts concentrated on their hands is now 200 thousand, and short contracts – 178 thousand. Thus, in general, the mood of the "Non-commercial" category of traders is characterized as "bullish". In this scenario, the European currency should show growth. And it would have shown, if not for the information background, which now supports only the dollar. We are now witnessing a situation where the bullish mood of major players persists, but the currency itself is falling. Thus, geopolitics is now a priority, and the worse things get in Ukraine, the more the euro currency will fall. News calendar for the USA and the European Union: On April 8, the calendars of economic events in the United States and the European Union do not contain a single interesting entry. The information background today will not have any effect on the mood of traders. EUR/USD forecast and recommendations to traders: I recommended selling the pair with a target of 1.0808 on the hourly chart if consolidation is made under 1.0970. Now they can be kept open. I recommend buying a pair if there is a rebound from the 1.0865 level on a 4-hour chart with targets of 1.0970 and 1.1070. The material has been provided by InstaForex Company - www.instaforex.com |
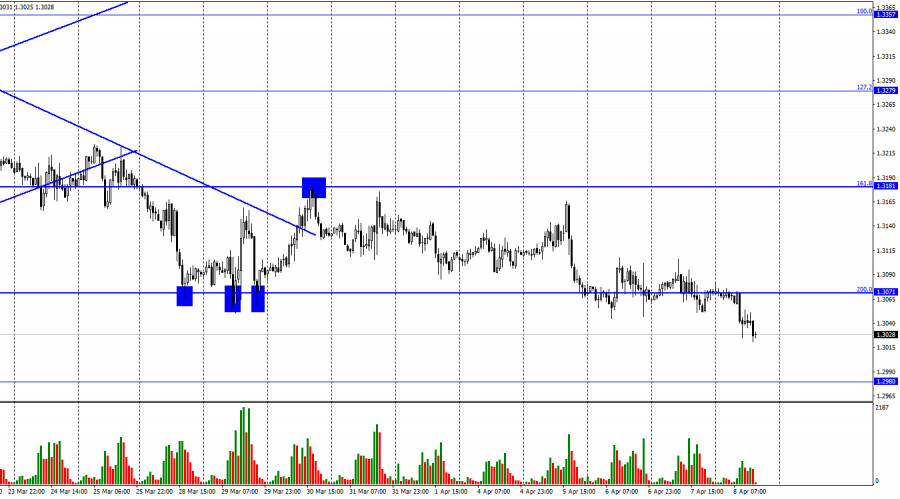
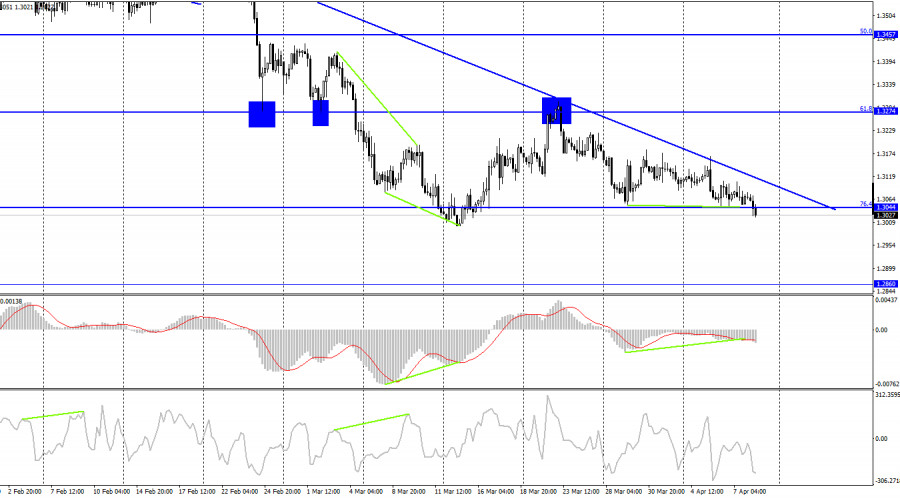
| Forecast for GBP/USD on April 8 Posted: 08 Apr 2022 06:54 AM PDT
According to the hourly chart, the GBP/USD pair continued the process of falling on Thursday and Friday and secured under the corrective level of 200.0% (1.3071). As a result, the process of falling continues now in the direction of the level of 1.2980. Or the 1.3000 level, near which bear traders retreated last time. The quotes of the British dollar very quickly resumed the process of falling after the last corrective to the level of 1.3279 and found no grounds for further purchases. I can't say that the British or the British economy looks frankly weak right now. UK GDP in the fourth quarter was higher than in the European Union. Inflation over the past month has grown less than in the European Union. The British economy is less dependent on the Ukrainian crisis and the Russian economy than the economy of the European Union. The Bank of England has raised the interest rate three times already and will do so at least once more this year, which is higher and more than even the Fed. Not to mention the ECB. Thus, I cannot say that all the factors are now against the Briton. Nevertheless, the pound shows no less strong decline than the same euro. I believe that traders are now paying more attention to geopolitics. And this week, all the events can be described with the following phrase: the intensification of the sanctions war between the West and Russia. The UK itself imposed new sanctions, which mainly concerned the freezing of assets of Russian oligarchs, but the countries of the European Union and the United States continue to take much tougher measures. However, the UK is not a separate, isolated country. One way or another, the military crisis, the food crisis, and the energy crisis affect it as well. Prices are rising for raw materials, oil, and gas, and this applies to Britain to the same extent as the European Union and America. In addition, in difficult times, traders prefer to deal with the most stable financial instruments and currencies. These primarily include the dollar. And this is the main reason for its growth over the past 5-6 weeks.
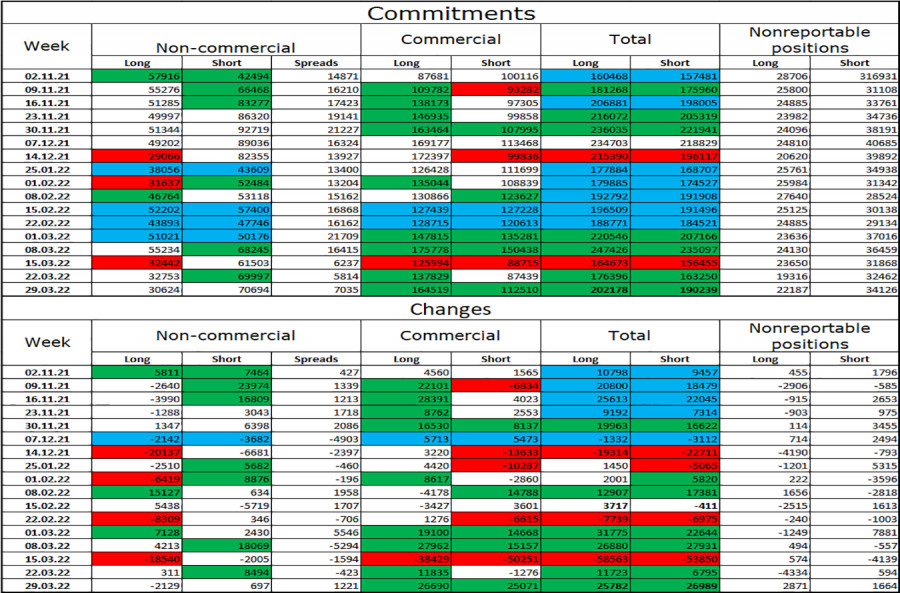
On the 4-hour chart, the pair performed a drop to the corrective level of 76.4% (1.3044). The rebound of quotes from this level will allow us to count on a reversal in favor of the British and some growth in the direction of the corrective level of 61.8% (1.3274). However, it is more likely that the pair will close below the level of 1.3044, which will allow it to continue the process of falling towards the level of 1.2860. The descending trend line characterizes the mood of traders as "bearish" and everything will remain above it until the pair closes. Commitments of Traders (COT) Report:
The mood of the "Non-commercial" category of traders has not changed much over the last reporting week. The number of long contracts in the hands of speculators decreased by 2,129, and the number of short contracts increased by 697. Thus, the general mood of the major players has become even more "bearish". The ratio between the number of long and short contracts for speculators already corresponds to the real state of things - longs are 2.5 times more than shorts. The British dollar is falling, and the big players are selling the pound more than buying it. Thus, I expect the pound to continue its decline. This forecast is based on geopolitics and based on COT reports. News calendar for the USA and the UK: On Friday, the calendars of economic events in the UK and the US do not contain a single important entry. There wasn't much geopolitical news today either. There is no influence of the information background on the mood of traders today. GBP/USD forecast and recommendations to traders: I now recommend selling the British dollar with targets of 1.2980 and 1.2895, if consolidation is performed below the level of 1.3044 on the 4-hour chart. I recommend buying the British when closing above the trend line on the 4-hour chart with targets of 1.3181 and 1.3274. The material has been provided by InstaForex Company - www.instaforex.com |
| EUR/USD: 1.0860 is key to development of downward trend Posted: 08 Apr 2022 06:24 AM PDT The bears of the euro-dollar pair today made another attempt to break through the support level of 1.0860, which corresponds to the lower line of the Bollinger Bands indicator on the D1 timeframe. For the further development of the downward trend, sellers need to overcome this target, although the downward dynamics is now quite unstable and cautious. And yet the fact remains that bearish sentiment prevails in the pair, as evidenced by the April 300-point price decline. In recent days, traders have started to play at shorter distances, fixing profits in the middle of the 8th figure, that is, near the above-mentioned Bollinger Bands line. Therefore, the bears are not able (so far) to break through the support level in order to go to the area of the annual minimum, that is, to the level of 1.0805. The fundamental background for the pair is in favor of further price reduction. On the dollar's side are geopolitics, the hawkish attitude of the Fed, key American macro indicators, and the yield of treasuries. All these factors strengthen the positions of dollar bulls, including in a pair with the euro, which continues to be under pressure.
In my opinion, in the medium term, EUR/USD bears will be able to break through the support level of 1.0860, opening the way to the bottom of the eighth figure. Recently, the pair has had too many "anchors" that do not allow buyers to organize a more or less large-scale counterattack. The last attempt, which was made last week (the price increase to the local high of 1.1185), ended in failure: on the same day, the bears seized the initiative and have been pulling the pair down since then, having already passed more than 300 points. The main index of personal consumption expenditures (the most monitored inflation indicator by the Federal Reserve) played the role of the trigger - it jumped to 5.4% year-on-year. This was followed by the nonfarm payrolls, which reflected a decrease in unemployment in the United States to 3.6% and an increase in the average hourly wage to 5.6 (y/y). This week, the Fed's hawkish protocol was published, the text of which also inspired dollar bulls. The document states that many members of the Federal Reserve during the meeting expressed the opinion that raising the rate by 50 basis points at once at one or more upcoming meetings "would be justified." The March meeting was held almost a month ago, but the hawkish mood among Fed members has only increased since then. This is evidenced by the rhetoric of many representatives of the Committee, who over the past two weeks have spoken in favor of a 50-point rate hike at the May meeting. And in general, many members of the American regulator are in favor of a more aggressive pace of tightening monetary policy this year. In particular, St. Louis Fed President James Bullard (who, by the way, has the right to vote in the Committee in 2022), said yesterday that the Central Bank's discount rate should be raised to 3.5%. In his opinion, only such rates will help to resist inflation. His colleagues – Chicago Fed President Charles Evans and Atlanta Fed President Raphael Bostic – indicated their intention to switch to neutral policy settings by the end of the year. Such hawkish signals strengthened the U.S. currency, which followed Treasury yields. For example, the 10-year yield hit 2.680% today, the highest since February 2019. The external fundamental background also contributes to the growth of the greenback. The protracted negotiation process between Russia and Ukraine and the absence of any optimistic messages from the negotiation field allow the safe dollar to feel quite comfortable in the main currency pairs. The sanctions confrontation between the EU, the U.S. and the Russian Federation, against the background of the impending energy crisis in the European region, only adds fuel to the fire, strengthening anti-risk sentiment. Another geopolitical hotspot is Taiwan. After the United States began to strengthen arms supplies to the island and send American politicians there with official visits, relations between Beijing and Washington deteriorated again. China was particularly sensitive to information that U.S. House of Representatives Speaker Nancy Pelosi is planning to visit Taiwan. Beijing warned that the visit would seriously violate the one-China principle and the provisions of the three Sino-US joint communiques. Beijing stressed that Pelosi's visit "would cause serious damage to China's sovereignty and territorial integrity, and strike at the political foundation of bilateral relations." Yesterday, there was information that the speaker of the lower house of Congress had contracted the coronavirus and, accordingly, will not be able to make the planned trip in the near future. But this fact does not negate the general problem that has formed on the China-Taiwan-US axis. Thus, short positions on the EUR/USD pair are still in priority: it is advisable to use any more or less large-scale corrective upward pullbacks as an excuse to enter sales. The first target is located in the area of 1.0860–1.0850 (the lower line of the Bollinger Bands indicator on the D1 timeframe). If the bears overcome this price barrier, they will open their way to the base of the 8th figure, that is, to the level of 1.0805. The material has been provided by InstaForex Company - www.instaforex.com |
| Posted: 08 Apr 2022 05:55 AM PDT
Gold is approaching the resistance level for the sixth time, which should eventually lead to its breakdown.
In this situation, traders should temporarily refuse to take short positions, at least before the breakdown of the level. They should consider long positions for the meantime, following this plan:
This trading idea is based on the Price Action and Stop Hunting strategies. Good luck and have a nice day! The material has been provided by InstaForex Company - www.instaforex.com |
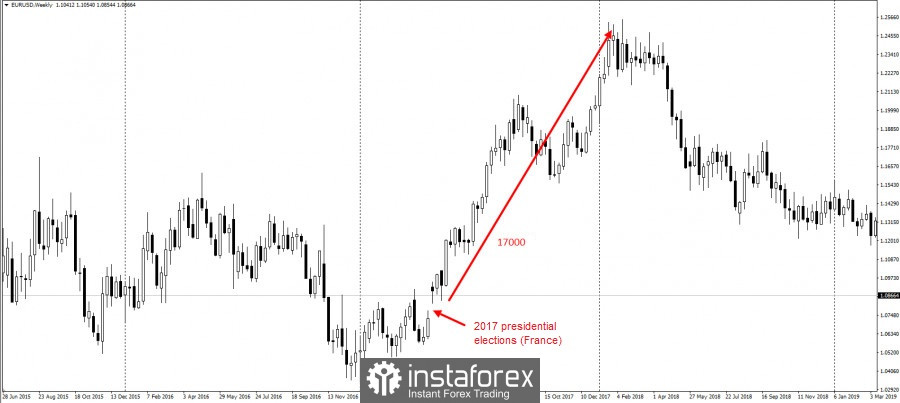
| Posted: 08 Apr 2022 05:50 AM PDT
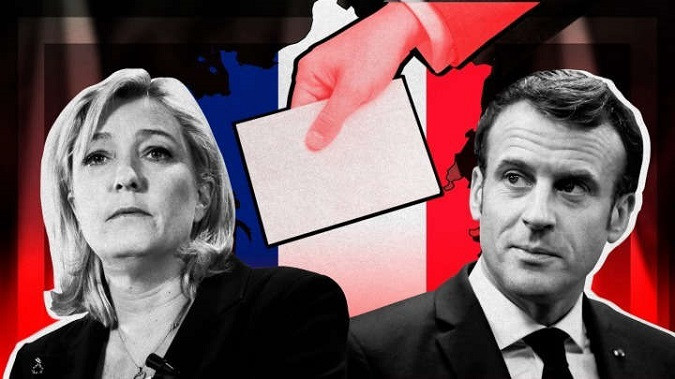
France will hold its presidential elections on April 10. The fight will be between the incumbent President Emmanuel Macron and the opposition represented by Marine Le Pen. At the last election, where Macron won, EUR/USD opened with a gap and made a year-long rally of as much as 17,000 pips.
As such, there are two zones of accumulation in the pair right now. The first one is the support-resistance level at 1.09445, while the second one is the yearly low at 1.08. Traders could prompt false breakouts at these levels.
Keep in mind that volumes should be reduced, and that traders should be careful when rolling over positions through the weekend because of possible increased volatility amid the results of the elections in France. The trading idea is based on the Price Action and Stop Hunting strategies. Good luck and have a nice day! The material has been provided by InstaForex Company - www.instaforex.com |
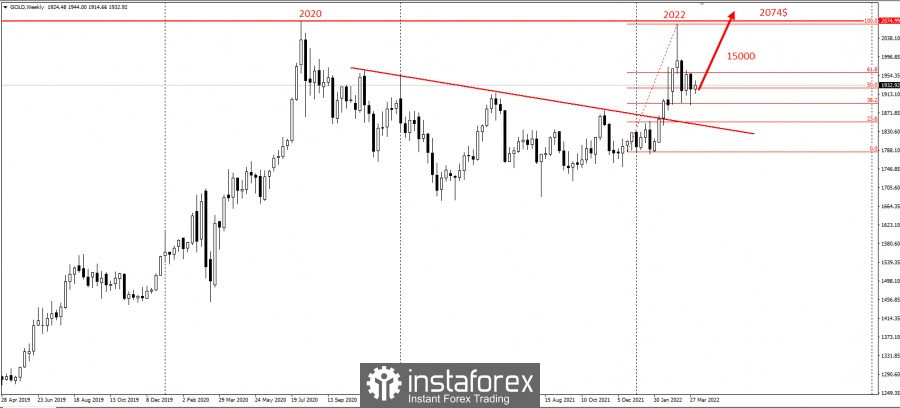
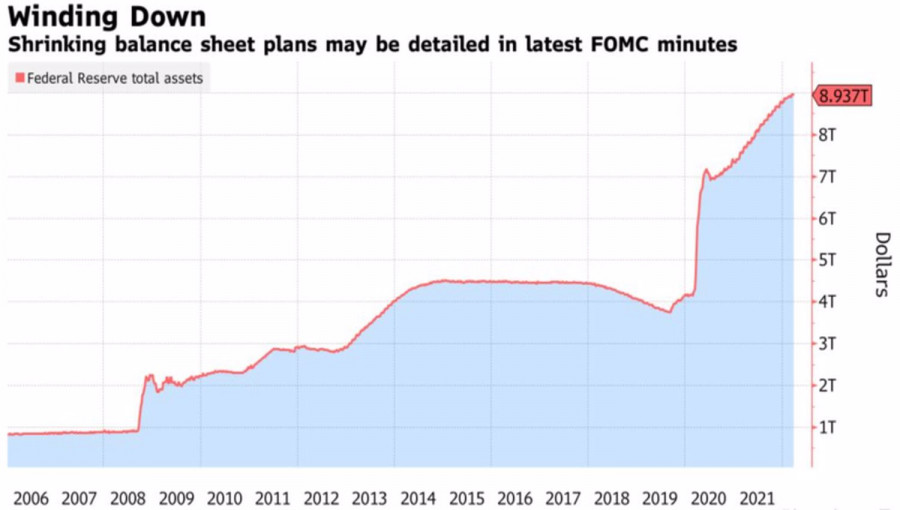
| Dollar shone with a new luster Posted: 08 Apr 2022 05:23 AM PDT At the end of March, there was a lot of talk on Forex that the U.S. dollar was running out of strength. They say that its main trump cards were won back. No matter how much FOMC officials talk about raising the federal funds rate by 50 basis points in May and about its rapid growth to a neutral level of 2.4-2.5%, this did not frighten the EURUSD bulls. Moreover, the negotiations between Russia and Ukraine gave rise to hopes for an early ceasefire in Eastern Europe. Unfortunately, the dialogue on the peaceful settlement of the armed conflict has stalled, the U.S. dollar has a new driver for growth, and the euro has been hit by political troubles. Investors still remember the taper tantrum of 2013, when, against the background of the unexpected collapse of the Fed's balance sheet, the debt market reacted with a surge in yields, dealing a serious blow to both stocks and assets of developing countries. In 2017-2019, the Fed decided not to rake over old coals and prepared investors for QT for a long time. Today, too, it cannot be said that the decision to reduce the scale of assets is some kind of surprise. Another thing is the speed at which it will go. Unlike the events of 5 years ago, when the Central Bank slowly increased the volume of bond sales from $10 billion to $50 billion per month, now the figure of $95 billion was immediately announced. Moreover, in history, about two years passed between the first increase in the federal funds rate and the beginning of the collapse of the balance sheet. Currently, the Fed is ready to reduce this period to two months! The market has smelled a repeat of the 2013 taper tantrum, should we be surprised by the rally in treasury bond yields and the dominance of the U.S. dollar? Dynamics of the Fed's balance sheet
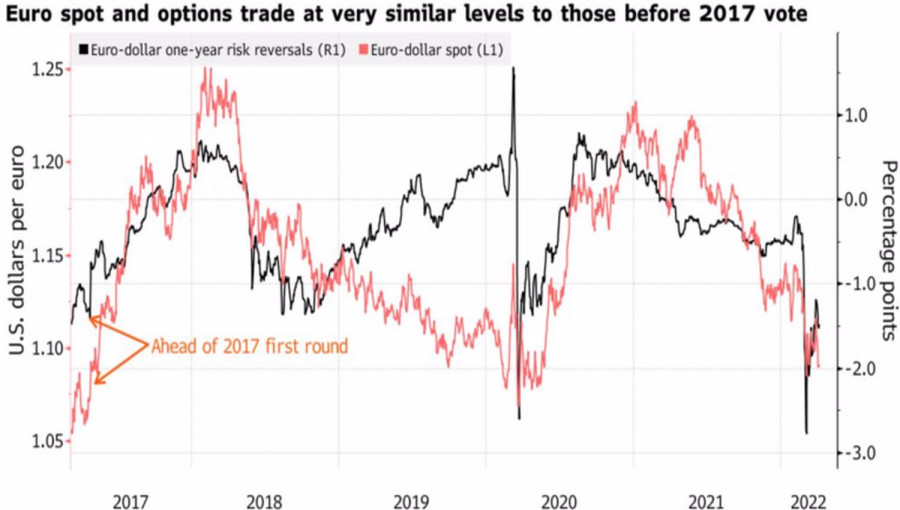
A new round of sanctions against Russia over war crimes in Ukraine has dealt another blow to the European economy. Its dependence on Moscow results in a break in ties, which negatively affects GDP. The EU's refusal to import coal from the Russian Federation may be the first sign. Investors do not rule out the accession of the European Union to the U.S. embargo on Russian oil, but that's a completely different story. At the same time, the presidential race in France exerts pressure on the position of the "bulls" on EURUSD. Opinion polls show that the current head of state Emmanuel Macron will win in the first round, but in the second he will face serious competition from opposition leader Marine Le Pen. And even if she no longer insists on abandoning the euro, she intends to slow down the processes of European integration in case of her victory. The reduction of the gap from 60% to 40% a month ago to 53% to 47% suggests that the fight will be hot. This forces investors to hedge the risks of euro subsidence. The dynamics of the euro and its reversal risks
The main economic event of the week by April 15 will be the release of data on U.S. inflation, which, according to Bloomberg experts, will continue to accelerate from 7.9% to 8.3%. This could potentially lead to an increase in bond yields and a strengthening of the US dollar. Technically, there is a transformation of the Shark pattern into 5-0 on the EURUSD daily chart. At the same time, pullbacks to the levels 1.093, 1.098, and 1.102 should be used for sales. EURUSD, Daily chart
|
| Trading plan for Silver for April 08, 2022 Posted: 08 Apr 2022 05:13 AM PDT
Technical outlook:Silver prices pushed marginally higher to $24.70 on Friday before easing lower again. The metal might still push toward $25.85 levels as discussed earlier, before resuming lower again. Bulls might remain inclined to hold prices above $24.00 levels to keep the momentum on the higher side for the next few trading sessions. Siver has been in a downtrend since $30.08 highs and is still expected to continue printing lower lows and lower highs going forward. The metal has carved a recent downswing between $28.75 and $21.50 levels as seen on the daily chart here. The same has been retraced by a counter trend rally towards $26.90 mark recently. Also note that Silver has reversed from a convergence of its one year old resistance trend line and fibonacci 0.618 retracement of the above downswing around $26.90. High probability remains that prices stay below that mark and continue lower towards $21.00 and further in the next several trading sessions. Trading plan:Potential rally to $25.85 against $24.00. Then lower. Good luck! The material has been provided by InstaForex Company - www.instaforex.com |
| Global markets stumble on more aggressive Fed policy Posted: 08 Apr 2022 05:12 AM PDT Global markets are still affected by the ongoing conflict in Ukraine. At the same time, it fell into another stress as Fed members called for a faster liquidation of the central bank's bond portfolio and move to a more energetic increase in interest rates. Of course, investors could not react to this news, which again led to sales on all significant trading floors without exception. Meanwhile, bond yields of economically strong countries rushed up, soaring to new local highs. Yield on 2-year bonds grew 2.5%, while 10-year bonds gained 2.66%. In the foreign exchange market, everything is extremely ambiguous. Major currency pairs, where the US dollar is present, traded indistinctly, reacting nervously to news over Ukraine and statements by Fed members about the need to more actively fight high inflation. By and large, the market is marked by sideways trading, but with intermittent sharp drops in prices. A similar picture can be seen in the commodity market as there is also high volatility and sharp price movements. Most likely, this scenario will continue next week because only by the end of the conflict in Ukraine will markets find balance again. Forecasts for today: EUR/USD may continue to decline to 1.0750 after breaking through 1.0830. AUD/USD is consolidating above 0.7465. Its fall below the level may cause a deeper drop to 0.7375.
|
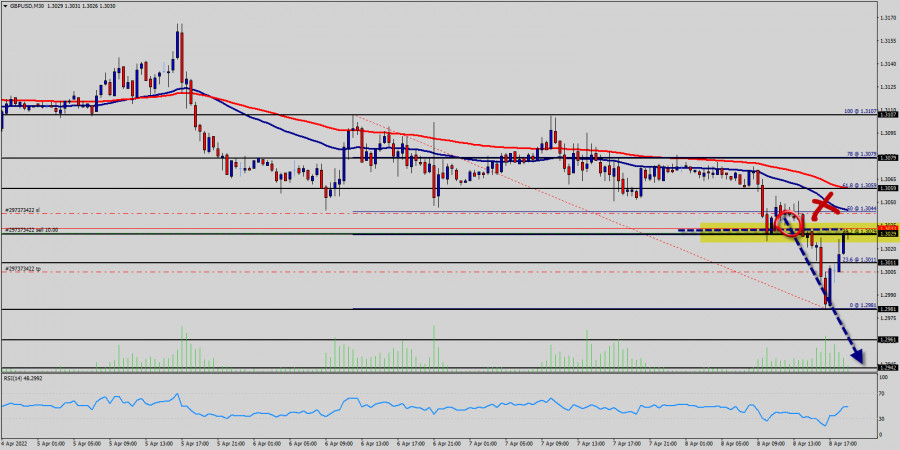
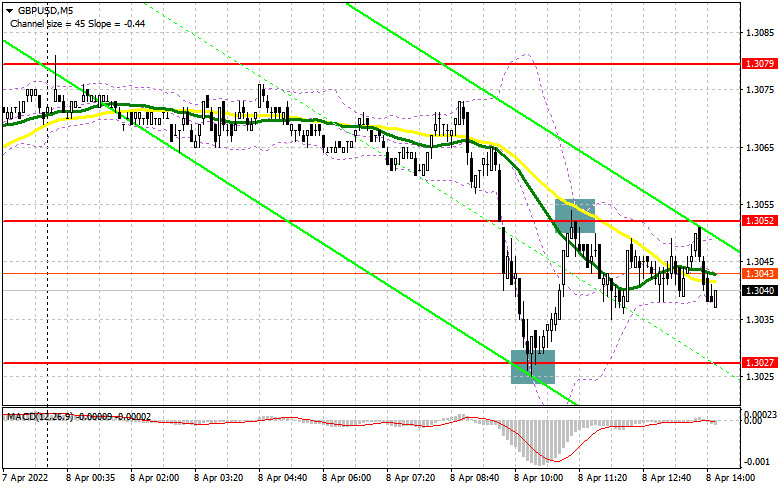
| Posted: 08 Apr 2022 05:06 AM PDT In the morning article, I highlighted the levels of 1.3052 and 1.3027 and recommended taking decisions with these levels in focus. Now let's look at the 5-minute chart and try to figure out what actually happened. The immediate breakout of 1.3052 occurred without an upward test. Therefore, I did not enter the market when the price declined from this level. I focused on 1.3027 as a false breakout enabled traders to open profitable long positions. As a result, the instrument returned to 1.3052, bringing speculators a 30 pip gain. A false breakout at 1.3052 will generate a sell signal. At the time of writing this article, the pound sterling took a nosedive from 1.3052, losing another 30 pips. It was testing again the support level of 1.3027. Bulls and bears will continue to tassel for this level today in the afternoon.
What is needed to open long positions on EUR/USD The bearish trend is back after the pound sterling has broken below the support level of 1.3050. It is hard to say how deep it may fall. Bulls made an attempt to defend 1.3027. For some time, the price remained at this level. However, a rebound to 1.3052 increased pressure on GBP. It indicates the presence of major market players. In the afternoon, traders should be very careful when opening long positions. Even though the US will not publish any crucial reports, save for wholesale inventories data which is of least importance, the pair may break out of the sideways channel. If so, it will sink significantly. The bulls have a chance to regain momentum only because it is the end of the week. Only another false breakout at 1.3027 will provide a buy signal, similar to the one I discussed above. In this case, the price may return to 1.3052 and test again this range. Investors will rush to close short positions. Thus, the pound sterling may again enter the sideways channel. It is very important for bulls to close the week above 1.3052. Otherwise, they will lose momentum. A breakout and a downward test of 1.3052 against the background of weak US data will give an additional entry point in long positions. As a result, the price may approach 1.3079. A more distant target will be the 1.3104 level where I recommend profit-taking. However, it will be quite difficult for the pair to reach this level in the current conditions. Only positive geopolitical news may help the pair return to the upper border of the sideways channel. If the pound/dollar pair declines to 1.3027 and bulls fail to protect this level, the price will fall to a new low of 1.3001. I would advise entering the market at this level only if there is a false breakout. It is also possible to open long positions against the trend immediately for a rebound from 1.2960 or even a lower low at 1.2911, keeping in mind an intraday correction of 30-35 pips. What is needed to open short positions on EUR/USD Bears are now dominating the market sentiment even if their control is mostly seen in intraday trading. However, the likelihood of a steep decrease persists. The primary task of sellers is to protect the resistance level of 1.3052. The moving averages are passing in the negative territory above this level. A false breakout at this level, similar to the one I mentioned above, will give another entry point into short positions. It will also boost the bear market. The pair is likely to dip to 1.3027. I assume that bulls will hardly be able to defend this level for the second time. This is why bears could easily push the price below this level. It will trigger an upward test. It will provide an additional sell signal and increase pressure on the pair, opening the way to 1.3001. Only a breakout and an upward test of this level may help demolish buyers' stop orders. It will be a signal to sell at a low of 1.2960, where I recommend profit-taking. If the pair rises during the US session and bears show no activity at 1.3052, it will significantly affect the pound sterling. However, it is better to postpone short positions until 1.3079. It is also recommended to open short positions at this level only in case of a false breakout. It is possible to sell GBP/USD immediately on a rebound from a high of 1.3104 or even a higher high of 1.3133, keeping in mind an intraday correction of 30-35 pips.
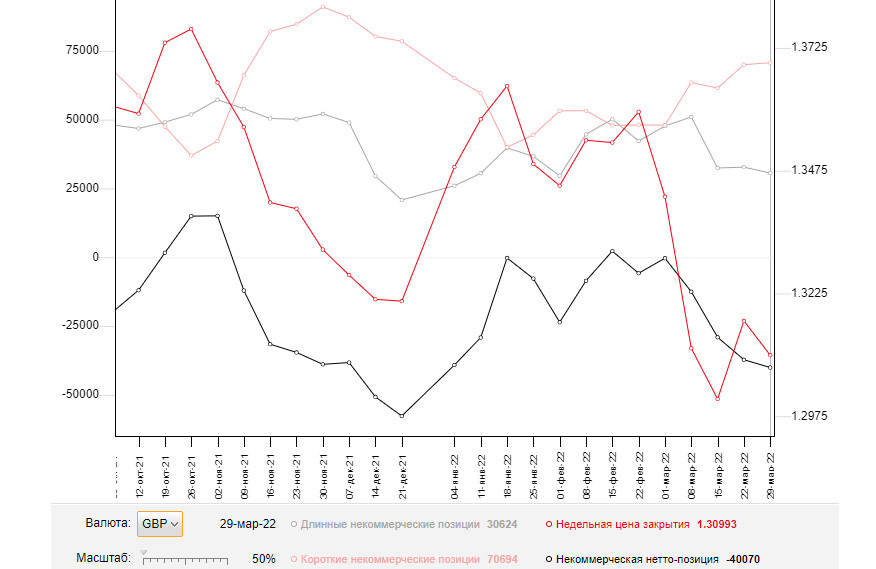
COT report The COT reports (Commitment of Traders) for March 29 logged an increase in short positions and a decrease in long ones. Bulls are losing momentum because of concerns about the resilience of the UK economy and the risks of high inflation. Analysts suppose that consumer prices may soar amid falling UK household incomes. They note that the situation will only worsen as inflation risks, which adversely affect the economy, are now quite difficult to assess. In addition, the dovish rhetoric of the BoE governor seems inappropriate. Traders refrain from opening long positions amid risk aversion. They expect a further increase in the interest rate. Bulls may take the upper hand provided that there will be positive news on the progress in negotiations between Russia and Ukraine. Do not forget about the aggressive policy of the Federal Reserve System, which continues to fuel demand for the US dollar amid significant risks of economic recession in the second half of the year. The COT report for March 29 revealed that the number of long non-commercial positions dropped to 30,624 from 32,753, while the number of short non-commercial positions jumped 70,694 from 69,997. It increased the negative value of the non-commercial net position from -37,244 to -40,070. The weekly closing price decreased to 1.3099 against 1.3169.
Signals of technical indicators Moving averages GBP/USD is trading below 30- and 50-period moving averages, indicating the bear market. Remark. The author is analyzing a period and prices of moving averages on the 1-hour chart. So, it differs from the common definition of classic daily moving averages on the daily chart. Bollinger Bands In case of a decline, 1.3020 will act as support. Definitions of technical indicators Moving average recognizes an ongoing trend through leveling out volatility and market noise. A 50-period moving average is plotted yellow on the chart. Moving average identifies an ongoing trend through leveling out volatility and market noise. A 30-period moving average is displayed as the green line. MACD indicator represents a relationship between two moving averages that is a ratio of Moving Average Convergence/Divergence. The MACD is calculated by subtracting the 26-period Exponential Moving Average (EMA) from the 12-period EMA. A 9-day EMA of the MACD called the "signal line". Bollinger Bands is a momentum indicator. The upper and lower bands are typically 2 standard deviations +/- from a 20-day simple moving average. Non-commercial traders - speculators such as retail traders, hedge funds and large institutions who use the futures market for speculative purposes and meet certain requirements. Non-commercial long positions represent the total long open position of non-commercial traders. Non-commercial short positions represent the total short open position of non-commercial traders. The overall non-commercial net position balance is the difference between short and long positions of non-commercial traders.The material has been provided by InstaForex Company - www.instaforex.com |
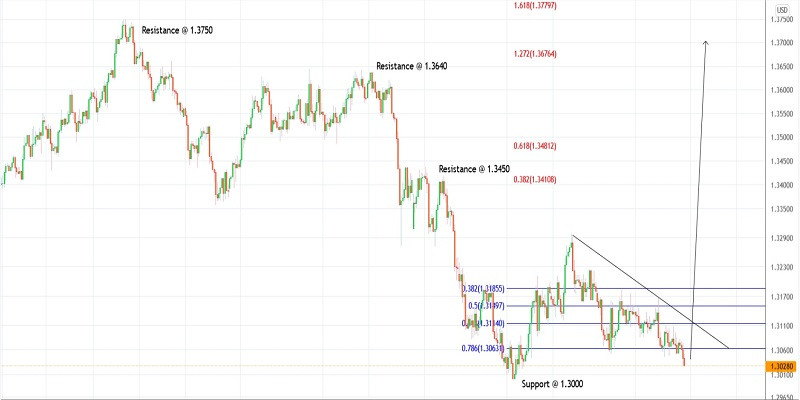
| Trading plan for GBPUSD for April 08, 2022 Posted: 08 Apr 2022 05:02 AM PDT
Technical outlook:GBPUSD has slipped to further lows around 1.3025 mark during the late European trading hours on Friday. The currency pair could find support ahead of 1.3000 levels and resume turn higher. Prices now need to break above 1.3100-10 levels to confirm that a higher low is in place around 1.3020-25. Bulls will be inclined to hold prices above 1.3000 mark going forward. GBPUSD had earlier rallied between 1.3000 and 1.3300 levels carving an upswing. Since then, prices have pulled back in a complex corrective structure toward 1.3020 mark. Furthermore, the currency has slipped below its fibonacci 0.786 retracement of the above bullish boundary. It is important for bulls to come back stronger now, to regain control. Immediate price resistance is now seen through 1.3100 mark and a break there will confirm that bulls are back in control. Also a break above the immediate down trend line will be encouraging for further bullish move going forward. If the above structure holds well, the next potential price targets are 1.3450 and 1.3750 levels respectively. Trading plan:Potential rally through 1.3450 against 1.3000. Good luck! The material has been provided by InstaForex Company - www.instaforex.com |
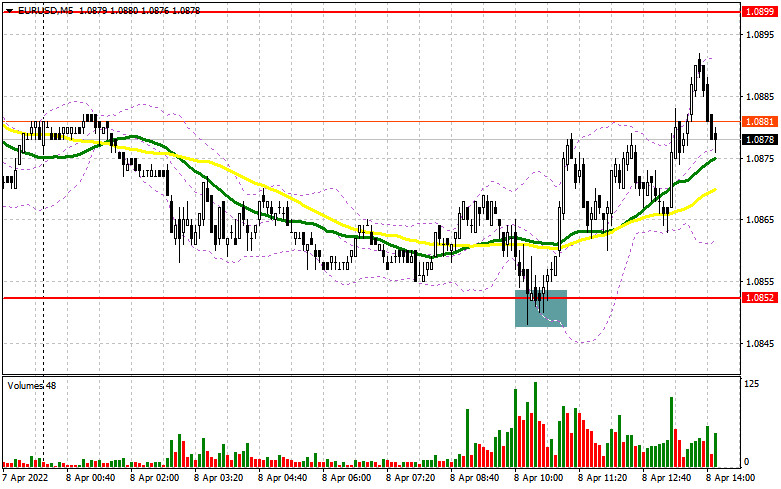
| Posted: 08 Apr 2022 05:00 AM PDT In my forecast this morning, I drew your attention to the level of 1.0852 and recommended entering the market from it. Let's have a look at the 5-minute chart and analyze what happened. An unsuccessful attempt to break through 1.0852, at the beginning of the European session, created a buy signal for the European currency. At the time of writing, the pair rose by more than 40 pips, but bulls did not reach 1.0899. Considering that the technical pattern has not changed in the afternoon, I think we should keep the trading plan unchanged.
Long positions on EUR/USD: Bulls are confidently holding the price above 1.0852. It seems that the buyers of risky assets are controlling the market. However, a larger upward correction in the second half of the day will help only profit-taking on short positions. The pair declined significantly from Monday's opening levels, and bears will not benefit from the stomping. Considering that only the Wholesale Inventories report is to be released during the US session, which is of no interest for traders, euro buyers can expect the pair to reach above 1.0899. Bulls need to hold the price above 1.0852, and only a false breakout at this level will form an entry point into long positions. As I mentioned earlier in the morning, the pair needs to grow and bulls should show some activity at 1.0899 to see a slowing of the downtrend. The moving averages, limiting the uptrend, pass through this level. A breakthrough and a top/bottom test of this level are likely to create an additional signal for opening long positions, which may allow the EUR/USD to recover to the area of 1.0936, above which it failed to break through yesterday. If the pair rises above this level, bulls may trigger bears' stop-loss orders, sending the pair to the highs of 1.0970 and 1.1007. With the pair falling and a lack of actions from bulls at 1.0852 and bears trying to fix the price near the weekly lows again in the afternoon, it is better to postpone opening longs. A false breakout of the low at 1.0810 might be the best buy scenario. You can also open long positions on a pullback from 1.0772, or even lower, near 1.0728, allowing an upward intraday correction of 30-35 pips. Short positions on EUR/USD: Bears failed to reach below 1.0852. However, it doesn't cancel their medium-term control over the market, so there is no particular reason to panic. Surely, profit-taking at the end of the week and the absence of strong fundamental statistics in the US might be the key factors, making bears act more passively, but it does not cancel the downtrend. Bears need to hold the price below the resistance at 1.0899, which the pair almost reached in the first half of the day. That's where the moving averages are located, which are playing on the sellers' side. So a false breakout at this level may bring back the pressure on the euro, and it might create a sell signal to continue sliding down to the new support at 1.0852. The pair should reach new daily swing lows to keep bearish momentum. If fresh US data appears to be strong, a breakout and a top/bottom reverse test of 1.0852 may form a sell signal, which is likely to open a direct way to the lows of 1.0810 and 1.0772, where traders can lock in profits. If the euro grows in the second half of the day, only the formation of a false breakout at 1.0899 can give the first sell signal. However, if bears show weak activity at this level, nothing bad will happen. A strong upward movement of the euro is expected only if there is positive news on the negotiations between Russia and Ukraine, which are unlikely to be released in the nearest future. Short positions at a false breakout near 1.0936 would be the best scenario. It is possible to sell the pair immediately on a rebound from 1.0970, or higher near 1.1007, allowing a downward correction of 25-30 pips.
The COT (Commitment of Traders) report for March 29 showed a decrease in both short and long positions. Notably, there were more buyers than sellers from those who left the market. It indicates pessimism among market participants caused by the current geopolitical situation. Meanwhile, the ECB sees a risk of higher inflation in the eurozone as the main problem because inflation has already jumped to 7.5%. Last week, Christine Lagarde flagged that the regulator would taper the QE program and raise the key interest rate more aggressively. Against this background, the euro has a good mid-term prospect for growth. Today, it is significantly oversold against the US dollar. However, the lack of positive changes in the negotiations between Russia and Ukraine and growing geopolitical tensions have a negative impact on the euro. The economic problems in the eurozone amid high inflation and Russia's retaliatory sanctions (including the payment for gas in rubles) will continue to put pressure on the euro in the short term. Therefore, traders will hardly see a considerable increase in the pair. According to the COT report, the number of long non-commercial positions dropped to 200,043 from 207,051. At the same time, the number of short non-commercial positions decreased to 178,669 from 183,208. Since a drop in the number of short positions turned out to be more significant, the overall non-commercial net position fell to 21,374 from 23,843. The weekly close price also dwindled to 1.0991 from 1.1016. Indicators' description Moving averages The pair is trading below 30- and 50-period moving averages, indicating that the euro may continue its downward movement. Note. The author is analyzing the period and prices of moving averages on the 1-hour chart. So, it differs from the common definition of classic daily moving averages on the daily chart. Bollinger Bands In the case of growth, the upper boundary of the indicator around 1.0890 will act as resistance. If the indicator breaks through its lower boundary at 1.0852, it will lead to a larger decline. Definitions of technical indicators
|


| You are subscribed to email updates from Forex analysis review. To stop receiving these emails, you may unsubscribe now. | Email delivery powered by Google |
| Google, 1600 Amphitheatre Parkway, Mountain View, CA 94043, United States | |


Comments