Forex analysis review
Forex analysis review |
- How to trade the EUR/USD currency pair on April 6? Simple tips and analysis of deals for beginners.
- Technical analysis of EUR/USD for April 05, 2022
- Technical analysis of GBP/USD for April 05, 2022
- Trading Signal for Nasdaq-100 (#NDX) for April 05-06, 2021: sell below 15.099 (21 SMA - 4/8 Murray)
- Is the pound more attractive than the euro?
- Bitcoin: two reasons why the share of retail holders of cryptocurrencies is increasing in the market
- GBP/USD analysis on April 5. The UK is increasing pressure on the Russian Federation.
- Trading Signal for GBP/USD for April 05-06, 2021: buy above 1.3120 (21 SMA - 200 EMA)
- Trading Signal for Gold (XAU/USD) for April 05-06, 2021: buy above $1,930 ( 200 EMA - 21 SMA)
- EUR/USD analysis for April 05, 2022 - Strong selling pressure and potential for bgger drop
- EUR/USD analysis on April 5. An important point for the European currency
- Bitcoin falls in early April and altcoins steadily grow
- The main Asian indices show a slight increase in today's trading
- AUD/USD: RBA announces hawkish stance
- Weekly USDCAD analysis.
- US premarket on April 5: US stock market rallies due to tech sector
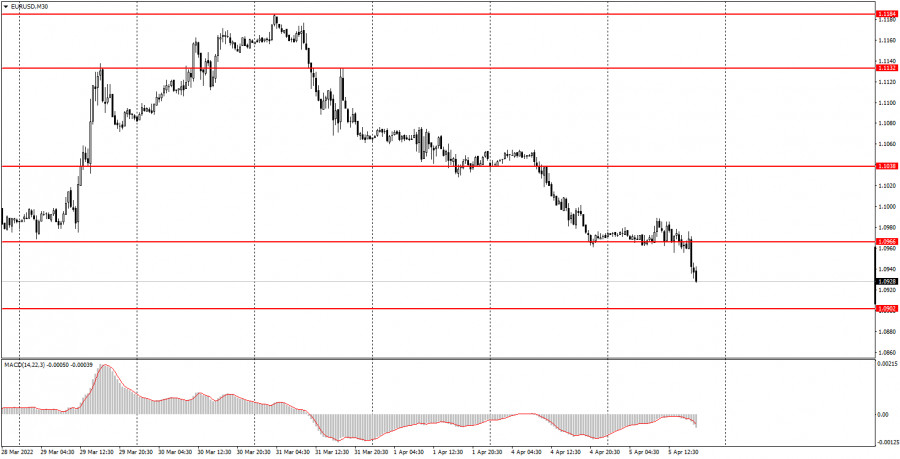
| How to trade the EUR/USD currency pair on April 6? Simple tips and analysis of deals for beginners. Posted: 05 Apr 2022 10:27 AM PDT Analysis of Tuesday's deals: 30M chart of the EUR/USD pair.
The EUR/USD currency pair traded badly for most of the day on Tuesday. Throughout the Asian and European sessions, the pair moved exclusively sideways with minimal volatility. The morning business activity indices in the European Union did not affect the pair's movement. Nevertheless, the European currency resumed its decline in the afternoon, which was unlikely to be associated with the publication of macroeconomic reports in the United States. Because there was only one report worth paying attention to today - the ISM business activity index in the service sector. At the end of March, it increased by 1.8 points and amounted to 58.3. Not too much difference from February. Therefore, we believe that it was not the reason for the new strengthening of the US currency. But the introduction of a new package of sanctions against Russia by the European Union, including a ban on entering European ports for Russian ships, disconnecting several more banks from SWIFT, and banning the import of Russian coal, could well provoke a new fall in the euro, as these sanctions will also hit the European economy. Relations between the Russian Federation and the EU continue to deteriorate, and the geopolitical conflict in Ukraine remains in a state of hostilities. All this does not contribute to the growth of the euro. 5M chart of the EUR/USD pair. On the 5-minute timeframe, the movement on Tuesday was very eloquent. For two-thirds of the day, the pair traded between the levels of 1.0966 and 1.0989. That is, in a very narrow side channel. At the same time, a lot of trading signals were formed, which, by and large, can be considered false. Only the first and second signals led to the development of the nearest target level, which was located 20 points away. All other signals did not even provoke such a movement and were extremely inaccurate and ambiguous. Nevertheless, the first signal from the level of 1.0966 and the second signal from the level of 1.0989 could be tried to work out, since at that time it was still not obvious that the pair was flat. However, there is also one problem. The level of 1.0989 is the maximum of today, so it did not participate in the auction. Therefore, we have the following picture - all the trading signals of the day were formed around the level of 1.0966 and none led to the working out of the nearest target. At the first two buy signals, the price went up 15 points, which was enough to place a Stop Loss order at breakeven. It was on this order that both deals were eventually closed. All subsequent signals should not have been worked out. Only the most recent signal near the level of 1.0945 could be worked out by a short position, and it could bring about 10-15 points of profit. How to trade on Wednesday: A new downward trend has been formed in the 30-minute timeframe, but it is impossible to form a channel or a trend line now since at least two reference points are missing. Thus, there is a downward trend, but there is no trend line. Nevertheless, the European currency may continue to fall, at least to its local lows, which are now near the levels of 1.0902 and 1.0806. On the 5-minute TF tomorrow, it is recommended to trade by levels 1.0806, 1.0902, 1.0945, 1.0966, 1.0989, and 1.1038. When passing 15 points in the right direction, you should set the Stop Loss to breakeven. There will be no important events or reports in the European Union on Wednesday. In the USA - late in the evening the publication of the minutes of the Fed's last meeting. In any case, it will not affect novice traders, since by that time they will have to leave the market. Basic rules of the trading system: 1) The signal strength is calculated by the time it took to generate the signal (rebound or overcoming the level). The less time it took, the stronger the signal. 2) If two or more trades were opened near a certain level on false signals, then all subsequent signals from this level should be ignored. 3) In a flat, any pair can form a lot of false signals or not form them at all. But in any case, at the first signs of a flat, it is better to stop trading. 4) Trade transactions are opened in the period between the beginning of the European session and the middle of the American session when all transactions must be closed manually. 5) On a 30-minute TF, signals from the MACD indicator can be traded only if there is good volatility and a trend, which is confirmed by a trend line or a trend channel. 6) If two levels are located too close to each other (from 5 to 15 points), then they should be considered as a support or resistance area. What's on the charts: Price support and resistance levels - the levels that are the targets when opening purchases or sales. Take Profit levels can be placed near them. Red lines - channels or trend lines that display the current trend and show in which direction it is preferable to trade now. MACD indicator (14,22,3) is a histogram and a signal line - an auxiliary indicator that can also be used as a signal source. Important speeches and reports (always contained in the news calendar) can greatly influence the movement of a currency pair. Therefore, during their exit, it is recommended to trade as carefully as possible or exit the market to avoid a sharp price reversal against the previous movement. Forex beginners should remember that every trade cannot be profitable. The development of a clear strategy and money management are the keys to success in trading over a long period. The material has been provided by InstaForex Company - www.instaforex.com |
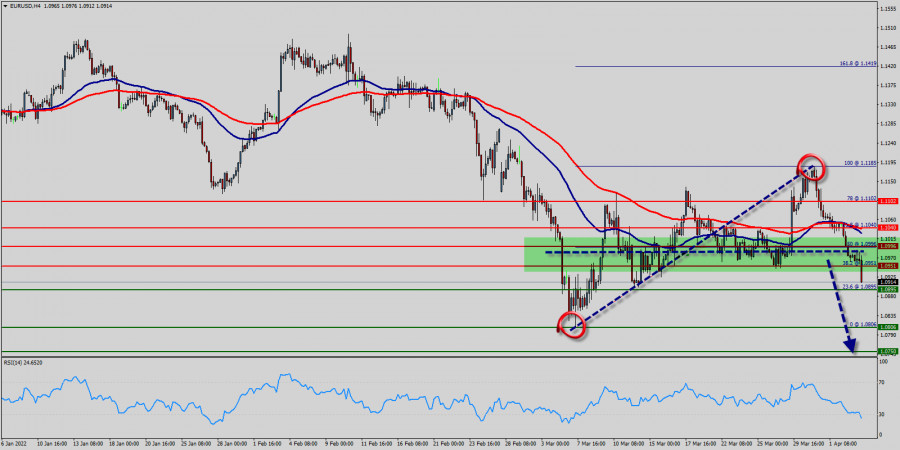
| Technical analysis of EUR/USD for April 05, 2022 Posted: 05 Apr 2022 10:06 AM PDT Overview : The EUR/USD pair steadied below MA 100 and MA 50 on the H4 chart. Yesterday the EUR/USD pair traded lower and closed the day in the red around 1.0951. Today it was trading in a narrow range of 1.0996 - 1.0806, staying close to yesterday's closing price. The EUR/USD pair broke through and fixed below the moving average line MA (100) H1 (50). Moreover, the RSI is still signaling that the trend is downward as it remains strong below the moving average (100), (50). Furthermore, the price has been set below the strong resistance at the level of 1.0996, which coincides with the 50% Fibonacci retracement level. This resistance has been rejected several times confirming the downtrend. Additionally, the RSI starts signaling a downward trend. The situation is similar on the four-hour chart. Based on the foregoing, it is probably worth sticking to the south direction in trading, and while the EUR/USD pair remains below MA 100 H1, it may be necessary to look for entry points to sell for the formation of a correction. As a result, if the GBP/USD pair is able to break out the first support at 1.0895, the market will decline further to 1.0806 in order to test the weekly support 2. In the H4 time frame, the pair will probably go down because the downtrend is still strong. However, probably, the main scenario is continued decline towards 1.0806 (last month low). Consequently, the market is likely to show signs of a bearish trend. So, it will be good to sell below the level of 1.0895 with the first target at 1.0806 and further to 1.0750. Alternative scenario is consolidation above MA 100 H4, followed by a rise to $1.1103.
|
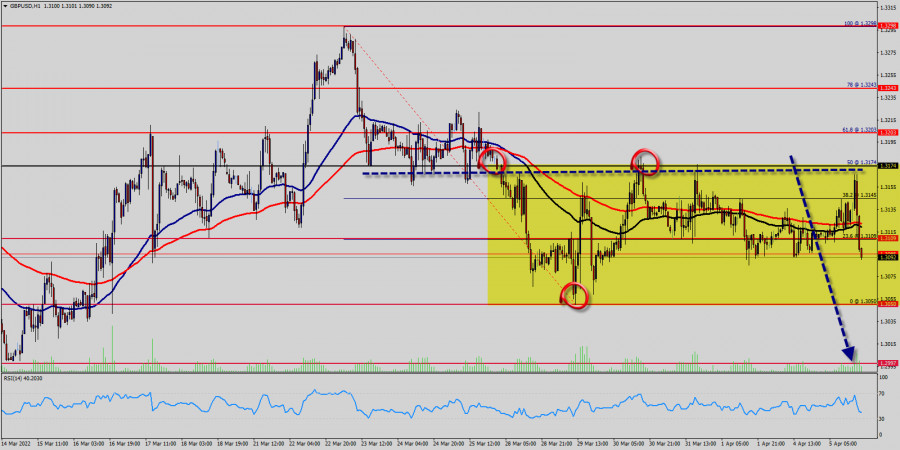
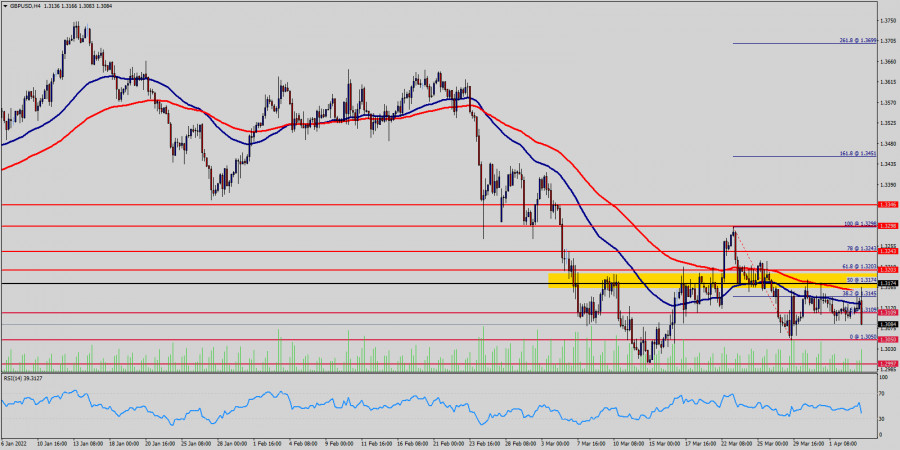
| Technical analysis of GBP/USD for April 05, 2022 Posted: 05 Apr 2022 09:53 AM PDT Overview : The Pound against US dollar has gone back and forth during the course of the week again, testing the 1.3109 support level. If it were to break below the 1.3109 level, then it is very likely that the US dollar will continue to strengthen against the Pound. Today, the GBP/USD pair is trading in the range of 1.3109 - 1.2997 about a weekly low. On the hourly chart, the pair fell below the moving average line MA (50) H1 (1.3109) and on the four-hour chart - below MA (100) H4 (1.3174). Technically speaking, the support of 1.3050 can keep prices from further decline. The upper limit of 1.3174 represents the main resistance level. The most likely range of the pair's movement for today may be hidden within the range of 1.3109-1.3050 (small range) On a break below the candlestick (1.3109 support 1) from the previous week, then it is likely that the market will go looking towards the 1.3050 level, which was the most recent low. The GBP/USD pair certainly has been in a strong channel for quite some time, and therefore it is likely that it will eventually find its way towards the 1.3050 level. Moreover, if it breaks down below the candlestick for the week, then the market may very well go looking towards the 1.2997 level.
Today, the first support level is seen at 1.3050 , and the price is moving in a bearish channel now. Furthermore, the price has been set below the strong resistance at the level of 1.3174, which coincides with the 50% Fibonacci retracement level. This resistance has been rejected several times confirming the downtrend. Additionally, the RSI starts signaling a downward trend. As a result, if the GBP/USD pair is able to break out the first support at 1.3050, the market will decline further to 1.2997 in order to test the weekly support 2. In the H4 time frame, the pair will probably go down because the downtrend is still strong. Consequently, the market is likely to show signs of a bearish trend. So, it will be good to sell below the level of 1.3174 with the first target at 1.3050 and further to 1.2997. At the same time, the breakup of 1.3174 will allow the pair to go further up to the levels of 1.3298 in order to retest the weekly top again.
|
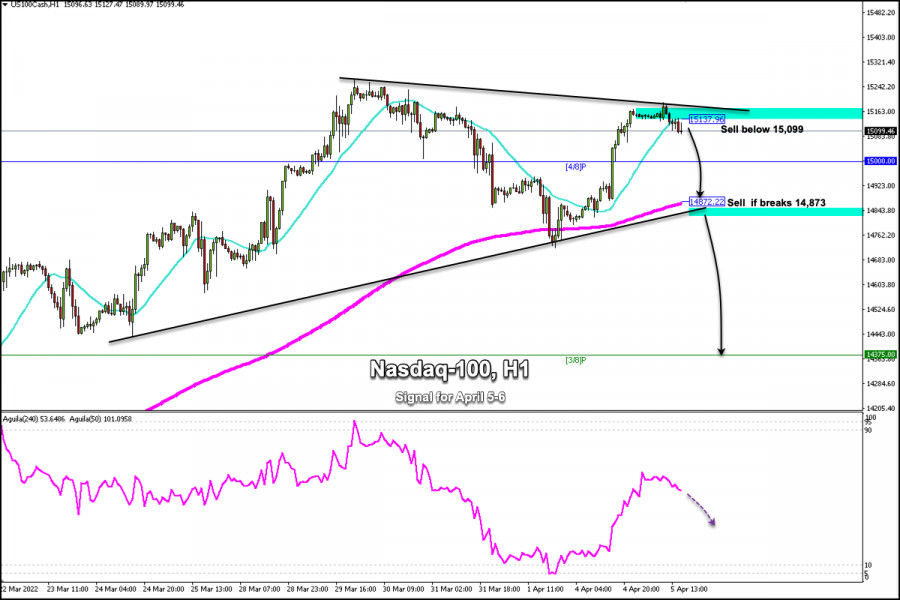
| Trading Signal for Nasdaq-100 (#NDX) for April 05-06, 2021: sell below 15.099 (21 SMA - 4/8 Murray) Posted: 05 Apr 2022 09:13 AM PDT
The Nasdaq-100 Tech Index (#NDX) is trading below the 21 SMA located at 15,137. After a slight technical bounce above the 200 EMA, it has come under bearish pressure again. The index is likely to make a correction towards the 200 EMA located at 14,873 in the next few hours. In the last few trading hours in Europe, we saw a sharp drop in stocks and in major indices. This is a negative sign. Wall Street is likely to trade in the red during the North American session. Rising fears over sanctions to be imposed on Russia due to the attack on civilians this weekend could weigh on the strength of the tech index. This news could dent positive market sentiment and risk appetite, so investors will return to safe haven assets such as gold and the US dollar. On the 4-hour chart, the Nasdaq-100 is showing an overbought signal and we expect a technical correcrtion below 4/8 Murray around the psychological level of 15,000 points. In case of the technicla correction below this level, the index could reach the area 3/8 Murray at 14,375 in the next few hours. Our trading plan for the next few hours is to sell below the 21 SMA located at 15,137, or at current price levels at 15,099, with targets at 14,873. If bearish pressure prevails, the index could hit 14,375. The material has been provided by InstaForex Company - www.instaforex.com |
| Is the pound more attractive than the euro? Posted: 05 Apr 2022 09:12 AM PDT
The dollar started this week with a combative attitude, however, paired with the British pound, it is not able to win a clear victory. The GBP/USD pair had no difficulties holding positions above the 1.3100 mark. The euro, paired with sterling, noticeably sank at the auction on Monday and today does not promise to recapture its lost positions. The weakness of the single European currency against the British indicates that the pound is now regarded by the bidders as a safer asset since the economic prospects of the UK are seen in the current situation much more positive than the countries of the euro region. A significant slowdown in economic growth and the expected further recession in the eurozone, provoked by the introduction of tough sanctions against Russia, are very obvious. The euro has become hostage to the decisions of the political elites of its region, therefore, further steps of its growth are unlikely to be decisive. Despite the disappointing forecasts of the European economy, the European Union continues to impose additional sanctions against the Russian Federation. So, today, it became known that their new package has already been prepared, which will come into force after the approval of the countries of the euro region. The head of the European Commission, Ursula von der Leyen, announced that from now on a complete ban will be imposed on Russia on any transactions with four "key" Russian banks (including VTB), the entry of Russian ships into European ports is prohibited (the exception will be the delivery of food and energy). In addition, the export of goods worth 10 billion euros to Russia, including products of advanced semiconductor technologies, mechanical engineering, and transport equipment, will be banned. The new sanctions will also affect imports of coal from Russia by 4 billion euros, and imports of goods by 5.5 billion euros. This includes wood, cement, seafood, and alcoholic beverages. Ursula von der Leyen added that the European Union is preparing additional sanctions against the supply of Russian oil to the territory of EU countries. Judging by the announced restrictions, they do not correspond to the proposals made on Monday by French President Emmanuel Macron and the Council of the European Union. Due to strong resistance from Germany and Hungary, this new package of sanctions from the EU will still allow the free movement of oil and natural gas, which will bring Russia almost $1 billion a day in export revenues. There are plenty of factors that weigh on the pound in the United Kingdom, but noticeably less than in the European Union. There is still no optimistic macroeconomic data in the UK, on the contrary: the whole global situation is more likely to lead to a decline in economic indicators. Probably, for this reason, the pound paired with the dollar has been trading in a closed amplitude of 1.3105-1.3180 for the fifth day in a row, showing extremely low activity. On Monday, the deputy governor of the Bank of England, John Cunliffe, finally publicly admitted that the Russian-Ukrainian conflict had dragged on too long, which would certainly increase price pressure in England and have an extremely negative impact on the incomes of British households. In a situation of accelerated inflation, according to J. Cunliffe, it is important to continue to tighten monetary policy, because so far only this can curb the rise in prices in England. An important factor for the pound quotes will be the ISM Services PMI data from the United States, the publication of which is expected today. Analysts assume that the component of paid prices will rise to 83.3 in March (in February this indicator was at the level of 83.1). If the overall PMI index indicates a continued expansion of business activity in the services sector along with an increase in prices at the entrance, then bidders may continue to put a 50 basis point increase in the Fed rate in prices, which will eventually prevent the GBP/USD pair from developing an upward movement. The material has been provided by InstaForex Company - www.instaforex.com |
| Bitcoin: two reasons why the share of retail holders of cryptocurrencies is increasing in the market Posted: 05 Apr 2022 09:12 AM PDT Continuation of Bitcoin consolidation in the range of 45,500-48,000 dollars is a sign of accumulation of positions. At the same time, as some researchers note, a significant role belongs to retail holders, who have become more active since the beginning of the year. In a tweet on April 4, William Clemente, a leading analyst at Blockware, reported a sharp jump in the BTC supply owned by smaller hodlers. At the same time, there has been an "exceptional" surge in FOMO (fear of lost profits) among retail investors since the beginning of this year. Retail investors are those who own an amount of 1 BTC or less. The share of retail crypto investors has grown According to the network analytics company Glassnode, these smaller players have dramatically increased their share of the total Bitcoin supply in 2022. Clemente noted that earlier the increase in supply from retail owners of bitcoin traditionally coincided with the peaks of asset prices. This was most likely caused by profit-taking. But now, given the recent dynamics of the main cryptocurrency, it looks different. The Blockware analyst notes that this is a really interesting situation since retail investors holding amounts of 0-1 BTC are currently buying cryptocurrency at the second-highest rate in history. "Looking at retail assets, most of the spikes coincided with macro maximums, but in some cases, they bought strategically. This surge is an exception." Bitcoin as a means of saving instead of fiat currency? Each segment of retail investors with amounts from 1 BTC to the smallest group of 0.001 BTC increased its market share over time. But, as Glassnode shows, there has been a sharp jump since mid-February. Now investors owning from 0.1 BTC to 1 BTC own a total of almost 800,500 BTC. "Either we are doomed, or retail traders decided to use bitcoin as a means of saving and abandoned the fiat system. The optimist in me hopes that this is the second," Clemente added. As bitcoin has moved out of its 2022 trading range, the volume of profitable supply held by short-term holders - those who have been on the market for 155 days or less - has increased. Glassnode data shows that short-term holders, whose investment positions are moving from losses to profits, have also become more active during the price peaks in the past years. Search interest in Bitcoin has fallen While attention is focused on the habits of investors at an important volume level in the network of about $50,000, however, active attention to bitcoins is still clearly absent. Google Trends data reflecting worldwide search interest in Bitcoin show less interest than ever since the main cryptocurrency rose to record price highs last November. This picture on Google hints that the trend is still declining, and the main cryptocurrency is in line for the lowest relative search volume in recent years if the situation continues.
|
| GBP/USD analysis on April 5. The UK is increasing pressure on the Russian Federation. Posted: 05 Apr 2022 09:11 AM PDT
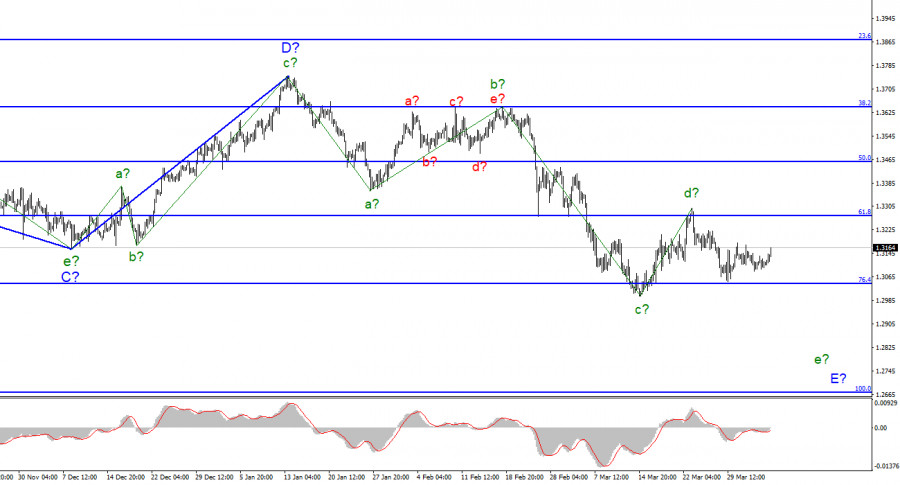
For the pound/dollar instrument, the wave markup continues to look very convincing and does not require any additions. The assumed wave d in E is completed, and there should be five waves in total inside the wave E, respectively, as in the case of the euro/dollar instrument, the downward trend section can continue its construction for some time. The assumed wave d in E may take a longer, three-wave form. This is supported by the fact that wave b in E has taken a five-wave, extended form. Also in favor of this is the unsuccessful attempt to break the low wave c in E. Thus, the instrument simply could not break through the 76.4% Fibonacci level and now the construction of a new upward wave has begun. This wave can be corrective, internal in the composition of e in E, or it can be the beginning of wave c-d-E. In the first case, the decline in the British dollar quotes should resume in the near future, in the second case, the instrument may return to the 1.3274 mark, which corresponds to 61.8% Fibonacci. But one way or another, I expect the construction of the wave e in E. The dollar is waiting for a failure in the negotiations between Kyiv and Moscow. The exchange rate of the pound/dollar instrument increased by only 30 basis points on April 5. The increase during the day was stronger, but in the afternoon a decline began, which devalued the entire advantage of the British in the first. Business activity indices have also been released in the UK today. In the service sector - an increase from 61.0 to 62.6 points, composite - from 59.7 to 60.9 points. However, this information did not interest the market. But the ISM business activity index in the US, which rose from 56.5 points to 58.3, caused modest dollar purchases after its release. I cannot say that something has changed dramatically in the business activity of the US services sector since the key mark is the level of 50.0. Anything above it is considered a positive value. Consequently, everything was fine, but it got a little bit better. The pound is now completely at the mercy of the geopolitical conflict between the Russian Federation and Ukraine, in which almost all European countries, including the UK, have been involved in one way or another. Let me remind you that European countries are actively supplying weapons and financial and humanitarian aid to Ukraine. In addition, they impose sanctions that are destructive to the Russian economy, which affect them themselves. As recently as today, the UK started talking about tightening sanctions against the Russian Federation based on war crimes committed in the Ukrainian city of Bucha, where several hundred bodies of dead civilians were found after the withdrawal of Russian troops. "We must start a new powerful wave of sanctions against the Russian Federation. The reality is that Russia continues to receive money from the West, which supports the Kremlin's military machine. This must stop," said British Foreign Secretary Liz Truss. Probably, Truss means just the fifth package of EU sanctions, which are currently being discussed on the sidelines of the alliance. An even greater deterioration in relations between the West and Russia may lead to an even greater decline in the European and British, which fully corresponds to the current wave marking. General conclusions. The wave pattern of the pound/dollar instrument still assumes the construction of wave E. I continue to advise selling the instrument with targets located near the 1.2676 mark, which corresponds to 100.0% Fibonacci, according to the MACD signals "down", since wave E does not look completed yet. Wave d can take a three-wave form and lengthen - wave b turned out exactly like this, but in any case, we should consider the signals "down", and while wave d continues to build, the MACD indicator is mainly rising.
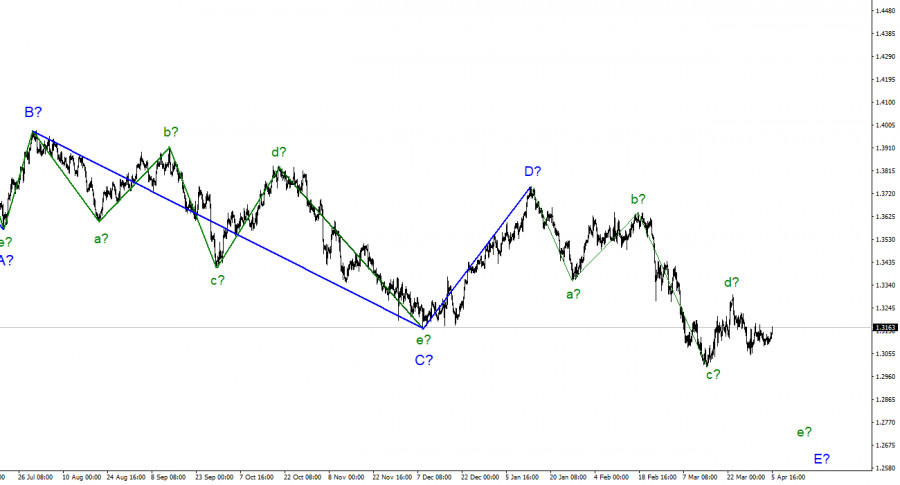
At the higher scale, wave D looks complete, but the entire downward section of the trend does not. Therefore, in the coming weeks, I expect the decline of the instrument to continue with targets well below the low of wave C. Wave E should take a five-wave form, so I expect to see the quotes of the British near the 27th figure. The material has been provided by InstaForex Company - www.instaforex.com |
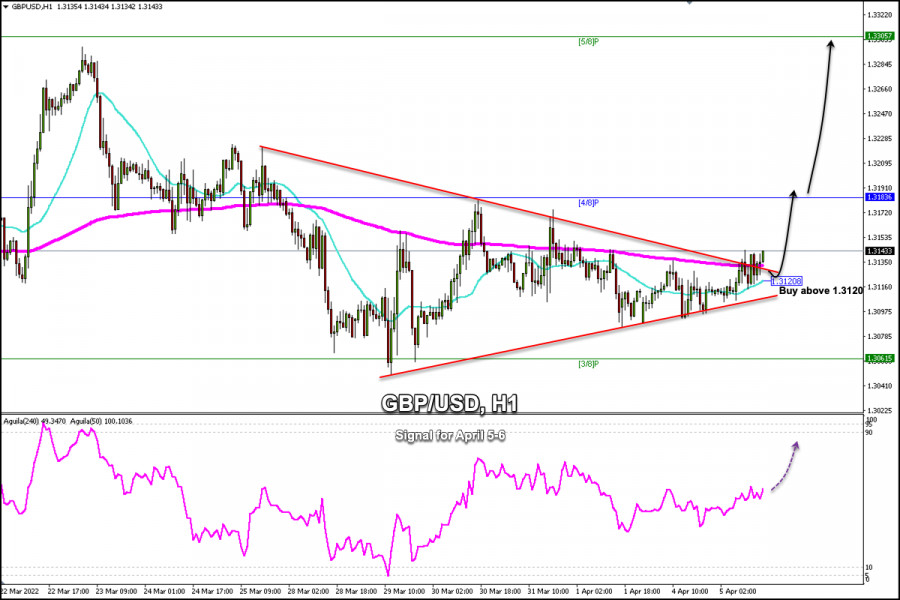
| Trading Signal for GBP/USD for April 05-06, 2021: buy above 1.3120 (21 SMA - 200 EMA) Posted: 05 Apr 2022 08:36 AM PDT
Early in the American session, the GBP/USD pair has been rising for the second day in a row above the uptrend channel that was formed since March 29. It is currently trading above the 200 EMA and the 21 SMA on 1-hour charts. The 21 moving average is turning in a bullish direction which is a positive sign for the pound. In addition to this, the pair is being supported by the uptrend channel. In case of GBP/USD breaks above monthly highs at 1.3146, an upside push will send the pair towards a high of 1.3183 (4/8 Murray). With a daily close above 1.3183, the price could rise to 5/ 8 Murray at 1.3305. On the 1-hour chart, GBP/USD is moving in a symmetrical triangle pattern. The break of the pattern will trigger a strong move higher that could push the price to resistance at 1.3183 in the next few hours. On the contrary, the break below the symmetrical triangle around 1.3100 will drag the pair towards the psychological level of 1.3000 and to the price levels of October 26, 2020 at 1.2880. Our trading plan for the next few hours is to buy above the 21 SMA located at 1.3120, with targets at 1.3183 and 1.3305. The eagle indicator is giving a positive signal which supports our bullish strategy. The material has been provided by InstaForex Company - www.instaforex.com |
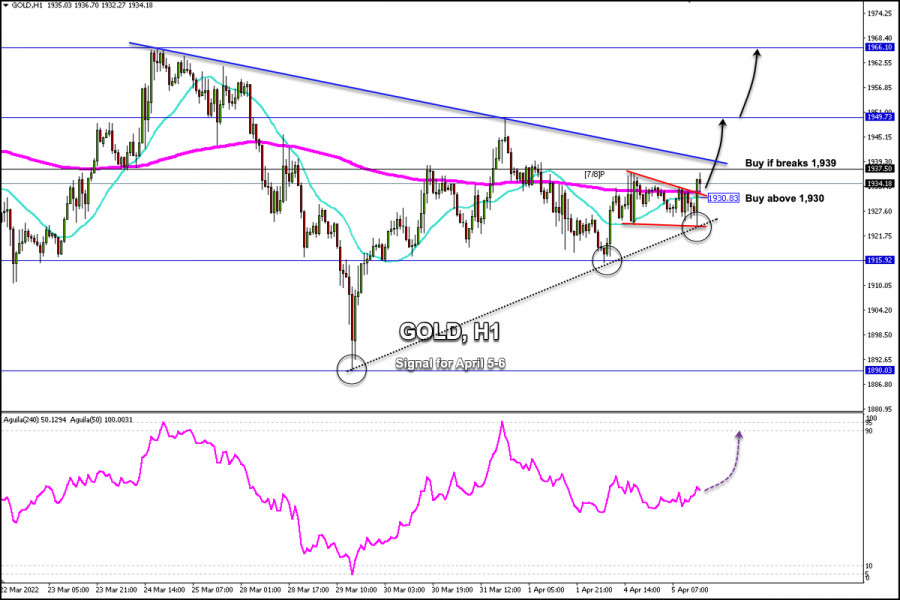
| Trading Signal for Gold (XAU/USD) for April 05-06, 2021: buy above $1,930 ( 200 EMA - 21 SMA) Posted: 05 Apr 2022 07:46 AM PDT
The 1-hour chart for gold (XAU/USD) shows that the price is consolidating above the 200 EMA and above the 21 SMA located around 1,930. We can see the formation of a descending wedge pattern which is a sign that there could be a bullish movement in gold in the next few hours. A consolidation above the 200 EMA located at 1,930 could give gold a strong bullish move. The first barrier will be to break the top of the bearish channel that was formed since March 23 around 1,939. A break above 1,939 and a consolidation above this area could accelerate the move higher and gold could reach the strong resistance of 1,950 and until 1,966, the high of March 24. Since March 29, gold has been trading above an uptrend channel which has been tested on 3 occasions. This could be a clear sign that the bulls are trying to keep the price of the metal higher and gold is likely to get strong upside momentum if it consolidates above 1,939. Investors, meanwhile, remain nervous as the United States and Europe plan to punish Moscow for the killings of civilians in Ukraine over the weekend. This data could favor gold as investors look to take a safe haven, which could support our bullish strategy. The price could easily reach the zone of 1,966 in the coming days. Our trading plan is to buy above 1,930, with targets at 1,939, 1,949, and even 1,966. The eagle indicator is giving a positive signal. The material has been provided by InstaForex Company - www.instaforex.com |
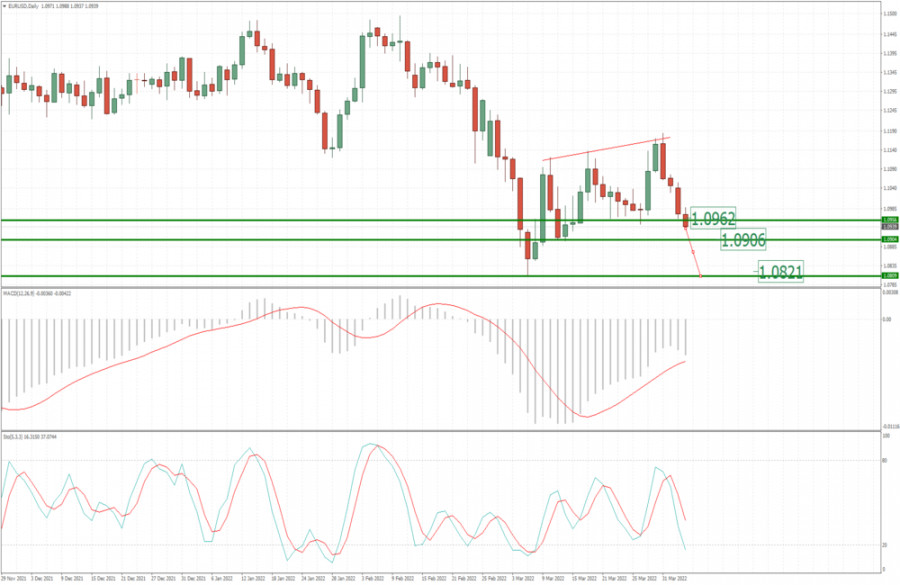
| EUR/USD analysis for April 05, 2022 - Strong selling pressure and potential for bgger drop Posted: 05 Apr 2022 07:36 AM PDT Technical analysis:
EUR/USD has been trading downside as I expected. The price reached my first downside objective and is heading towards next reference points. Trading recommendation: Due to strong selling pressure and bigger downside trend, I see potential for further downside continuation. Watch for selling opportunities on the intraday rallies with the downside objectives at 1.0900 and 1.0820. Stochastic is showing bear cross, which is another sign and confirmation for the downside movement. MACD is still downside , which is confirmation that trend is bearish. Key resistance is set at 1.1170 The material has been provided by InstaForex Company - www.instaforex.com |
| EUR/USD analysis on April 5. An important point for the European currency Posted: 05 Apr 2022 07:17 AM PDT
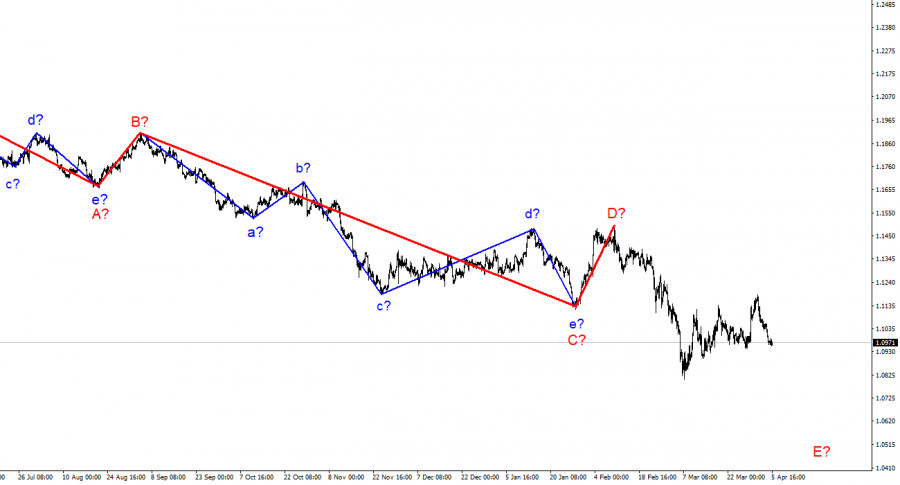
The wave marking of the 4-hour chart for the euro/dollar instrument has become a little more complicated due to the recent increase in quotations. Now the assumed wave 4 has taken a five-wave form and fits rather poorly into the current wave layout, in which the corrective wave 2 is very short. Nevertheless, the wave pattern does not require drastic changes right now. If the construction of the proposed wave 4 has ended after all (the wave can no longer take a more complex form), then the tool has started building the proposed wave 5 in E. If the increase in quotes resumes again, then the entire wave marking will require adjustments. I note that wave 4 looks like a correction in any case, and, accordingly, it cannot be the first wave of a new upward trend segment. The 127.2% Fibonacci level, near which waves a and c ended at 4, did not miss the instrument above itself. An unsuccessful attempt to break through it indicates that the market is ready for new sales of the instrument. Thus, at this time, the wave marking remains, and the demand for the US dollar is rising again due to the difficult geopolitical situation in Ukraine. The euro currency has no other option but to decline. The euro/dollar instrument did not decrease by 1 point on Tuesday. But at the same time, it did not increase by 1 point. The instrument has been trading all day with an amplitude of 15 basis points, which is a record this year with a minus sign. Since there have been no price changes today, the wave marking does not require any additions or clarifications. This means that the instrument will soon try to make a successful attempt to break the 1.0948 mark, which corresponds to 161.8% Fibonacci. This mark is also the low of the previous wave d at 4. Thus, the instrument has the opportunity to form a confirmation of the transition to the construction of a new downward wave E. If this does not happen, but the increase resumes, then it is unlikely to belong to the corrective wave 4. In this case, the entire wave marking may require serious changes. Business activity data has been released in the European Union today. The index for the service sector rose from 54.8 to 55.6 points in March, and the composite index rose from 54.5 to 54.9. However, these data did not interest the market at all. The same applies to the report on the foreign trade balance, the PMI index for the services sector in the United States, and the composite PMI index in the United States. Strictly speaking, these data from the very beginning did not cause any expectation of market activity. Much more important now is the new, fifth, package of EU sanctions against Russia. Yesterday, it was announced, and today Ursula von der Leyen said that it could be adopted tomorrow. This package includes a complete embargo on the import of coal from the Russian Federation, sanctions against four more banks of the Russian Federation, personal sanctions against officials of the Russian Federation, and a ban on entry into European ports for all vessels from the Russian Federation. So far, we are not talking about the introduction of an embargo on oil or gas, but there is no doubt that if the situation in Ukraine worsens, then it will also come to this step. General conclusions Based on the analysis, I still conclude that the construction of wave E is currently underway. If so, now is still a good time to sell the European currency with targets located around the 1.0723 mark, which corresponds to 200.0% Fibonacci, for each MACD signal "down". The current wave marking assumes the construction of wave 5 in E. This option will be canceled in case of a successful attempt to break the 1.1153 mark, which is equivalent to 127.2% Fibonacci.
On a larger scale, it can be seen that the construction of the proposed wave D has been completed, and the instrument has updated its low. Thus, the fifth wave of a non-pulse downward trend section is being built, which may turn out to be as long as wave C. If this assumption is correct, then the European currency will still decline. The material has been provided by InstaForex Company - www.instaforex.com |
| Bitcoin falls in early April and altcoins steadily grow Posted: 05 Apr 2022 07:08 AM PDT At the beginning of this week, Bitcoin continued to maintain a correction after a spectacular rise in the second half of March. During this Monday's trading session, Bitcoin decreased by 0.2%, closing at $46,300. At the time of writing, the asset is trading at $46,585.
At the end of Q1 2022, BTC lost 1.5%. At the same time, March was quite a favorable period for Bitcoin. The asset climbed by 10%, having strengthened for the second month in a row. The cryptocurrency began a strong bullish trend on March 14, when it was worth about $37,000, and already on March 28, the coin reached $48,160 - a high of 2022. However, the asset faced a technical obstacle, and there was a period of correction. As a result, in just a few days, BTC was sent below the support of $45,000. Notably, Bitcoin lost more than 16% in January. However, its price rose by 12% in February. In November 2021, Bitcoin hit a new all-time high above $69,000. Since then, the cryptocurrency has been steadily declining, dropping by more than 40%. By the end of 2021, the BTC price increased by 1.6 times to $46,200 from $28,900. On Monday, the leading altcoins of the crypto market refused to follow Bitcoin's downtrend and showed strong growth. Thus, Ethereum added 0.4%, and Terra gained 2.5% yesterday. At the same time, Solana gained 28% during the last week. At the moment, the asset is trading at $136.4. The altcoin takes sixth place in the top of the largest cryptocurrencies by market cap. Solana's spectacular leap happened due to the steady expansion of its ecosystem. For example, Serum, the leading decentralized exchange on Solana, recently revealed its partnership with Burnt Finance, a decentralized NFT marketplace also based on Solana. Last week, another important booster for Solana was the announcement by the first NFT marketplace, OpenSea. It will add token support on Solana in April. According to CoinGecko, a popular online platform that tracks the prices of digital assets, over the past 24 hours, the total capitalization of the crypto market declined by 0.3% to $2.25 trillion. The cryptocurrency index of fear and greed gained 4 points during the day and rose to 60 points. Despite the continuous correction from the beginning of the trading session on Monday, by the end of the day, Bitcoin was able to recoup almost all of the decline due to the growth of major US stock indices. According to CoinShares' latest weekly report, institutional investors poured about $180 million into cryptocurrency funds over the last seven days, with European investors showing the most activity, while US investors refrained from entering the market. As for the preliminary forecasts of experts on the behavior of the cryptocurrency market in the short term, analysts at the US investment bank JPMorgan forecast the upcoming slowdown in the market growth. Data on the fall of the stablecoins' share in the crypto market became the main confirmation of the experts' argument. JPMorgan considers this fact as an indicator of the potential to increase or decrease. As it usually happens, when the share of stablecoins is about 10% of the total market cap, analysts talk about the prospects of market growth. However, at the moment, this indicator hovers at 7%, which signals that the crypto market is about to decline. The material has been provided by InstaForex Company - www.instaforex.com |
| The main Asian indices show a slight increase in today's trading Posted: 05 Apr 2022 06:57 AM PDT
The main Asian indices show a slight increase in today's trading. Today is a day off on the Shenzhen and Shanghai stock exchanges again, and the exchange in Hong Kong is also not working. The Japanese Nikkei 225 index added 0.21%, the Australian S&P/ASX 200 - 0.04%, while the KOSPI exchange index in South Korea showed a slight decrease (by 0.01%). The main Asia-Pacific indices follow the US stock indices, which showed an increase on the eve due to an increase in demand for securities of technology companies. The stock quotes of one of the largest companies included in the calculation of the S&P 500 indicator (Twitter) immediately rose by 27% against the background of a message from Tesla CEO Elon Musk about owning a 9.2% stake in the company's securities. This caused an increase not only in the value of the company's shares but also in the S&P 500 index. Another factor affecting Asian indicators was the weakening of the yen. This supports the market, as it helps to increase the profits of companies engaged in exports. Among the companies included in the calculation of the Nikkei 225 index are the share prices of Rakuten Group Inc. (+5.6%), M3 Inc. (+3.4%), and SoftBank Group (+3.2%), as well as Fast Retailing (+2.3%) were noted. A less significant increase in the value of securities was shown by Sony, Toyota Motor, and Nissan Motor, which rose by 0.4%, 0.1%, and 0.6%, respectively. The value of securities of Shimamura Co. increased by 8.4% due to excellent reporting results for the 2021 fiscal year, which ended in March. The company managed to get a record net income, as well as a positive forecast for 2022. At the same time, the stock prices of other Japanese companies declined: Pacific Metals Co. by 6.6%, Kawasaki Kisen Kaisha, Ltd. by 4.6%, and Mitsui O.S.K. Lines Ltd. by 3.6%, Dai-Chi Life by 4.7%, and Mitsubishi UFJ Financial Group by 1.7%. The level of consumer prices in South Korea increased by 4.1% over the past month compared to the same period in 2021. For this country, this level of inflation has become the highest in the last ten years. At the same time, the indicator exceeded the forecasts of experts who expected the indicator to grow by only 3.8%. Among the components of the KOSPI indicator, only Hyundai Motor securities showed a slight increase (by 0.6%), and Samsung Electronics Co. stock quotes remained unchanged in comparison with the closing level of yesterday's trading. The Central Bank of Australia has decided to leave the interest rate at a minimum of 0.1%. This coincided with the forecasts of experts. This rating level has been maintained in the country for more than one year. Among the companies included in the calculation of the S&P/ASX 200 indicator, the increase in the value of securities was noted by Xero (+4.1%), Wisetech Global (+2.5%), as well as Altium (+3.8%). Due to the increase in the cost of oil, the share prices of companies engaged in oil production and refining also increased: Woodside Petroleum by 2.9%, Santos, Ltd. by 2.1%, and Beach Energy by 1.6%. At the same time, mining companies are losing the value of shares: BHP quotes decreased by 0.9%, and Rio Tinto - by 0.4%. The material has been provided by InstaForex Company - www.instaforex.com |
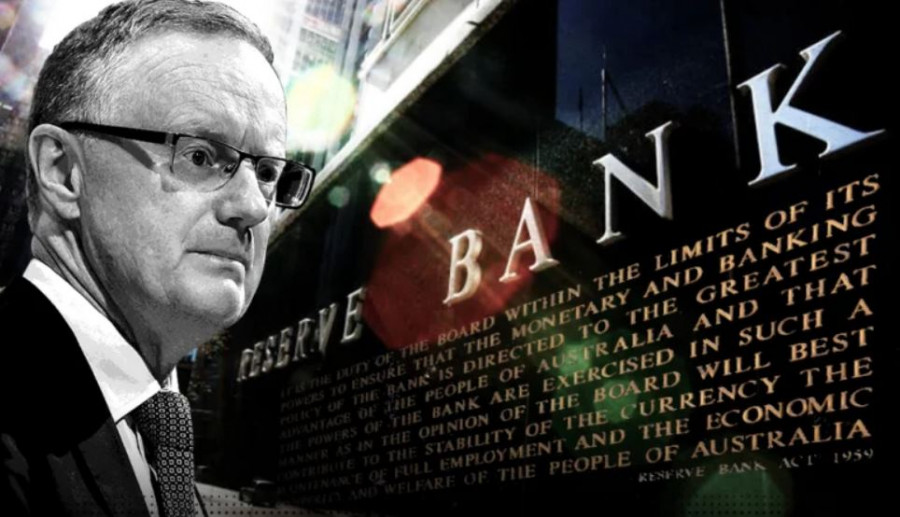
| AUD/USD: RBA announces hawkish stance Posted: 05 Apr 2022 06:35 AM PDT The Australian dollar has strengthened its position across the market on Tuesday, reacting to the results of the RBA's April meeting. The Reserve Bank of Australia has strengthened its hawkish attitude, although it left the interest rate unchanged. But in this case, words were more important than actions: on the eve of the April meeting, no one expected that the regulator would decide on any specific actions. But as for the tone of the RBA's rhetoric, the intrigue remained here until the last minute. The central bank may well have maintained a cautious attitude, given the geopolitical instability. But the regulator nevertheless implemented a "hawkish" scenario, increasing the likelihood of an interest rate hike by the end of this year.
In general, the AUD/USD pair has been within the upward trend for almost four weeks. Since mid-March, the Australian dollar has been growing steadily, even against the background of increased demand for a safe greenback, which serves as a protective tool. Buyers of AUD/USD were able to overcome the almost 500-point path and are now at the level of 10-month highs. Moreover, in my opinion, the aussie has not exhausted its growth potential, given the messages that the RBA has voiced. Tuesday's price surge suggests that in the medium term, the pair may test the area of the 77th figure for the first time since June last year. The RBA's rhetoric was indeed quite optimistic and encouraging in the context of hawkish intentions. The regulator noted that the unemployment rate in the country has decreased and will continue to decline (below the 4 percent mark), and inflation, on the contrary, has grown and will continue to grow. The central bank even noted wage growth, however, at the same time said that "at the aggregate level, wage growth rates remain in the area of relatively low values that prevailed before the pandemic." The RBA also added that the growth in labor costs was below the pace that should correspond to inflation, which in turn settled steadily near the target level. However, even here the regulator has found a place for optimistic assessments. The central bank's accompanying statement indicates that, given the high demand for labor in the labor market, the bank expects a further acceleration in the growth of total wages "and broader indicators of labor costs." As for the prospects of tightening monetary policy, the Australian regulator has linked this issue to inflation. Before raising the interest rate, the RBA intends to obtain factual evidence that inflation is "sustainably within the target range." Unfortunately, Australia publishes quarterly rather than monthly inflation reports, despite the fact that the head of the RBA has repeatedly advocated monthly publications. Data for the first quarter of 2022 will be released only at the end of this month, so today we can operate with data for the 4th quarter of last year. During this period, the overall consumer price index jumped to 1.3% in the country (for comparison: in the third quarter, Australian inflation rose to 0.8%). At the same time, indirect inflation indicators suggest that in the first quarter of this year, the CPI will also show significant growth, increasing the likelihood of an interest rate hike this year. Despite the fact that the Reserve Bank of Australia tied the issue of tightening monetary policy to inflation, it showed clearly "hawkish" hints, excluding one important phrase from the text of the accompanying statement. In the final communique of the April meeting, the phrase about the RBA's readiness to remain patient in the context of an interest rate hike disappeared. The exclusion of this wording was rightly regarded by traders as a signal of the central bank's readiness to consider the possibility of raising the rate in the foreseeable future. Note that earlier RBA Governor Philip Lowe did not rule out such a possibility, thereby fueling interest in the Australian dollar. Thus, the Australian regulator once again confirmed its hawkish attitude on Tuesday. If inflation pleases investors this month, the probability of a rate hike will increase significantly. However, judging by the dynamics of AUD/USD growth, the market is playing this scenario in advance. This speaks to aussie's upward prospects. Technology paints a similar picture. The pair on the D1 timeframe is between the middle and upper lines of the Bollinger Bands indicator, as well as above all the lines of the Ichimoku indicator, which demonstrates the bullish "Line Parade" signal. In other words, the pair retains the potential for further growth - at least to the first resistance level of 0.7660 (the upper line of the Bollinger Bands indicator on D1). A break of this level will open the way to the area of the 77th figure. The material has been provided by InstaForex Company - www.instaforex.com |
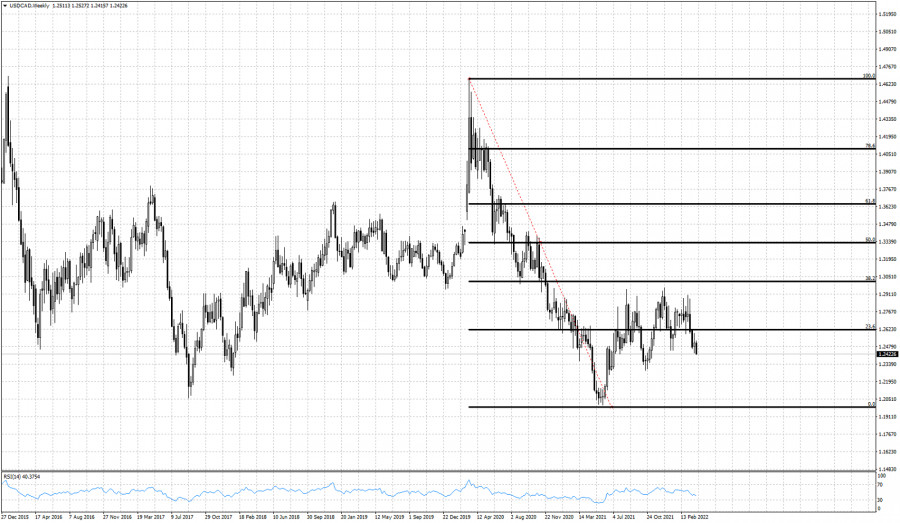
| Posted: 05 Apr 2022 06:21 AM PDT USDCAD remains under pressure for the fourth week. Price made a triple top at 1.2910 in early March. Price has tested the specific price level three times and got rejected each time. Failure to hold above 1.2335 will be a bearish sign.
USDCAD has retraced only 38% of the entire decline so far. Price has tested 1.29 three times but no success. This price action confirms the importance of the resistance at 1.29. Inability to break above this level will eventually lead price lower towards 2021 lows around 1.2050. Bulls need to recapture 1.29 in order to regain control of the trend. If this happens, then we should expect USDCAD to reach 1.3635. The material has been provided by InstaForex Company - www.instaforex.com |
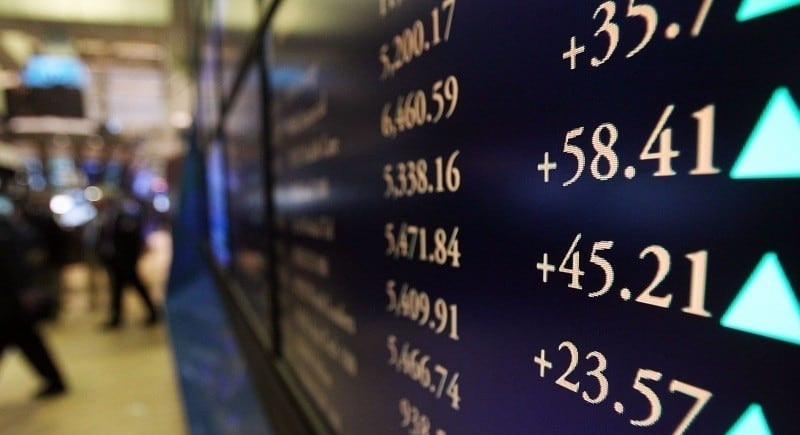
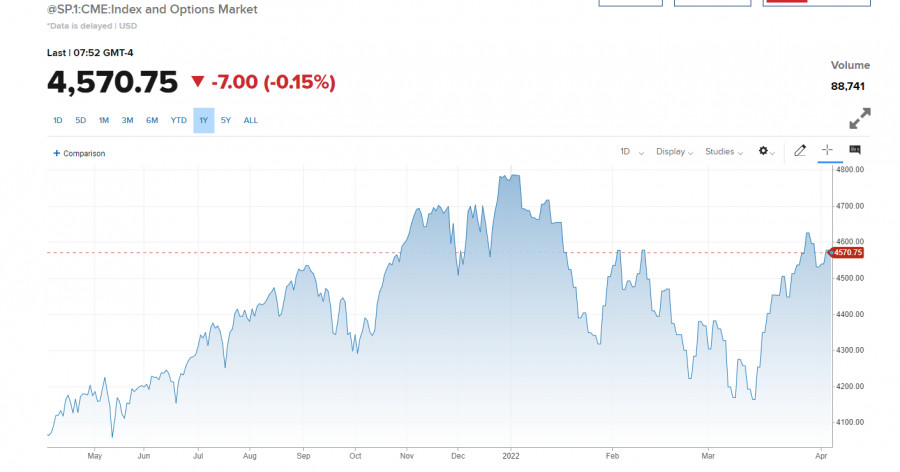
| US premarket on April 5: US stock market rallies due to tech sector Posted: 05 Apr 2022 05:52 AM PDT US stock index futures declined on Tuesday as traders remain concerned about signals of the US bond market currently indicating an inversion of the yield curve. Moreover, investors are pessimistic about the future due to the recent events in Ukraine. The Dow Jones Industrial Average futures were down 80 points or 0.24%. The S&P 500 and Nasdaq 100 futures fell by more than 0.2% each.
Currently, US Treasury yields are the major focus of attention. Rates of some short-term bonds increased more than their long-term counterparts. The yield on 5-year bonds rose to 2.6%, while the yield on 30-year bonds totaled nearly 5.51%. The inversion of the yield curve has been the main concern for traders so far as it is historically followed by a recession. Despite Russia's invasion of Ukraine, markets remain extremely resilient, although a bearish correction is evident. Investors express concerned over continuing price pressure and ambiguous prospects of the global economy. They are now in disarray after buying up shares at the start of 2022. Notably, oil prices have risen again. West Texas Intermediate crude oil futures jumped nearly 1% to $104.23 a barrel. Brent crude oil added 0.7% to $108.30. Yesterday, the stock market benefited from the rally in the tech sector. The Nasdaq Composite gained 1.9% at the end of yesterday's trading session. Twitter stock surged by 27%, its biggest gain since Elon Musk announced a 9.2% stake purchase. The Dow index was up about 100 points, while the S&P 500 rose by 0.8%.
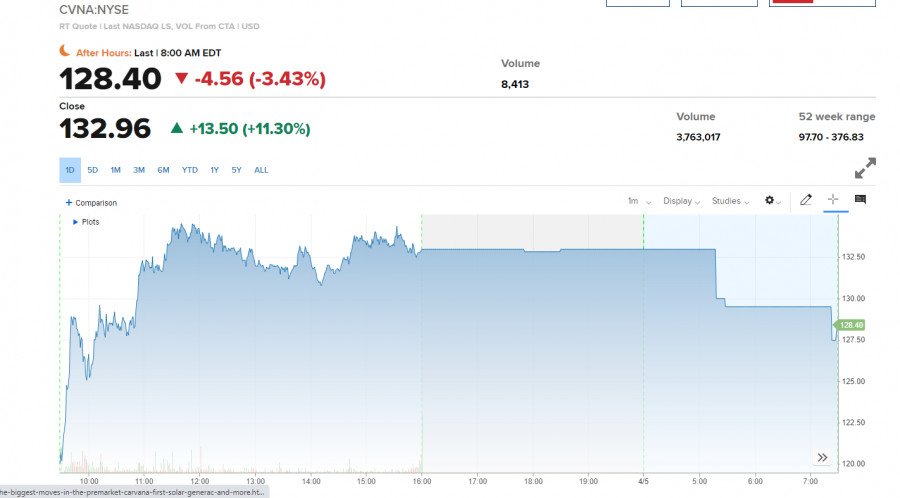
Premarket Carvana's shares fell after its rating was revised downward. The stocks went down 3.4% in the premarket. Solar energy company First Solar lost 4.8% in the premarket after Bank of America Securities downgraded its rating from "neutral" to "underperform." The Bank of America said investors might be overly optimistic about this company's growth prospects.
US service sector growth following the coronavirus pandemic has a positive effect on Carnival's stock. The company reported that the period from March 28 to April 3 was the busiest week for new cruise bookings in its history. Carnival stock rose by 3.6% in the premarket. After yesterday's 27% jump, Twitter added another 1.5% today. Technical picture of S&P500 Trading is conducted above $4,539. Therefore, the market is most likely to recover to $4,588. If it fails to do it early in the week, market pessimism will prevail. If trading closes below $4,539, it will be unfavorable for buyers. In case of breakout of $4,589, the nearest target for sellers will be resistance at $4,665. If this level is broken, the trading instrument will hit the highs of $4,722 and $4,818. In case of further pressure and breakout of $4,539, a decline to the area of $4,488 is likely. A long-term target for sellers of the trading instrument will be the low of $4,433. Then, bulls will have to resume their moves. The material has been provided by InstaForex Company - www.instaforex.com |


| You are subscribed to email updates from Forex analysis review. To stop receiving these emails, you may unsubscribe now. | Email delivery powered by Google |
| Google, 1600 Amphitheatre Parkway, Mountain View, CA 94043, United States | |


Comments