Forex analysis review
Forex analysis review |
- US stocks closed lower, Dow Jones down 0.80%
- Forecast and trading signals for GBP/USD for April 6. COT report. Detailed analysis of the pair's movement and trade deals.
- Forecast and trading signals for EUR/USD for April 6. Detailed analysis of the pair's movement and trade deals. Dollar liked
- Brainard revived the dollar. Euro falls victim to short positions
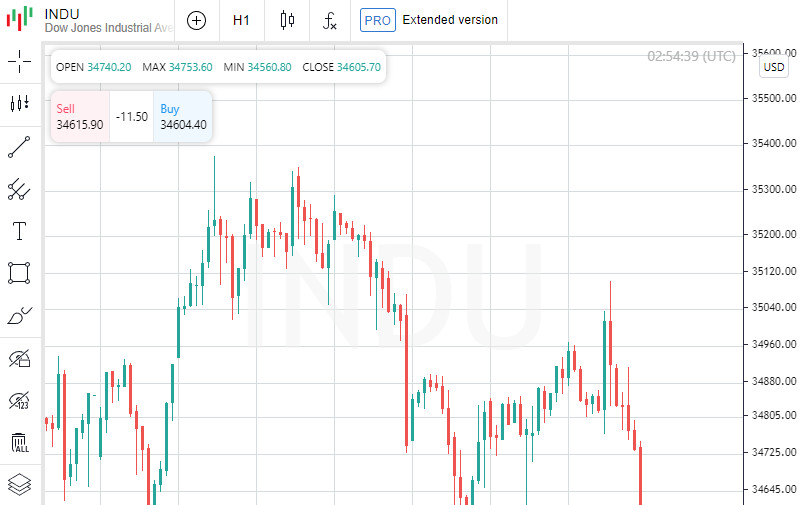
| US stocks closed lower, Dow Jones down 0.80% Posted: 05 Apr 2022 07:55 PM PDT
At the close of the New York Stock Exchange, the Dow Jones was down 0.80%, the S&P 500 was down 1.26% and the NASDAQ Composite was down 2.26%. UnitedHealth Group Incorporated was the top performer in the Dow Jones Index today, up 7.74 points or 1.52% to close at 517.76. McDonald's Corporation rose 1.68 points or 0.68% to close at 248.51. Johnson & Johnson rose 0.65% or 1.14 points to close at 177.61. The losers were Boeing Co shares, which fell 8.53 points or 4.46% to end the session at 182.65. Salesforce.com Inc. shares rose 8.71 points (3.98%) to close at 210.14, while Intel Corporation was down 1.07 points (2.17%) to close at 48. ,13. Leading gainers among the components of the S&P 500 in today's trading were Zimmer Biomet Holdings Inc, which rose 2.60% to hit 129.13, Carnival Corporation, which gained 2.43% to close at 20.22, and also shares of JM Smucker Company, which rose 2.32% to close the session at 137.77. The drop leaders were MarketAxess Holdings Inc, which shed 10.97% to close at 307.60. Shares of Monolithic Power Systems Inc shed 7.41% to end the session at 439.38. Quotes of Ceridian HCM Holding Inc decreased in price by 6.37% to 65.66. Leading gainers among the components of the NASDAQ Composite in today's trading were Anghami De Inc, which rose 47.52% to hit 13.41, Inozyme Pharma Inc, which gained 38.60% to close at 5.96, and also shares of Kaspien Holdings Inc, which rose 34.18% to end the session at 9.50. The drop leaders were shares of Cognyte Software Ltd, which fell 31.13% to close at 8.03. Shares of Imara Inc lost 22.09% and ended the session at 1.27. Quotes of Immix Biopharma Inc decreased in price by 22.01% to 2.02. On the New York Stock Exchange, the number of securities that fell in price (2638) exceeded the number of those that closed in positive territory (591), while quotes of 115 shares remained virtually unchanged. On the NASDAQ stock exchange, 2,858 stocks fell, 996 rose, and 207 remained at the previous close. The CBOE Volatility Index, which is based on S&P 500 options trading, rose 13.25% to March 21. Gold futures for June delivery lost 0.71%, or 13.80, to hit $1.00 a troy ounce. In other commodities, WTI crude for May delivery fell 2.51%, or 2.59, to $100.69 a barrel. Brent futures for June delivery fell 2.01%, or 2.16, to $105.37 a barrel. Meanwhile, on the Forex market, EUR/USD fell 0.59% to hit 1.09, while USD/JPY edged up 0.69% to hit 123.63. Futures on the USD index rose by 0.51% to 99.47. The material has been provided by InstaForex Company - www.instaforex.com |
| Posted: 05 Apr 2022 07:45 PM PDT GBP/USD 5M
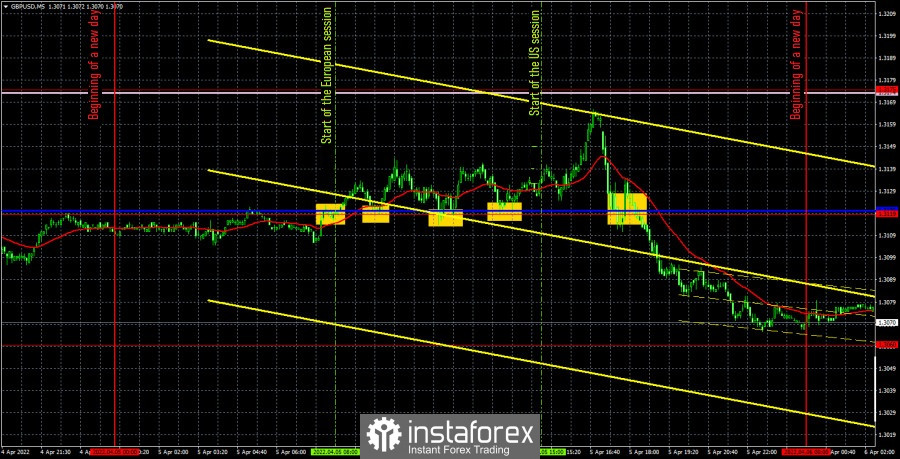
The GBP/USD currency pair tried to start an upward movement again on Tuesday, but it still fell in the afternoon. The moment when the pound started to fall coincided with the release of the ISM report in the United States. However, we very much doubt that this particular report, which, by and large, turned out to be neutral, was capable of causing a drop of 80 points. Nevertheless, theoretically, this is still possible, so we will assume that it was the ISM index in the service sector that provoked the dollar's growth, although it turned out to be worse than forecasts. It should also be noted that the pair managed to settle above the descending trend line, but at the same time, as we can see, this did not save it from a new fall. Thus, the pound's decline is still the most likely scenario for the pound/dollar pair. There were quite a lot of trading signals on Tuesday, which is not surprising, given that the pair was flat throughout the European session. During this time, it was able to form four buy signals. Everything is near the extreme level of 1.3119 and the Kijun-sen line. The price was only able to go up more than 20 points in one case out of four. However, the long position should have been opened alone, since the price never went below 1.3119. Formally, it was possible to make a profit on this single transaction, but the pair failed to reach either the 1.3175 level or the Senkou Span B line. Therefore, there was no signal to leave the deal. The next sell signal was formed when the pair settled below the level of 1.3119 and it could also be worked out, although it was formed quite late. It was possible to earn about 20 points on it. COT report:
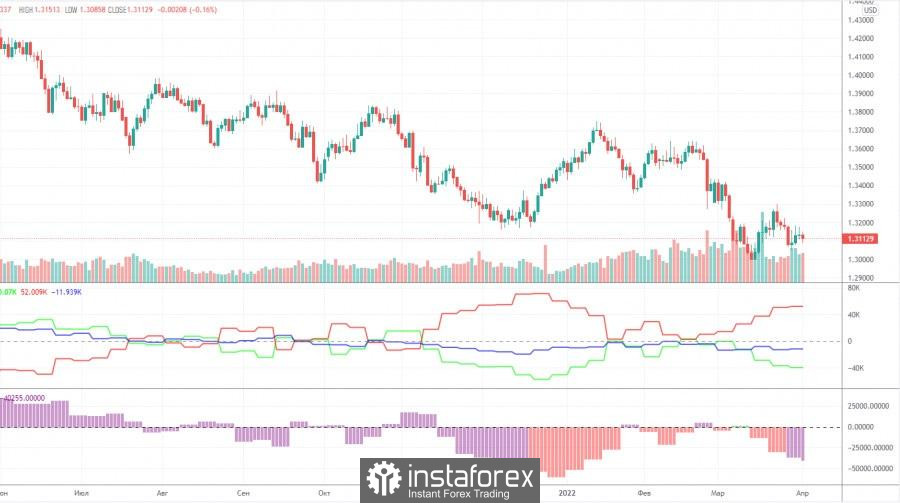
The latest Commitment of Traders (COT) report on the British pound showed minimal changes in the mood of major players. For a whole week, the non-commercial group opened only 700 short positions and closed 2,100 long positions. Thus, the net position of non-commercial traders decreased by 3,000. Even for the pound, such changes are insignificant. In general, the non-commercial group has almost 2.5 times more contracts for short positions than for longs. This means that the mood of professional traders is now "very bearish". Thus, this is another factor that speaks in favor of the continuation of the fall of the British currency. The situation with COT reports for the pound is completely different than for the euro. According to the pound, the mood of the major players changes every couple of months, and sometimes even faster. At this time, the "non-commercial" net position has already fallen to the levels where the last round of the pound's fall ended (the green line on the first indicator). Thus, we can even assume that in the coming weeks the pound will try to start a new ascent. However, much will again depend on geopolitics and technique. At the moment, the pound has a little more reason to grow than the euro. But there are plenty of factors of the fall. We recommend to familiarize yourself with:Overview of the EUR/USD pair. April 6. New sanctions against Russia may be introduced today. The euro continues to fall. Overview of the GBP/USD pair. April 6. The pound suffers from the geopolitical position of Boris Johnson. Forecast and trading signals for EUR/USD on April 6. Detailed analysis of the movement of the pair and trading transactions. GBP/USD 1H
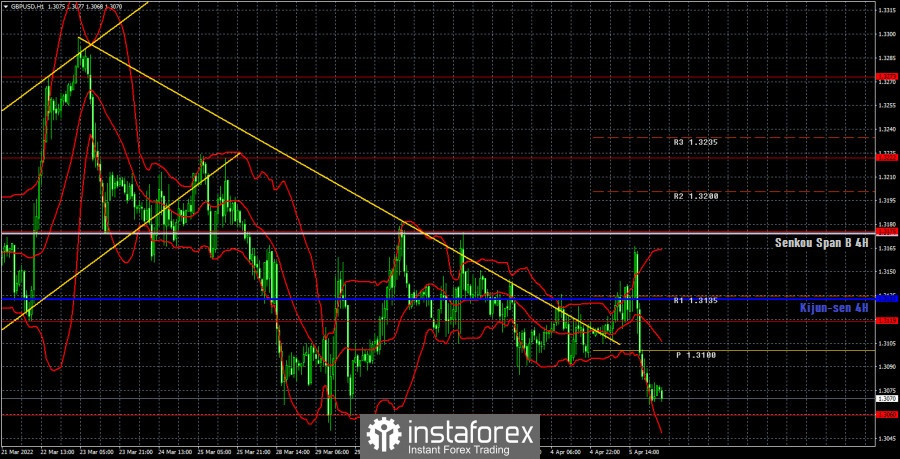
It is clearly visible on the hourly timeframe that the pair has not been able to determine the direction of movement for several weeks and has been in a limited range all this time. The upward momentum ended very quickly near the level of 1.3175 and the bulls failed to at least return to this level. As a result, in the coming hours, the pair may be near the level of 1.3060, from which it bounced a couple of weeks ago. The price could probably overcome this level this time and the pound would fall. We highlight the following important levels on April 6: 1.3000, 1.3060, 1.3119, 1.3175, 1.3222. The Senkou Span B (1.3174) and Kijun-sen (1.3133) lines can also be signal sources. Signals can be "bounces" and "breakthroughs" of these levels and lines. It is recommended to set the Stop Loss level to breakeven when the price passes in the right direction by 20 points. The lines of the Ichimoku indicator can move during the day, which should be taken into account when determining trading signals. There are also support and resistance levels on the chart that can be used to take profits on transactions. Only an absolutely secondary index of business activity in the construction sector is scheduled for Wednesday in the UK, and the Federal Reserve minutes are scheduled for late in the evening in the US. The first, or the second event is unlikely to provoke at least some reaction during the day. And by the time the minutes are published in the evening, traders are advised to leave the market already. Explanations for the chart:Support and Resistance Levels are the levels that serve as targets when buying or selling the pair. You can place Take Profit near these levels. Kijun-sen and Senkou Span B lines are lines of the Ichimoku indicator transferred to the hourly timeframe from the 4-hour one. Support and resistance areas are areas from which the price has repeatedly rebounded off. Yellow lines are trend lines, trend channels and any other technical patterns. Indicator 1 on the COT charts is the size of the net position of each category of traders. The material has been provided by InstaForex Company - www.instaforex.com |
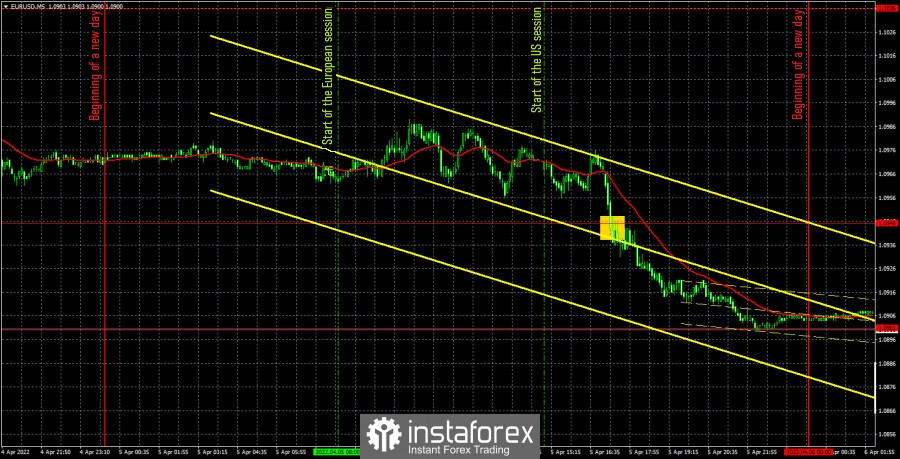
| Posted: 05 Apr 2022 07:31 PM PDT EUR/USD 5M
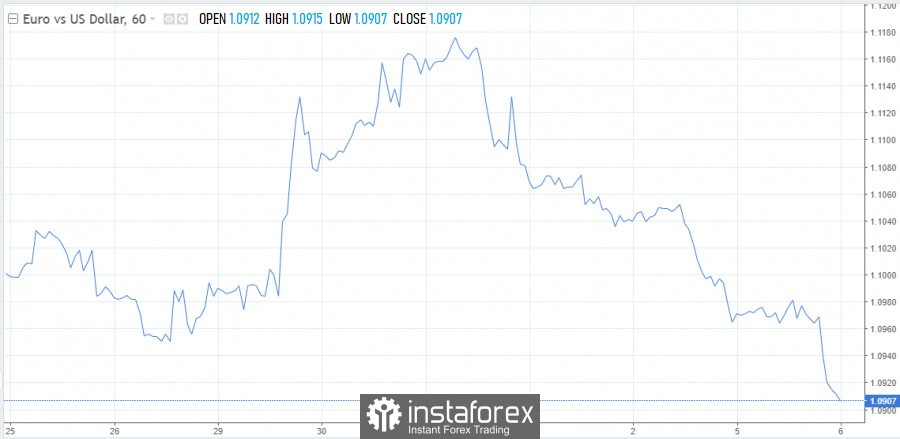
The EUR/USD pair showed a good movement on Tuesday, but, unfortunately, only in the afternoon. There was a slight downward slope in the morning, but the whole movement was more like a flat. With macroeconomics, everything was quite difficult on Tuesday. The European index of business activity in the service sector turned out to be higher than forecasts and higher than the previous value, but the euro currency fell after its release. The ISM services business activity index in the United States turned out to be better than the previous month, but worse than forecasts, and after it the same trend movement began, after which the dollar strengthened by 50 points. From our point of view, the ISM index was not so strong as to provoke a rise in the dollar. Recall that last Friday traders simply ignored much more important reports. The European Union announced new sanctions against Russia, which will prohibit the presence of Russian ships in European ports, prohibit the import of coal from Russia and prohibit several other banks of Russia from using the SWIFT system. From our point of view, it was the new sanctions that provoked the fall of the euro currency. However, it should be recognized that the ISM index could also play a role. Only one trading signal was generated during the past day. The price overcame the level of 1.0945, after which it was able to go down about 20 more points. That's how much traders could earn yesterday, having worked out this signal with a short position, which should have been closed manually. COT report:
The latest, Commitment of Traders (COT) report turned out to be as neutral as possible and did not show any serious changes in the mood of professional traders. The non-commercial group closed about 7,000 contracts long positions and 4,500 short positions during the reporting week. The net position of this group decreased by 2,500. At the same time, the total number of long positions still exceeds the total number of short positions of major players. That is, their mood is still bullish, although the euro has been falling for 14-15 months. Earlier, we have already drawn attention to the fact that in January and February, major players increased longs on the euro currency. In theory, this should have led to the growth of the currency itself. However, the euro did not show anything other than the usual slight correction. Since it was in January-February, when the geopolitical situation in the world and in Europe began to deteriorate sharply, we assume that at that time the demand for the US dollar was growing very much. That is why there was an increase in the euro/dollar pair, despite the fact that the demand for euros among market participants was also growing. The demand for the dollar just grew faster and stronger. Now the factor of geopolitics remains in force, therefore, with the bullish mood of the major players, it is quite possible to expect a new fall in the European currency. To some extent, this is a paradox, but a paradox explained by the current circumstances that have developed in the world. We recommend to familiarize yourself with:Overview of the EUR/USD pair. April 6. New sanctions against Russia may be introduced today. The euro continues to fall. Overview of the GBP/USD pair. April 6. The pound suffers from the geopolitical position of Boris Johnson. Forecast and trading signals for GBP/USD on April 6. Detailed analysis of the movement of the pair and trading transactions. EUR/USD 1H
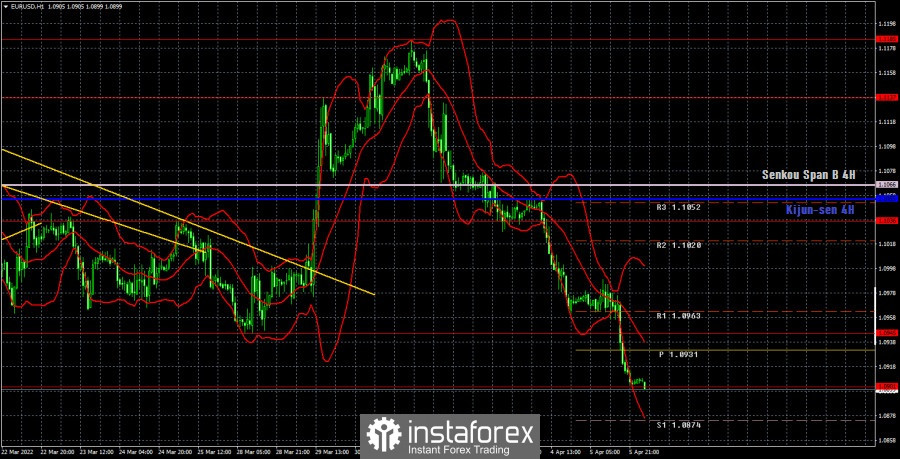
It is clearly visible on the hourly timeframe that a new round of downward movement is continuing, but now even a trend line cannot be formed along this turn, since the fall is almost non-stop. If we form a trend line now, then the first correction will lead to the price settling above it. And that doesn't make any sense. Thus, the euro remains an extremely weak currency due to geopolitics and macroeconomics and is likely to continue its decline. We allocate the following levels for trading on Wednesday – 1.0806, 1.0901, 1.0945, 1.1036, as well as the Senkou Span B (1.1066) and Kijun-sen (1.1055) lines. The lines of the Ichimoku indicator can move during the day, which should be taken into account when determining trading signals. There are also support and resistance levels, but no signals will be formed near them. Signals can be "bounces" and "breakthrough" levels - extremes and lines. Do not forget about placing a Stop Loss order at breakeven if the price went in the right direction of 15 points. This will protect you against possible losses if the signal turns out to be false. There are no important events scheduled for April 6 in the European Union. We only have the minutes of the Federal Reserve's March meeting in the United States, which is when the key rate could be raised for the first time. It could potentially be interesting. In particular, it will be possible to find out how many FOMC members support a 0.5% rate increase at the next meetings or similar information. However, it will be published late in the evening, when it is no longer recommended to open transactions. Explanations for the chart:Support and Resistance Levels are the levels that serve as targets when buying or selling the pair. You can place Take Profit near these levels. Kijun-sen and Senkou Span B lines are lines of the Ichimoku indicator transferred to the hourly timeframe from the 4-hour one. Support and resistance areas are areas from which the price has repeatedly rebounded off. Yellow lines are trend lines, trend channels and any other technical patterns. Indicator 1 on the COT charts is the size of the net position of each category of traders. The material has been provided by InstaForex Company - www.instaforex.com |
| Brainard revived the dollar. Euro falls victim to short positions Posted: 05 Apr 2022 01:19 PM PDT
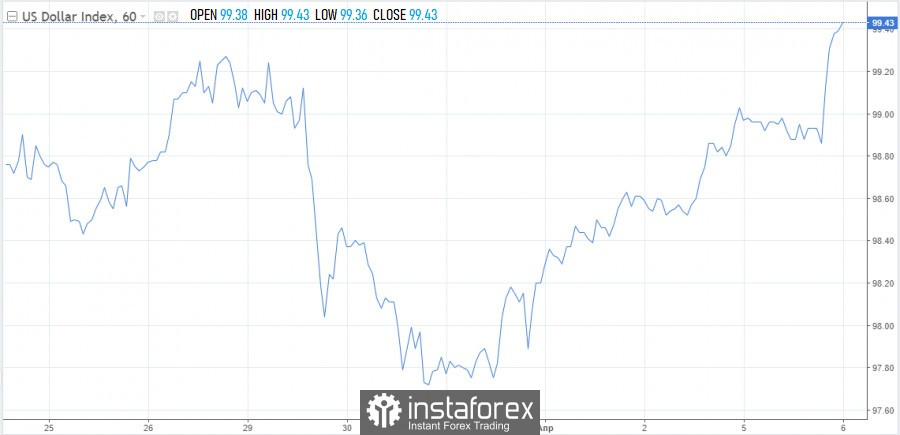
The EUR/USD remains vulnerable as the dollar recovers quickly across the board. The lowest levels since mid-March were broken on Tuesday - first 1.0950, and then 1.0920. The bears have every chance to break through the 1.0900 mark. The US dollar's growth is associated with the fall of treasury bonds and the rapid growth of the yield of 10-year bonds. The figure jumped to 2.56%, the highest level since mid-2019. The dollar index gained almost half a percent of value and traded above 99.40 during the US session. Thus, it could close at its high in almost two years. Up to the round and many times over the past month, there's quite a bit left to the predicted barrier of 100.00. At this rate, it will be reached and broken through in the next sessions.
Markets are more than confident that the Federal Reserve will raise rates by 50bp. They hope to see these signals in the minutes of the last meeting, whose publication is scheduled for Wednesday. Investors drew attention to the rhetoric of the US central bank's officials, which is becoming increasingly harsh. It is the words of Deputy Fed chiefs that pushed up Treasury yields and the dollar index. Lael Brainard announced the readiness of the central bank to take drastic measures if the inflation forecast and inflation expectations indicators suggest the need for such actions. According to her, a rapid reduction in the Fed's balance sheet is possible along with a methodical increase in the base rate. Investors are also closely monitoring further developments in Ukraine. The situation seems to have escalated, and the upcoming Russian-Ukrainian negotiations promise to be difficult. What is happening has affected the mood of the markets. Now the Ukrainian city of Bucha is in the spotlight. The topic risks becoming central at the next auction and having an unpleasant continuation in the form of an economic conflict between Russia and the EU. In addition to the announced sixth package of sanctions, which, according to European officials, could be introduced as early as Wednesday, the EU managed to reach an internal agreement to ban coal imports from Russia. The EU is working on additional sanctions, including on oil imports, European Commission President Ursula von der Leyen said on Tuesday. EUR/USD bears are expected to continue to control the situation amid tensions in Eastern Europe. The course may well continue to suffer losses towards the 1.0800 mark, economists at Scotiabank predict. Support levels are located at 1.0920, 1.0870, 1.0835. Resistances are at 1.1015, 1.1070, 1.1115.
|

| You are subscribed to email updates from Forex analysis review. To stop receiving these emails, you may unsubscribe now. | Email delivery powered by Google |
| Google, 1600 Amphitheatre Parkway, Mountain View, CA 94043, United States | |


Comments