Forex analysis review
Forex analysis review |
- Ripple: breakdown and further sell-offs
- April 29, 2022 : EUR/USD daily technical review and trading opportunities.
- USD/JPY Reaches buying zone
- USD/CHF: uptrend unharmed, more gains ahead
- April 29, 2022 : EUR/USD Intraday technical analysis and trading plan.
- April 29, 2022 : GBP/USD Intraday technical analysis and significant key-levels.
- Global oil market closes the week with spectacular gain
- Trading Signal for Ethereum (ETH/USD) for April 29 - 30, 2022: sell below $3,020 (200 EMA - bearish channel)
- GBP/USD: larger rebound?
- EUR/USD analysis and forecast for April 29, 2022
- Trading Signal for USD/JPY for April 29 - 30, 2022: sell below 130.57 (21 SMA - oversold)
- Cardano forming a bullish wedge pattern.
- Gold bounces towards 38% Fibonacci retracement.
- Ichimoku cloud indicator analysis on EURUSD for April 29, 2022.
- US stock indices show significant growth
- The Dollar index is trading at levels seen back in 2002.
- Technical analysis of EUR/USD for April 29, 2022
- Trading Signal for GBP/USD for April 29 - 30, 2022: buy above 1.2565 (21 SMA)
- Technical analysis of GBP/USD for April 29, 2022
- US premarket on April 29, 2022
- Trading tips for CAD/CHF
- Technical review for GBP/USD: limited growth may take place
- European stock markets grow following Asian and US indices
- Technical review for EUR/USD: price could bounce up, but it will be limited
- USD/CAD: dollar declines
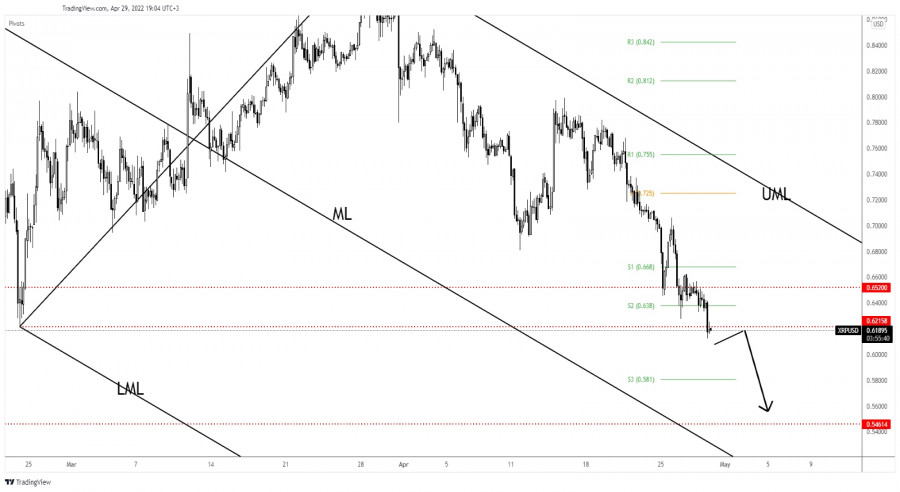
| Ripple: breakdown and further sell-offs Posted: 29 Apr 2022 09:31 AM PDT The price of Ripple extended its downside movement as the price of Bitcoin dropped deeper as well. XRP/USD is traded at 0.6179 level at the time of writing and seems very heavy. BTC/USD's further drop may force the altcoins to drop as well. Ripple dropped by 13.26% from Tuesday's high of 0.7061 to 0.6124 today's low. Technically, the bias is bearish, so more declines are favored. XRP/USD Deeper Drop!
As you can see on the h4 chart, XRP/USD failed to reach and retest the descending pitchfork's upper median line (UML) signaling strong downside pressure. Ignoring 0.6520 indicated a potential drop at least towards the 0.6215 key level. Now, it has dropped below 0.6215 signaling a downside continuation. Still, it remains to see if the altcoin will confirm its breakdown. Only false breakdowns below this downside obstacle may signal a potential rebound. XRP/USD Outlook!Ripple could extend its drop if it stabilizes below the 0.6215 broken support. Staying below it, testing, and retesting it could bring new short opportunities. Personally, I would like to see strong distribution before taking action. The material has been provided by InstaForex Company - www.instaforex.com |
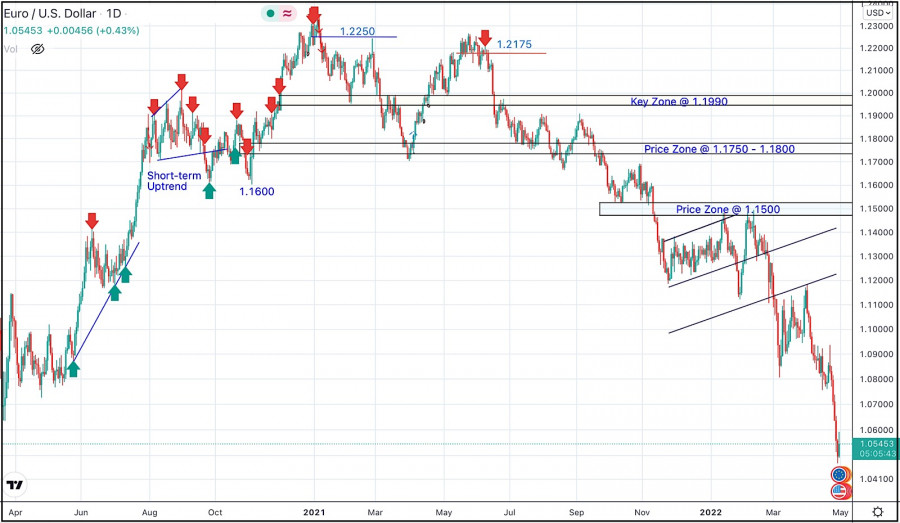
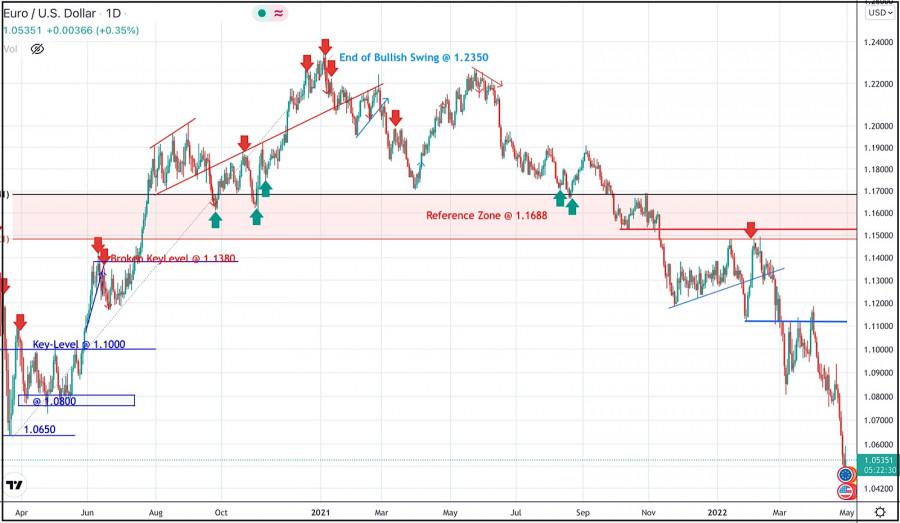
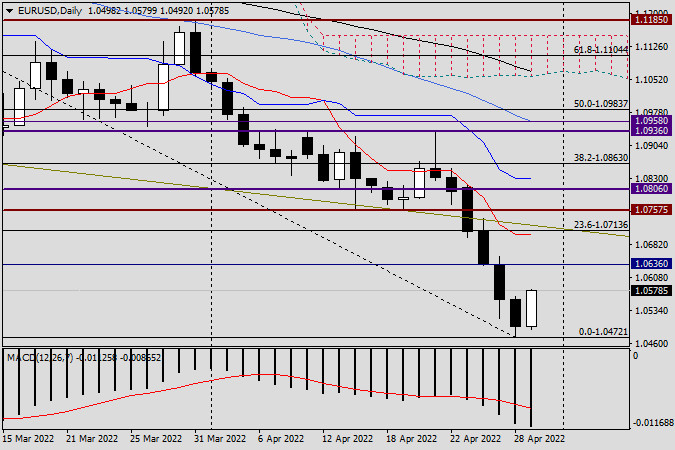
| April 29, 2022 : EUR/USD daily technical review and trading opportunities. Posted: 29 Apr 2022 09:03 AM PDT
In late September, Re-closure below the price level of 1.1700 has initiated downside-movement towards 1.1500 where some recovery was witnessed. Shortly after, Price levels around 1.1700 managed to hold prices for a short period of time before another price decline took place towards 1.1200. Then the EURUSD has temporarily moved-up within the depicted movement channel until downside breakout occurred recently. Since then, the price zone around 1.1500 has applied significant SELLING pressure when a valid SELL Entry was offered upon the previous ascending movement towards it. Shortly after, the EURUSD looked oversold while approaching the price levels of 1.0800. That's where the recent upside movement was previously initiated. That's why, the recent movement towards 1.1200 was considered for another SELL Trade which is already running in profits now. For beginners, the current price levels are too low to have SELL trades around. Hence, intraday BUY trades are considered a better option. Any ascending movement above 1.0600 will probably enable more advancement towards 1.0700 and 1.0850. Otherwise, conservative traders should stay out of the market. The material has been provided by InstaForex Company - www.instaforex.com |
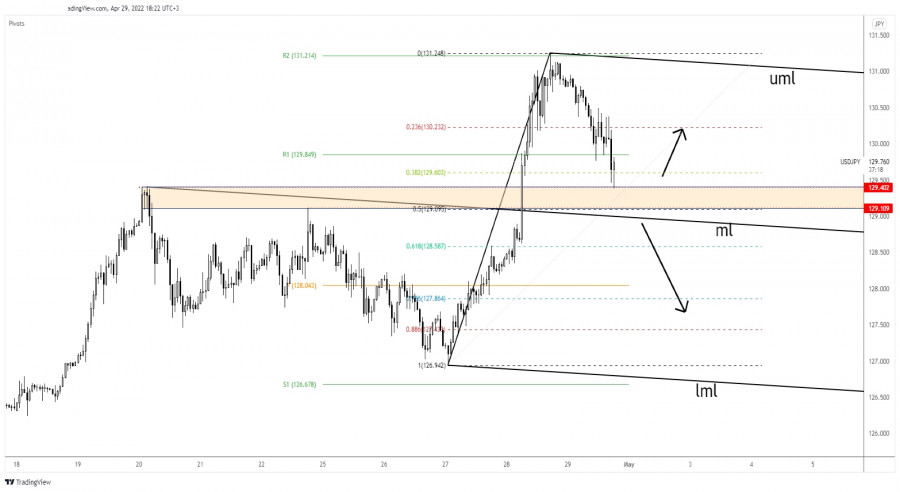
| Posted: 29 Apr 2022 09:02 AM PDT The USD/JPY pair is trading in the green at 129.82 at the time of writing on the H1 chart. The other day, the price was in a corrective phase as the Dollar Index dropped while the Japanese Yen Futures tried to rebound. Technically, the corrective phase could be only a temporary one. USD/JPY could test and retest the immediate support levels before turning to the upside again. Fundamentally, the US data came in mixed. The Revised UoM Consumer Sentiment dropped from 65.7 points to 65.2 points even if the specialists expected a potential growth to 65.8, while Chicago PMI came in at 56.4 points below 62.1 estimates. Personal Income and Personal Spending increased more than expected, while the Core PCE Price Index came in line with expectations. USD/JPY Temporary Correction!
As you can see on the H4 chart, USD/JPY reached 129.40 key level and now it has rebounded. The former high is seen as a downside obstacle (resistance turned into support). As long as it stays above the 129.40 - 129.10 area, the price could develop a new bullish momentum. 129.00 psychological level and the descending pitchfork's median line (ml) represent downside obstacles as well. Only a valid breakdown below these levels could signal that the correction could resume and that an upside continuation could e invalidated. USD/JPY Prediction!Registering only false breakdowns below 129.40 - 129.10 area or developing a strong consolidation above these support levels could announce a new swing higher and could bring buying opportunities. Being located above strong support levels, personally, I will look for buying opportunities with a potential upside target at 131.00 psychological level. The material has been provided by InstaForex Company - www.instaforex.com |
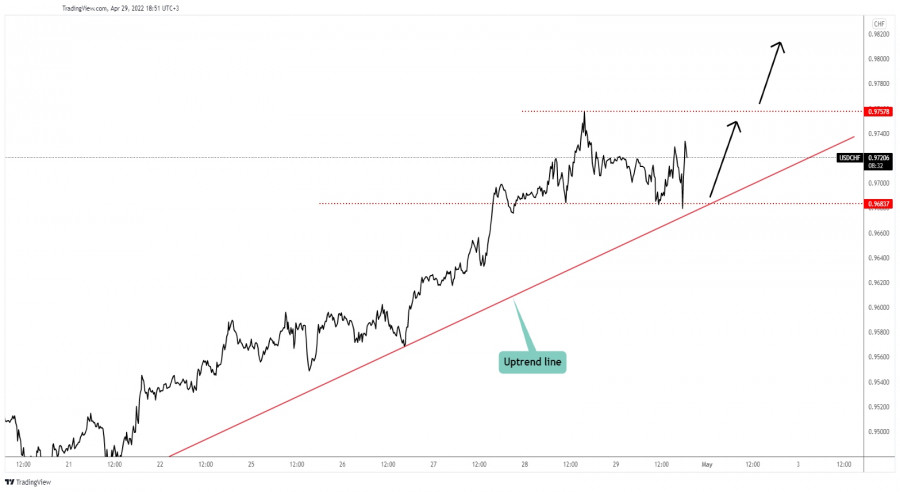
| USD/CHF: uptrend unharmed, more gains ahead Posted: 29 Apr 2022 09:00 AM PDT
USD/CHF Attracts More Buyers!The USD/CHF pair moves somehow sideways above the uptrend line signaling that it tries to consolidate the latest gains and attract more buyers before resuming its upwards movement. As long as it stays above the uptrend line, the price could jump towards fresh new highs. It is trapped between 0.9683 and 0.9757 levels. escaping from this range could bring great trading opportunities. USD/CHF Trading Conclusion!0.9757 yesterday's high is seen as an upside obstacle, as a resistance level. Staying above the uptrend line and jumping above this level may signal further growth. Only dropping below the uptrend line and under the 0.9683 could activate more declines and could invalidate the upside scenario. The material has been provided by InstaForex Company - www.instaforex.com |
| April 29, 2022 : EUR/USD Intraday technical analysis and trading plan. Posted: 29 Apr 2022 08:51 AM PDT
A short- term sideway movement was demonstrated within the highlighted zone around 1.1600 before quick bearish decline could occur towards 1.1200. On the other hand, the price zone around 1.1500 - 1.1600 remained a reference zone that applied significant bearish pressure upon two successive bullish visits before another bearish continuation sign was expressed. Hence, downside movement proceeded towards 1.1000 then 1.0920 where short-term bullish pullback was initiated. The price levels around 1.1150 hindered further bullish movement and another bearish move was aggressively expressed towards 1.0500. Failure to persist below the newly-recorded LOW at 1.0500 will probably enable another bullish pullback at least towards 1.0800 and probably 1.1150. Until then, Intraday traders shouldn't have any BUY trades unless bullish persistence above 1.0650 is achieved first. The material has been provided by InstaForex Company - www.instaforex.com |
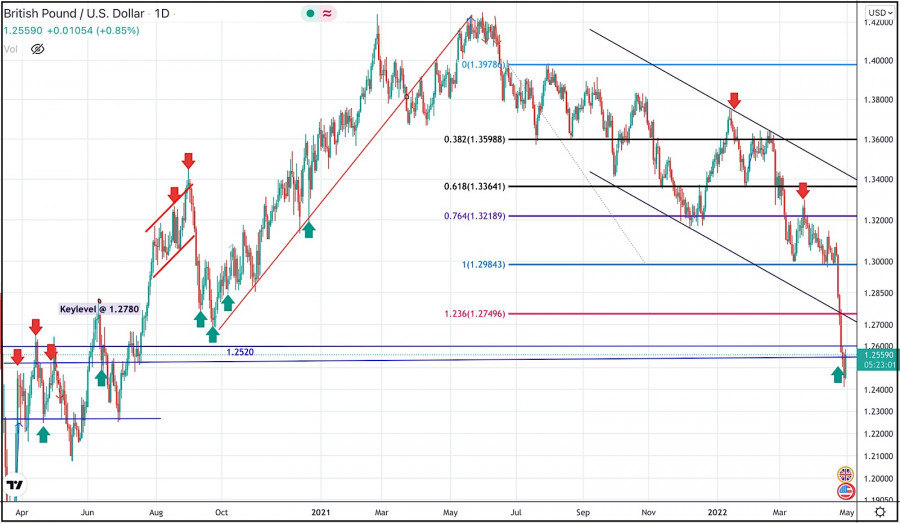
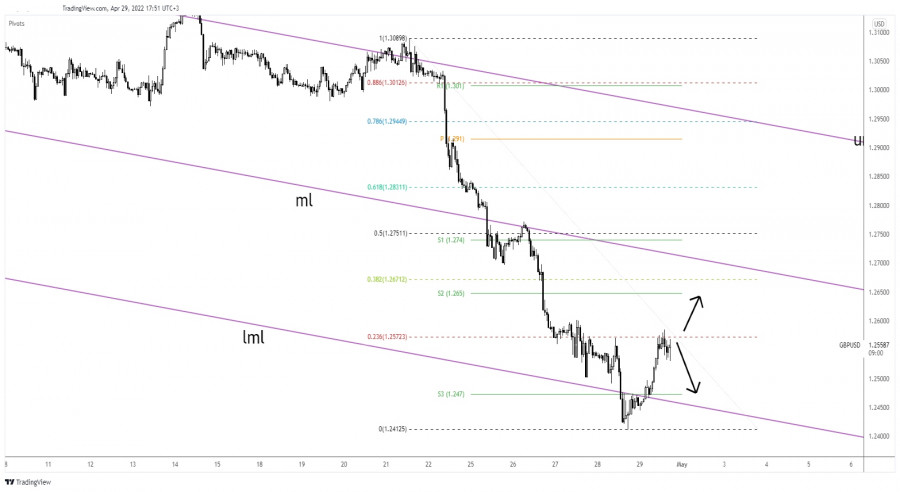
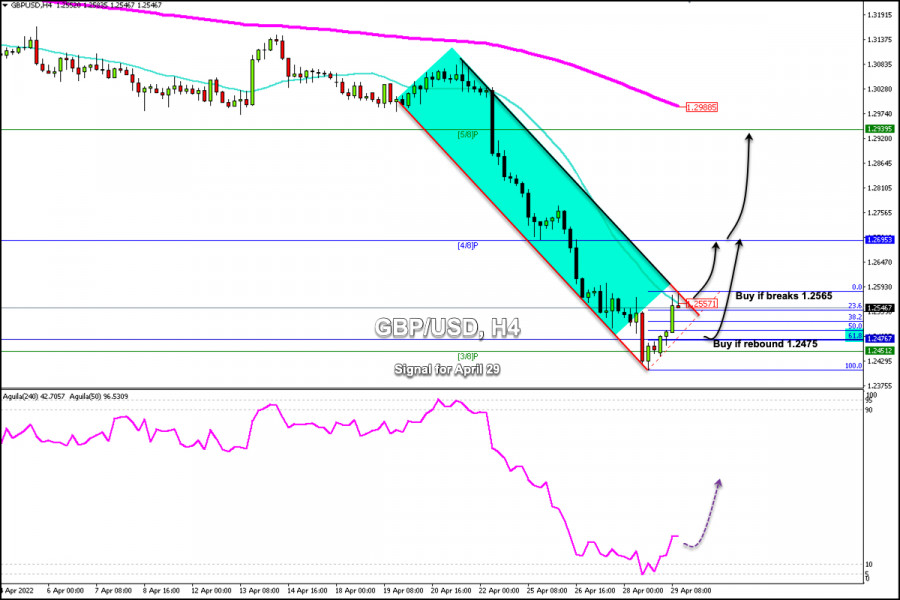
| April 29, 2022 : GBP/USD Intraday technical analysis and significant key-levels. Posted: 29 Apr 2022 08:40 AM PDT
The GBPUSD pair has been moving within the depicted bearish channel since July. Sideway movement was expressed above 1.3600 while the price levels around 1.3730 - 1.3800 were considered as they offered significant bearish rejection. The short-term outlook turned bearish when the market went below 1.3600. This enhanced the bearish side of the market towards 1.3200 which brought the pair back towards 1.3600 for another re-test. Hence, the recent bullish pullback towards 1.3600 should have been considered for SELL trades as it corresponded to the upper limit of the ongoing bearish channel. Shortly after, Bearish persistence below 1.3360 was needed to enable further downside continuation towards 1.2980 - 1.3000. Bullish rejection has arised many times around 1.3000 standing as a significant Daily Support where the previous consolidation range has arised. This happened before another bearish decline could take place earlier this week. Another bearish breakout below 1.2980 has enabled quick bearish extension towards 1.2600-1.2550 where some bullish recovery and probably a sideway movement can be anticipated. On the other hand, bullish breakout above 1.2750 is needed to abolish the short-term bearish scenario and may enable quick bullish advancement towards 1.2980, 1.3300 and probably 1.3600 if sufficient bullish momentum is expressed. The material has been provided by InstaForex Company - www.instaforex.com |
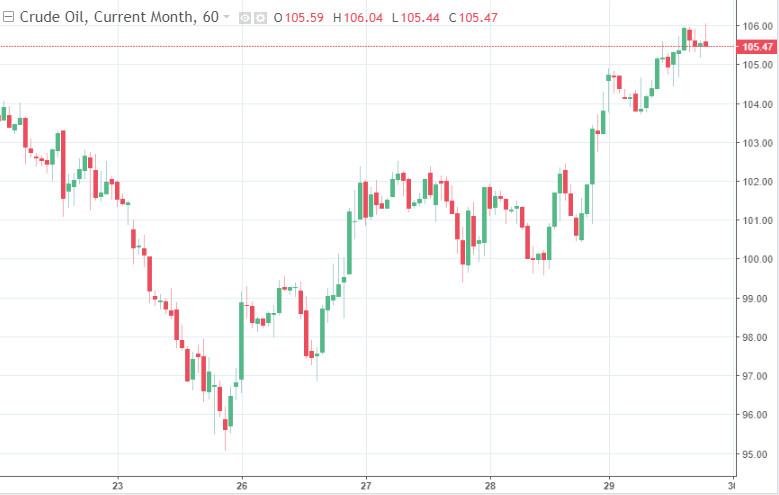
| Global oil market closes the week with spectacular gain Posted: 29 Apr 2022 08:36 AM PDT In trading on Friday, the global price of oil rose permanently. Market participants are concerned about prospects of raw materials shortage due to possible embargo imposed on Russian oil by the European Union states.
At the time of writing, price of futures for Brent crude in July increased by 1.21% up to $108.56 per barrel.Meanwhile, WTI crude futures for June rose by 0.84% to $106.23.Brent has gained 2.8% and WTI added 4.6% since the start of the week.
The main impetus for the rise in oil prices on Friday was the news that the day before German representatives in European Union institutions lifted their objections to an embargo on Russian oil supplies.Previously, Germany had been a key opponent of the decision not to buy energy from Russia. However, Germany's rhetoric later changed after a long and thorough search for alternatives to Russian supplies.This has led to renewed fears on the part of market participants that an embargo on crude oil from Russia could be imposed by all EU members. If this strategy is implemented by the members of the association, the global oil market will inevitably face a shortage of oil.The focus of commodity market participants on Friday is still on the prospects of oil demand change in China. The demand for oil in one of the world's biggest oil-consuming countries has been falling noticeably in recent weeks amid the introduction of tough anti-COVID-19 measures and lockdowns.However, even more worrying for investors is the permanent rise in the number of COVID-19 cases in Beijing.In addition, commodity market participants are awaiting the weekly report on active oil rigs in the United States from US company Baker Hughes. By the way, the number of rigs increased by just one last week to 549. The material has been provided by InstaForex Company - www.instaforex.com |
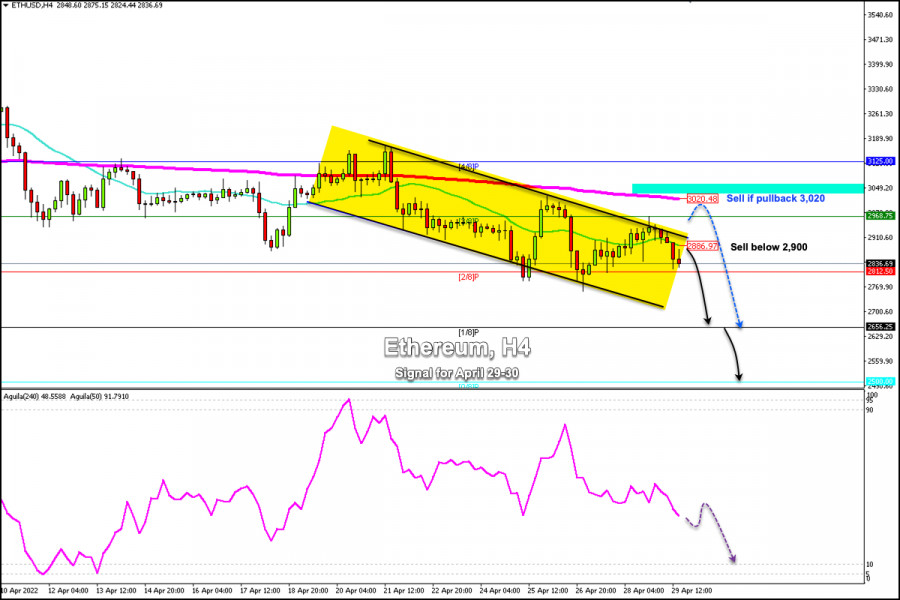
| Posted: 29 Apr 2022 08:30 AM PDT
Ethereum (ETH/USD) is trading below the 21 SMA and below the 200 EMA. As it is below these two moving averages, it means that ETH could continue its downward movement in the coming days and reach 2,656 and the key level of 2,500 (0/8 Murray). According to data from the Ethereum burn tracker, $6.25 billion worth of ETH has been burned so far and has been permanently taken out of circulation. Typically, a drop in the circulating supply of an asset increases buying pressure on exchanges. A reduction in Ether reserves on exchanges could drive up its price amid an increase in demand. However, there are other factors that exert downward pressure on Ether. One of these is the increase in interest rates by the Federal Reserve, which makes investors seek refuge in the dollar and stop investing in risky assets such as cryptocurrencies. The first week of May will be decisive for the cryptocurrency market, since the Fed will announce an increase in its interest rate of 0.50%. This is a crucial factor for the strength of Ether. It could fall towards 2,500 and then rebound and reach the psychological level of $3,000. Conversely, a pullback towards the area of 3,500 could be an opportunity for the bears to sell and hit the target 2,500. According to the 4-hour chart, we can sell below the 21 SMA located at 2,900 with targets at 2,812. In case of a daily close below 2,800, ETH is expected to drop to the support 1/8 Murray around 2,656. If the bearish pressure prevails, it could even reach 0/8 Murray at 2,500. We can see in the chart that since April 18 ETH has been trading within a downtrend channel. Therefore, a pullback towards the 200 EMA around 3,020 will be an opportunity to sell, with targets at 2,656 (1/8 Murray). The eagle indicator is giving a negative signal and any bounce will be seen as an opportunity to continue selling. The material has been provided by InstaForex Company - www.instaforex.com |
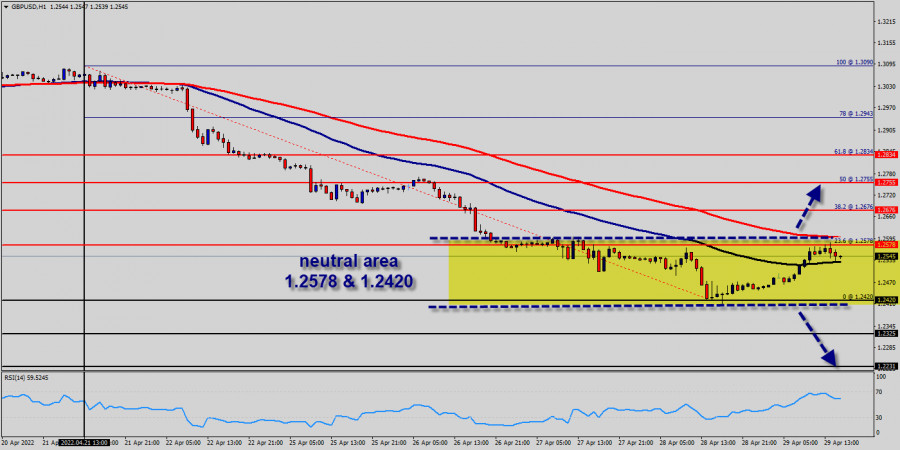
| Posted: 29 Apr 2022 08:20 AM PDT The GBP/USD pair rebounded as USD was punished by the Dollar Index's correction. Still, the throwback could be only a temporary one. After its strong sell-off, the price was expected to rebound and recover. GBP/USD reached a near-term resistance level, it remains to see how it will react as the US reported mixed data today. The Core PCE Price Index rose by 0.3% matching expectations, the Employment Cost Index surged by 1.4% beating 1.1% estimates, while Personal Spending and Personal Income came in better than expected. Unfortunately for the USD, Chicago PMI dropped from 62.9 to 56.4 points, while the revised UoM Consumer Sentiment was reported at 65.2 points below 65.8 expected. GBP/USD Lifted By DXY Drop!
As you can see on the H1 chart, GBP/USD is challenging the 23.6% (1.2572) static resistance. Making a valid breakout above it may signal potential further growth. Registering only false breakouts may signal a new sell-off. After its failure to stabilize below the lower median line (lml) or to reach the 1.2400 psychological level, the GBP/USD signaled that the sellers are exhausted. GBP/USD Forecast!A bullish closure above 1.2585 today's high could confirm further growth and could bring buying opportunities with the first potential target at weekly S2 (1.2648). A new lower low, a bearish closure below 1.2530 could activate a sell-off. The material has been provided by InstaForex Company - www.instaforex.com |
| EUR/USD analysis and forecast for April 29, 2022 Posted: 29 Apr 2022 08:16 AM PDT So the time has come for the last trading day of April. Today is quite an important and difficult day when the market will close monthly and weekly trades, as well as today's session. It should be noted right away that this month the US dollar gave heat and very seriously strengthened against the vast majority of its competitors. However, we will consider the results of the April auction in more detail on Monday, taking into account the actual closing of the ending month. However, it can already be stated that the US dollar is simply unsinkable. Another proof of this conclusion was yesterday's preliminary data on US GDP for the first quarter. If you remember, in yesterday's article on EUR/USD, it was suggested that this indicator may surprise, and it is unpleasant to surprise. The actual value exceeded even the most pessimistic expectations. Let me remind you that according to forecasts, the GDP of the leading world economy was supposed to show growth of 1.1%, the actual figure was minus 1.4%. Such a serious drop in gross domestic product smacks of a recession. Why the indicator turned out to be so weak and fell into the negative zone, economists will still have to figure out. We are now interested in the reaction of the US Federal Reserve System (FRS) to this frankly disastrous report, as well as the steps that the US Central Bank will take at its May meeting. Let me remind you that market expectations are very high and foresee that in May the Fed will raise the federal funds rate by 0.75% at once. However, after yesterday's extremely negative data on US GDP for the first quarter, the "hawkish" attitude and such aggressive intentions may be revised towards a more moderate pace of monetary policy tightening. In this scenario, the "American" risks encountering serious problems and falling under the wave of sales. However, this is not happening yet, and even the failed GDP reports for the first quarter could not prevent the US dollar from continuing its strengthening against the single European currency. Before proceeding to the consideration of price charts, I note that today the baton on GDP reports will be picked up by the eurozone, which will also publish the consumer price index. Quite important indicators will also come from the USA, among which it is worth noting the personal income and expenses of Americans, the basic index of prices for personal consumption, as well as the indices of purchasing managers of Chicago, and consumer sentiment from the University of Michigan. In general, there will be no shortage of fundamental events on the last day of April trading, but whether they can affect the price dynamics of the euro/dollar, the course of trading will already show. Daily
The fact that the market continues, to put it mildly, to be cool about macroeconomic data is clearly shown by the results of yesterday's trading. Ignoring the surprisingly disastrous figures for US GDP, the pair continued to decline and closed Wednesday's trading at 1.0498, that is, just two points below the landmark psychological mark of 1.0500. I think this is very symbolic, since today, on the last day of weekly and monthly trading, the fight will unfold precisely for the closing price relative to this most important level. At the time of writing, the pair is strengthening, and trading is conducted near 1.0540. I fully assume that on the last day of monthly and weekly trading, against the background of profit-taking, the main currency pair will adjust slightly and slightly reduce the losses incurred before. We can assume a rise and attempt to return above another important technical level - 1.0600, but it will not be easy to do this. Given such an ambiguous day as today, I do not recommend opening fresh positions at the end of the month and week. Let them close the auction without us, and we will return to the consideration of the results of today's closing of the month and week on Monday. The material has been provided by InstaForex Company - www.instaforex.com |
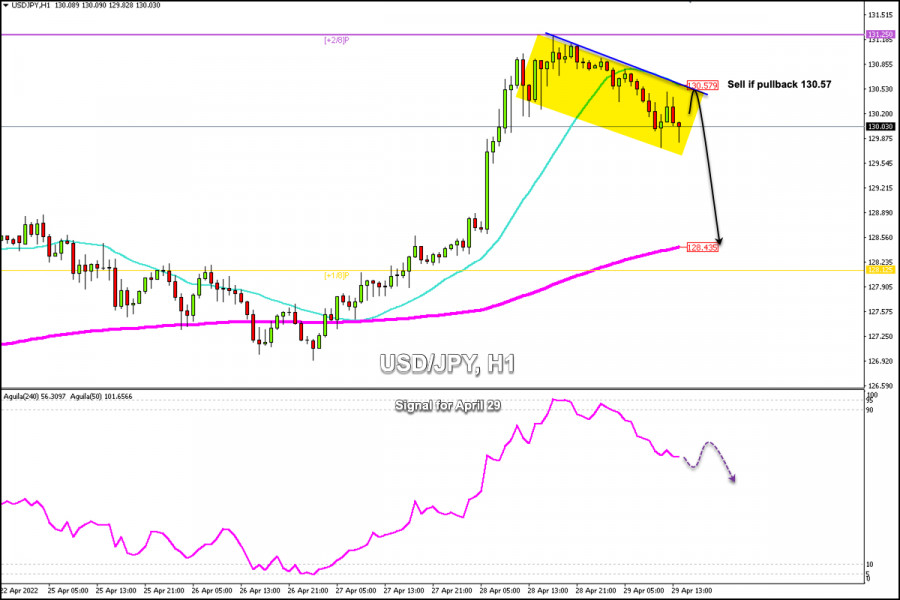
| Trading Signal for USD/JPY for April 29 - 30, 2022: sell below 130.57 (21 SMA - oversold) Posted: 29 Apr 2022 07:32 AM PDT
USD/JPY is trading around the psychological level of 130.00. After having reached the zone +2/8 Murray at 131.25, the Japanese yen is under a technical correction and is now below the 21 SMA located at 130.57. The weakness of the Japanese yen in recent weeks has taken away its status as the safe-haven asset preferred by the market. The US dollar and gold are the assets that investors turn to in the face of any uncertainty. The strength of the US dollar pushed the Japanese yen down. As a result, USD/JPY climbed to a key level of +2/8 Murray at 131.25. According to this indicator, this zone represents an extremely overbought level. Therefore, USD/JPY is expected to make a technical correction in the next few days. The Japanese yen could fall towards the 200 EMA located at 128.43. Another factor that weakened the Japanese yen was the recent announcement by the BoJ that confirmed its dovish monetary policy. The central bank reiterated its commitment to maintaining negative interest rates in the coming months. According to the technical chart, a sharp break below 128.43 could mean a change in the short-term trend and USD/JPY could reach the level of 125.00 (8/8 Murray). According to the 1-hour chart, we can expect a pullback towards the 21 SMA located at 130.57 to sell. On the other hand, as long as the price remains trading below the psychological level of 130.00, we could continue to sell with targets at 129.21 and 128.43 (200 EMA). On April 28, the Eagle indicator reached the extremely overbought zone around 95-points on the 1-hour chart. This is a negative sign that we could expect a technical correction in the Japanese yen in the coming days. Our trading plan is to sell below 131.25 (+2/8 Murray) or below 130.57 (21 SMA), with targets at 129.00 and 128.12 (-1/8 Murray) The material has been provided by InstaForex Company - www.instaforex.com |
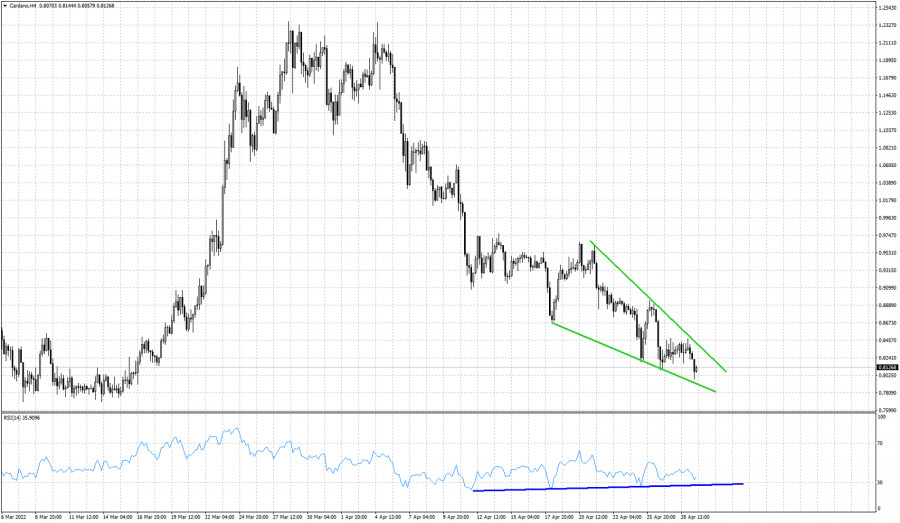
| Cardano forming a bullish wedge pattern. Posted: 29 Apr 2022 07:18 AM PDT Cardano remains in a bearish trend making lower lows and lower highs. Although price is making new lower lows, the RSI is not. The bullish divergence in the RSI justifies a reversal to the upside and a bounce towards $1.
Green lines- bullish wedge pattern Cardano price has formed a bullish wedge pattern with resistance at $0.84. A break above this level combined with the bullish RSI divergence, would be a bullish signal with first target the $1 price level. Until then bears remain in control of the trend. The trend according to the RSI is weakening. That is why traders need to be cautious as a reversal is imminent. The material has been provided by InstaForex Company - www.instaforex.com |
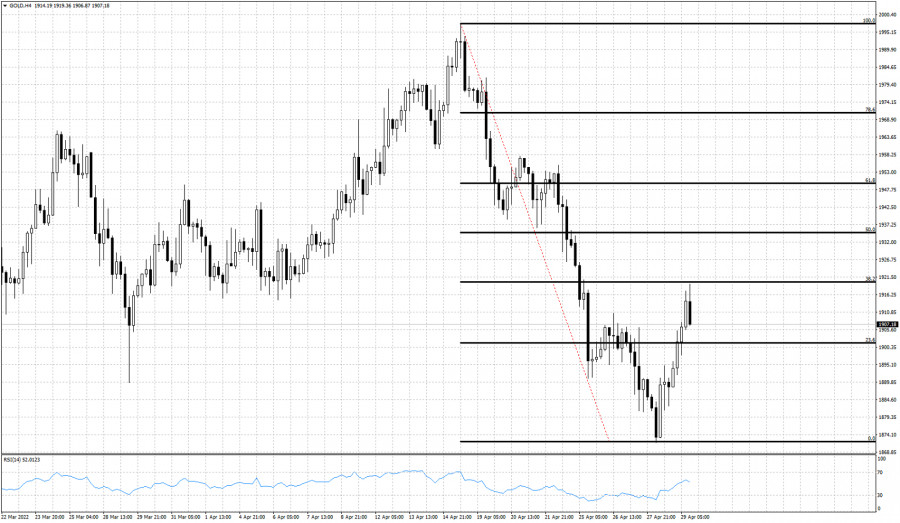
| Gold bounces towards 38% Fibonacci retracement. Posted: 29 Apr 2022 07:15 AM PDT As we explained in yesterday's analysis Gold price justified a bounce higher towards at least $1,908. Today Gold price bounced towards $1,919 where we find the 38% Fibonacci retracement level of the entire decline from $1,997.
Gold price has stopped making lower lows and lower highs. The RSI from oversold levels is turning higher and price stops the bounce exactly at the first key Fibonacci retracement level. If bulls manage to push above the 38% level, we could see another leg higher towards the 61.8% level which is the most important resistance in Fibonacci terms. A pull back towards $1,900 and the formation of a higher low is what bulls are looking for. Recent lows at $1,871 are the closest support. The material has been provided by InstaForex Company - www.instaforex.com |
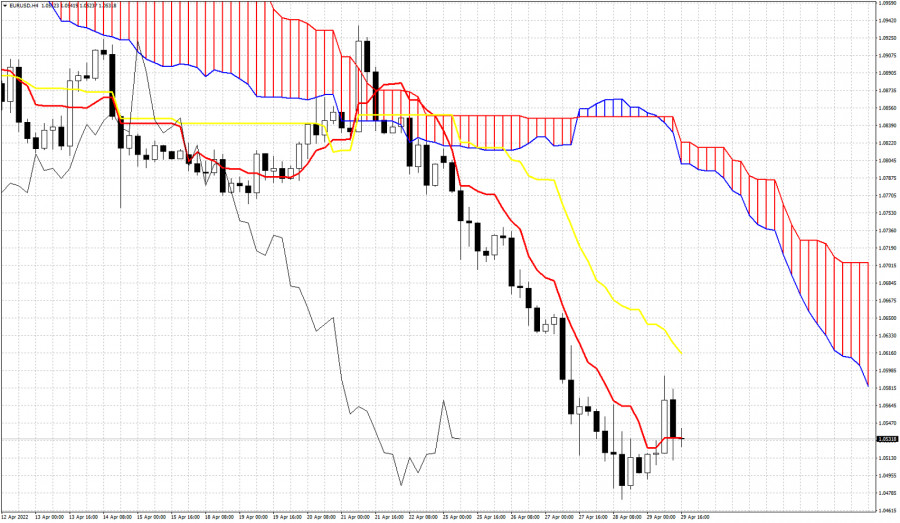
| Ichimoku cloud indicator analysis on EURUSD for April 29, 2022. Posted: 29 Apr 2022 06:55 AM PDT EURUSD as expected by our last analysis bounced towards 1.0563 and a little bit higher. Short-term conditions were oversold and a bounce higher was justified. Today EURUSD reached as high as 1.0593 while now price is trading around 1.0525.
|
| US stock indices show significant growth Posted: 29 Apr 2022 06:50 AM PDT
US stock indices showed significant growth at the close of yesterday's trading. The technology index NASDAQ Composite was the top gainer, adding 3.1%. The S&P 500 rose by 2.5%, while the Dow Jones Industrial Average increased slightly less than others, by 1.8%. At the same time, the S&P 500 and Dow Jones indices demonstrated record growth over the last 2 months. The growth of US indices takes place despite the negative statistical data regarding the country's GDP. Thus, in the first quarter of this year, GDP decreased by 1.4% year on year. Among the reasons for this reduction, experts call the growth of the country's trade deficit, which means that imports significantly exceed exports.At the same time, most analysts believe that this indicator is not a sign of recession. Consumer spending and business investment in the country continue to increase, indicating economic recovery and growth. At the same time, the GDP decline may affect the Fed's decisions on monetary policy, namely interest rate increases. Notably, the May meeting of the Fed will be held next week. According to the latest statistics, the unemployment rate in the US is decreasing. This is shown by a decrease in the number of claims for unemployment benefits by 5,000. The total number of claims has decreased to 185,000, although experts predicted a decrease in this reading to 180,000. The main factor for the growth of US indices was the rise of companies in the technology sector in the country. They show good results in reports for the first quarter.Thus, Meta Platforms increased by 17.6% due to a significant increase in the number of users and even despite the weak results of the first quarter. The number of users grew to 1.96 billion from 1.93 billion. Apple Inc. went up by 4.5% and Amazon.com Inc. increased by 4.7%. McDonald's Corp. managed to increase income in the first quarter of this year by 11%, which was higher than analysts' expectations, its share price increased by 2.9%. At the same time, last quarter, the company incurred expenses totaling $127 million due to the suspension of operations in Russia and Ukraine. Thanks to good reporting that exceeded experts' expectations, Pinterest Inc. gained 13.7% and Southwest Airlines Co. jumped by 2,1%. Twitter Inc.'s 7.5-fold increase in net profits in the first quarter of this year boosted the value of its securities by 1.1%. At the same time, the company expects an acquisition by Elon Musk. Therefore, Twitter does not give any forecasts further for this year. The yield on 10-year US government bonds rose to 2.862% from 2.817% the day before. The increase in energy, in particular oil, had a positive impact on the quotations of energy sector companies. Thus, Brent added 2.2% and reached $107.59 per barrel.At the same time, other global stock exchange indicators are also showing growth. The composite European index STOXX Europe 600 added 0.6%, Asian indicators also increased: China's Shanghai Composite - by 0.6%, Hong Kong's Hang Seng, and Japan's Nikkei 225 - by 1.7% each. The material has been provided by InstaForex Company - www.instaforex.com |
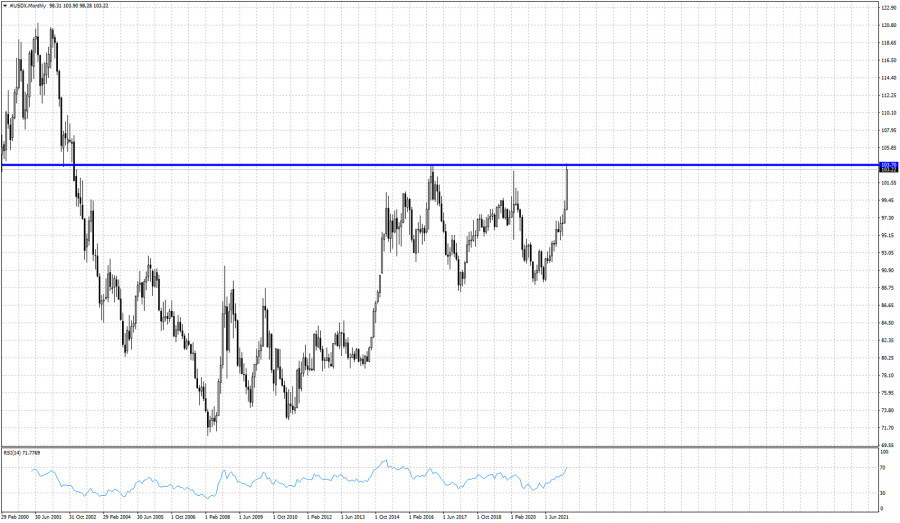
| The Dollar index is trading at levels seen back in 2002. Posted: 29 Apr 2022 06:50 AM PDT With the Dollar index trading above 103, Dollar bulls are in full control as the index is very close to breaking above monthly resistance. This months candle has so far reached as high as 103.90 surpassing the highs of 2016-2017.
The Dollar index is rising in a parabolic pattern. A break out is imminent. Parabolic patterns are very difficult to trade as there are few or none pull backs in bullish trends making it difficult to enter the market and ride the trend. Parabolic patterns are usually followed by very sharp reversals. Traders need to be very cautious. Nevertheless if bulls manage to hold above 103, the Dollar can continue climbing higher. In the short-term a pull back is justified. The material has been provided by InstaForex Company - www.instaforex.com |
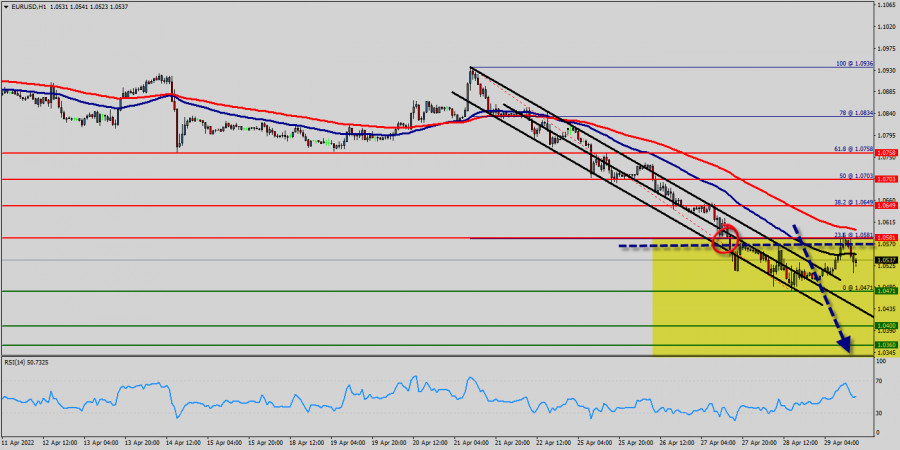
| Technical analysis of EUR/USD for April 29, 2022 Posted: 29 Apr 2022 06:29 AM PDT
Overview : The bulls attempted to test and break above the 1.0581 resistance level but failed. As of now, the EUR/USD pair has three price ranges in the lower timeframe: The first is the 1.0581 band, which the price has already entered now, and is consolidating inside. The EUR/USD pair has faced strong resistances at the levels of 1.0581 because support had become resistance on April, 2022. So, the strong resistance has been already formed at the level of 1.0581 and the pair is likely to try to approach it in order to test it again. However, if the pair fails to pass through the level of 1.0581, the market will indicate a bearish opportunity below the new strong resistance level of 1.0581 (the level of 1.0581 coincides with a ratio of 23.6% Fibonacci). Moreover, the RSI starts signaling a downward trend, as the trend is still showing strength above the moving average (100) and (50). Thus, the market is indicating a bearish opportunity below 1.0581 for that it will be good to sell at 1.0581 with the first target of 1.0471. It will also call for a downtrend in order to continue towards 1.0400. The daily strong support is seen at 1.0400. However, the stop loss should always be taken into account, for that it will be reasonable to set your stop loss at the level of 1.0649. The material has been provided by InstaForex Company - www.instaforex.com |
| Trading Signal for GBP/USD for April 29 - 30, 2022: buy above 1.2565 (21 SMA) Posted: 29 Apr 2022 06:24 AM PDT
GBP/USD recovered part of its weekly losses, driven by the general correction of the dollar and the rise in European stock markets. In the European session, it reached 1.2573 and recovered about 170 pips. It means that a change in trend could occur in the coming days. In just six days of consecutive declines, GBP/USD fell from the psychological level of 1.30 to 1.24. As a consequence, the Fed will raise its interest rate next week. On April 28, GBP/USD bottomed at 1.2410, the lowest level since June 2020. It then began a rebound that accelerated on Friday during the European session, mainly driven by a general decline in the dollar (USDX). Early in the American session, the British pound reached a key resistance zone that coincides with the top of the downtrend channel. This level is the key. A sharp break and a close above 1.2565 could mean a change in trend in the short term and the price could reach 4/8 Murray located at 1.2695. The dollar index (USDX) is falling, having reached 103.92. Today in the American session, the index is bouncing after having reached the low of 102.78. According to the monthly chart, the dollar climbed to a key resistance zone. Therefore in the coming days, we could expect more technical corrections which will set the stage for a recovery of the British pound. According to the 4-hour chart, we can see that the pound is touching a strong resistance around 1.2583. Therefore, in the next few hours, we can expect a technical correction towards the 61.8% Fibonacci located at 1.2476. On the contrary, a daily close above 1.2565 could mean more advance for the pound and in the next week, it could reach the zone of 1.2695 (4/8) and even the zone 5/8 at 1.2939. The eagle indicator is giving a positive signal. Any technical correction will be an opportunity to continue buying. Therefore, as long as GBP consolidates above 3/8 Murray around 1.2451, the outlook remains positive. The material has been provided by InstaForex Company - www.instaforex.com |
| Technical analysis of GBP/USD for April 29, 2022 Posted: 29 Apr 2022 06:18 AM PDT
The GBP/USD pair retreats from earlier lows near 1.2420 amidst some tepid rebound around the bottom price of 1.2420, although the mood around the dollar remains tilted towards the neural side on Friday. The price of 1.2420 demand zone remains the next significant level of support for the GBP/USD pair. Since last week, given the market's bearish momentum and sentiment, another bearish swing towards the 1.2420 support level looks imminent. But today, the trend of GBP/USD pair movement was controversial as it took place in a narrow sideways channel, the market showed signs of instability. Amid the previous events, the price is still moving between the levels of 1.2420 and 1.2578. Also, the daily resistance and support are seen at the levels of 1.2578 and 1.2420 respectively. Therefore, it is recommended to be cautious while placing orders in this area. So, we need to wait until the sideways channel has completed. Yesterday, the market moved from its bottom at 1.2420 and continued to rise towards the top of 1.2578. Today, in the one-hour chart, the current rise will remain within a framework of correction. However, if the pair fails to pass through the level of 1.2578, the market will indicate a bearish opportunity below the strong resistance level of 1.2578 (the level of 1.2578 coincides with the double top too - 23.6% of Fibonacci). Since there is nothing new in this market, it is not bullish yet. Sell deals are recommended below the level of 1.2578 with the first target at 1.2420. If the trend breaks the support level of 1.2420, the pair is likely to move downwards continuing the development of a bearish trend to the level 1.2325 in order to test the daily support 2 (horizontal black line). The material has been provided by InstaForex Company - www.instaforex.com |
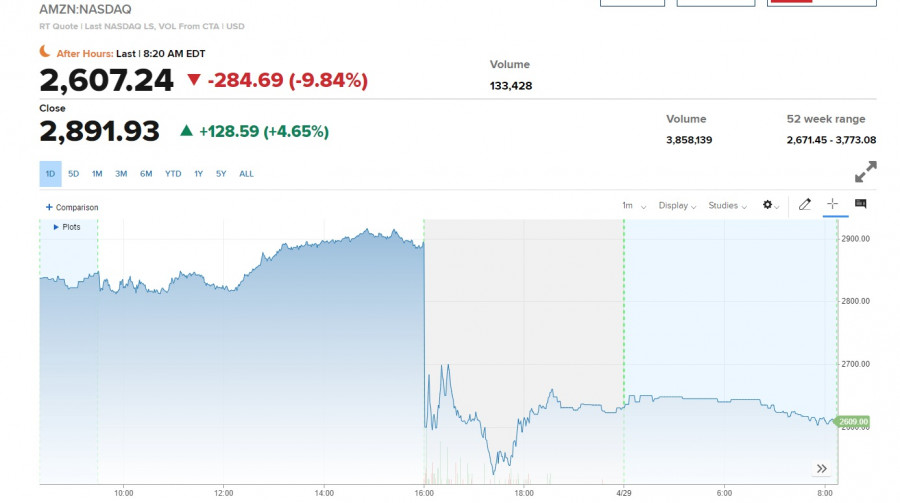
| US premarket on April 29, 2022 Posted: 29 Apr 2022 06:08 AM PDT US stock index futures decreased again on Friday, as quarterly reports of tech companies, including Amazon and Apple, failed to give support to the market and rebuild confidence of traders. Nasdaq 100 futures fell by 1%, while Dow Jones Industrial Average futures lost 119 points or 0.35%. S&P 500 futures declined by 0.71%.
US stock index futures decreased again on Friday, as quarterly reports of tech companies, including Amazon and Apple, failed to give support to the market and rebuild confidence of traders. Nasdaq 100 futures fell by 1%, while Dow Jones Industrial Average futures lost 119 points or 0.35%. S&P 500 futures declined by 0.71%. According to data released by the US Commerce Department on Thursday, US GDP fell by 1.4% year-over-year in the first quarter of 2022 after rising by 6.9% in Q4 2021. Economists expected the US economy to rise by 1%. However, some economists believe the report only illustrates the instability of quarterly GDP calculations, and does not indicate the weak state of the economy or an imminent recession. The Dow Jones gained 614 points or 1.9%, the S&P 500 increased by 2.5%, and the Nasdaq Composite jumped by 3.1%, as market players remained confident in the US economy. This week was full of earnings reports, particularly reports by tech companies, which influenced the mood of investors throughout the week. Furthermore, investors remain concerned about the global economic slowdown, rising inflation, and monetary tightening by the Federal Reserve.Today, core PCE index data by the University of Michigan will be released. The Core PCE is the Fed's main inflation gauge. Furthermore, Exxon Mobil, Chevron, and Philips will publish their quarterly reports. Premarket movers Shares of Amazon lost about 9% during the premarket after the company recorded a $7.6 billion loss on its investment in the EV manufacturer Rivian. Furthermore, Amazon issued weaker than expected revenue guidance for the second quarter. Apple decreased by 2% after CFO Luca Maestri CFO Luca Maestri said that supply chain disruptions could hinder fiscal third-quarter revenue. Maestri's statement overshadowed a strong first-quarter earnings report.
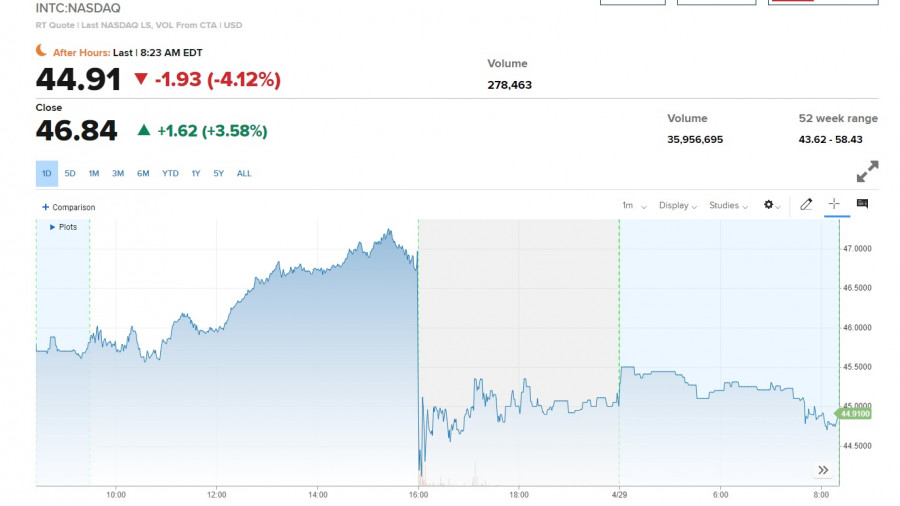
Intel slumped by more than 3%, following a weaker than expected forecast for the second quarter of 2022.
Shares of Robinhood dropped by 11%, as the company reported a wider-than-expected loss, shrinking revenue, and a fall in monthly active users in the first quarter. On the technical side, S&P 500 bulls failed to settle above $4,265 today, resulting in another sell-off. The index needs to rise from the support level of $4,216 to put an end to the bearish sentiment of the past several days. However, such a bullish rally is unlikely to happen on the final trading day of the month. The S&P 500 has barely managed to bottom out near $4,162. If the index settles above $4,265, it could then return to $4,319 and regain $4,376. However, if bearish sentiment returns to the market due to weak US economic data, the S&P 500 could test the support at $4,216 - there are no positive news except for corporate earnings reports. A breakout below $4,216 would push the index towards the lows at $4,162 and $4,113. From there, the S&P 500 could fall towards the lows at $4,085 and $4,057. The material has been provided by InstaForex Company - www.instaforex.com |
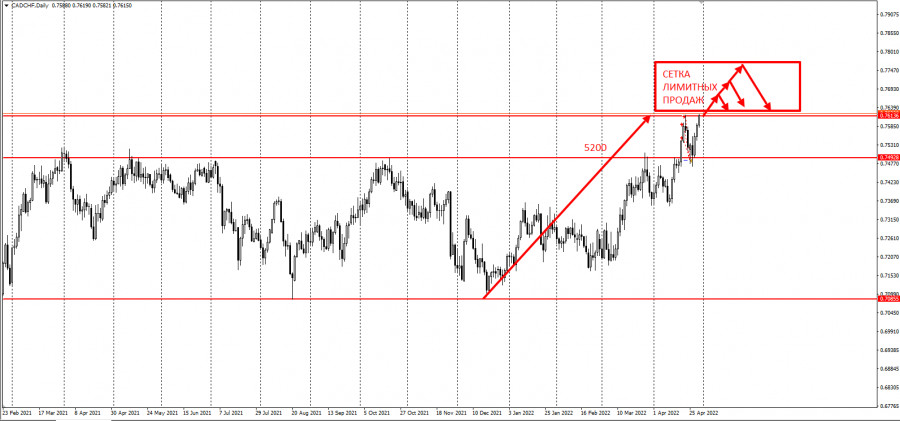
| Posted: 29 Apr 2022 05:27 AM PDT CAD/CHF continues to storm the yearly highs. Today, it also reached a new monthly high of 0.76, which, in the framework of grid trading, calls for sell limits.
So, after the breakdown of 0.76, traders should set up a grid of sell limits in an increment of 500 pips. Take profit on a breakout, either at 1 pip above the first order or after a 1,000 pip rise.This strategy is called grid trading, which is usually used on cross rates. It involves holding positions that are significant in time and distance. For this reason, we recommend using swap-free accounts, not increasing the volumes in the grid (0.01 standard lot for every $ 1000 of the deposit) and monitor price movements.Good luck and have a nice day! The material has been provided by InstaForex Company - www.instaforex.com |
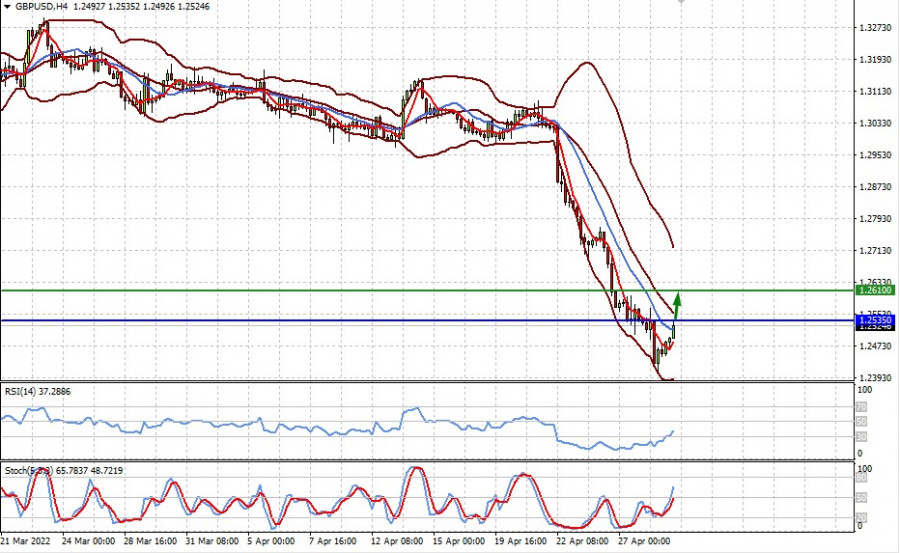
| Technical review for GBP/USD: limited growth may take place Posted: 29 Apr 2022 05:23 AM PDT GBP/USD found support at 1.2420 ahead of the Fed meeting next week. Also, limited growth may take place amid the closure of some dollar positions in the wake of a technical rebound.Technical picture:The quote is above the middle line of the Bollinger indicator, above SMA 5 and SMA 14. Meanwhile, the relative strength index (RSI) has left the oversold zone, while the stochastic indicator is growing steadily and is above 50%.Possible dynamics:The pair may climb to 1.2610 after rising above 1.2535.
|
| European stock markets grow following Asian and US indices Posted: 29 Apr 2022 05:16 AM PDT On Friday, key European indices are showing spectacular gains thanks to overall optimism in global markets. In addition, investors are analyzing fresh statistics and financial reports from EU companies. At the time of writing, the composite index of the leading European companies STOXX Europe 600 increased by 1.04% to 451.71. The strong leader in the STOXX Europe 600 index today was the UK chemical company Johnson Matthey PLC, which has already soared by 19.4% since the beginning of the trading session. Meanwhile, the French CAC 40 rose by 0.89%, the German DAX increased by 1.0%, and the British FTSE 100 jumped by 0.1%. French liquor producer Remy Cointreau SA soared by 3.3%. In Q4, the company's revenue decreased by 1%, while the final reading was higher than preliminary market forecasts. Shares of Italian oil and gas company Eni SpA rose by 1.1% after a 4.2-fold increase in profits in the first quarter was reported. The main reason for the company's strong financial results was a significant rise in oil and gas prices. The capitalization of Danish pharmaceutical company Novo Nordisk AS soared by 4.8%. In the first quarter, the manufacturer expanded its buyback program and increased net profit above market expectations. The share price of the British-Swedish pharmaceutical company AstraZeneca Plc dropped by 0.3%. In the first quarter of 2022, the net profit of the well-known vaccine developer sagged by 75%. At the same time, the volume of revenues increased by more than 1.5 times. Yesterday US stock indices reported robust growth. Earlier on Friday, key indicators of Asia-Pacific markets also showed strong gains. There is spectacular growth in other world markets as well. Thus, the cost of oil is increasing by more than 1%, and the euro is rapidly strengthening against the US dollar. On Friday, investors are closely watching the EU macro statistical indicators. According to the first estimates, in the first quarter, the gross domestic product of 19 eurozone countries increased by 5% on a yearly basis. Meanwhile, at the end of April, the annual inflation rate in the euro area rose to 7.5% from 7.4% in March, and the level of consumer prices soared by 0.6%. At the same time, analysts forecasted that inflation would remain at the levels of the previous month. The material has been provided by InstaForex Company - www.instaforex.com |
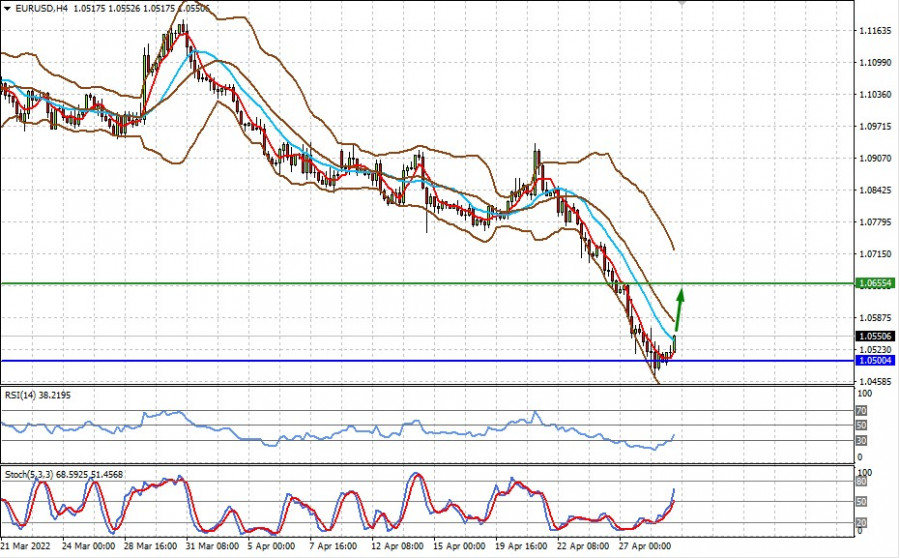
| Technical review for EUR/USD: price could bounce up, but it will be limited Posted: 29 Apr 2022 05:14 AM PDT EUR/USD found support at 1.0500 ahead of the Fed meeting next week and the release of reports on EU CPI and Germany's 1st quarter GDP. If inflation shows a slowdown and German GDP comes out in line with expectations, then the pair is likely to extend its rebound despite the possibility that the ECB will not raise rates in May.Technical picture:The quote is below the middle line of the Bollinger indicator, above the SMA 5 and SMA 14. Meanwhile, the relative strength index (RSI) has left the oversold zone, while the stochastic indicator is growing steadily and is above 50%.Possible dynamics:The pair may rise to 1.0655.
|
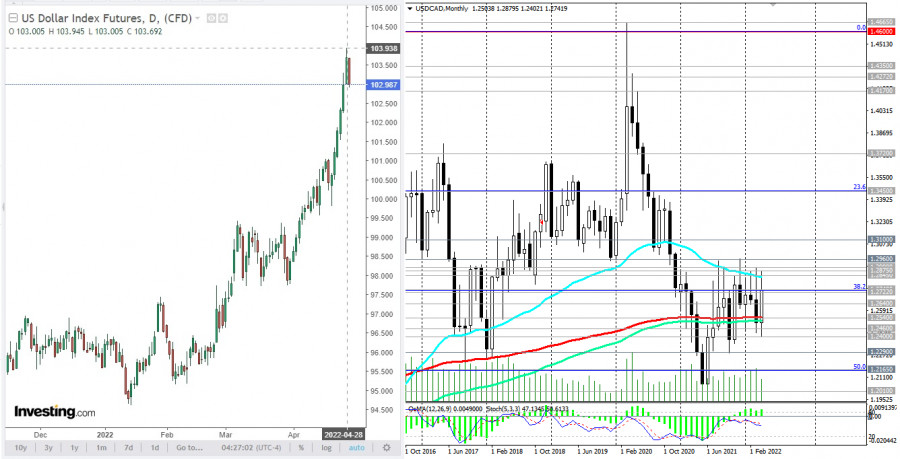
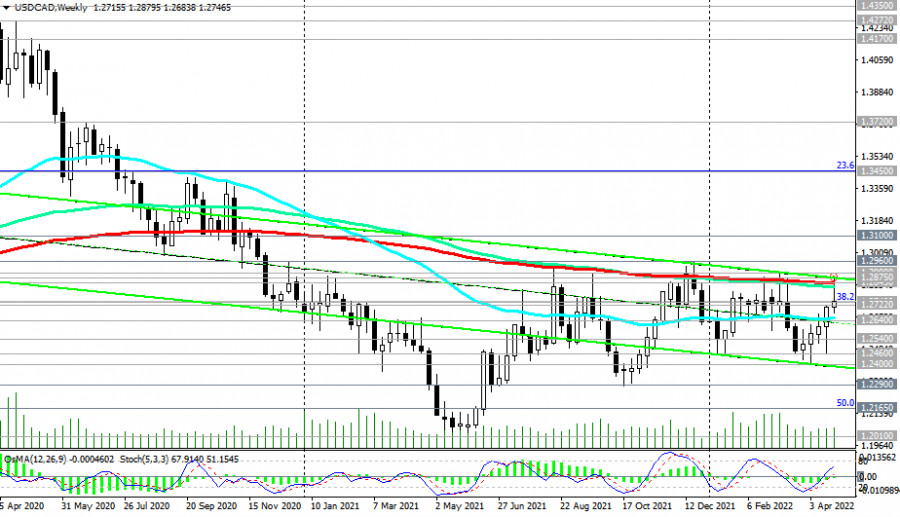
| Posted: 29 Apr 2022 04:54 AM PDT Having reached a new 2-year high of 103.94 on Thursday, the DXY dollar index is declining today. As of this writing, DXY futures are trading 100 pips lower near 102.94.
The dollar began to gradually weaken on Thursday, after the publication of data on US GDP. According to the Bureau of Economic Analysis, a preliminary estimate indicated a decline in GDP in the 1st quarter (1.4% against the forecast for growth of 1.1% and after growth in the 4th quarter of 2021 by 6.9%). GDP data is one of the key data (along with labor market and inflation data) for the Fed in terms of its monetary policy, and the weaker estimate is likely to alert market participants to the Fed's determination to pursue a tighter monetary policy. At the same time, the Fed's preferred personal consumption expenditure price index and the GDP price index (for the 1st quarter) came out with an increase in indicators, and above the forecast: 7% and 8%, respectively, against 6.4% and 7.1% in the previous quarter. The data once again indicate that the Fed is in a difficult situation – to cope with accelerating inflation without harming, at the same time, the economic recovery. Today, on the last trading day of the week and month, investors will pay attention to the publication at 12:30 and 14:00 (GMT) of another block of important macro statistics for the United States, among which is the core personal consumption expenditure price index (PCE) for April (Fed uses the annual core PCE price index as the main indicator of inflation) and the final estimate of the University of Michigan consumer confidence index. This indicator reflects the confidence of American consumers in the economic development of the country. A high level indicates growth in the economy, while a low level indicates stagnation. The preliminary estimate was 65.7 (after 59.4 in March, 62.8 in February, 67.2 in January 2022, 70.6 in December, 67.4 in November, 71.7 in October, and 72.8 in September 2021). The final score is 62.0, which may also have a negative impact on the dollar. Also at 12:30 (GMT), Statistics Canada is to release its February GDP report. GDP is considered an indicator of the overall health of the Canadian economy, and is expected to grow by 0.8% (from 0.1% in December and 0.2% in January). The relative growth of the indicator may support the quotes of the Canadian dollar, including in the USD/CAD pair. Today, against the backdrop of a weakening USD, the USD/CAD pair is declining, trading near the 1.2745 mark as of this writing. Overall, it can be said that USD/CAD is trying to fully restore the long-term trend, strengthening from the lows near 1.2000, reached in May 2021.
Above the 1.2540 support level, it is still a bull market. A breakout of USD/CAD into the zone above the resistance level of 1.2845 will mean the final completion of the downward correction and exit, so to speak, "to operational space" for further growth. However, there are also nuances here. As you know, in April, the Bank of Canada decided to raise the interest rate by 0.50% (to 1.0%), which is a positive factor for CAD, which, by the way, is included in the basket of 6 major currencies of the dollar index (DXY), amounting to approximately 9.1% (the euro accounts for 57.6%). "With the economy moving into excess demand and inflation persisting well above target, the governing council judges that interest rates will need to rise further," the BOC said, adding that the timing and pace of further interest rate hikes will depend on incoming economic data. Inflation in the country accelerated to a thirty-year high. In February 2022, consumer prices in Canada rose by 5.7% in annual terms after rising by 5.1% in January. This is the highest figure since August 1991. Most economists expect the key interest rate to reach 2% by the end of 2022, compared to expectations of 1.75%-2.0% of the Fed rate by the end of the year, with a 0.25% increase at each meeting. Thus, the monetary policy parameters of the BOC run almost in parallel with the monetary policy parameters of the Fed. At the same time, inflation in Canada is still less than in the US, and rising oil prices provide strong support to the quotes of the Canadian currency. Conclusion: the Canadian dollar is a serious competitor to the US dollar, which is likely to be taken into account by long-term investors. The material has been provided by InstaForex Company - www.instaforex.com |


| You are subscribed to email updates from Forex analysis review. To stop receiving these emails, you may unsubscribe now. | Email delivery powered by Google |
| Google, 1600 Amphitheatre Parkway, Mountain View, CA 94043, United States | |


Comments