Forex analysis review
Forex analysis review |
- How to trade GBP/USD on June 10? Simple tips for beginners.
- EUR/USD. The ECB did not become an ally of the euro: the market ignored the hawkish signals
- How to trade EUR/USD on June 10? Simple tips for beginners.
- The euro was not surprised by anything
- Results of the ECB's June meeting
- June 9, 2022 : EUR/USD daily technical review and trading opportunities.
- June 9, 2022 : EUR/USD Intraday technical analysis and trading plan.
- June 9, 2022 : GBP/USD Intraday technical analysis and significant key-levels.
- European stocks decline as ECB decision paves way for rate hikes
- Technical analysis of GBP/USD for June 09, 2022
- Technical analysis of EUR/USD for June 09, 2022
- Bitcoin volatility is rising amid increased trading activity
- USD/JPY pair updated a 20-year price high and is not going to stop
- Bitcoin Extends Its Sideways Movement
- GBP/USD Minor Range In Play
- European stocks fall steadily
- Is USD/JPY Swing Higher Over?
- Trading plan for Ethereum for June 09, 2022
- GBP/USD analysis on June 9. This week, only the US inflation report remains.
- Trading Signal for Gold (XAU/USD) on June 9-10, 2022: buy in case of rebound off at $1,840 or break of $1,852 (3/8 Murray
- Trading plan for Bitcoin for June 09, 2022
- Gold likely to drop lower
- EUR/USD analysis for June 09, 2022 - Breakout of the consolidation to the downside
- Bitcoin: growing acceptance of crypto and extreme fear in market
- Trading plan for Silver for June 09, 2022
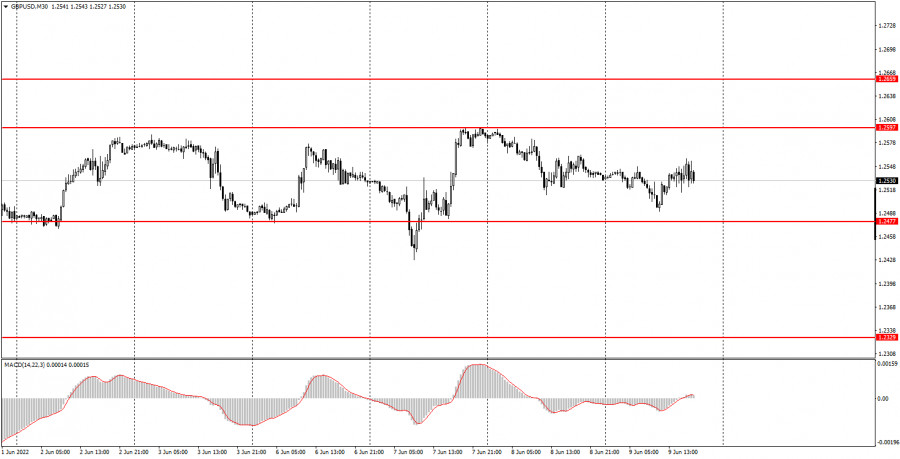
| How to trade GBP/USD on June 10? Simple tips for beginners. Posted: 09 Jun 2022 02:54 PM PDT Analysis of Thursday's deals:30M chart of the GBP/USD pair
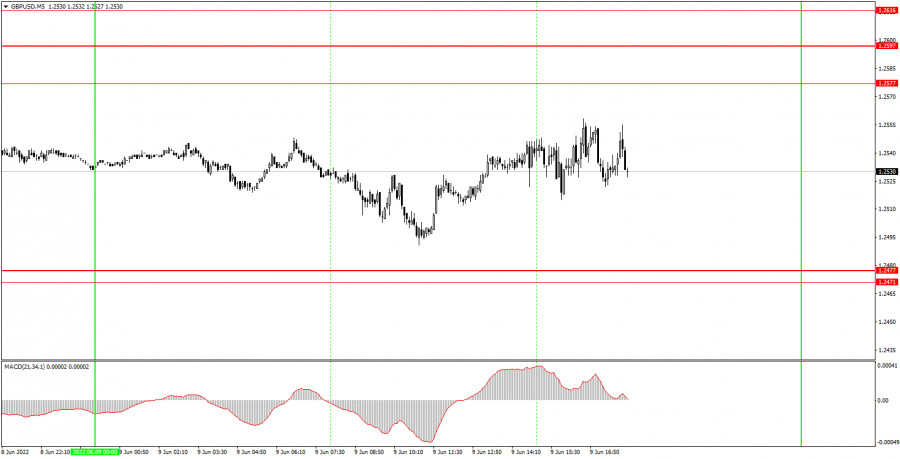
The GBP/USD pair showed very weak volatility on Thursday - only 67 points. This is very little for the pound, but, on the other hand, there were no important events during the day. Thus, everything is natural. If the pair should leave the horizontal channel, then obviously it wouldn't be today. Consequently, the technical picture has not changed at all over the past day. The pound is also not far from its local highs and not far from its 2-year lows. Therefore, from the current positions, it can easily and simply continue to grow, or it can just as easily and simply resume the global downward trend. We would like to say that everything will depend on macroeconomic statistics, but this is not so. Macroeconomic reports have only a small, local impact on the pair's movement. Everything will depend on the mood of traders. In the meantime, the flat remains, so you need to trade the pair with this in mind. 5M chart of the GBP/USD pair
The movement was very bad on the 5-minute timeframe. There was not even an intraday trend, so it was very difficult to trade. In addition, the price constantly changed its direction of movement during the day and was located clearly in the middle of the horizontal channel. Fortunately, not a single trading signal was formed during the day, so the pair did not even approach any of the borders, so novice traders did not have to open deals. The European Central Bank meeting, its results and Christine Lagarde's speech at the press conference had nothing to do with the pound and the dollar. Therefore, the movement, as in the European currency, did not happen. We also note that there are practically no local levels inside the horizontal channel, so beginners can only count on working out the boundaries of the horizontal channel and generating signals around them. How to trade on Friday:The upward trend is formally canceled on the 30-minute timeframe, however, the pair continues to remain close to its local peaks, which are located near the level of 1.2659. At this time, the pair is not exactly inside the horizontal channel at 1.2477-1.2597, and only an exit from it will signal the end of the flat. Moreover, overcoming any of the boundaries cannot guarantee the end of the flat. The traffic is very strange right now. On the 5-minute TF, it is recommended to trade at the levels 1.2371, 1.2471-1.2477, 1.2577, 1.2597-1.2616, 1.2659-1.2674. When the price passes after opening a deal in the right direction for 20 points, Stop Loss should be set to breakeven. No important events are scheduled for Friday in the UK, while an important inflation report will be published in the US, which might push traders to become more active. A secondary consumer sentiment report from the University of Michigan will also be released later in the evening, but this report can only trigger a market reaction if its value is very different from the forecast. In general, even the inflation report may not provoke a strong movement if its value does not differ from the forecast of 8.3% y/y. Basic rules of the trading system:1) The signal strength is calculated by the time it took to form the signal (bounce or overcome the level). The less time it took, the stronger the signal. 2) If two or more deals were opened near a certain level based on false signals (which did not trigger Take Profit or the nearest target level), then all subsequent signals from this level should be ignored. 3) In a flat, any pair can form a lot of false signals or not form them at all. But in any case, at the first signs of a flat, it is better to stop trading. 4) Trade deals are opened in the time period between the beginning of the European session and until the middle of the American one, when all deals must be closed manually. 5) On the 30-minute TF, using signals from the MACD indicator, you can trade only if there is good volatility and a trend, which is confirmed by a trend line or a trend channel. 6) If two levels are located too close to each other (from 5 to 15 points), then they should be considered as an area of support or resistance. On the chart:Support and Resistance Levels are the Levels that serve as targets when buying or selling the pair. You can place Take Profit near these levels. Red lines are the channels or trend lines that display the current trend and show in which direction it is better to trade now. The MACD indicator (14,22,3) consists of a histogram and a signal line. When they cross, this is a signal to enter the market. It is recommended to use this indicator in combination with trend lines (channels and trend lines). Important speeches and reports (always contained in the news calendar) can greatly influence the movement of a currency pair. Therefore, during their exit, it is recommended to trade as carefully as possible or exit the market in order to avoid a sharp price reversal against the previous movement. Beginners on Forex should remember that not every single trade has to be profitable. The development of a clear strategy and money management are the key to success in trading over a long period of time. The material has been provided by InstaForex Company - www.instaforex.com |
| EUR/USD. The ECB did not become an ally of the euro: the market ignored the hawkish signals Posted: 09 Jun 2022 02:54 PM PDT The European Central Bank, following the results of the June meeting, kept interest rates at the same level, thus justifying the forecasts of most experts. And although some analysts still allowed a 25-point hike at this meeting, they were in a clear minority - the ECB (especially in its current composition) is too inert and predictable for such an unexpected step. Therefore, traders initially completely ignored the preservation of the status quo by the ECB. This scenario was too expected. At a press conference, ECB President Christine Lagarde voiced the already familiar rhetoric, without deviating from the "general" line. By and large, the main message of the June meeting was recorded in the text of the accompanying statement. Members of the Board of Governors indicated that the central bank intends to raise interest rates by 25 basis points at the July meeting after the completion of the APP asset purchase program - that is, after July 1 (the next meeting of the ECB is scheduled for July 21).
The voiced script was also widely anticipated. It was repeatedly voiced by Lagarde last month, commenting on inflationary trends. Meanwhile, some of her colleagues tightened their rhetoric significantly after the release of the May inflation report, which reflected the growth of the general CPI in the eurozone to 8.1% and the core index to 3.8%. Representatives of the "hawk wing" of the ECB started talking about the need to raise the deposit rate by half a percentage point at once - at the July or September meeting. In the run-up to the June meeting, hawkish expectations intensified: rate futures quotes showed that the market estimated a 50% chance of a 50 basis point increase in the rate by the ECB at the July meeting. At the June meeting, the central bank was supposed to prepare the markets for such a decisive step. But the ECB once again confirmed its reputation, showing excessive caution and prudence. Of course, the central bank demonstrates indecisiveness "not from a good life." Such behavior is to some extent justified by objective circumstances. According to economists interviewed by the Financial Times, Lagarde faces a super-difficult task: on the one hand, the ECB must regain control over prices, extinguishing a jump in inflationary growth. On the other hand, the central bank should not provoke a panic in the bond markets of the most vulnerable EU countries. On one side of the scale - the fight against inflation, on the other - the risk of recession. The central bank is forced to maneuver "between the raindrops", excluding the most radical scenarios. It is noteworthy that Lagarde actually did not rule out the hypothetical possibility of a 50-point rate hike following the results of the September meeting. But she did it in a vague manner, not allowing EUR/USD bulls to "grab" this hawkish signal. So, answering the question of why the ECB announced a 25-point rate increase in July, the head of the ECB said that it is "good practice" to start a cycle of raising interest rates with a gradual increase - "significant, but not excessive." A little later, during a press conference, she developed this idea. According to her, the calibration of the rate hike will depend on the updated medium-term inflation forecast: "if the medium-term inflation forecast remains or worsens, it would be appropriate to increase the growth at the September meeting." However, the market "did not hear" this signal. Hawkish sentiment increased significantly ahead of the June meeting - this began to unwind after the release of data on the growth of May inflation in the eurozone. Therefore, EUR/USD bulls drove themselves into a trap: for the development of the upward trend, they needed not a hawkish scenario, but an "ultra hawkish" one. For example, if the ECB, contrary to all forecasts, would raise the rate at the June meeting by 25 points, while pledging to increase it by September to 0.25%. Or if the central bank "plain text" announced a 50-point increase at the September meeting. In this case, the euro has significantly strengthened its position throughout the market, and the EUR/USD pair would not be an exception here. Whereas the scenario implemented today disappointed the bulls. Too cautious, too predictable and too vague. As a result of the press conference, traders tried to approach the resistance level of 1.0760, but this impulse was initially doomed to failure. The single currency did not receive the necessary support, so the price slowed down its growth, not even approaching the above price barrier. The bears seized the initiative, who were trying to overcome the support level, located at around 1.0640 (the middle line of the Bollinger Bands indicator on the daily chart). Thus, the ECB did not become an ally of EUR/USD bulls. Now the question is whether US inflation will become an ally of the dollar. If tomorrow's report is in the green zone, then bearish sentiment for the pair will increase significantly, allowing bears to return to the area of the 5th figure. Therefore, it is advisable to open short positions after consolidating under the support level of 1.0640. Long positions in the current conditions of a fundamental nature, in any case, look extremely risky. The material has been provided by InstaForex Company - www.instaforex.com |
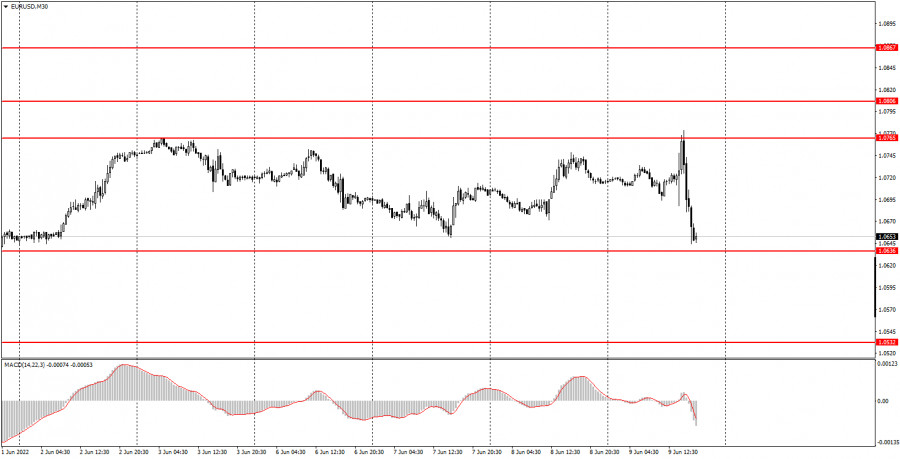
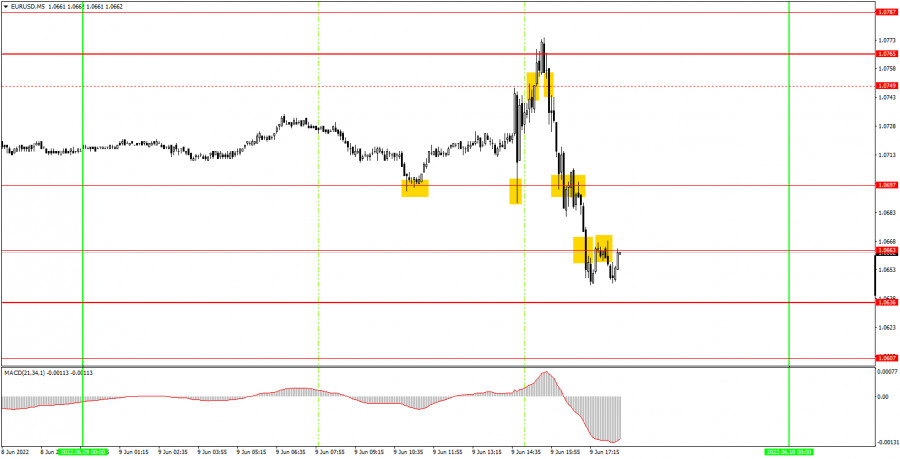
| How to trade EUR/USD on June 10? Simple tips for beginners. Posted: 09 Jun 2022 02:54 PM PDT Analysis of Thursday's deals:30M chart of the EUR/USD pair
The EUR/USD currency pair continued to trade in the same horizontal channel on Thursday. The only change on the 30-minute timeframe is that we moved the upper border of the channel a little higher, to the level of 1.0765. Now this border is almost perfect, as it passes through two price peaks at once. Today's volatility was very high - more than 130 points. However, there is absolutely nothing to be surprised about here. Firstly, the pair still remained inside the horizontal channel. Secondly, such a movement was provoked by the European Central Bank meeting and the announcement of its results. I would like to note right away that, from our point of view, the market worked out the results absolutely illogically. But the results themselves were twofold. The ECB did not raise any of the rates, but announced the end of the APP stimulus program from July 1, and also announced rate hikes in July and September. Considering that no one expected the ECB to raise the rate in June, we can say that the results turned out to be hawkish. Therefore, they had to support the European currency. However, the euro grew only at the beginning, and then stumbled upon the level of 1.0765 and fell. 5M chart of the EUR/USD pair
The technical picture on the 5-minute timeframe looks quite complicated due to the movements that were provoked by the results of the ECB meeting. As you can see in the chart above, for most of the European trading session, the pair moved quite calmly and even formed a good buy signal near the level of 1.0697. Further, volatile movements began, the direction of which could not be predicted. First, the pair rose to the level of 1.0749, then collapsed to 1.0697, then rose again to 1.0749 and overcame it, and then collapsed by 130 points. Thus, there is no need to talk about any clear and unambiguous reaction to the results of the ECB meeting. Therefore, all trading signals that formed after this event should have been ignored. Even the latest signals, during which the fundamental background no longer had such a strong impact on the pair. Consequently, only the very first signal could be worked out, which had to be closed manually before the announcement of the results of the central bank's meeting. Profit on this deal amounted to 25-35 points. How to trade on Friday:The pair continues to trade inside the horizontal channel on the 30-minute timeframe, so the technical picture has not changed over the past day. As long as the price is between the levels of 1.0636 and 1.0765, there is no need to count on a trend movement. Even the ECB meeting could not lead to the exit of the euro quotes from the specified range. On the 5-minute TF, it is recommended to trade at the levels of 1.0607, 1.0636, 1.0663, 1.0697, 1.0765, 1.0787-1.0806, 1.0837. When passing 15 points in the right direction, you should set Stop Loss to breakeven. There will be nothing interesting in the European Union in macroeconomic or fundamental terms. Meanwhile, the inflation report will be published in America, which is very important and can provoke a strong market reaction. It is impossible to say now which one, so you need to be ready for any movements. Basic rules of the trading system:1) The signal strength is calculated by the time it took to form the signal (bounce or overcome the level). The less time it took, the stronger the signal. 2) If two or more deals were opened near a certain level based on false signals (which did not trigger Take Profit or the nearest target level), then all subsequent signals from this level should be ignored. 3) In a flat, any pair can form a lot of false signals or not form them at all. But in any case, at the first signs of a flat, it is better to stop trading. 4) Trade deals are opened in the time period between the beginning of the European session and until the middle of the American one, when all deals must be closed manually. 5) On the 30-minute TF, using signals from the MACD indicator, you can trade only if there is good volatility and a trend, which is confirmed by a trend line or a trend channel. 6) If two levels are located too close to each other (from 5 to 15 points), then they should be considered as an area of support or resistance. On the chart:Support and Resistance Levels are the Levels that serve as targets when buying or selling the pair. You can place Take Profit near these levels. Red lines are the channels or trend lines that display the current trend and show in which direction it is better to trade now. The MACD indicator (14,22,3) consists of a histogram and a signal line. When they cross, this is a signal to enter the market. It is recommended to use this indicator in combination with trend lines (channels and trend lines). Important speeches and reports (always contained in the news calendar) can greatly influence the movement of a currency pair. Therefore, during their exit, it is recommended to trade as carefully as possible or exit the market in order to avoid a sharp price reversal against the previous movement. Beginners on Forex should remember that not every single trade has to be profitable. The development of a clear strategy and money management are the key to success in trading over a long period of time. The material has been provided by InstaForex Company - www.instaforex.com |
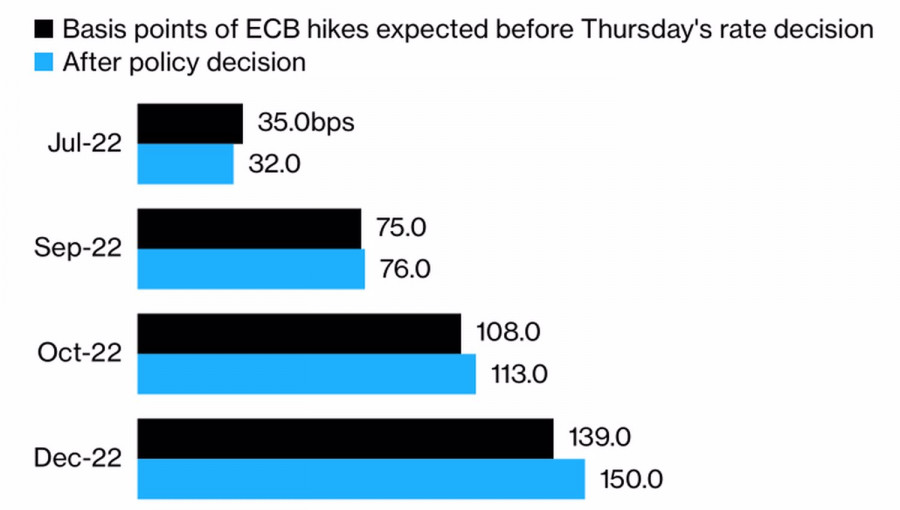
| The euro was not surprised by anything Posted: 09 Jun 2022 02:54 PM PDT European Central Bank President Christine Lagarde managed to find a compromise between the hawks and the centrists of the Governing Council, as evidenced by the text of the accompanying statement. The ECB intends to start by raising the deposit rate by 25 bps in July, but if the inflation forecast worsens, the speed can be increased. On the other hand, based on its current assessment, the central bank considers it appropriate to gradually but steadily increase borrowing costs. EURUSD initially jumped in response to this wording, but then realized that it had not heard anything new. So, it's not worth rushing to the upside yet. Buy on rumors, sell on facts. The euro was steadily strengthening ahead of the ECB meeting, from which investors were waiting for a hawkish surprise. German bond yields over the past six months have seen the fastest rally in 100 years, and the chances of aggressive monetary restriction have been growing by leaps and bounds. After the June meeting of the Governing Council, the futures market predicts an increase in the deposit rate by as much as 150 bps. We are talking about its growth by 50 bps at two of the four meetings of Lagarde and her colleagues. The other two will add 25 bp each. The value of the ECB deposit rate expected by investors
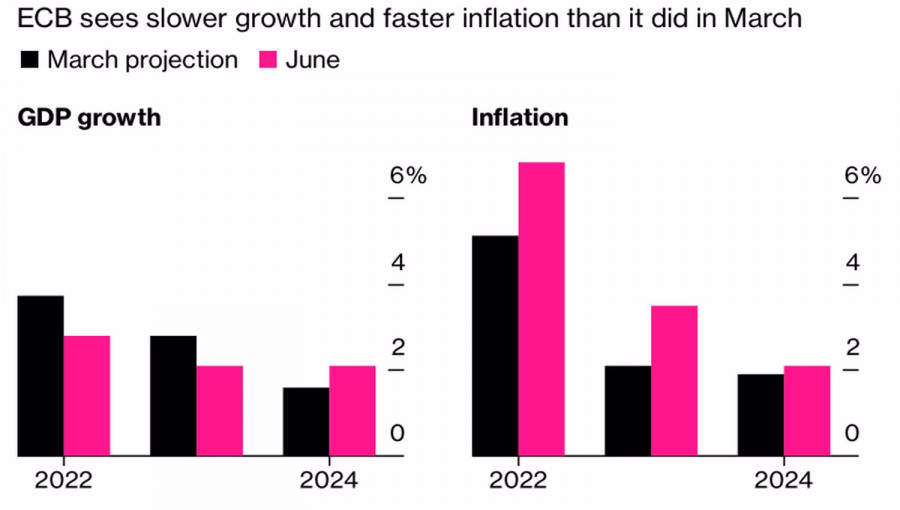
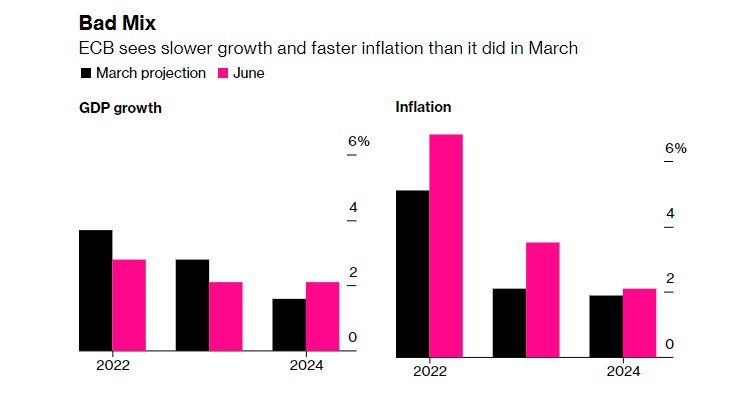
The ECB is expected to worsen forecasts for inflation and eurozone GDP, which increases the risks of stagflation. According to the central bank, consumer price growth at the end of 2022 will be 6.8% against 5.1% in the previous estimate. The economy will expand not by 3.7%, but by 2.8%. At the end of 2024, inflation will continue to stay in the area above the target, which opens the door for a rate hike. ECB forecasts for European inflation and GDP
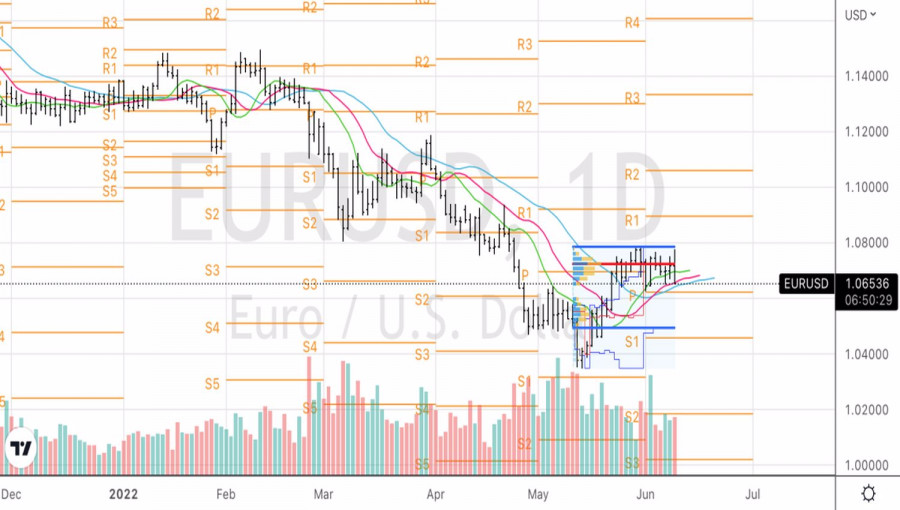
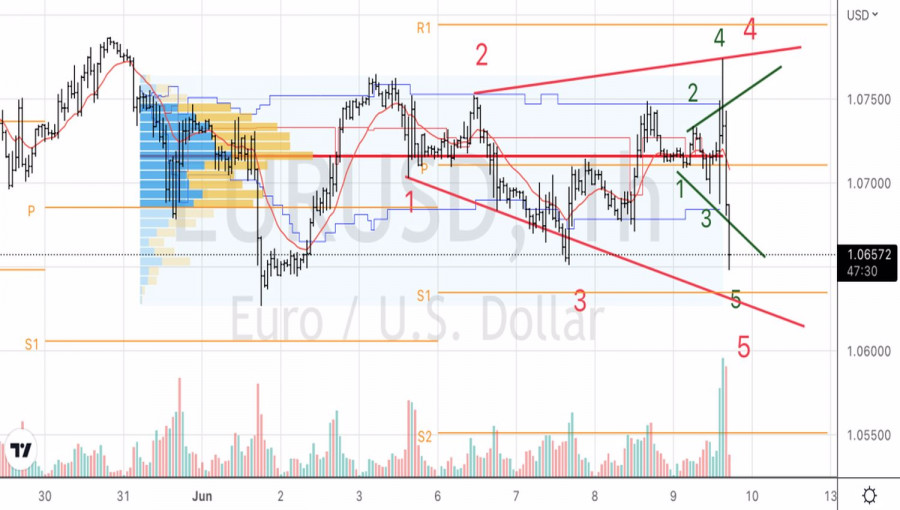
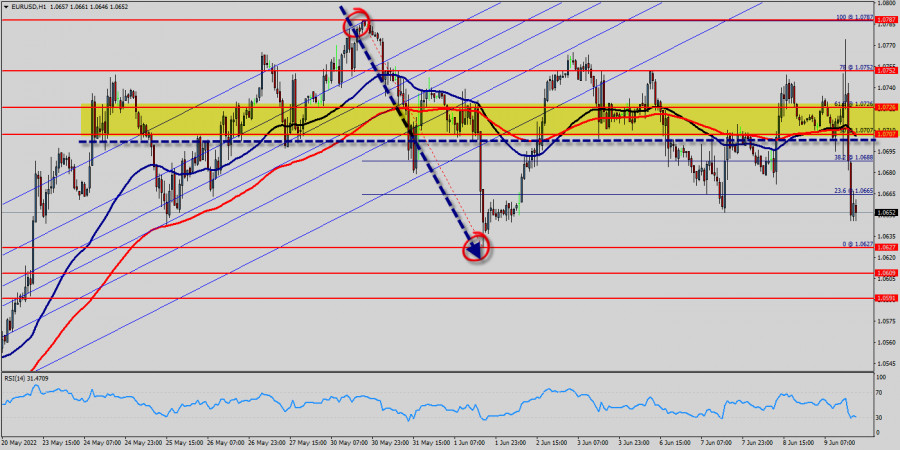
Thus, the ECB tried to sell the market the news that it knew well. Even the increase in the deposit rate by 50 bps in September was estimated by investors as fifty-fifty. It is not surprising in such conditions that after taking off to the upper limit of the trading range of 1.065-1.076, EUR USD quotes returned to its middle. The roller coaster of the main currency pair and the storm on Forex risk being replaced by calm. Traders will closely monitor the release of data on consumer prices in the United States. Unlike CPI, which, according to Bloomberg analysts, will grow at the same pace in May as in April, core inflation will fall below 6%. However, its slow slowdown is unlikely to change the Fed's plan to raise the federal funds rate by 50 bps in June, and then in July, followed by a transition to +25 bps in September. If so, the demand for the US dollar will remain high. EURUSD, daily chart
EURUSD, hourly chart
Technically, on the EURUSD daily chart, there is an implementation of the "Deception-outlier" pattern. The inability of the bulls to bring quotes above the upper limit of the consolidation range of 1.065-1.076 indicates their weakness and gives rise to short positions. On the hourly time frame, a daughter pattern of the Expanding Wedge has been formed and a mother red pattern is expected to form. Recommendation - use pullbacks to open shorts. The material has been provided by InstaForex Company - www.instaforex.com |
| Results of the ECB's June meeting Posted: 09 Jun 2022 02:53 PM PDT The EURUSD pair showed a serious surge in volatility after the results of the European Central Bank meeting, as well as Christine Lagarde's press conference. As expected, the euro shot up, but failed to settle at the May highs, which led to a sharp sell-off at the time of writing and the removal of quite a large number of stop orders, as is usually the case. According to the central bank, the ECB will stop large-scale asset purchases in three weeks, which is a key step in the fight against record inflation. Thus, the central bank is preparing the ground for the first interest rate hike in the eurozone in more than a decade.
It is obvious that European politicians were waiting for fresh forecasts and assessments of the economy, frantically worrying about how the Chinese coronavirus and the military special operations of the Russian Federation on the territory of Ukraine would affect all this. Armed with fresh forecasts indicating faster price movements in the eurozone than previously thought, along with a weaker economic recovery after the pandemic, officials agreed to stop net bond purchases from July 1 as part of an anti-crisis program that began in 2015 and lasted for more than 7 years. As for the rates, no changes were made to them. The deposit rate (currently -0.5%) will be raised by a quarter point next month and again in the fall if inflation requires a tougher stance from the central bank. It is obvious that the decisions taken at the next two meetings will end an eight-year period of low borrowing costs. Although this was not news to the markets, as Lagarde has been talking about it quite a lot lately, volatility was quite high. "After September, based on the current assessment, the Governing Council expects to resort to a gradual and steady increase in interest rates," the ECB said in a statement. Let me remind you that, according to the latest data, inflation in the eurozone was 8.1% in May, which is more than four times higher than the target level of 2.0%. Skyrocketing prices are weighing on households across the region, and governments are spending billions of euros to shield people from a spike in energy prices. Incessant inflation is fueling a fierce debate among ECB officials over the size of the July rate hike. I have repeatedly said that quite a lot of politicians insist on considering the possibility of raising the deposit rate by half a point at once.
If Lagarde does not support these goals, then it is obvious that the euro will be under pressure again, since we have not learned anything new, in fact. Investors this week estimated the probability of a half-point rate hike in July as 50/50, as price pressure persists and the economy continues to lose momentum. For the European currency, bulls need to get above 1.0780, which will lead to a new rapid upward jerk of the pair, to the areas of 1.0820 and 1.0850. There, the bulls will again face quite serious problems, especially given the overbought trading instrument on shorter timeframes. If the euro is under pressure again after the meeting, the bulls will obviously try to do everything to protect 1.0710. If you miss it, most likely, the bears will fail the trading instrument to the lows: 1.0660 and 1.0630. Pound bulls defended the level of 1.2490, which enabled them to count on continued growth. In the short term, bulls will certainly expect to go beyond 1.2560, which will strengthen the growth of the trading instrument. A breakthrough of 1.2560 will lead to an instant breakthrough to the monthly high of 1.2600 with the prospect of updating 1.2630 and 1.2670. If bulls fail to cope with the tasks assigned to them, and a breakthrough of 1.2490 still takes place, then the pressure on the pound will increase. This will open the way to the lows: 1.2430 and 1.2390. The furthest goal in the current conditions will be the support of 1.2360. The material has been provided by InstaForex Company - www.instaforex.com |
| June 9, 2022 : EUR/USD daily technical review and trading opportunities. Posted: 09 Jun 2022 02:41 PM PDT
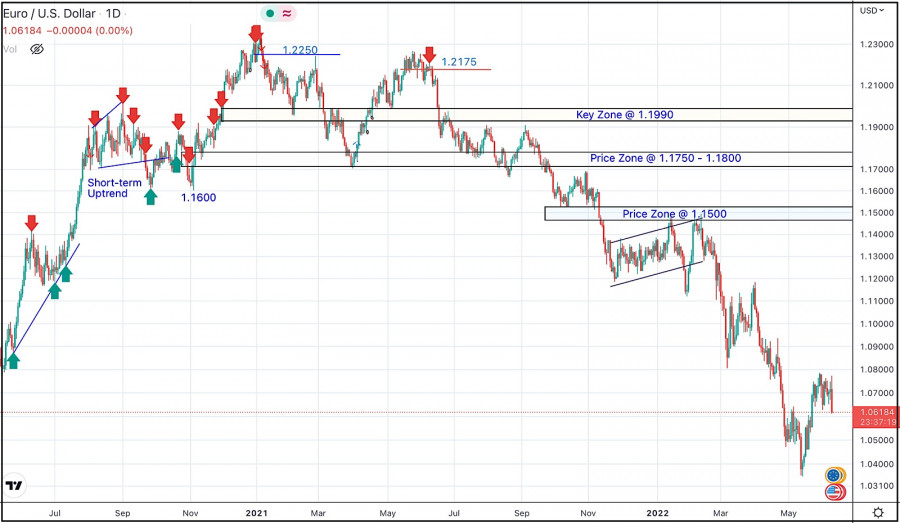
In late September, Re-closure below the price level of 1.1700 has initiated downside-movement towards 1.1500 where some recovery was witnessed. Shortly after, Price levels around 1.1700 managed to hold prices for a short period of time before another price decline took place towards 1.1200. Then the EURUSD has temporarily moved-up within the depicted movement channel until downside breakout occurred recently. Since then, the price zone around 1.1500 has applied significant SELLING pressure when a valid SELL Entry was offered upon the previous ascending movement towards it. Shortly after, the EURUSD looked oversold while approaching the price levels of 1.0800. That's where the recent upside movement was previously initiated. That's why, the recent movement towards 1.1200 was considered for another SELL Trade which is already running in profits now. The current ascending movement above 1.0600 enabled further advancement towards 1.0850 where bearish rejection can be applied. The material has been provided by InstaForex Company - www.instaforex.com |
| June 9, 2022 : EUR/USD Intraday technical analysis and trading plan. Posted: 09 Jun 2022 02:40 PM PDT
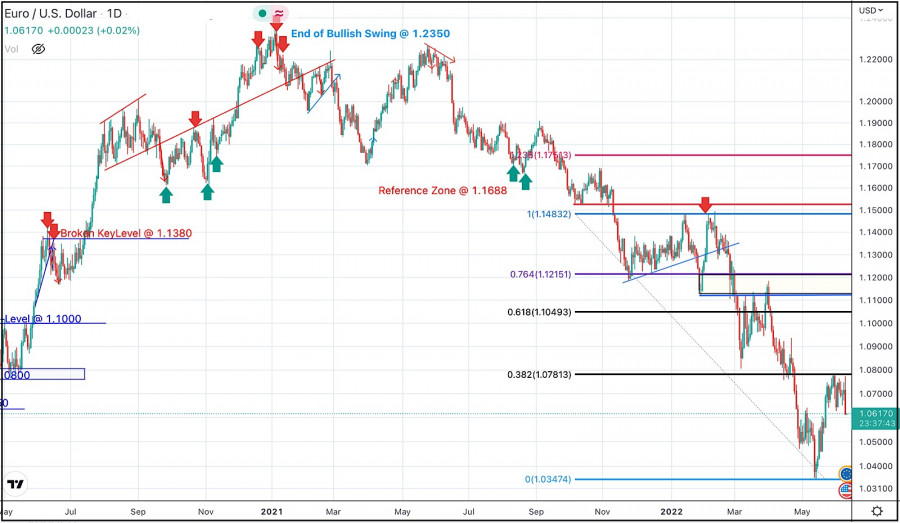
In late September, Re-closure below the price level of 1.1700 has initiated downside-movement towards 1.1500 where some bullish recovery was witnessed. Shortly after, another price decline took place towards 1.1200. Then the EURUSD has temporarily moved-up within the depicted movement channel until downside breakout occurred. The EURUSD looked oversold while approaching the price levels of 1.0800. That's when an upside movement was initiated towards 1.1200. This recent movement towards 1.1200 was suggested for another SELL opportunity which already reached its targets. The current ascending movement above 1.0600 may enable further advancement towards 1.0850 where bearish rejection can be applied. On the other hand, the pair remains under selling pressure to re-visit the new daily low around 1.0350. The material has been provided by InstaForex Company - www.instaforex.com |
| June 9, 2022 : GBP/USD Intraday technical analysis and significant key-levels. Posted: 09 Jun 2022 02:39 PM PDT
The short-term outlook turned bearish when the market went below 1.3600. This enhanced the bearish side of the market initially towards 1.3400 then 1.3200 which initiated a strong bullish movement towards 1.3600 for another re-test. The recent bullish pullback towards 1.3600 should have been considered for SELL trades as it corresponded to the upper limit of the ongoing bearish channel. Shortly after, Bearish persistence below 1.3360 enabled bearish continuation towards 1.2980 - 1.3000. The price level of 1.3000 stood as intraday Support where a short-term sideway movement could be established . This happened before two successive bearish dips could take place towards 1.2550 and 1.2200. Considerable bullish rejection was expressed around 1.2200. Hence, bullish breakout above 1.2550 was needed to abolish the short-term bearish scenario for sometime. Quick bullish advancement was executed towards 1.2650 where some bearish resistance is encountered. The GBP/USD pair remains under bearish pressure to challenge the new low around 1.2150 again. Hence, any bearish reversal signs around 1.2650 should be considered for SELLING the pair. The material has been provided by InstaForex Company - www.instaforex.com |
| European stocks decline as ECB decision paves way for rate hikes Posted: 09 Jun 2022 12:19 PM PDT
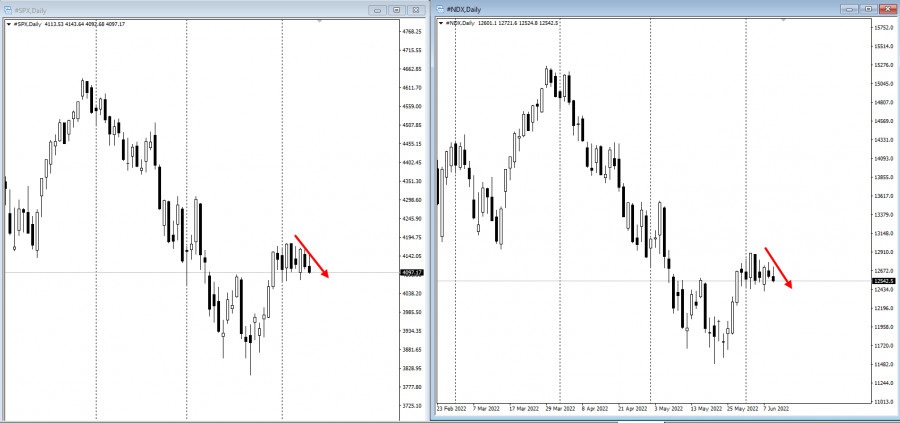
Stocks fell along with bonds after the European Central Bank said it would end eight years of negative interest rates and close the gap with global peers. The ECB did not change the deposit rate this time, but is prepared to hike by a quarter point next month, and again by that amount or more if inflation, which is now above 8% in the eurozone, guarantees a tougher stance. The S&P 500 and Nasdaq 100 continued its downtrend. Tesla Inc. rose after the company said month-over-month deliveries of cars made in China doubled.
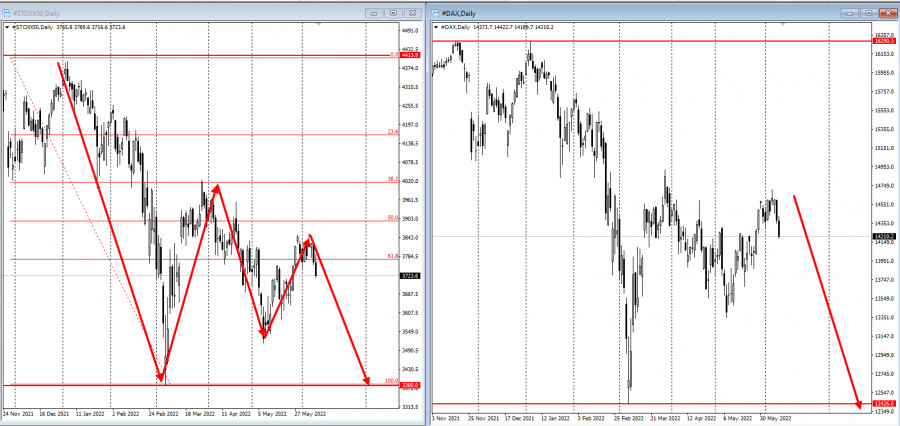
ECB policy makers have lagged global peers at the Federal Reserve, Bank of Canada and Reserve Bank of Australia which have embarked on aggressive campaigns to subdue runaway inflation this year, hiking in 50-basis point increments. The policy makers also announced fresh forecasts signaling a faster path than previously, alongside a weaker rebound from the pandemic. The central bank is also expected to end large-scale asset purchases in three weeks. The Stoxx50 closed 1.5% lower, with real estate and technology shares leading declines.
"To rein in surging prices the Fed has to increase rates, which can result in a recession," Geir Lode, head of global equities at Federated Hermes, wrote in a note. "However, the pandemic-induced supply-chain shock and the Ukraine conflict are beyond the central bank's control. In this environment we need to be lucky to avoid stagflation that could last for a long time." Key events to watch this week:
|
| Technical analysis of GBP/USD for June 09, 2022 Posted: 09 Jun 2022 10:29 AM PDT Overview : GBP/USD : The bias remains bearish in the nearest term testing 1.2500 or lower. Immediate support is seen around 0.9870. A clear break below that area could lead price to the neutral zone in the nearest term. Price will test 1.2485, because in general, we remain bearish on June 19h, 2022. Yesterday, the market moved from its top at 1.2575 and continued to drop towards the top of 1.2500. Today, on the one-hour chart, the current fall will remain within a framework of correction. However, if the pair fails to pass through the level of 1.2548 (major resistance), the market will indicate a bearish opportunity below the strong resistance level of 1.2548 (the level of 1.2548 coincides with tha ratio of 50% Fibonacci retracement). Since there is nothing new in this market, it is not bullish yet. Sell deals are recommended below the level of 1.2548 with the first target at 1.2485 and continue towards 1.2429 so as to test the double bottom. If the trend breaks the double bottom level of 1.2429 , the pair is likely to move downwards continuing the development of a bearish trend to the level of 1.2385 in order to test the weekly support 3.
Sell-deals are recommended below the price of 1.2548 with the first target seen at 1.2485. The movement is likely to resume to the point 1.2429. The descending movement is likely to begin from the level 1.2429 with 1.2385 and 1.2350 seen as new targets in coing hours. The material has been provided by InstaForex Company - www.instaforex.com |
| Technical analysis of EUR/USD for June 09, 2022 Posted: 09 Jun 2022 10:05 AM PDT Overview : Pair : EUR/USD : We expect to see a strong reaction off this level to push price down towards 1.0665 before 1.0627 support (Fibonacci retracement, horizontal swing low support). RSI (14) sees a bearish exit of our ascending support-turned-resistance line signalling that we'll likely be seeing some bearish momentum from the spot of 1.0707. The EUR/USD pair dropped from the level of 1.0752 to the bottom around 1.0653. But the pair could not rebound from the bottom of 1.0653 to close at the same price. Today, the first support level is seen at 1.0627, and the price is moving in a bearish channel now. Furthermore, the price has been set below the strong resistance at the level of 1.0726, which coincides with the 61.8% Fibonacci retracement level. This resistance has been rejected several times confirming the downtrend. Additionally, the RSI starts signaling a downward trend. As a result, if the EUR/USD pair is able to break out the first support at 1.0627, the market will decline further to 1.0609 in order to test the weekly support 2. In the H1 time frame, the pair will probably go down because the downtrend is still strong. Consequently, the market is likely to show signs of a bearish trend. So, it will be good to sell below the level of 1.0726 with the first target at 1.0627 and further to 1.0609. At the same time, the breakdown of 1.0787 will allow the pair to go further up to the levels of 0.61.0820 726 in order to try a new bullish wave.
In the H1 time frame, the pair will probably go down because the downtrend is still strong. Consequently, the market is likely to show signs of a bearish trend. So, it will be good to sell below the level of 1.0726 with the first target at 1.0627 and further to 1.0609. At the same time, the breakdown of 1.0787 will allow the pair to go further up to the levels of 0.61.0820 726 in order to try a new bullish wave The material has been provided by InstaForex Company - www.instaforex.com |
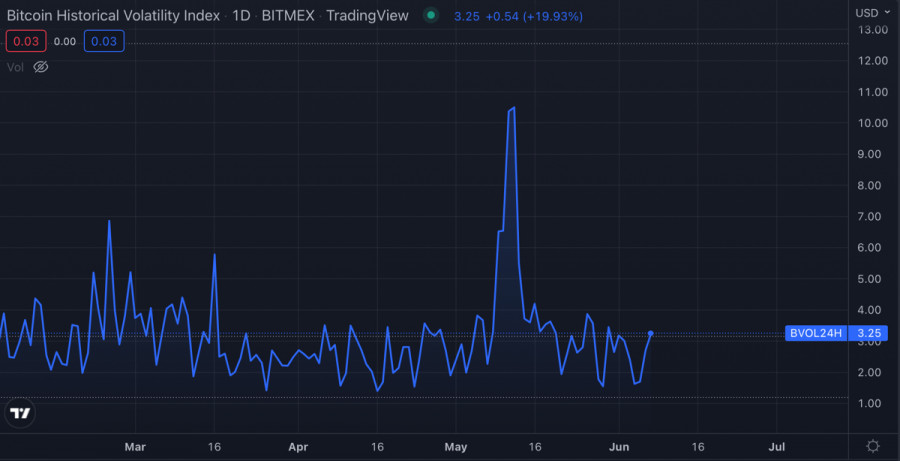
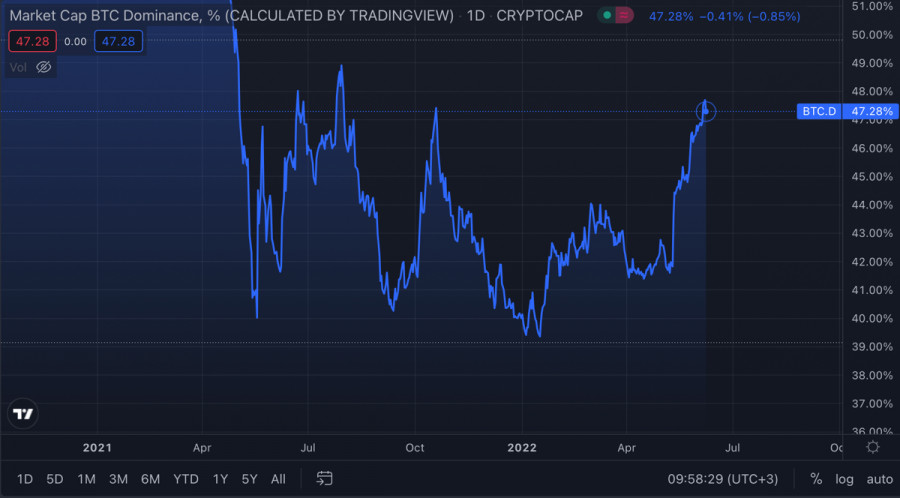
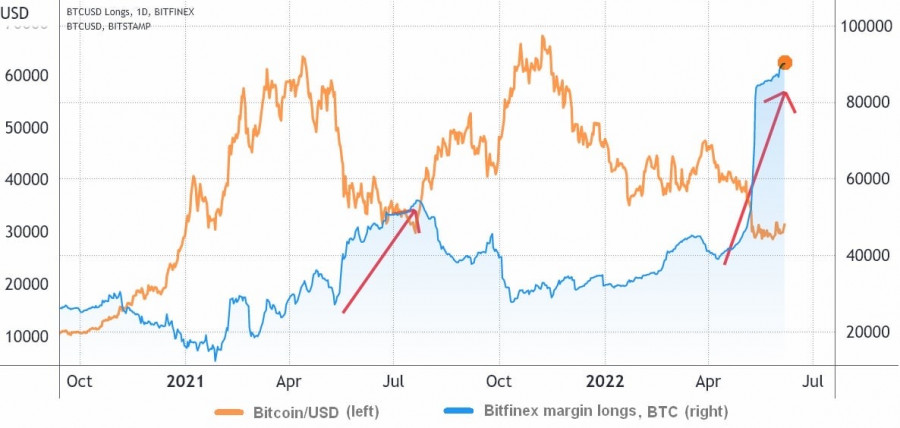
| Bitcoin volatility is rising amid increased trading activity Posted: 09 Jun 2022 09:13 AM PDT Over the past two days, Bitcoin quotes have made several sharp impulsive upward and downward jerks. All this happened within the range of $29k–$31k. On the evening of June 7, the asset made a strong bearish spurt and broke through $29k, but on the night of June 8, it began to recover and consolidated above $30k. All this indicates an increase in trading activity, as well as the implementation of an aggressive trading strategy by a small number of large investors. The main reason for such serious impulse changes in the price is the increase in volatility. Bitcoin's "anxiety" level began to rise as the BTC Market Dominance Index reached 47, a six-month high. This, in turn, indicates an increase in the volume of cryptocurrency purchases, provoked by fundamental factors. In addition, there is an achievement of the absolute maximum number of longs on individual crypto exchanges. The number of open long positions reached 92.2 thousand.
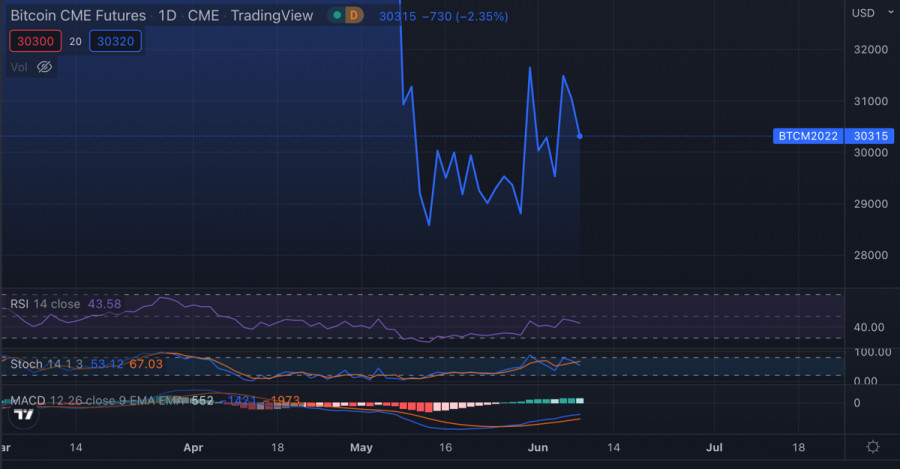
CoinShares also notes the growing demand for investment in Bitcoin funds. At the same time, there is an outflow of funds from funds based on other cryptocurrencies, which indicates a specific market focus on Bitcoin. According to Santiment, there has also been a massive outflow of BTC coin funds from exchanges in the amount of 50,000 coins over the past 7 days. The bullish signals come amid extreme fear in the cryptocurrency market, which may indicate a certain amount of artificiality in the growing interest in Bitcoin. This is also hinted at by the falling interest in BTC futures on CME.
The key signal confirming the high probability of manipulation is the growth of long positions with high leverage. Together with the number of long positions, a large leverage destabilizes the situation and provokes an increase in volatility. The jumps in BTC/USD quotes over the past few days indicate a deliberate increase in the level of volatility and instability in the market. This suggests that some investors are preparing to implement a strategy to knock "weak hands" out of the BTC market. At the same time, Glassnode notes that the majority of BTC investors in 2021–2022 are in losses, which increases the chances of harvesting a large liquidity harvest.
The main technical indicator indicating a likely reversal and the validity of interest in BTC, MACD, is moving flat and does not demonstrate prerequisites for growth. This also indicates the lack of a really high level of interest in the asset. Stochastic and RSI are also moving sideways, which indicates that there is no upward trend in purchasing activity. Ultimately, all these factors point to the deliberate destabilization of the situation around Bitcoin in order to collect liquidity at low prices.
|
| USD/JPY pair updated a 20-year price high and is not going to stop Posted: 09 Jun 2022 09:01 AM PDT The dollar-yen pair continues its upward path, updating more and more new price highs. Yesterday, traders reached the mark of 134.44—the last time the price was in this area was in the spring of 2002, that is, more than 20 years ago. Such price records are impressive, especially since USD/JPY buyers, apparently, are not going to stop. In May, the pair retreated from the previously reached highs and for several weeks traded within a wide-range flat, not leaving the boundaries of 126.50–130.00. However, in June, the upward trend resumed: the price jumped by more than 300 points, demonstrating almost no retracement of growth. The upward dynamics is spurred primarily by the strengthening of the US currency. However, the yen also contributes by weakening its position against the background of the position of the Bank of Japan, whose representatives continue to maintain a "dovish" attitude.
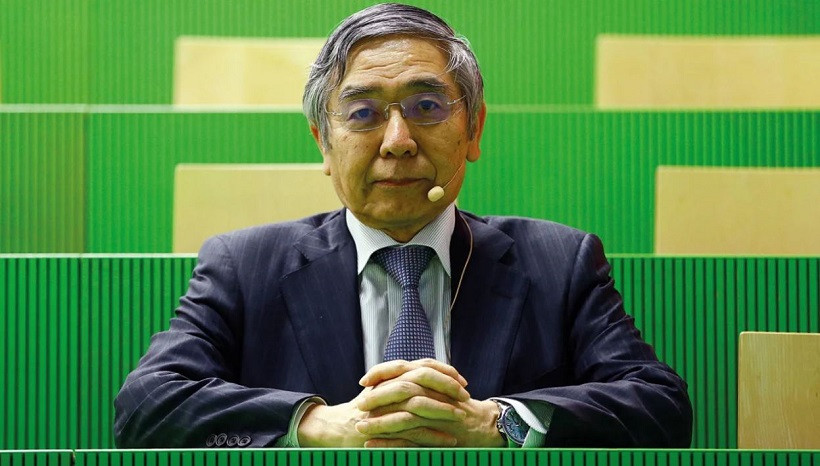
It is noteworthy that the head of the Japanese regulator Haruhiko Kuroda this week was still worried about the devaluation of the national currency. According to him, "the rapid weakening of the yen in such a short period of time is undesirable." However, his comments were not heard by the market, especially since he recently voiced a completely different position: he repeatedly stated that "a weak yen is not a negative factor for the Japanese economy." Some of his colleagues (for example, BOJ board member Asahi Noguchi) even welcomed the depreciation of the national currency. In particular, Noguchi assured reporters that the benefits of a weak yen for the Japanese economy "outweigh the disadvantages." When the USD/JPY rate confidently consolidated above the target of 132.00, the head of the Bank of Japan nevertheless changed his point of view on this issue, complaining about the too rapid weakening of the national currency. But the market ignored this speech, as the Japanese regulator de facto does not intend to change monetary policy in the direction of tightening. Just today, Kuroda said that the central bank should continue to support economic activity, "maintaining the current easing of monetary policy." It should be recalled here that according to the latest data, inflation in Japan exceeded the 2% target level for the first time in the last 13 years. The consumer price index excluding fresh food (this is a key inflation indicator that is closely monitored by the Bank of Japan) grew by 2.1% in annual terms in April, also exceeding the 2% target of the central bank for the first time since 2015. However, Kuroda leveled this fundamental factor yesterday, saying that "the current inflationary growth is due only to higher energy prices, so it will not be sustainable." In other words, the Bank of Japan does not intend to respond to a significant increase in the main inflation indicators. Moreover, Koruda assured that the regulator could continue easing monetary policy "to support the economic recovery and reduce the labor force in the labor market." After these comments, the yen weakened throughout the market, allowing buyers of USD/JPY to update the next price highs.
Meanwhile, the yield of 10-year Treasuries again exceeded the 3% mark, "dragging" the US currency. The dollar is getting more expensive, including against the background of the growth of the oil market: the price of Brent oil has already risen above $123 per barrel. Oil is getting more expensive on traders' expectations that the demand for energy resources on the world market will exceed the supply. The easing of quarantine restrictions in China, as well as the start of the so-called "car season" in the United States and Europe will continue to spur oil prices. For example, analysts at Goldman Sachs bank predict a rise in the price of Brent crude oil in the third quarter to $140 per barrel. Morgan Stanley experts, in turn, set the price bar higher at the level of $150. Such prospects suggest that US inflation will resume its growth again, while in May the first signs of a slowdown in the upward trend were recorded. In this regard, the Fed may also adjust its policy in the direction of tightening—for example, the issue of a 75-point rate increase will return to the agenda at one of the next meetings. The strengthening of the hawkish mood regarding the Fed's further actions supports the greenback. In turn, the divergence of the positions of the Fed and the Bank of Japan pushes the pair up to new price heights. Now it is difficult to say at what price level USD/JPY buyers will stop their offensive. There is no consensus on this on the market, in particular, Scotiabank's currency strategists say that the upward target is located at around 140.00. Credit Suisse analysts have indicated resistance at 135.20 (this is the maximum value of 2002). At the same time, they are confident that the ultimate target of USD/JPY bulls in the long term is the range of 147–150. In my opinion, the immediate target for buyers of the pair in the medium term is 134.60, which is the upper line of the Bollinger Bands indicator on the weekly chart. In general, both the "foundation" and the "technique" speak in favor of the further development of the upward trend. On all "higher" timeframes (from H4 and above), the pair is either on the top or between the middle and top lines of the Bollinger Bands indicator. In addition, on the daily and weekly charts, the Ichimoku indicator has formed one of its strongest bullish signals. Therefore, it is advisable to use any corrective pullbacks to open long positions. The material has been provided by InstaForex Company - www.instaforex.com |
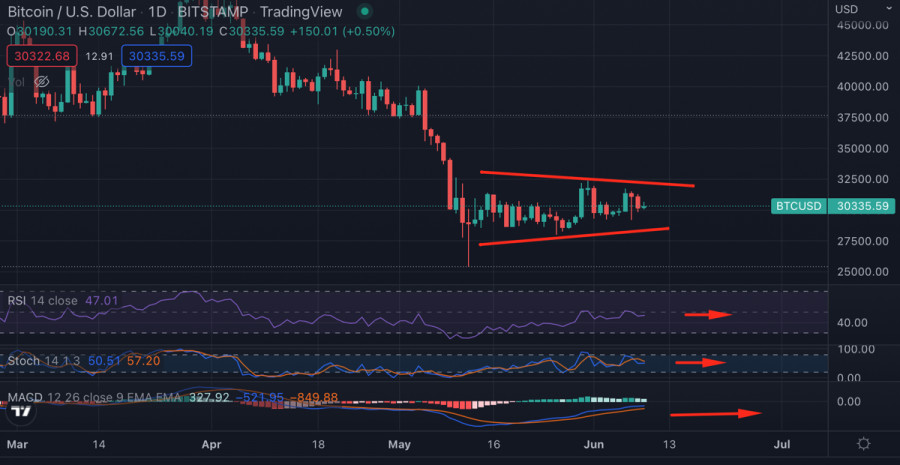
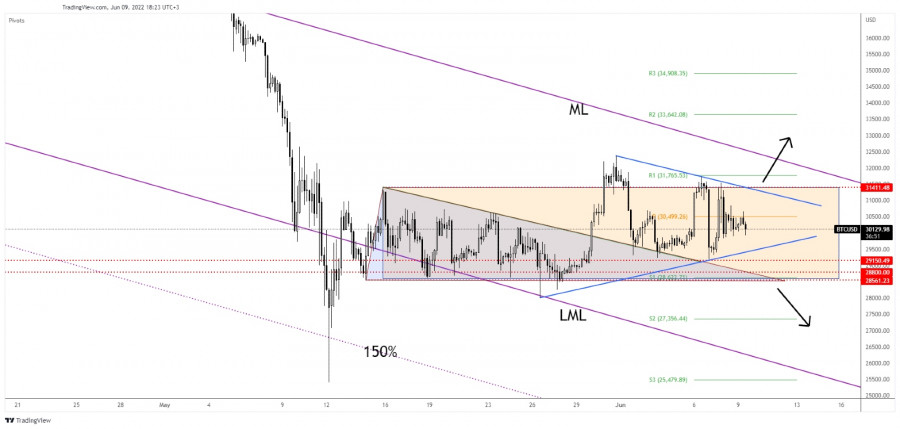
| Bitcoin Extends Its Sideways Movement Posted: 09 Jun 2022 08:43 AM PDT BTC/USD is trading in the red at 30,043 at the time of writing on the h4 chart. As you already know, cryptocurrency continues to move sideways. It is trapped between the levels of 31,411 and 28,561. Bitcoin is down by 1.30% in the last 24 hours and by 0.16% in the last 7 days. BTC/USD seems undecided in the short term, that is why altcoins could move in the range. Technically, the bias remains bearish despite temporary rebounds. BTC/USD Upside Seems Limited
BTC/USD failed to stabilize above the 31,411 key resistance, so we cannot exclude a potential drop below the 30,000 psychological level. Personally, I'll wait for the price to escape from the current range before going long or short. It remains to be seen whether this will be a consolidation or a distribution pattern. In the short term, the price action developed a triangle pattern. BTC/USD should explode soon as the current narrow range cannot continue forever. BTC/USD PredictionA valid breakout above 31,411 could signal further growth and could bring new long opportunities. A new lower low and breaking below 28,561 will activate more declines towards new lows. The material has been provided by InstaForex Company - www.instaforex.com |
| Posted: 09 Jun 2022 08:42 AM PDT
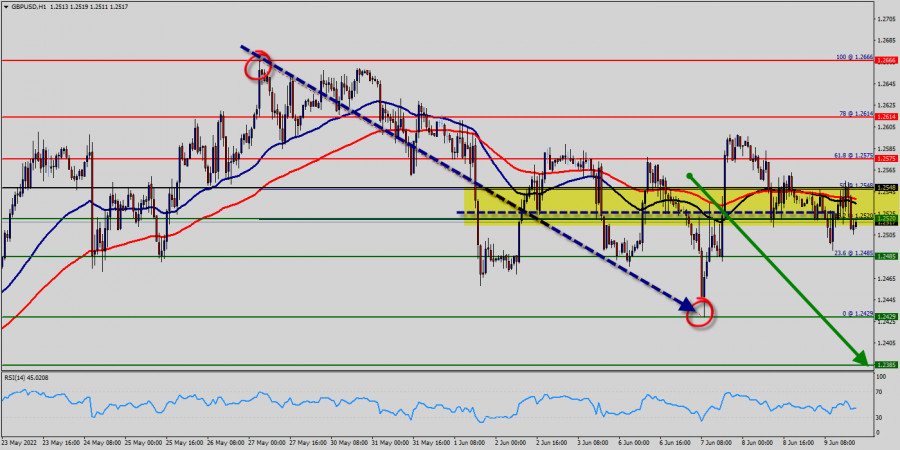
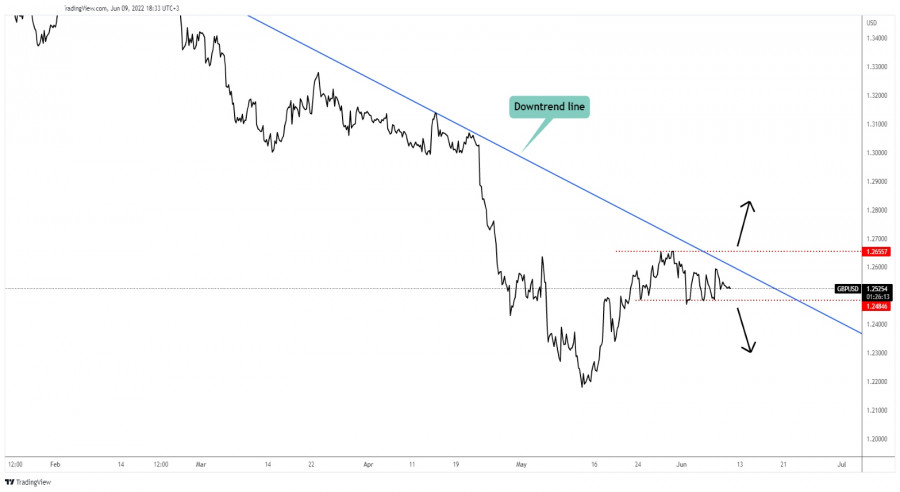
GBP/USD Seems UndecidedThe GBP/USD pair was traded at 1.2525 at the time of writing and it seems undecided in the short term. As you can see on the H4 chart, the price is trapped between the 1.2484 and 1.2655 levels. As long as it stays under the downtrend line, the pair could drop deeper at any time. The trendline represents a dynamic upside obstacle. GBP/USD Trading ConclusionStaying below the downtrend line and dropping below the 1.2484 downside obstacle again may signal more declines and could help the sellers catch a new downside movement. Only jumping and stabilizing above the downtrend line and above 1.2655 could announce a larger growth and a potential reversal. The material has been provided by InstaForex Company - www.instaforex.com |
| Posted: 09 Jun 2022 08:10 AM PDT On Thursday's trading, the key European stock indices are declining amid the upcoming publication of the outcome of the European Central Bank's (ECB) meeting. At the time of writing the article, the STOXX Europe 600 index of Europe's leading companies dropped by 0.56% to 437.89 points. At the same time, the British FTSE 100 index sank by 0.51%, the French CAC 40 lost 0.2%, and the German DAX fell by 0.5%.
Top gainers and losers Swedish helmet maker MIPS AB stock plunged by 6% as the company's management announced long-term goals for its key financial indicators. Shares of Norwegian oil producer Var Energi ASA fell by 7.6%. Market capitalization of Italian energy company Eni SpA dropped by 0.1%. Shares in French luxury group Kering decreased by 1%. Swiss financial conglomerate Credit Suisse stock went down 3.6%. The capitalization of British American Tobacco PLC declined by 0.6%. Moreover, even the positive outlook for revenue and profit growth for 2022 could not change the situation. Market pressure factors Experts consider that the major reason for a permanent reduction in European stock markets on Thursday is investors' concerns about the prospects of the ECB monetary policy tightening. The publication of the regulator's monetary policy decision is scheduled for Thursday evening. The market expects the European regulator to announce its further steps to end asset purchases and increase the base rate to a non-zero level for the first time in eight years. Upcoming tightening of the ECB monetary policy is associated with permanently accelerating inflation and the uncertain economic outlook. Earlier, the EU Statistical office reported that last month consumer prices in the euro area soared by 8.1% year-on-year. At the same time, market analysts had predicted an increase of only 7.7%. Moreover, the figure in May hit an all-time record and exceeded the ECB target value of 2% more than four times. Meanwhile, in the first quarter of 2022 the economy of 19 EU members grew by 0.6% compared to the previous quarter. Previously, experts reported an increase of only 0.3%. At the end of the week, European stock exchanges are awaiting Friday's report from the US Department of Labor on the nation's consumer prices movements over the past month. This data will give an indication of the current state of the US economy. Moreover, the Labor Department report will traditionally be an important reference for the US Federal Reserve when deciding on further monetary policy tightening. The next meeting of the US regulator is due next week. The central bank is expected to increase its key rate by another 50 basis points. In addition, the US Federal Reserve will release its forecasts for the key indicators of the US economy in 2022 following a future meeting. Previous trading results As for yesterday's trading session, European stock market indexes also declined on Wednesday amid investors' concerns about further ECB moves. Consequently, the STOXX Europe 600 index of Europe's leading companies fell by 0.57% to 440.37 points. Shares of Melrose Industries, Aveva Group and Prosus NV were major gainers among the components of STOXX Europe 600. They added 11%,10.7%, and 8.3% respectively. Stocks of low-cost carrier Wizz Air as well as logistics companies Moeller-Maersk and Kuehne & Nagel Group topped the list of top losers. They lost 9.5%, 8%, and 7.25% respectively. The British FTSE 100 index was down 0.08%, French CAC 40 lost 0.8% and German DAX dropped by 0.76%. Shares of French liquor producer and distributor Pernod Ricard SA decreased by 2.5%. Spanish clothing retailer Industria de Diseno Textil SA stock soared by 6.4%. The company increased its net profit 1.8 times and revenue by 36% in the first fiscal quarter. The market capitalization of Scandinavian air carrier SAS AB rose by 0.6%. The day before, the company's management reported that SAS AB had carried 1.826 million passengers the previous month. The number of clients fell by 18% in April. On Wednesday, European investors analyzed the macroeconomic data in the EU. According to the data published the day before, the Construction Purchasing Manager's Index in the euro area fell to 49.2 points in May from 50.4 points in April. It reached the mark below 50 points for the first time in nine months marking the increase in business activity from the decrease. The index showed a record decline in May since February 2021. Moreover, earlier the Organization for Economic Cooperation and Development worsened the outlook for EU economic growth in 2022 to 2.6% from the previously announced 4.3%. At the same time, the forecast of global economic growth in 2022 was lowered to 3% from the previously announced 4.5%. Global gross domestic product is expected to grow by 2.75% next year. The material has been provided by InstaForex Company - www.instaforex.com |
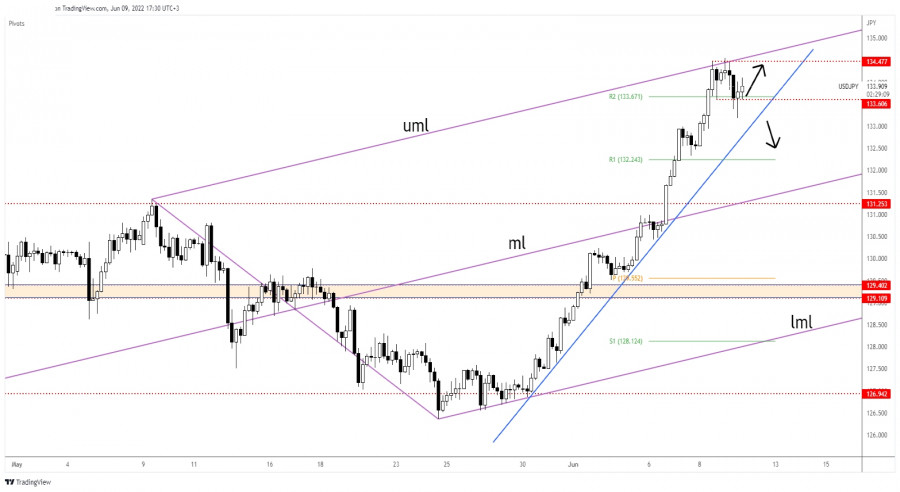
| Posted: 09 Jun 2022 07:46 AM PDT The USD/JPY pair is trading in the green at 133.98 at the time of writing on the H4 chart. After its strong leg higher, the price retreated a little but the bias remains bullish. The currency pair remains bullish as USD is boosted by the DXY's rally while the Yen is weakened by the Japanese Yen Futures' drop. Fundamentally, the US Unemployment Claims came in worse than expected. The economic indicator was reported at 229K versus the estimate of 205K and compared to 202K in the previous period. On the other hand, Japan's Prelim Machine Tool Orders came in at 23.7% while the M2 Money Stock rose by 3.2% compared to the 3.6% forecasted. Tomorrow, the US inflation data could be decisive. USD/JPY Temporary Retreat
USD/JPY found resistance at the ascending pitchfork's upper median line (uml). It has registered only false breakouts above this dynamic resistance and now it has retreated. In the short term, it remains trapped between 133.60 and 134.47. The bias remains bullish as long as it stays above 133.60 and above the uptrend line. Still, it remains to see how it will react after reaching the near-term upside obstacles. USD/JPY ForecastA new higher high, a valid breakout above the 134.47 and through the upper median line (uml) could activate further growth. The current range could represent a bullish continuation pattern. This scenario could bring new long opportunities. Only dropping and stabilizing below the uptrend line and below 133.60 could signal a downside movement and could invalidate an upside continuation. The material has been provided by InstaForex Company - www.instaforex.com |
| Trading plan for Ethereum for June 09, 2022 Posted: 09 Jun 2022 07:45 AM PDT
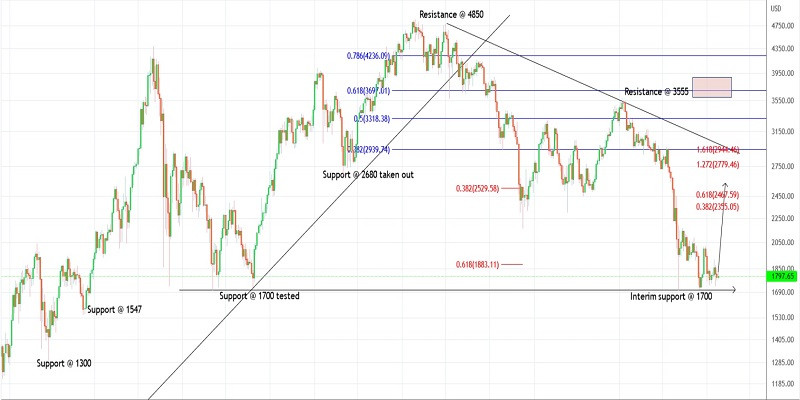
Technical outlook:Ethereum has been drifting within a tight range between $1,720 and $1,800 in the past three trading sessions. The crypto has tested the $1,700 mark at least three times in the past few trading sessions. Bulls might want to hold prices above the $1,700 mark but even if prices break lower, the downside remains limited and prices should bounce sharply through the initial resistance of$3,000. Ethereum is unfolding a corrective rally since printing the low of $1,700 earlier. Potential targets to terminate the corrective phase are found at $3,000 and $3,500-3,600 zones. A push beyond $2,050 will accelerate the movement through $3,000 as bulls come back in control again. Only a drop below the $1,700 mark will delay the matter further. Ethereum has already carved a larger degree downswing between $4,850 and $1,700 as seen on the daily chart. Ideally, prices should produce a corrective rally towards the 0.618 Fibonacci retracement seen through the $3,500-3,600 mark. Bears will be inclined to be back in control thereafter. Trading plan:Potential rally through $3,000 and $3,500 against $1,500 Good luck! The material has been provided by InstaForex Company - www.instaforex.com |
| GBP/USD analysis on June 9. This week, only the US inflation report remains. Posted: 09 Jun 2022 07:45 AM PDT
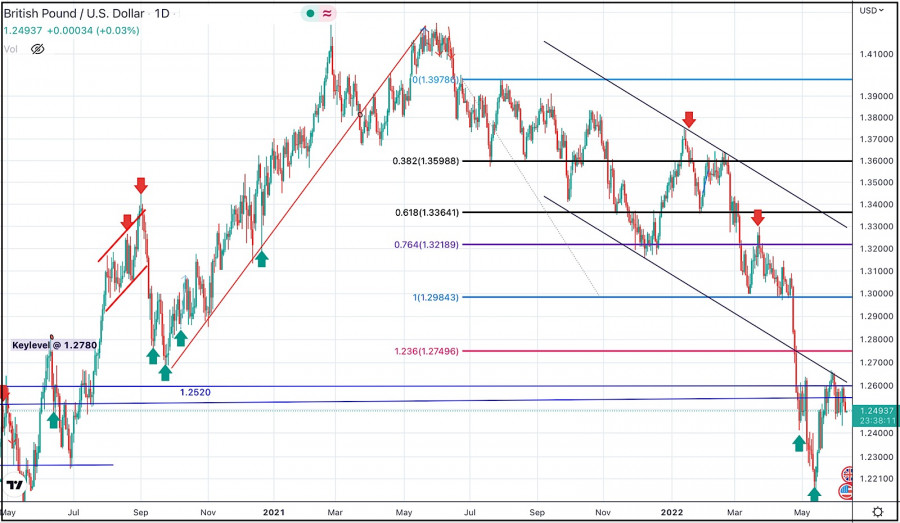
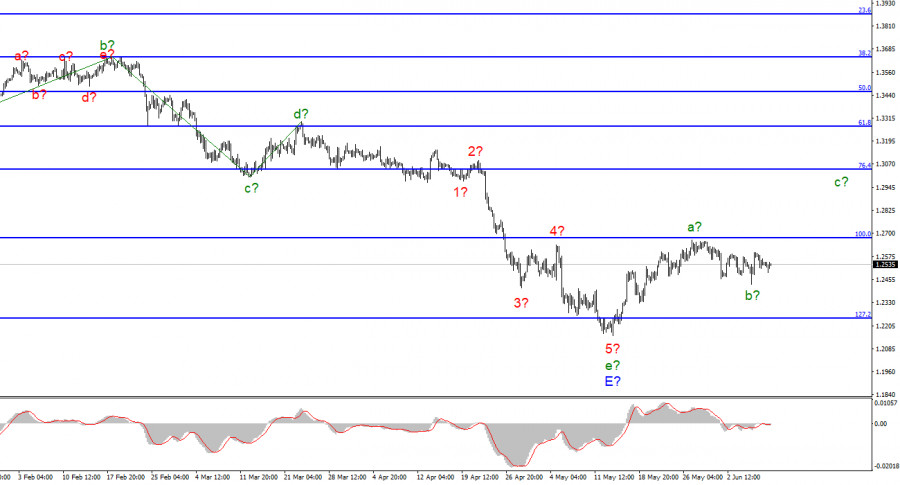
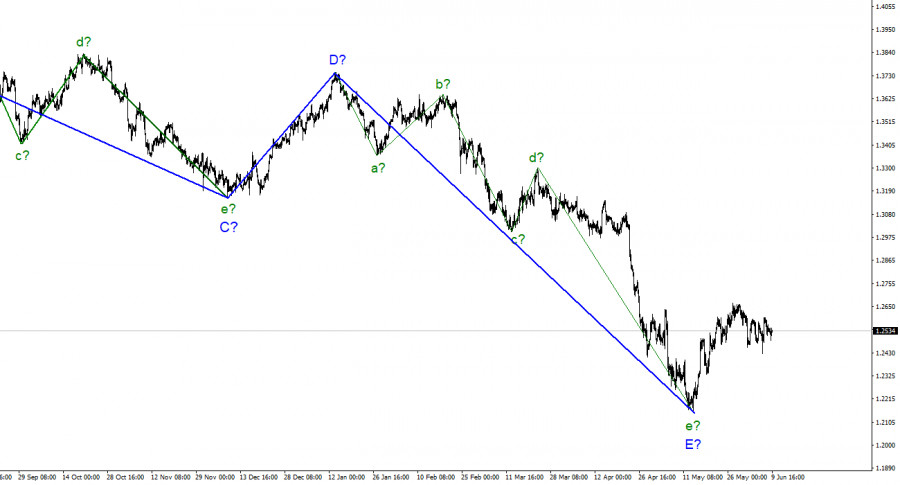
For the pound/dollar instrument, the wave markup continues to look very convincing and does not require adjustments. The downward section of the trend is completed, and the wave e-E, although it has taken a rather complex form. However, it is also five-wave in the structure of the five-wave downward section of the trend, as well as for the euro/dollar instrument. Thus, both instruments presumably completed the construction of downward trend sections. According to the British, the construction of an upward section of the trend has begun, which is currently interpreted as a corrective one. I believe that it will turn out to be three-wave, but there is also a second option, in which it will take a pulsed, five-wave form. Now the construction of the corrective wave b is presumably completed, within which three waves are already visible. Thus, the construction of wave c can now begin with targets located around 30 figures. Wave b can also take a five-wave, but corrective, form. I will note once again that the wave markings of the euro and the pound are very similar now, so we can expect that both currencies will move approximately the same in the next few weeks. The dollar can only expect a slight increase. The exchange rate of the pound/dollar instrument did not decrease on June 9 and did not gain a single point. Market activity was very low today, the amplitude was only about 30 basis points. In the last days of this week, the activity was much higher. There was no news background for the British today, but tomorrow the inflation report for May will be released in the US. And this report will end the current, not the most interesting week. Let me remind you that I expect a further increase in both the European and the British. The construction of a long-term downward trend section cannot end with just one correction wave. There must be at least one more. The fact that both instruments had chances to build a deeper correction in recent weeks, but did not take advantage of them, indicates a low level of the market's desire to increase demand for the dollar. I believe that this indicates the intention of the market to continue buying the euro and the pound. However, now there is one difference in the wave markings of the instruments. For the euro, the corrective wave b looks like a single wave, and for the pound – like a three-wave structure. This difference can lead to the fact that for the euro, wave b will take a three-wave form, and for the pound - a five-wave form, and after that, the increase of both instruments will resume. Thus, I expect that the US inflation report tomorrow will cause an increase in demand for the US currency. To do this, ideally, it would be necessary for inflation to start accelerating again. Let me remind you that in April it decreased from 8.5% y/y to 8.3% y/y. If tomorrow it turns out that it has accelerated again relative to 8.3%, this will help the instrument to make the necessary leap down, since the last doubts about the expediency of raising the interest rate at each meeting in 2022 will have to finally disappear from the Fed. General conclusions. The wave pattern of the pound/dollar instrument still assumes the completion of the construction of wave E and the entire downward trend segment. Thus, I now advise buying the British for each MACD signal "up" with targets located above the peak of wave a, not below the calculated mark of 1.3042, which corresponds to 76.4% Fibonacci. Under certain circumstances, wave marking can become very complicated, but now there is no reason to assume this.
On the higher scale, the entire downward trend section looks fully equipped. Therefore, the continuation of the decline of the instrument below the 22nd figure is postponed indefinitely for the time being. Wave E has taken a five-wave form and looks quite complete. The construction of at least three wave ascending trend sections has begun. The material has been provided by InstaForex Company - www.instaforex.com |
| Posted: 09 Jun 2022 07:43 AM PDT
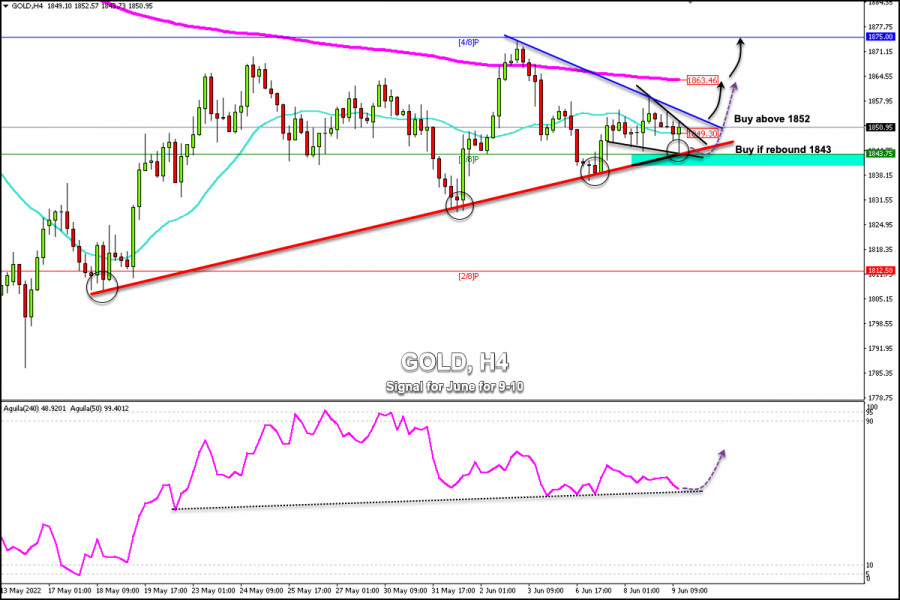
Early in the American session, gold (XAU/USD) was around 1,850. A symmetrical triangle formation is observed. This technical pattern could give a good bullish signal in case gold consolidates above 1,852. Gold has been testing the uptrend channel since May 13 and has bounced above it on several occasions. If in the next few hours, if gold remains trading above 1,840-1,843, it is likely to have a positive outlook and could reach the 200 EMA around 1,863 and finally the 4/8 Murray at 1,875. A daily close below 1,840 could accelerate the bearish move and gold could drop quickly towards 2/8 Murray around 1,812. This will mean that gold has lost its upward potential. In this case we could expect a bearish sequence, which could push the price to the low of 1,786 recorded on May 16. A confirmation of XAU/USD above 1,863, where the 200 EMA is located, should point to a test of the strong barrier at 1,875 (4/8 Murray). In the opposite direction, we see strong support at 1,840, which is the 21 SMA on daily charts. Thus, a settlement below this level would leave gold vulnerable to further losses. At 1,830 there is another key support, which if broken could lead to a drop to 1,812 (2/8 Murray) and even to the psychological level of 1,800. On Friday, June 10th, the US inflation data could give strong volatility to gold. Next week, the FOMC meeting will take place. A rasie of 0.50% is expected. That is why investors are likely to be cautious in taking aggressive positions and gold is expected to be trading in the range between 1,840 (3/8) - 1,860 (200 EMA). Our trading plan is to wait for a technical bounce around 1,840-1,843 in order to buy with targets at 1,852 and 1,863. Conversely, a sharp break of the symmetrical triangle and above 1,852 will be a signal to buy with targets at 1,863 and 1,875. The eagle indicator is giving a neutral signal and gold is likely to consolidate in the coming days. The material has been provided by InstaForex Company - www.instaforex.com |
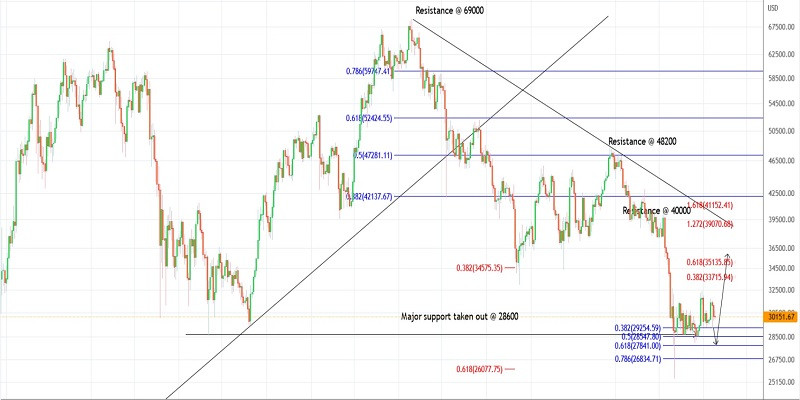
| Trading plan for Bitcoin for June 09, 2022 Posted: 09 Jun 2022 07:31 AM PDT
Technical outlook:Bitcoin dropped to an intraday low of $29,900 on Thursday after reversing from the $31,700 mark early this week. The crypto might decline because of a corrective wave before resuming higher to $42,000-48,000. Alternatively, it could decline to the $27,500 mark and then rise again. Bitcoin has been unfolding a counter-trend rally after carving interim lows around $25,500. The first upswing seems to be in place at around $31,700 and the second wave is underway. If the price climbs to $27,800, bulls may be back in control. Bitcoin is working on a larger degree downswing between $69,000 and $25,500 as seen on the daily chart. The crypto is retracing at the moment. A likelihood of a rise to $48,000 is high. Bear in mind that the $52,000 level is the Fibonacci 0.618 retracement of the entire drop. Bears could regain control if the price reaches this level. Trading plan:Potential rally through $48,000-52,000 mark against $20,000 Good luck! The material has been provided by InstaForex Company - www.instaforex.com |
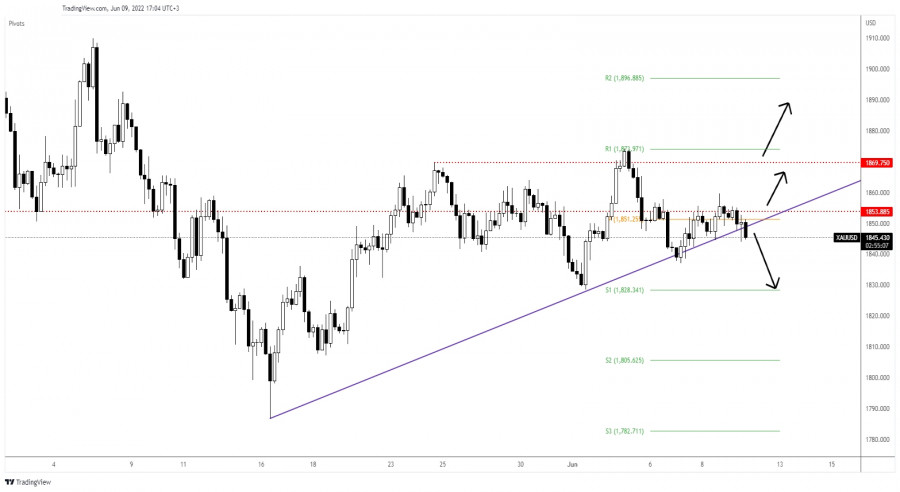
| Posted: 09 Jun 2022 07:24 AM PDT XAU/USD dropped after failing to stabilize above the 1,853 key level. Now, it was trading at 1,845 at the time of writing. Technically, the price action signaled that the buyers are exhausted and that the bears could take the lead again. Still, a strong sell-off needs confirmation. Fundamentally, gold seems strongly bearish after the ECB announced a 25 bps hike in July. As you already know, the Main Refinancing Rate was left unchanged at 0.00% at the June meeting. XAU/USD plunged as the US dollar index rallied in the short term. Don't forget that the US is to release its inflation figures tomorrow. The CPI and the Core CPI are seen as market-driving events that could bring sharp movements in gold as well. XAU/USD Trading In The Red!
Gold found resistance above the 1,853 level. It declined below the uptrend line. A breakout through this dynamic support could open the door for a larger drop. Technically, staying on the uptrend line signaled an imminent breakout. After its sell-off, the XAU/USD pair could test the uptrend line before resuming its decline. XAU/USD OutlookThe current aggressive breakout could give a selling opportunity. iI's risky to go short as the price could test the broken uptrend line or invalidate the breakout. A new low below the 1,837 could lead to a downward movement. This scenario could bring new short opportunities. The material has been provided by InstaForex Company - www.instaforex.com |
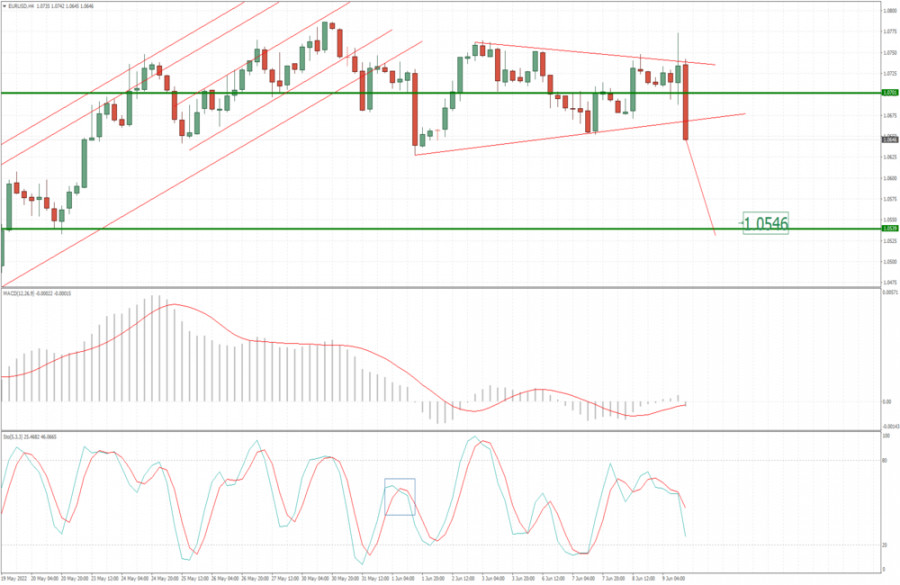
| EUR/USD analysis for June 09, 2022 - Breakout of the consolidation to the downside Posted: 09 Jun 2022 07:22 AM PDT Technical analysis:
EUR/USD has been trading downside today and there is the breakout of the consolidation in the background. Trading recommendation: Due to the breakout of the consolidation, I expect further downside movement. Watch for selling opportunities on the intraday rallies with the downside objective at the price of 1.0545. Stochastic is showing downside momentum, which is good for further drop. Key resistance is set at the price for 1.0775 The material has been provided by InstaForex Company - www.instaforex.com |
| Bitcoin: growing acceptance of crypto and extreme fear in market Posted: 09 Jun 2022 07:19 AM PDT According to the technical indicators, Bitcoin's chart does not show any significant changes. The asset managed to recoup Tuesday's drop a little at the end of the day. However, BTC continues to decline within a sideways channel. At the same time, Bitcoin still has room to move to the lower boundary of the sideways channel of $28,600- $32,000. Currently, it is clear that the medium-term trend is likely to be determined by the breakthrough of the range. Many crypto analysts are predicting bearish sentiment, even though the recent upward bounce gives some hope. In addition, most people who hold the token also do not appreciate expensive BTC. Why negative market sentimentAccording to Santiment, a weighted sentiment metric indicates an extremely bearish outlook for Bitcoin. The observation suggests a mostly negative attitude from BTC holders in the market. However, this can also lead to unexpected "upside swings" with a high leverage ratio and an over-average negative funding rate. Amid this background, one crypto analyst tried to predict a new low of the main cryptocurrency in 2022. He later added: "Whether you like it or not, capitulation is likely," given the current market situation. Meanwhile, the Bitcoin Fear and Greed index is currently at 17 in the "Extreme Fear" territory. Despite analysts' bearish comments, the main cryptocurrency has recovered well recently. The Bitcoin network has also seen a surge in activity, with volume up by 13% to $40 billion. What's going on behind the crypto marketOther experts are paying attention to what's going on in the Bitcoin network, assessing the fundamentals that continue to set higher levels for valuation. One of these key indicators is the growth of active entities on the network. An active entity is an estimated cluster of addresses controlled by the same individual, institution, or market participant. "Active" means that you sent or received Bitcoin on that day. The index is calculated from Glassnode data. Although it cannot be considered conclusively reliable, it works well to track growing demand over time. Thus, the number of active entities has more than doubled since 2016, from 126,904 to 255,333. The top of the last two cycles was preceded by active entity growth and spikes, reaching 376,549 and 432,636 in 2016 and 2021 respectively. Subsequent bottoms tended to have higher lows as each cycle printed a new high on the active entity. This clearly shows that the number of new "users" who are using Bitcoin's on-chain transactions over time is increasing. Bitcoin entities, the value of the network, and the number of addresses with non-zero balances continue to grow, indicating wider adoption of the major cryptocurrency. How to estimate the market value of BitcoinOnchain data analysts have also tried to estimate the changing market value of Bitcoin. One such useful attempt has been the Network Value to Transactions (NVT) ratio. It is the ratio of Bitcoin's USD market capitalization to the USD value of the on-chain transaction volume, tuned for the activity of the internal entity. Bitcoin's NVT ratio shows a clear trend of increasing the value of the network over time. Higher values above the trend indicate that it is overpriced, while lower values below the trend indicate that the price is undervalued. There is a growing supply of Bitcoins that can be off-chained on exchanges, and the growing adoption of the Lightning Network, which is not accurately reflected in the NVT ratio. Widening adoption of cryptocurrencyThe next indicator that is proposed to measure is the number of Bitcoin addresses with a non-zero balance since 2012. With some counting methodology, it gives a simple indication of the growing adoption of Bitcoin. The number of non-zero balance addresses continues to grow at a double-digit rate each year, with an annual growth rate of 18.2% in 2022. Using a simple trend forecasting model, the number of non-zero-balance addresses will nearly double by 2026 at this rate. This forecast assumes annual growth of only 10-13% each year, well below the current trend. In effect, this high-level view reflects the adoption of Bitcoin's S-curve over time.
ConclusionsThe acceptance of Bitcoin and the crypto industry is rising on a global scale. However, that does not prevent the price from pulling even lower amid a local state of extreme fear. Nevertheless, I still prefer technical analysis, especially in times of uncertainty. Therefore, we continue to wait for the price to break out of the sideways channel. Until it has not happened, there is no point in worrying about local movements. We can cautiously trade within the corridor on the rebound, keeping in mind risks and protecting positions with Stop Loss orders. The material has been provided by InstaForex Company - www.instaforex.com |
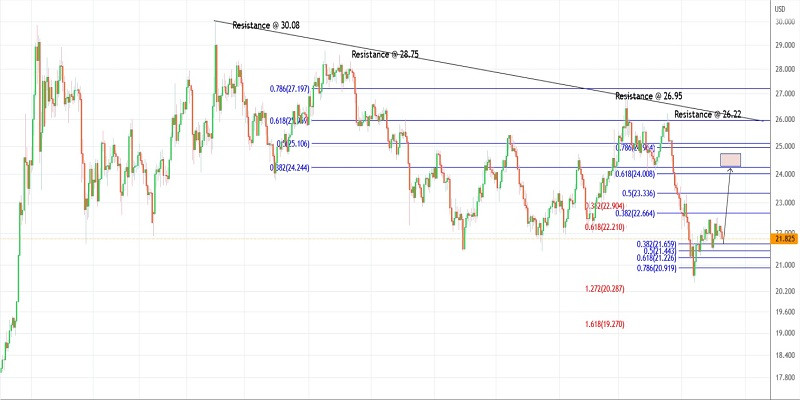
| Trading plan for Silver for June 09, 2022 Posted: 09 Jun 2022 07:17 AM PDT
Trading plan:Silver dropped to an intraday low of $21.75 on Thursday after having rallied through the $22.24 high early this week. It might have carved a higher low above $21.40, reached recently. Bulls will try to hold prices above a low of $20.45 to keep the near-term outlook constructive. They are likely to push the price to $24.00. Silver is unfolding a countertrend rally after printing a low of $20.45 in May 2022. The recent downward upswing is between $20.45 and $22.44. The price has already retraced to support around $21.40. The price may drop to $21.30, which is the Fibonacci 0.618 retracement level of the recent upswing. Silver prices may complete the corrective phase by reaching the $24.00-20 zone. The larger degree downswing is between $26.22 and $20.45. Bear in mind that this is the Fibonacci 0.618 retracement level of the above downswing. Hence high probability remains for a bearish bounce if prices reach there. Trading plan:Potential rally through $24.00-20 against $20.00 Good luck! The material has been provided by InstaForex Company - www.instaforex.com |


| You are subscribed to email updates from Forex analysis review. To stop receiving these emails, you may unsubscribe now. | Email delivery powered by Google |
| Google, 1600 Amphitheatre Parkway, Mountain View, CA 94043, United States | |


Comments