Forex analysis review
Forex analysis review |
- EUR/USD. The head of the ECB gave the euro only situational support
- Euro takes a step back
- GBP/USD analysis on June 28. The pound sterling follows the euro currency, copying its every step
- EUR/USD analysis on June 28. The euro currency hardly continues to remain within the framework of the rising wave
- EUR/USD analysis on June 28, 2022. Christine Lagarde confirms ECB rate hike coming in July
- GBP/USD. June 28. Pound continues to build fences near 1.2315
- USD/JPY is growing despite the weakening of the dollar, first target is 136.70
- XRPUSD technical analysis for June 28, 2022.
- Ichimoku cloud indicator analysis on Gold for Tuesday June 28th, 2022.
- EURUSD rejected at Kumo (cloud) resistance
- USDJPY ready to make new higher highs for 2022.
- USD/CHF Technical Analysis and Trading Tips for June 28, 2022
- Technical analysis recommendations on EUR/USD and GBP/USD for June 28, 2022
- Investors are concerned about the actions of the ECB and the public debt of European countries
- US stock indexes fall on Monday
- Trading plan for Russel 2000 on June 28, 2022
- BTC update for June 28,.2022 - Double bottom pattern confirmed
- American premarket for June 28: the largest American banks announced an increase in dividend payments
- Analysis of Gold for June 28,.2022 - First downside objective reached
- USD/CHF analysis for June 28, 2022 - Strong upside trend continuation
- Dollar may halt growth, while the collapse of the crypto market will continue (expect a local increase in USD/JPY and XAU/USD)
- Bitcoin looks "oversold," but is in no hurry to recover
- Trading plan for NASDAQ on June 28, 2022
- GBP/USD: the plan for the American session on June 28 (analysis of morning deals). The pound shows no signs of life
- EUR/USD: the plan for the American session on June 28 (analysis of morning deals). The euro again fell short of 1.0603
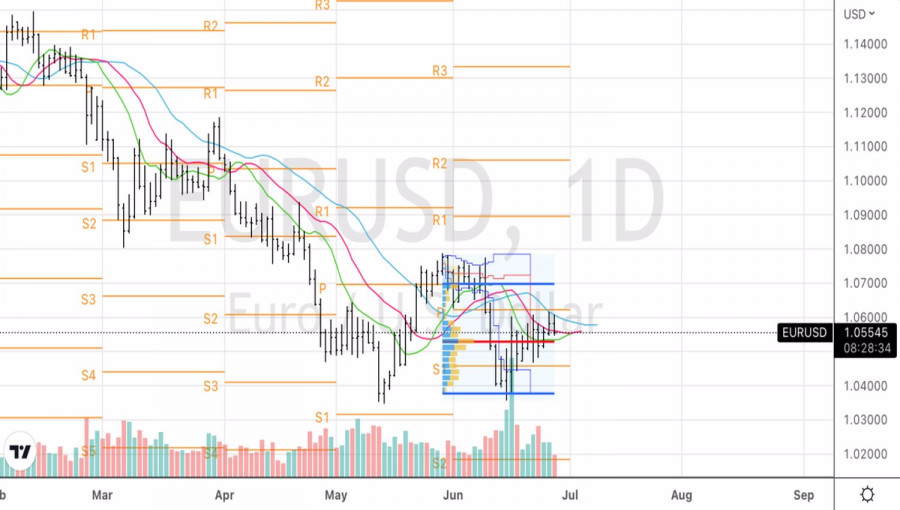
| EUR/USD. The head of the ECB gave the euro only situational support Posted: 28 Jun 2022 09:01 AM PDT The euro/dollar pair did not stay within the 6th figure today. The price crossed the resistance level of 1.0600, but then the northern momentum began to fade, as buyers began to take profits. This is not the first attempt to storm the sixth price level. The first such attempts were made last week when traders reached 1.0607. EUR/USD buyers made another breakthrough yesterday, reaching the target of 1.0615. All these attempts have failed.
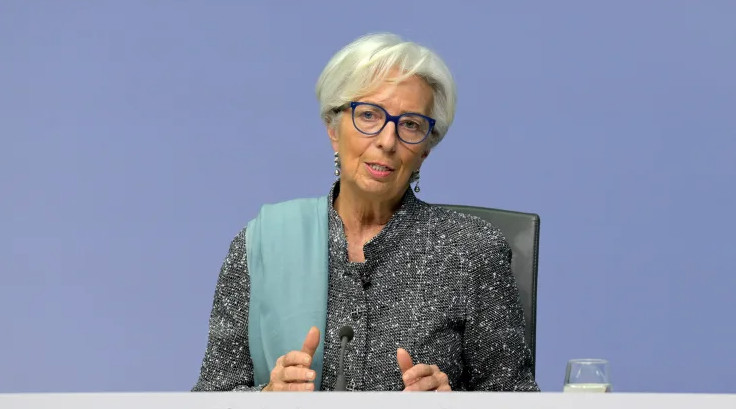
It is noteworthy that all previous attempts were mainly due to the weakening of the US currency. Whereas today's northern breakthrough happened due to the strengthening of the euro. The single currency reacted to the hawkish rhetoric of Christine Lagarde, who today opened the ECB economic forum in the Portuguese city of Sintra. It should be recalled here that Lagarde's previous speech (in the European Parliament) last week put pressure on the euro. The head of the ECB hinted that the September increase is still an unresolved issue – they say the regulator may raise its interest rates again in September "if the situation requires it." At the same time, she assured MEPs that in July the rate will be increased by only 0.25%.Lagarde's indecision disappointed EUR/USD buyers, after which the price briefly fell into the area of the 4th figure. But today, the head of the ECB can be said to have "rehabilitated" – at least, her rhetoric was more confident and hawkish. In particular, she said that the European regulator is ready for a more drastic tightening of policy to curb inflation "if necessary." In other words, Lagarde made it clear that by September the ECB may be ready for a larger rate hike if inflation in the eurozone continues to show growth. In this context, special attention should be paid to Friday's release: on the last trading day of this week, a report on the growth of the consumer price index in Europe will be published. According to preliminary forecasts, the overall CPI in the eurozone will again update the historical record, reaching 8.4%. The core index should also demonstrate positive dynamics, rising to 4%. If this release is released at the forecast level (not to mention the "green zone"), the market will again talk about the increased probability of a 50-point rate hike following the results of the September meeting. It should also be noted that at today's forum in Sintra, Lagarde spoke about ways to solve the problem of fragmentation in the European region. According to the head of the ECB, the regulator will use "flexibility" when reinvesting repayments coming under PEPP. Lagarde stressed that such a flexible approach "will limit undesirable fluctuations in the government bond market after an interest rate increase." In other words, the head of the European Central Bank voiced very encouraging and rather hawkish theses, thanks to which EUR/USD traders once again tested the 6th figure - this time due to the strengthening of the euro.
And yet, buyers could not hold their positions above the 1,0600 mark. The pair turned 180 degrees and headed to the base of the 5th figure, against the background of the growth of the US dollar index. It is noteworthy that traders ignored even a weak report from the United States: the June CB consumer confidence index fell to 98.7 points, while experts expected it to be at around 100. The indicator has been declining for the second month in a row. However, stronger reports on durable goods and home sales in the States partially offset the decline in the American consumer confidence index. In general, Tuesday's intraday price dynamics suggest that traders prefer not to take risks with longs, being above the target of 1,0600. As mentioned above, buyers repeatedly tested the boundaries of the 6th figure, but each time they came back. The dollar was also supported today by the head of the Federal Reserve Bank of New York, John Williams, who stated that "recession is not its base scenario." He also noted that the Federal Reserve "needs to reach 3.5% - 4% of the federal funds rate." At the same time, he confirmed the likelihood that the Fed will also raise the rate by 75 basis points in July. In my opinion, the EUR/USD pair in the medium term will continue to trade within the wide-range flat, in the range of 1.0450-1.0600. Traders have not left this price corridor for the second week. For the development of the southern trend, sellers should at least go to the base of the 4th figure, and at most - gain a foothold within the third figure. Buyers, in turn, should be designated above 1.0600 to qualify for more ambitious goals, among which is a return to the price range of 1.0640–1.0760. Neither sellers nor buyers of the pair have yet decided to leave the 1.0450-1.0600. Therefore, when approaching the resistance level of 1.0610 (the lower limit of the Kumo cloud on the daily chart), it is advisable to open short positions with targets of 1.0500 and 1.0450 (the Tenkan-sen line on the same timeframe). The material has been provided by InstaForex Company - www.instaforex.com |
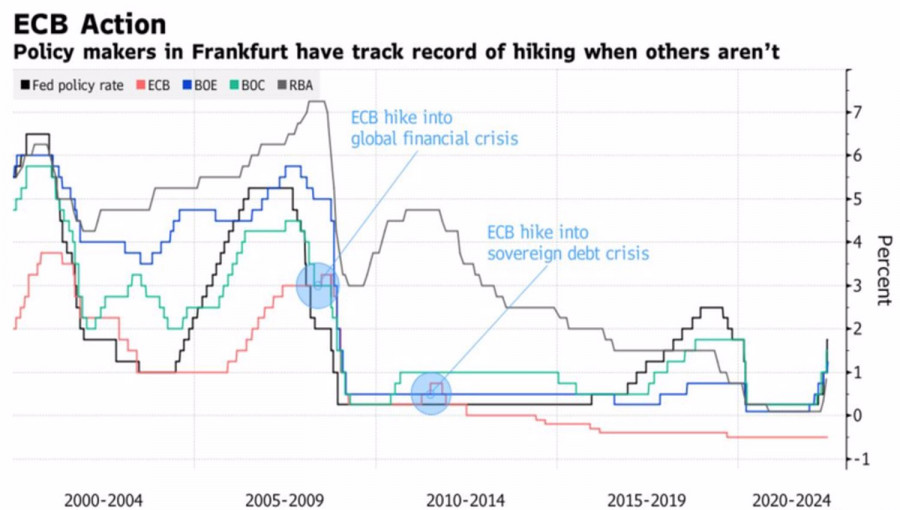
| Posted: 28 Jun 2022 08:00 AM PDT When Mario Draghi said 10 years ago that the ECB would do whatever was necessary to save the euro, he didn't know that, ironically, he would become the prime minister of a country that could kill the European currency. Italy's public debt exceeds 150% of GDP, with €200 billion to be repaid in 2022 and €305 billion in 2023. At the same time, the ECB's monetary tightening process, which starts in June, leads to an increase in borrowing costs and increases debt servicing costs. All this increases the risks of default and the collapse of the eurozone. Bulls on EURUSD have something to fear. No wonder they take a step back after one or two steps forward. ECB President Christine Lagarde is well aware of the gravity of the current situation, so she promised the markets an anti-fragmentation program. It is aimed at narrowing the yield spreads of the same Italian bonds with German ones. An increase in the indicator indicates stress in the debt market, while its decrease indicates that the market has come into order. The problem is that the details of the program are unknown and investors doubt whether the ECB will be able to develop it by July. Some points are leaked to the press. In particular, the European Central Bank does not want to increase liquidity, so it is planned to use funds raised from banks as resources for the implementation of the anti-fragmentation program. They will be obtained at auctions at a rate higher than the deposit rate. It should be noted that over 10 years, the ECB has accumulated excess reserves of €4.48 billion, which gives it room for maneuver. Investors were looking forward to Lagarde's speech in Sintra, Portugal, with increased attention, drawing analogies to 2017, when Draghi launched an avalanche of EURUSD buying with a statement about the normalization of monetary policy. This time the euro bulls did not wait for a gift for themselves. Lagarde said that the ECB intends to start by raising the deposit rate by 25 bps, and then accelerate the process in September. In the future, the Central Bank plans to act gradually. Only a significant acceleration of inflation and inflationary expectations will force it to turn on its decisiveness. Dynamics of Central Bank Rates
Not good news for EURUSD fans, because the Fed has already included this decisiveness. Currently, the derivatives market expects a 238 bps cumulative increase in the deposit rate by mid-2023 compared to 280 bps two weeks ago. As a result, borrowing costs may fall short of 2%, while the federal funds rate will exceed 3.5%.
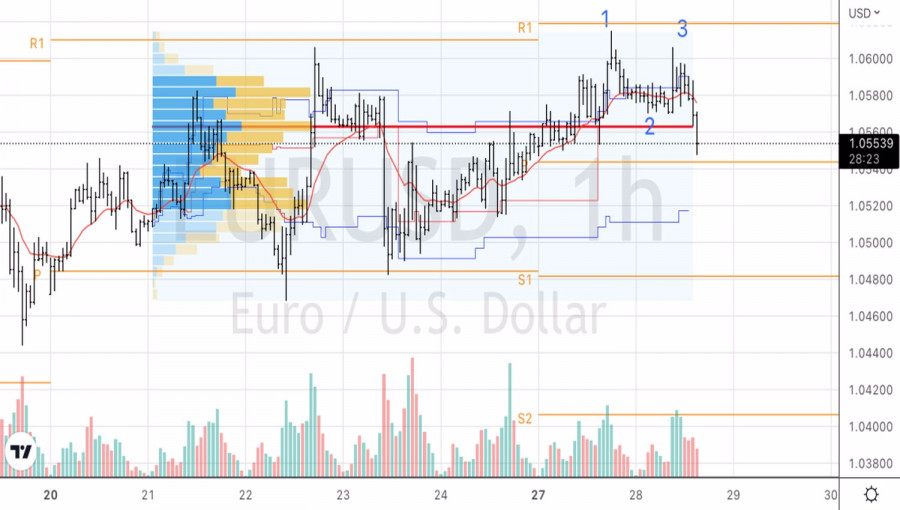
In my opinion, investors expected more from Lagarde's speech. Her rhetoric turned out to be not hawkish enough, which launched the mechanism of selling the euro on facts. Technically, a 1-2-3 reversal pattern was formed on the EURUSD hourly chart. The fall of the pair's quotes below the correction low in point 2 gave grounds for building up the previously formed shorts due to the inability of the bulls to take the euro beyond the upper limit of the fair value range of $1.05–1.057. The recommendation is to keep it. The material has been provided by InstaForex Company - www.instaforex.com |
| GBP/USD analysis on June 28. The pound sterling follows the euro currency, copying its every step Posted: 28 Jun 2022 07:42 AM PDT
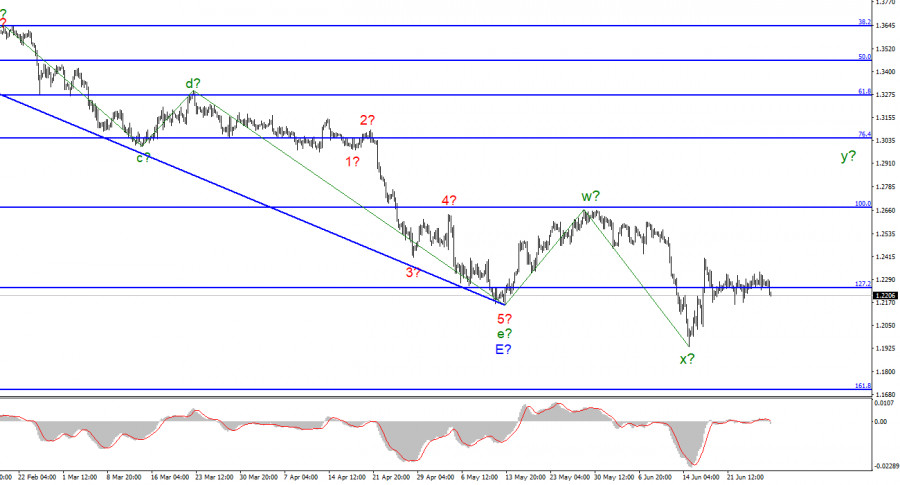
According to the pound/dollar instrument, the wave marking now requires additions and adjustments, but it may still take a more or less digestible form. At the moment, the last downward wave has gone beyond the low of the expected downward trend segment, which I consider completed. Thus, the classical correction structure a-b-c will no longer work. Nevertheless, wave analysis allows the construction of various correction structures, so a more complex three-wave formation w-x-y can be constructed. Anyway, the pound and the euro continue to show a very high degree of correlation, and both instruments should build approximately the same sections of the trend. Ascending. At the same time, according to the euro currency, it can be a classic a-b-c, and according to the pound, a rarer w-x-y. But in both cases, the instruments should now build an ascending wave, which should go beyond the peak of the previous ascending one. The wave marking on the British now looks not quite unambiguous, but still has the right to life. The fact that a stronger appreciation of the US currency did not begin after the Fed meeting is encouraging and gives so far chances to build the necessary upward wave. Waiting for Andrew Bailey's speech and the American GDP The exchange rate of the pound/dollar instrument decreased by 60 basis points on June 28. Market activity on Tuesday was again low. Even more surprising is the decline of the euro and the pound, although there were no prerequisites for this. I assumed that the market could react to Christine Lagarde's speeches on Monday and Tuesday, but today both euro currencies have declined, although Bailey will speak at the economic forum in Portugal only tomorrow. In other words, if the euro had specific reasons not to stand still, then the pound did not have them. Thus, I am assuming that Lagarde's speech has nothing to do with it. The market shows that it is not too interested in working out the current wave markup yet. The instrument moves strictly horizontally, along the 127.2% Fibonacci level. We also need an increase in demand for the British pound, without which there will be no construction of a corrective wave y, and adjustments will have to be made to the wave markup. Meanwhile, tomorrow is a more interesting day than the first two this week. That's because Andrew Bailey, Christine Lagarde, and Jerome Powell will give speeches in Portugal on Wednesday. I don't believe that they will provide important information to the market since Lagarde's first two speeches have already shown exactly that. Or the market simply did not pay any attention to them. In any case, it is not the events themselves that are important to us, but how the market will work them out. And it has obvious problems with this now. Also tomorrow, a report on GDP for the first quarter in the United States will be released. According to market expectations, the US economy will decline by 1.5% q/q. However, this value has long been known, and if it does not very likely change, it is unlikely that the market will pay attention to this event. General conclusions The wave pattern of the pound/dollar instrument has become more evident. I still expect the construction of an upward wave within the corrective upward structure. If the current wave marking is correct, then the instrument will continue to increase with targets located above the calculated mark of 1.2671, which corresponds to 100.0% Fibonacci. I recommend buying on each MACD signal "up".
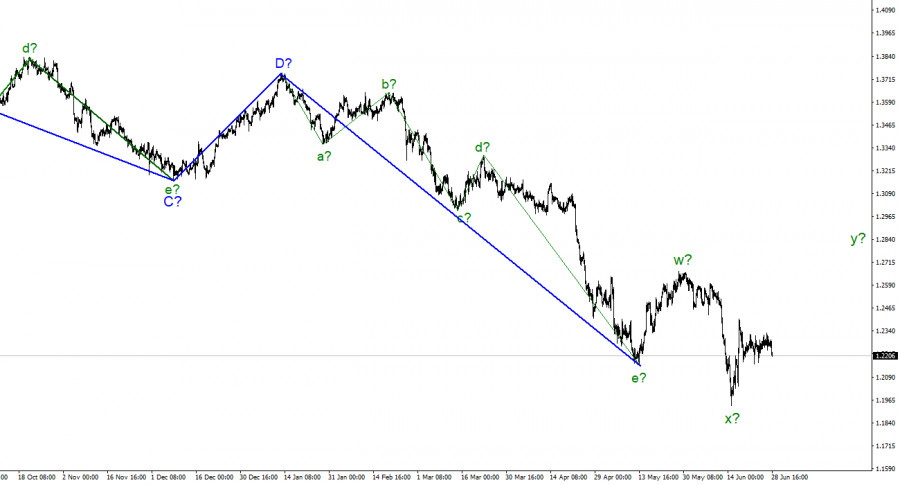
At the higher scale, the entire downward trend section looks fully equipped but may take on a more extended form. If the current correctional structure still takes an even more non-standard form, then adjustments will have to be made. The material has been provided by InstaForex Company - www.instaforex.com |
| Posted: 28 Jun 2022 07:42 AM PDT
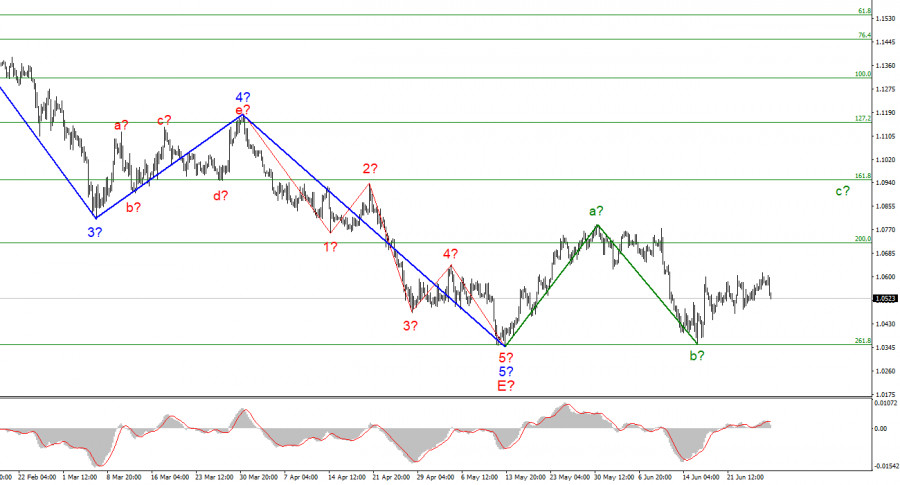
The wave marking of the 4-hour chart for the euro/dollar instrument continues to look convincing and does not require adjustments. In addition, the markup has not changed in recent weeks, as the market is completely calm. The instrument has completed the construction of a downward trend segment. If the current wave marking is correct, then the construction of a new upward trend section has begun at this time. It can turn out to be three-wave, or it can be pulsed. At the moment, two waves of a new section of the trend are visible. Wave A is completed, and wave b is also presumably completed. If this is indeed the case, then the construction of an ascending wave c has now begun. The instrument has not decreased under the low of the descending trend section, so the wave marking still retains its integrity. However, I note that the downward section of the trend may complicate its internal wave structure and take a much more extended form. Unfortunately, a very promising wave markup may be broken due to the news background. But at the moment, the chances of building an upward wave c remain. Only the news background can interfere. Lagarde's speeches and European inflation The euro/dollar instrument fell by 60 basis points on Tuesday. Market activity remains low, but I note that the news background has been practically absent in the last few days. To put it more precisely, on Monday, there was a report on orders for durable goods in the United States, and on Tuesday there was a speech by ECB President Christine Lagarde. But watching the movements of the instrument these days, I absolutely cannot say that the market has paid at least some attention to these events. What happened on the market on Monday and Tuesday? On Monday we saw a slight increase, and on Tuesday – a slight decrease. Both of these movements do not affect the current wave marking in any way. Both of these movements do not coincide at all with the nature and time of both events. The internal wave structure of the proposed wave c is already becoming very complicated and everything may end up with the instrument resuming the construction of a downward trend section. As I thought, the news background may interfere with the construction of a corrective wave. It is not currently exerting harmful pressure on the euro currency, but it also does not provide any support to it. And let me remind you, we need an increase in demand for the euro. So far, the market is not able to just slowly bribe the euro, relying on the wave picture. Therefore, a news background is needed. Christine Lagarde assured the market today that the ECB is ready to fight inflation and raise the interest rate in July, but the market clearly shows that a stricter attitude is required from the ECB, and not a promise to increase the rate once. Thus, to my regret, the wave marking is in danger. However, before a successful attempt to break low waves E and b, I still expect the construction of an upward wave. General conclusions Based on the analysis, I conclude that the construction of the downward trend section is completed. If so, then now you can buy a tool with targets located near the estimated mark of 1.0947, which equates to 161.8% Fibonacci, for each MACD signal "up". Wave b is presumably completed. An unsuccessful attempt to break through the level of 261.8% indicates that the market is not ready for new sales of the instrument.
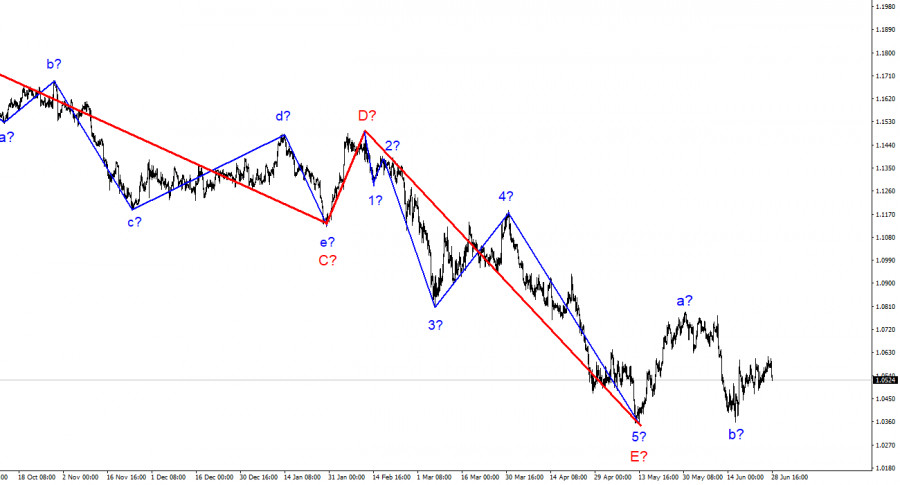
On a larger scale, it can be seen that the construction of the proposed wave E has been completed. Thus, the entire downtrend has acquired a complete look. If this is indeed the case, then in the future for several months the instrument will rise with targets located near the peak of wave D, that is, to the 15th figure. The material has been provided by InstaForex Company - www.instaforex.com |
| EUR/USD analysis on June 28, 2022. Christine Lagarde confirms ECB rate hike coming in July Posted: 28 Jun 2022 07:32 AM PDT
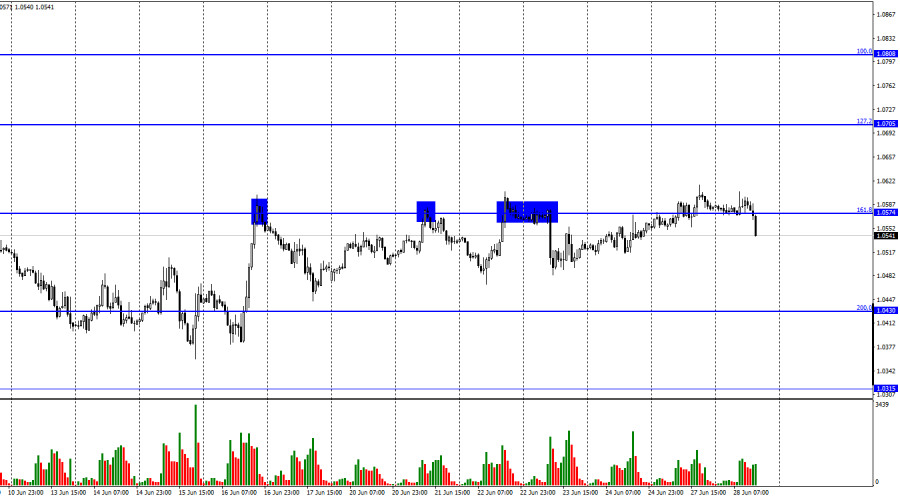
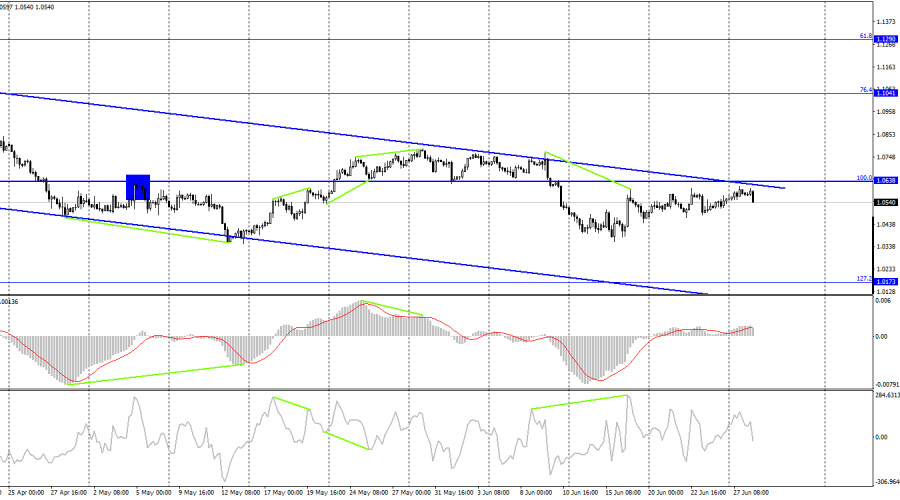
On Monday, EUR/USD continued to rise and managed to gain a foothold above the 161.8% retracement level of 1.0574. However, just as I predicted, this consolidation did not facilitate the further rise of the pair. As a result, the US dollar strengthened, and the price settled below the 161.8% Fibonacci level of 1.0574. This paves the way to the next downward target at the 200.0% Fibonacci level of 1.0430. I think that this decline will not be significant either. Judging by the current chart, neither bears nor bulls have enough strength to move the pair. Traders are currently in a wait-and-see mode. Even the speech by Christine Lagarde at the ECB forum in Sintra, Portugal, could not drive the market. The ECB President has confirmed the intention of the European regulator to raise the rate in July in response to mounting inflation in the eurozone. Her hawkish rhetoric should have spurred the demand for the euro. Instead, the European currency is sliding. As far as I see it, the new stance of the ECB President and even the first rate hike will not help the euro stay afloat or prompt its significant uptrend. In parallel, the Fed may raise the rate to 2.25-2.5%, thus beating the hawkish policy of the ECB. Christine Lagarde also noted that the pace of monetary tightening might be accelerated if inflation expectations increase. Notably, she spoke about expectations but not about inflation itself. It seems that the ECB relies on its economic forecasts which are quite optimistic given that the regulator is planning to raise the rate only two times this year. Obviously, such a stance of the regulator is not favorable for the euro bulls. So, EUR remains vulnerable.
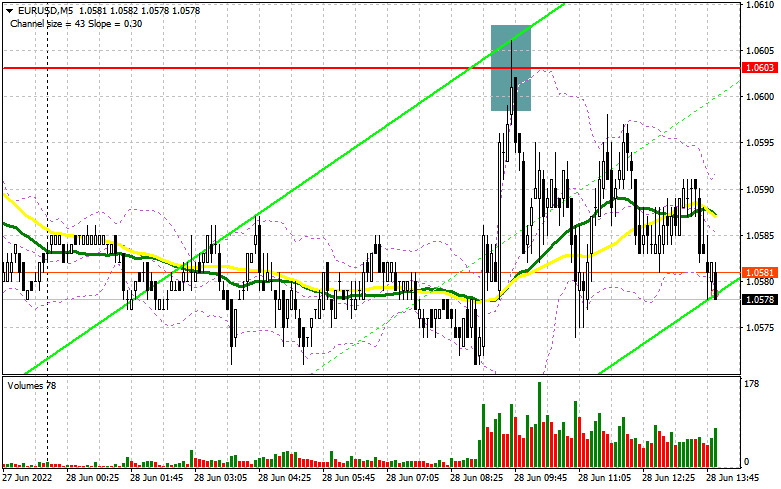
On the 4-hour time frame, the euro/dollar pair resumed its movement towards the upper line of the descending trend channel, which characterizes the market sentiment as bearish. I call this trajectory "a movement" rather than "growth" since it is too weak to be called otherwise. Consolidation of the price above the trend channel will significantly increase the chances for growth to the 76.4% fibo level located at 1.1041. Commitments of Traders (COT)
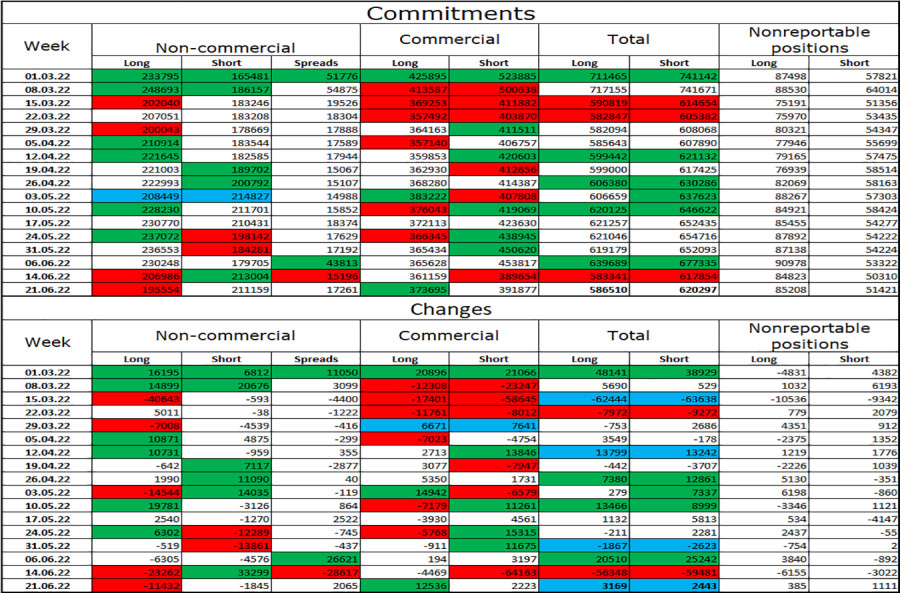
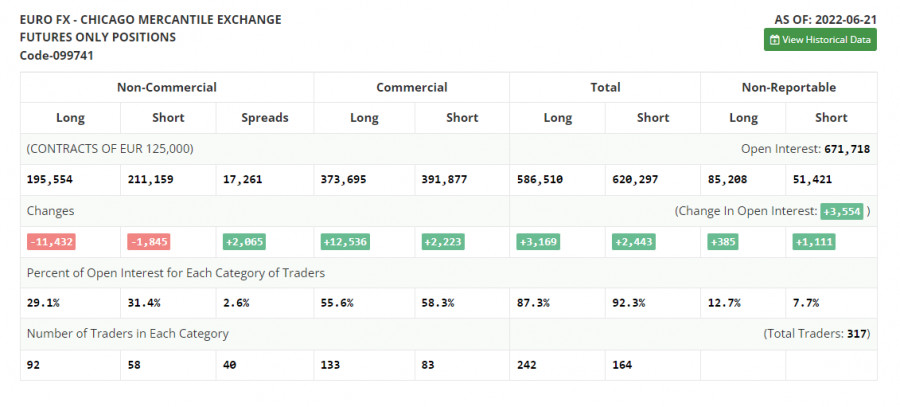
Last week, traders closed 11,432 Long contracts and 1,845 Short contracts. This indicates that the bearish sentiment has intensified among large market players. The total number of opened Long contracts stands at 195,000, while the number of Short contracts is 211,000. Although the difference is minor, it still shows that bulls are losing ground. In recent months, the non-commercial category of traders was mostly bullish on the pair, which did not support the euro in any way. The possibility of a rise in the euro was getting higher in recent weeks. However, the latest COT reports showed that the European currency may soon face a new sell-off. Neither the Fed nor the ECB has anything to support the euro. Economic calendar for US and EU: EU - ECB President Christine Lagarde speaks (11:00 UTC). On June 28, the economic calendar features only one important event in the EU. Christine Lagarde has already made a statement at the ECB forum today. Therefore, the influence of the information background will remain weak for the rest of the day. EUR/USD forecast and trading tips: I would recommend selling the pair on H1 after it rebounds from the level of 161.8% at 1.0574 with the next target found at 1.0430. You can consider selling the euro when the price settles firmly below the level of 1.0574. It is also possible to open long positions as soon as the price consolidates above the trend channel on H4 with the target at 1.1041. The material has been provided by InstaForex Company - www.instaforex.com |
| GBP/USD. June 28. Pound continues to build fences near 1.2315 Posted: 28 Jun 2022 07:18 AM PDT
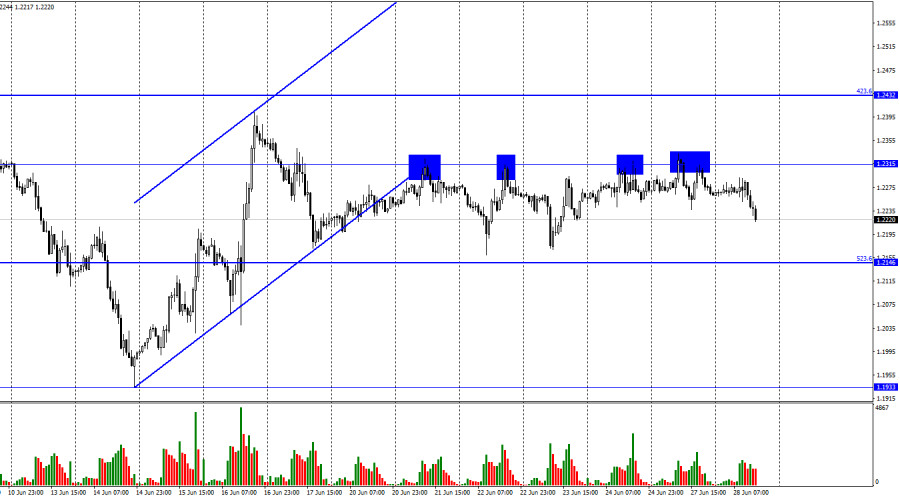
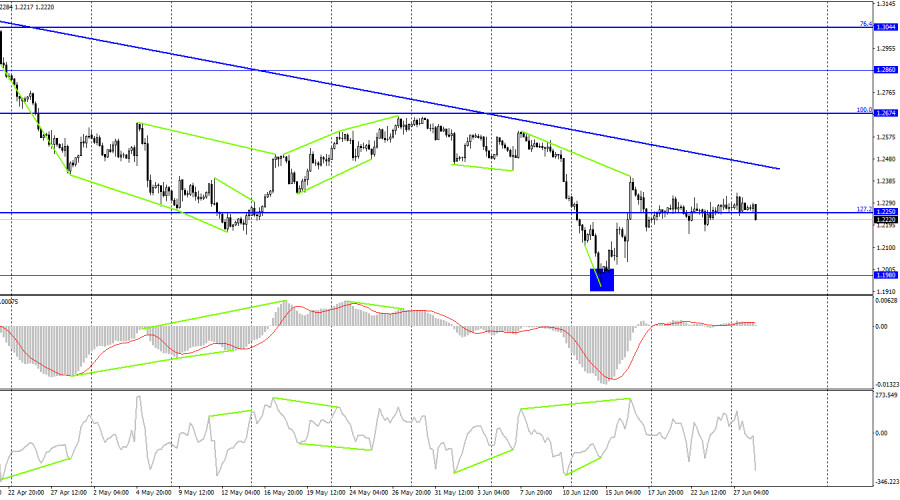
On Monday, the GBP/USD pair made the fourth pullback from 1.2315 on the hourly chart. So, the picture looks like a "fence" on the chart, though I use this word in my articles with a little different meaning. However, bulls failed to break through the level of 1.2315 in four or five attempts. At the moment the UK currency made a U-turn and started falling down again towards the correctional level of 523.6%, 1.2146, which it is unlikely to reach this time. The "fence" will end sooner or later. It may finish at any moment, but taking into account the fact that there is almost no information background for the GBP and the USD today, I see no reason to expect its end. There will be some interesting events this week. For example, all three central bank presidents - Lagarde, Bailey, and Powell - will be speaking at the economic forum in Portugal tomorrow. All of them can make an important statement that may wake traders up. Tomorrow, there will be the final Q1 GDP report in the US. Maybe, this report will be not as important as the previous one or coincide with traders' expectations. In other words, traders will have something to react to during the week. However, they paid no attention to the report on durable goods orders yesterday. Volumes of all categories of goods rose more than expected, but the US dollar showed no growth after that report. I can conclude that traders did not notice the released data. Likewise, they might not notice the central bank leaders' speeches tomorrow or the US GDP report. On Thursday, the Q1 GDP report is to be released in the UK. From my point of view, the first thing to do is to wait for the completion of the "fence" and then pay attention to the information background.
On the 4-hour chart, the pair performed a reversal in favor of the US currency after the CCI indicator showed a bearish divergence. the pair returned to the correctional level of 127.2%, 1.2250. The pair's consolidation under this level will again allow expecting further decline towards 1.1980, which was the starting point of the rise of the British pound. The downtrend line confirms that traders' sentiment remains bearish. I do not expect strong growth of the British pound until the price closes above the trend line. Commitments of Traders report:
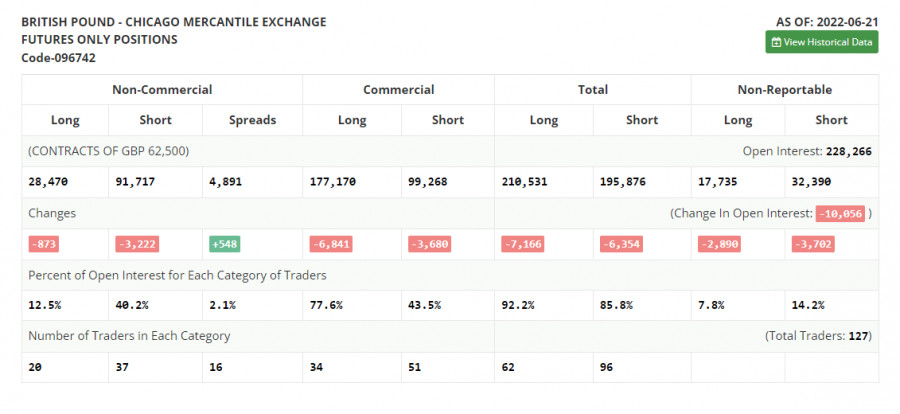
Non-commercial traders have become a bit more bullish this week. The number of Long contracts decreased by 873, and the number of Short ones dropped by 3,222. Thus, the sentiment of big players remained bearish, and the number of Long contracts still exceeds the number of Short contracts by several times. Large players continue to sell off the pound for the most part and their sentiment has not changed much lately. Thus, I think the British pound could resume its decline over the next few weeks. The strong divergence of the Long and Short contract numbers may indicate a trend reversal, but the information background is clearly more important to the big players right now. The news background does not support the British pound now. There is clear evidence that speculators are selling more than buying. Economic calendar for US and UK: On Tuesday, the economic calendars in the UK and the US are completely empty. The pound is showing active trading, but its movements so far fully fit the concept of the "fence", which we have seen in the last few days. Information background will have no influence on traders' sentiment for the rest of the day. GBP/USD forecast and recommendations for traders: You may sell the pound if it rebounds from 1.2315 on the hourly chart with the target at 1.2146. You can buy the pound if it fixes above the trend line on the 4-hour chart with the target of 1.2674. The material has been provided by InstaForex Company - www.instaforex.com |
| USD/JPY is growing despite the weakening of the dollar, first target is 136.70 Posted: 28 Jun 2022 06:30 AM PDT The USD/JPY pair is slowly but consistently developing the upward offensive, intending to gain a foothold in the area of the 136th figure. Over the course of three trading days, the price is gradually growing, overcoming intermediate resistance levels. And it looks like this trend will continue in the medium term. The US currency is the main engine of growth for USD/JPY, despite the fact that it is under general background pressure. The US dollar index is stuck in the middle of the 103rd figure after falling from 105.55. That is why the pair is growing rather slowly, with impressive intraday pullbacks.
The demand for the greenback has been falling for two main reasons. First, the market saw signs of a slowdown in inflation growth in the US. The reason for such conclusions was the June index of consumer confidence, which is calculated by the University of Michigan. It collapsed to 50 points, while in May it was at 58.4 points. After this release, the dollar came under pressure, while the S&P 500 index showed the highest increase since May 2020. The second reason for the general weakening of the greenback is the indecisive position of Federal Reserve Chair Jerome Powell regarding the prospects for tightening monetary policy. After all, the above inflation report should be viewed precisely through the prism of the position of Powell, who has not yet decided on the pace of interest rate increases. After his recent speech in Congress, the dollar lost its position, retreating from its reached highs. The de facto dollar rally ended after Powell did not defend the "ultra-hawkish" scenarios. On the one hand, the head of the Fed made it clear that the regulator will maintain a hawkish course, continuing to raise the interest rate until it breaks the inflation growth. But on the other hand, he stressed that "the pace of further rate increases will continue to depend on incoming data and changing economic conditions: the Committee will make a decision from meeting to meeting." This phrase can be interpreted unambiguously: the further pace of monetary tightening will depend on the dynamics of key inflation indicators, such as the consumer price index and PCE. The latest release of the CPI showed that inflation does not even think of slowing down: after a two-month decline, the index resumed its growth again, updating 40-year highs (after this release, the Fed raised the rate by 75 points, provoking a stronger dollar). As for the base price index for personal consumption expenditures in the US (PCE), now we can only use April data, while the report for May will be published on Thursday. Given the market reaction to the consumer confidence index from the University of Michigan, it can be assumed that PCE will provoke increased volatility for all dollar pairs, including USD/JPY. But note that while the greenback in the main pairs of the major group is losing its positions, the USD/JPY pair is slowly but still creeping up. In my opinion, this anomaly is explained by the divergence of the rates of the Fed and the Bank of Japan, which will persist regardless of the degree of Jerome Powell's hawkishness. As you know, the US Federal Reserve is now facing a choice: to raise interest rates in July by 50 or by 75 points. The Japanese regulator does not have such a dilemma: despite the growth of inflation indicators, the Bank of Japan decided to adhere to an accommodative monetary policy—"to support the economy." Moreover, representatives of the Japanese Central Bank, at every opportunity, declare that they are ready to soften the parameters of monetary policy, "if necessary." For this reason, the USD/JPY pair demonstrates an upward trend. The price goes up, albeit with deep corrective pullbacks. If we look at the MN timeframe, we can see that since March the pair has grown by more than 2,000 points. At the same time, there is no consensus in the market on where the pair will eventually end up. In June, the price renewed its 24-year high, so it is quite difficult to talk about any borders and "red lines." For example, according to currency strategists at Societe Generale, the pair will rise first to 138, then to 141. Westpac economists expect the pair to reach 137 in the near term. In turn, Rabobank experts say that there is a high probability that the pair will reach 140 in the short term. In my opinion, in the foreseeable future, it is necessary to consider more mundane targets. The first of them is 136.72 (a 24-year high, which was updated on June 22). The main target (in the medium term) is 137.70 (the upper line of the Bollinger Bands indicator on the D1 timeframe). The material has been provided by InstaForex Company - www.instaforex.com |
| XRPUSD technical analysis for June 28, 2022. Posted: 28 Jun 2022 06:11 AM PDT
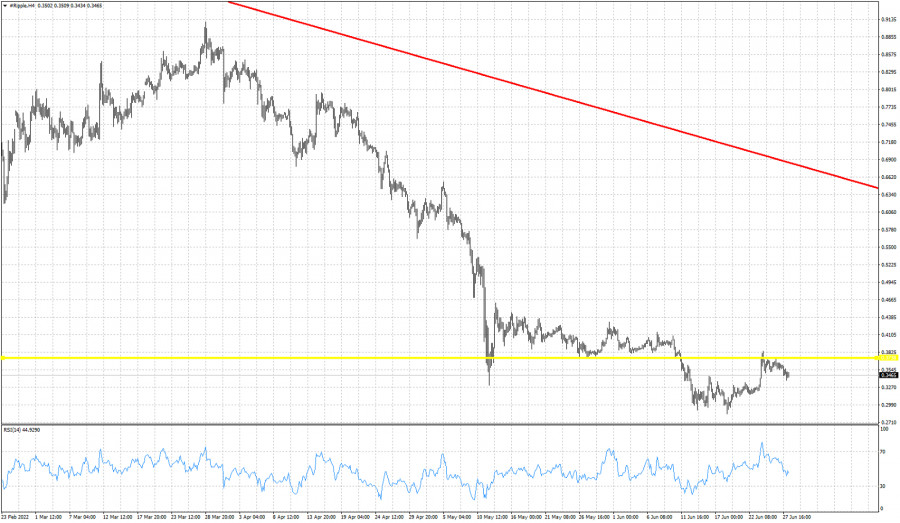
Red line - major resistance Yellow line -short-term resistance XRP is trading around $0.34. Price remains in a bearish trend since the March high around $0.90. With a decline of more than 50% since then, bears remain in full control of the trend. There is no sign of stopping this deterioration. XRPUSD recently tried to bounce higher towards $0.40 but price got rejected at the previous support which is now resistance. XRPUSD is also providing us with a bullish RSI divergence. Medium-term trend remains bearish. Bulls will need to recapture $0.41 at least in order to hope for a bigger trend reversal. Until then bears are in control. The material has been provided by InstaForex Company - www.instaforex.com |
| Ichimoku cloud indicator analysis on Gold for Tuesday June 28th, 2022. Posted: 28 Jun 2022 06:06 AM PDT
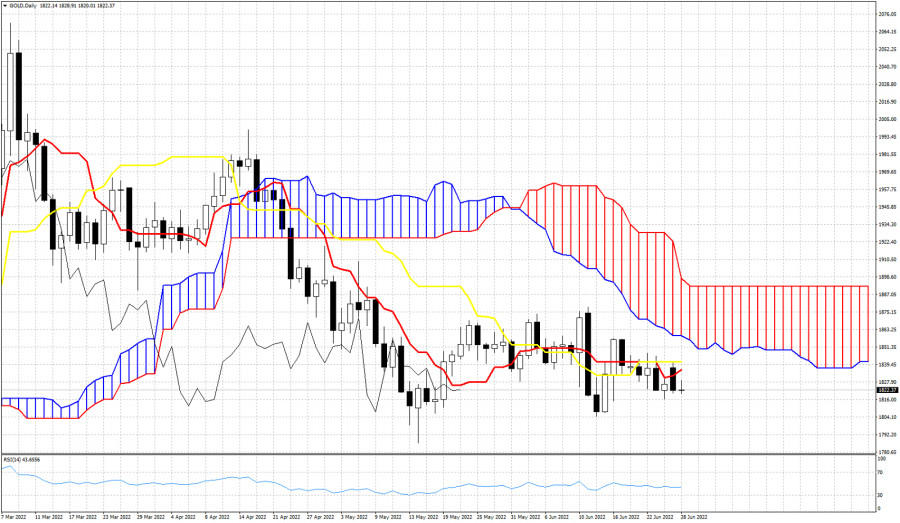
Gold price remains under pressure. Price is around $1,821 and below both the tenkan-sen (red line indicator) and the kijun-sen (yellow line indicator). In Ichimoku cloud terms this confirms we are in a bearish trend. Resistance is at $1,836-41 and next at the lower cloud boundary at $1,859. The Chikou span (black line indicator) has moved below the candlestick pattern. This is an added bearish signal. All signs are negative for Gold. More downside is expected. The material has been provided by InstaForex Company - www.instaforex.com |
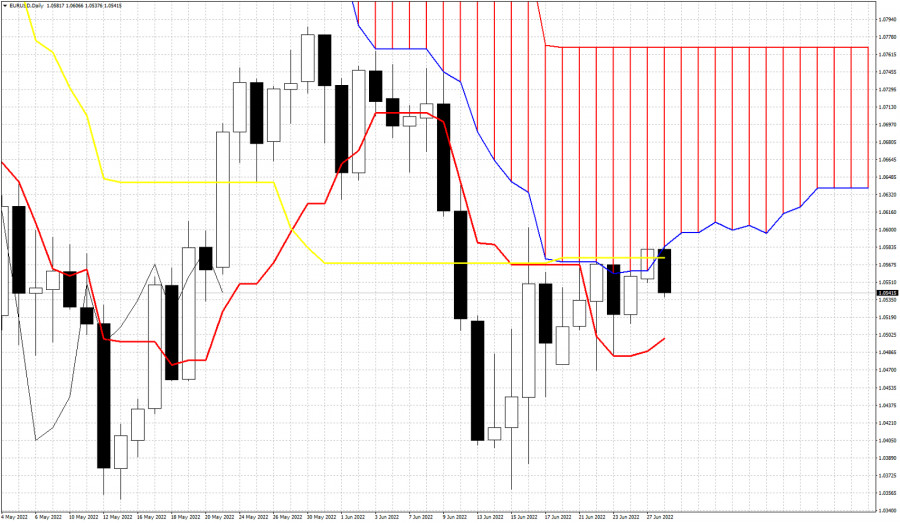
| EURUSD rejected at Kumo (cloud) resistance Posted: 28 Jun 2022 06:03 AM PDT
EURUSD bulls made another attempt to enter the Daily Kumo (cloud). Yesterday the daily candle closed above the kijun-sen (yellow line indicator) and inside the Kumo (cloud). Today price is getting rejected. If things stay like this, price action will be bearish. Support by the tenkan-sen (red line indicator) is at 1.05. The cloud rejection today if combined with a close below 1.0573 (kijun-sen), will be a bearish signal. Failure to stay above 1.05 will also be a bearish signal. Bulls need to react now and recapture 1.0590. As long as price is below the Kumo we remain bearish. The material has been provided by InstaForex Company - www.instaforex.com |
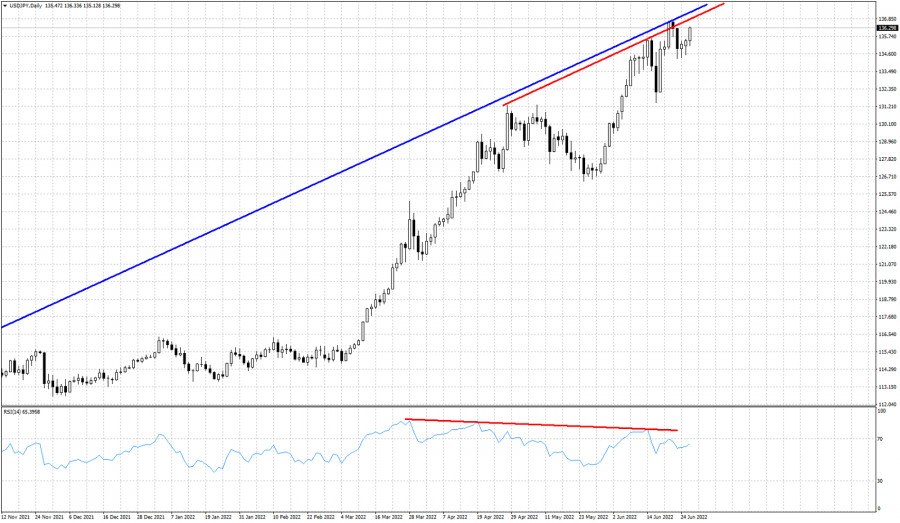
| USDJPY ready to make new higher highs for 2022. Posted: 28 Jun 2022 06:00 AM PDT
Red lines- bearish RSI divergence Blue line- resistance trend line USDJPY trend remains bullish as price continues making higher highs and higher lows. Price is soon expected to make new higher highs towards 137.10 but bulls need to be very cautious. In previous posts we warned that the bearish divergence in the RSI is a warning that the up trend is weakening. Support at 134.60-135 has been held so far and price is moving higher. Price has the potential to reach the blue resistance trend line at 137-137.20. However it seems very possible to see also a new bearish divergence combined with the new higher high. This is not a reversal signal but only a warning that the reversal is getting close. Bulls need to protect their gains. The material has been provided by InstaForex Company - www.instaforex.com |
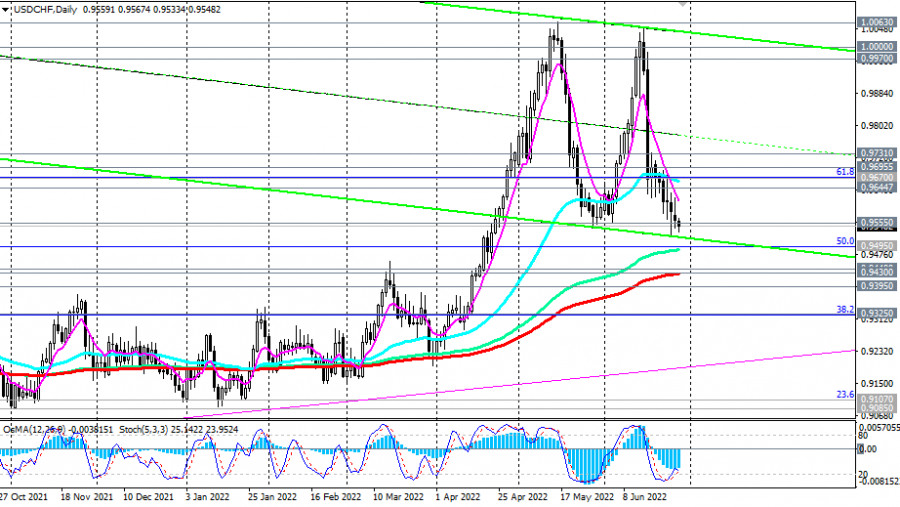
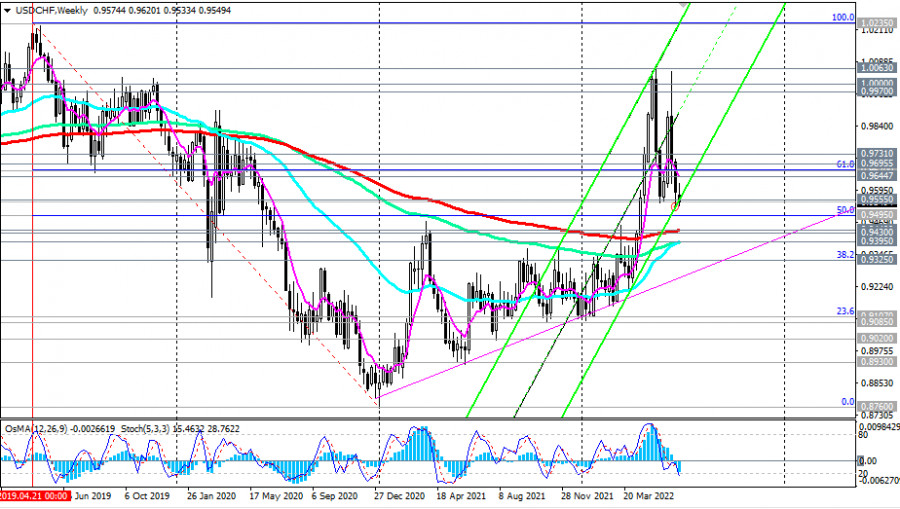
| USD/CHF Technical Analysis and Trading Tips for June 28, 2022 Posted: 28 Jun 2022 05:46 AM PDT
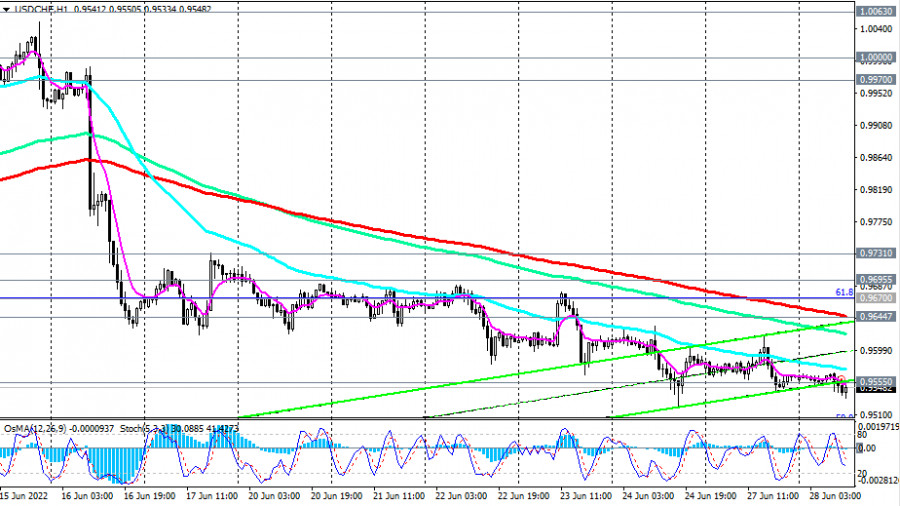
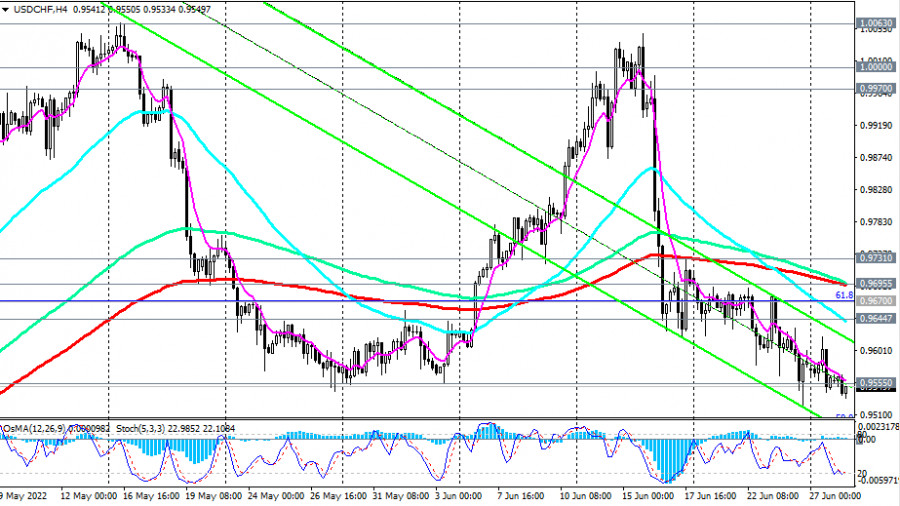
As of this writing, USD/CHF is trading near 0.9550, continuing to decline towards key support levels 0.9440 (200 EMA on the weekly chart) and 0.9430 (200 EMA on the daily chart).
USD/CHF is also trading in the zone below important short-term resistance levels 0.9695 (200 EMA on the 4-hour chart), 0.9645 (200 EMA on the 1-hour chart), and the resistance level 0.9670 (50 EMA on the daily chart and 61.8% Fibonacci retracement of the upward correction to wave of decline that began in April 2019 near 1.0235). There is one more important target on the way of price reduction to support levels 0.9440 and 0.9430—the support level 0.9495 (144 EMA on the daily chart and 50.0% Fibonacci retracement level), where a rebound and growth to resistance levels 0.9645, 0.9670, and 0.9695 is possible.
In case of a successful breakdown of the support level 0.9495, the USD/CHF decline will reach our targets near the support levels 0.9440, 0.9430. A breakdown of the support level 0.9395 (144 EMA, 50 EMA on the weekly chart) may once again return USD/CHF to the long-term bear market zone. As SNB Chairman Thomas Jordan said after the bank meeting on June 16, the Swiss franc is no longer highly overvalued. It accepts the possibility of further strengthening of the franc, which the SNB has so consistently fought against recently, keeping the interest rate on deposits at a record low level of -0.75% and interfering in trading in the market with the sale of the franc.
In an alternative scenario (after a rebound from the support level 0.9495 and after the breakdown of the local resistance level 0.9731), USD/CHF will continue to grow towards recent highs above 1.0000. For now, short positions remain preferable. Support levels: 0.9555, 0.9500, 0.9495, 0.940, 0.9430, 0.9400, 0.9395 Resistance levels: 0.9645, 0.9670, 0.9695, 0.9731, 0.9800, 0.9900, 0.9970, 1.0000, 1.0060 Trading Tips Sell Stop 0.9520. Stop-Loss 0.9625. Take-Profit 0.9500, 0.9495, 0.940, 0.9430, 0.9400 Buy Stop 0.9625. Stop-Loss 0.9520. Take-Profit 0.9645, 0.9670, 0.9695, 0.9731, 0.9800, 0.9900, 0.9970, 1.0000, 1.0060 The material has been provided by InstaForex Company - www.instaforex.com |
| Technical analysis recommendations on EUR/USD and GBP/USD for June 28, 2022 Posted: 28 Jun 2022 05:30 AM PDT EUR/USD
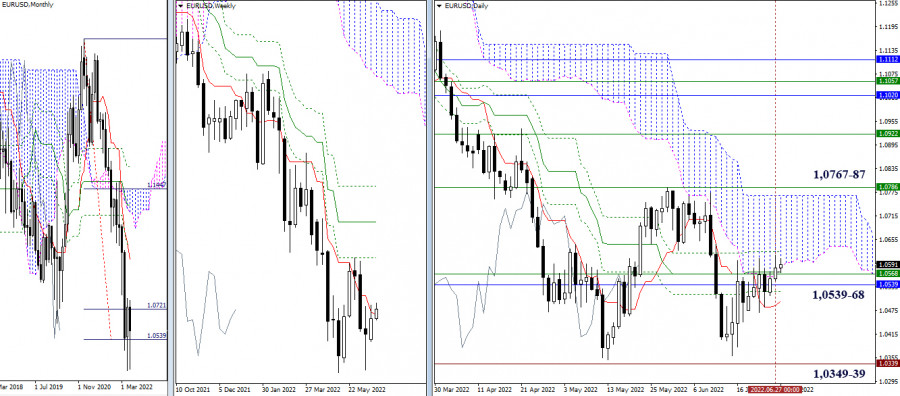
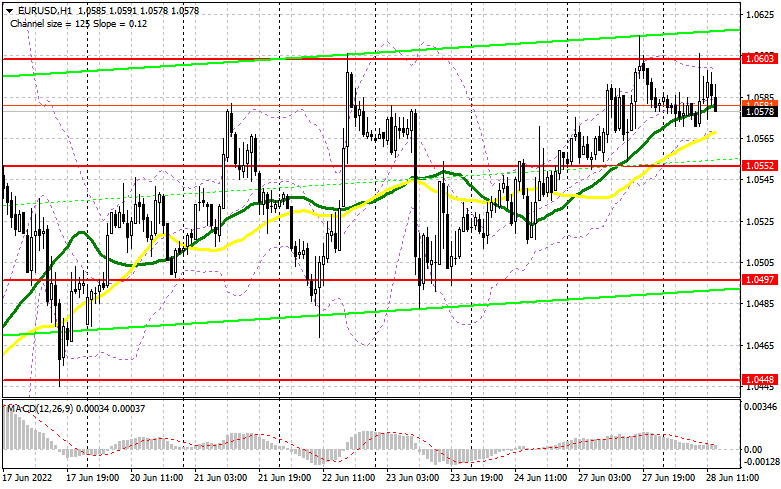
Higher timeframes Bulls are trying to get rid of the attraction and influence of the accumulated levels around 1.0539–68. In order for the attempt to succeed, they need to eliminate the daily death cross (1.0624), securely entrenched higher. After that, attention will be directed to the resistance levels 1.0767 (upper limit of the daily cloud) and 1.0787 (weekly Fibo Kijun). Failure and keeping the position in the zone of influence of the daily cross, strengthened by the weekly short-term trend at 1.0568 and the monthly support at 1.0539, will provoke the opponent to the initiative and activity. In the current situation, the interests of bears will be focused on restoring the downward trend of higher timeframes, for this, the bears need to go down below the local lows (1.0349–39) and securely gain a foothold there.
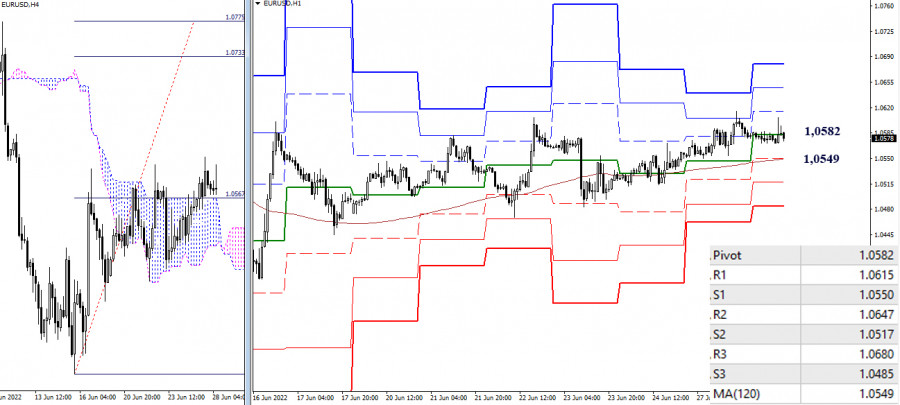
H4 – H1 Bulls retain the advantage on the lower timeframes, but they fail to develop the situation and achieve results. The pair is currently pegged to the central pivot point of the day (1.0582). The reference points for the continuation of the rise within the day are the resistance of the classic pivot points (1.0615 – 1.0647 – 1.0680). The key support of the lower timeframes today will defend the interests of bulls at the turn of 1.0549 (weekly long-term trend). Consolidation below will change the current balance of power. The next reference points for the decline will be the support of the classic pivot points 1.0517 and 1.0485. *** GBP/USD
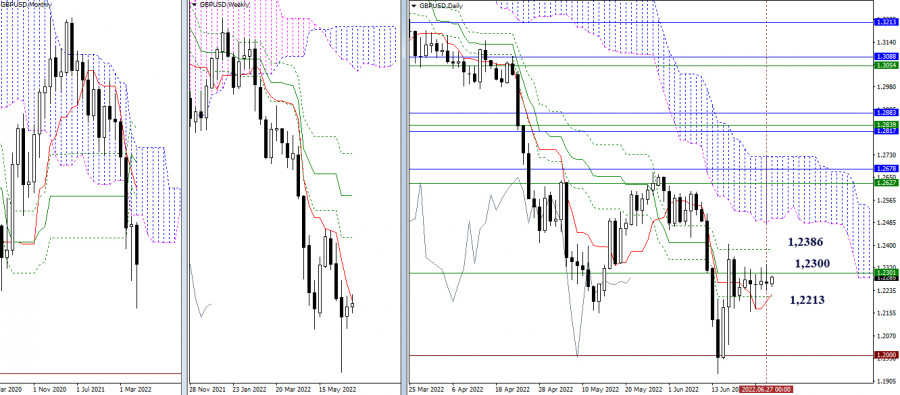
Higher timeframes The daily consolidation in the area of the weekly short-term trend (1.2300) is preserved. Immediate support can be noted now at 1.2213, and resistance at 1.2386, these are all levels of the daily Ichimoku cross. More distant landmarks when exiting the consolidation zone retain their location and significance. So for bears, this is the support area of 1.2000 (psychological level) – 1.1933 (local low), and for bulls, this is the resistance of the daily cloud (1.2500 – 1.2727), reinforced by the weekly (1.2626) and monthly (1.2678) levels.
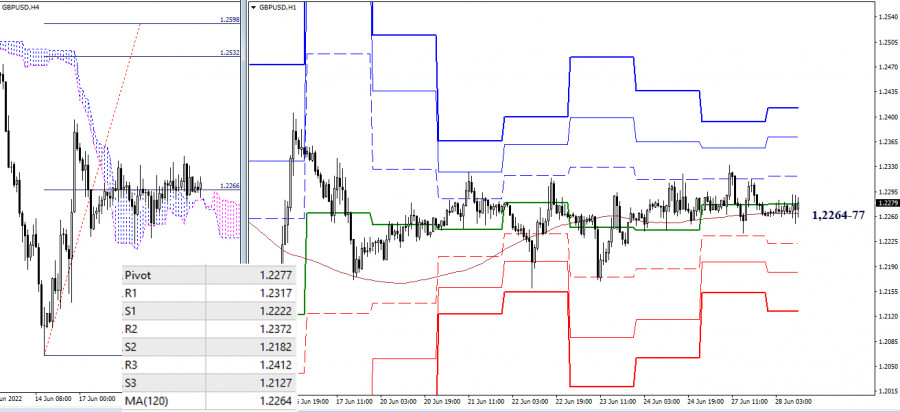
H4 – H1 The uncertainty of the higher timeframes is comparable to the uncertainty and lateral movement of the lower timeframes. The pair has been tied to the zone of attraction and influence of key levels for a long time, which today is located within 1.2264 (weekly long-term trend) – 1.2277 (central pivot point of the day). If there are changes and the development of the movement is outlined, then today the following reference points can be noted at 1.2317 – 1.2372 – 1.2412 (resistance of the classical pivot points) and 1.2222 – 1.2182 – 1.2127 (support of the classical pivot points). *** In the technical analysis of the situation, the following are used: higher timeframes – Ichimoku Kinko Hyo (9.26.52) + Fibo Kijun levels H1 - Pivot Points (classic) + Moving Average 120 (weekly long-term trend) The material has been provided by InstaForex Company - www.instaforex.com |
| Investors are concerned about the actions of the ECB and the public debt of European countries Posted: 28 Jun 2022 05:10 AM PDT The European currency does not show much signs of life against the background of the lack of important statistics and another failure with a breakdown of the resistance of 1.0600. The British pound shows the volatility of about 25 points in all. But before we talk about the technical picture, I would like to touch on Lagarde's speech a little. Investors are also still concerned about high inflation and are closely monitoring what the European Central Bank and its representatives are saying and doing. In an interview with ECB President Christine Lagarde today, she outlined the clear positions of the regulator, but this did not affect buyers of risky assets. The management of the Central Bank is afraid of the high debt burden of several European countries, especially Italy, as the increase in interest rates, which will occur from day to day, will lead to an increase in the burden of servicing the national debt. Some shits that continue to actively increase their budget deficits, it's not just about Italy anymore, may face serious problems in the future. Most recently, the President of the European Central Bank announced a planned emergency meeting to resolve the issue of further growth in bond yields. Now Lagarde has downplayed fears of a recession in the eurozone, saying her team is ready to raise rates at a faster pace — if necessary, especially if inflation continues to rise.
Let me remind you that the ECB's target is 2.0%, but it is expected that this year the overall inflation rate in the eurozone will come close to 7.0%. Representatives of the central bank will soon meet in Portugal at an annual conference dedicated to the growing consumer price index. At the beginning of the month, the European Central Bank held a meeting, announcing a new tool aimed at eliminating the risks of fragmentation in the eurozone. However, market participants still have a lot of questions about the timing and scope of the implementation of this mechanism. Most likely, the planned meeting will shed light on the new ECB instrument. At the moment, investors are increasingly listening to the statements of the regulator and sharply reacting to the actions of the Central Bank, as high inflation leads to a very rapid change in the situation. As noted above, the ECB confirmed in early June its intention to raise rates next month, and then again in early autumn this year. This will return the ECB deposit rate from negative territory to zero, which will be an important moment for the central bank, which has kept rates below zero since 2014. But the moment remains much more uncertain what will happen if Lagarde does not stop there and continues raising interest rates. The region's growth prospects are deteriorating quite rapidly. Back in June, the ECB predicted the level of eurozone GDP at 2.8%, but already this estimate is unrealistic. There have already been rumors of a possible recession by the end of the year – especially against the background of continuing price increases and a serious shortage of energy resources in the Eurozone. Aggressive rate increases will only make the situation worse. As for the prospects of the euro, there is uncertainty. It is possible to talk about serious purchases and attempts by bulls to correct the situation, but only after an obvious return and consolidation above 1.0600. It was not possible to do this last week and is not yet possible now. Only after that, prospects for recovery to the area of 1.0640 and 1.0680 will open. In case of a decline in the euro, bulls need to show something around 1.0480, otherwise, the pressure on the trading instrument will only increase. Having missed 1.0480, we can say goodbye to hopes for the recovery of the pair, which will open a direct road to 1.0430. A breakthrough in this support level will certainly increase the pressure on the trading instrument, opening an opportunity for the test of 1.0380 and 1.0320. The British pound is aimed at updating local lows, as it is obvious that growth above 1.2320 is limited. It will be possible to talk about the resumption of the upward trend from June 14 only after the bulls gain a foothold above 1.2320, which will lead to an instant breakthrough at 1.2365 and 1.2400, where buyers will face much greater difficulties. In the case of a larger upward spurt of the pound, we can talk about the 1.2460 update. If the bears break below 1.2240, then the pound will go straight to 1.2170. Going beyond this range will lead to another downward movement already to the minimum of 1.2100, opening the way to 1.2030. The material has been provided by InstaForex Company - www.instaforex.com |
| US stock indexes fall on Monday Posted: 28 Jun 2022 05:07 AM PDT
Main US stock indexes closed in negative territory on Monday, with the Dow Jones shedding 0.2%, the S&P 500 losing 0.3%, and the NASDAQ declining by 0.72%. Equities were negatively affected by the preliminary US GDP data for January-March 2022. Economists expect the US economy to shrink by 1.5% quarter-over-quarter. Market players also assess the state of the global economy amid soaring inflation and the resulting policy measures by central banks. Some investors are concerned an aggressive monetary tightening cycle could lead to a recession. On the Dow Jones, the best-performing stocks were United Health Group, Inc. (2.02%), Chevron, Corp. (1.93%), and Merck & Co., Inc. (1.37%), as well as Nike, Inc., (2.13%). The worst-performing stocks were Salesforce, Inc. (-2.48%) and Boeing, Co. (-1.99%). On the S&P 500, the best-performing stocks were Valero Energy, Corp. (8%), Devon Energy, Corp. (7.48%), and Hess, Corp. (5.18%). The worst performing stocks on the S&P 500 were Etsy, Inc. (-3.55%), Electronic Arts, Inc. (-3.53%), and Autodesk, Inc. (-3.43%). On the NASDAQ, the biggest gainers were Evofem Biosciences, Inc. (187.71%), Acutus Medical, Inc., (87.59%), and Epizyme, Inc., (55.14%). The biggest losers were Powerbridge Technologies, Co., Ltd. (-34.95%), Borqs Technologies, Inc. (-24,38%), and Enochian Biosciences, Inc. (-21,92%). Shares of Coinbase Global dived by 9.3% after Goldman Sachs downgraded it to a sell rating. Rising stocks outnumbered declining ones on the New York Stock Exchange by 1,756 to 1,418. On the NASDAQ Stock Exchange, 1,959 rose and 1,850 declined. The CBOE Volatility Index, which measures the implied volatility of S&P 500 options, decreased by 1.03% to 26.95. The material has been provided by InstaForex Company - www.instaforex.com |
| Trading plan for Russel 2000 on June 28, 2022 Posted: 28 Jun 2022 04:54 AM PDT
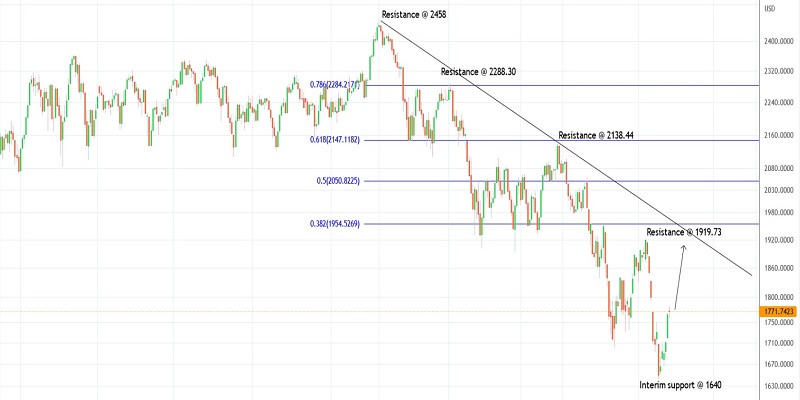
Technical outlook:Russell 2000 rose to the 1,781.00 highs intraday on Monday before turning lower and closed at around 1,771.00. The index has produced a Star Doji on the daily chart indicating indecision and a potential pullback lower towards 1,700. Bulls will remain poised to hold prices above the 1,640 interim support to keep the near-term structure constructive. Russell 2000 has carved a larger degree downswing since its November 2021 peak at the 2,458-59 mark. The drop between 2,458.00 and 1,640.00 could be complete or it could be still heading lower towards 1,400.00, which is the March 2020 support. If a potential downswing is in place, bulls shall remain in control from here and push through the 1,919.73 initial resistance to confirm. Russell 2000 has also initiated a potential lower degree upswing since June 17, after printing lows around the 1,640.00 mark as seen on the daily chart. Potential remains for a rally through the 1,919-54 zone, which is also the Fibonacci 0.382 retracement of the entire drop between 2,458.00 and 1,640.00. Only a break below 1,640.00 will delay the proposed corrective rally. Trading plan:Potential rally through 1,919-50 against 1,640 Good luck! The material has been provided by InstaForex Company - www.instaforex.com |
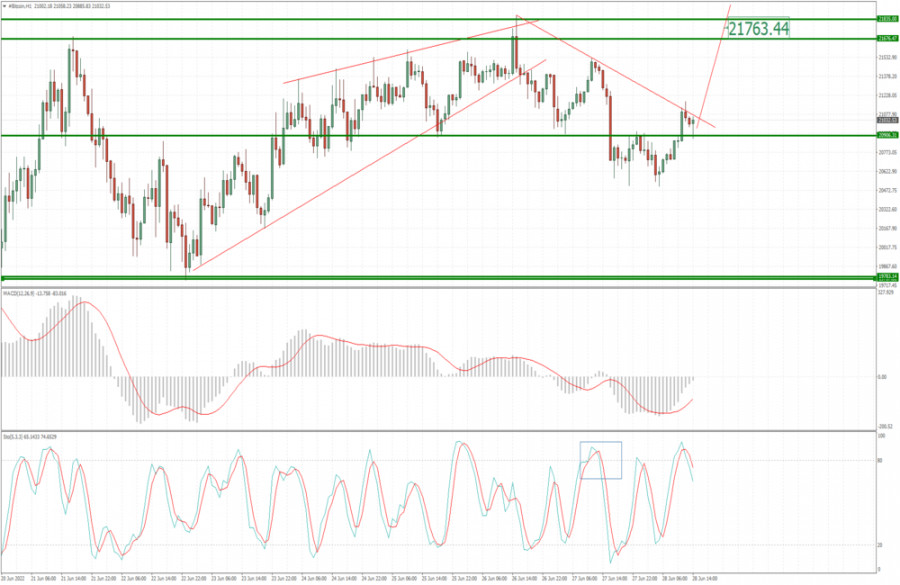
| BTC update for June 28,.2022 - Double bottom pattern confirmed Posted: 28 Jun 2022 04:52 AM PDT Technical analysis:
BTC.USD has been upside this morning and there is confirmed double bottom formation in the background. I see potential for further rally. Trading recommendation: Due to the breakout of the double bottom pivot high and the early morning rally, I see potential for the upside continuation. Watch for potential buying opportunities on the intraday dips with the upside objective at $24.765. MACD oscillator is showing decreasing in the downside power, which is good sign for further rally. Key support is set at the price of $20.500 The material has been provided by InstaForex Company - www.instaforex.com |
| Posted: 28 Jun 2022 04:45 AM PDT US stock index futures rose on Tuesday after a losing Monday. Traders are ramping up purchases in the hope of holding on to the bullish rally seen last week. Dow Jones Industrial Average futures added 165 points or 0.5%. S&P 500 futures rose 0.5% and Nasdaq 100 futures rose 0.4%. Following the results of yesterday, the blue-chip Dow index fell by about 60 points, while the S&P 500 fell by 0.3%. The high-tech Nasdaq Composite lost 0.7%.
The most difficult thing right now is to determine the moment between an upward rebound in a bear market and the beginning of a more sustained bullish growth in stocks. The 8% rebound that occurred in the last 4 trading days was impressive, but it still does not signal any noticeable internal improvement in stock markets, especially before the Federal Reserve raises interest rates by 0.75% next month. The slowdown in economic growth, which is now visible, as well as the lack of willingness of investors to take risks in the current conditions against the background of withdrawal of additional liquidity from the central bank, makes them skeptical about the durability of the recovery. Traders may be also reviewing their portfolios based on the results of the first half of the year, which gives the market a small bullish impulse. Getting rid of unprofitable assets in favor of more promising ones may lead to a slight bullish rally in the near future. Shares of travel companies gained at price after China yesterday eased its restrictions on COVID for arriving travelers, reducing their quarantine time to seven days. Wynn Resorts and Las Vegas Sands grew by more than 6%. American, United, and Delta Air Lines added more than 1%. The banking sector is also trading in the black. Yesterday, JPMorgan Chase and Citigroup said that stricter capital requirements force them to keep dividends unchanged. However, their competitors from Bank of America, on the contrary, announced a 5% increase in quarterly dividends to 22 cents per share. Morgan Stanley also noted that they are increasing the payout by 11% to 77.5 cents per share. Wells Fargo increased its dividend by 20% to 30 cents per share, but Goldman Sachs seems to have become the leader in raising its dividend by 25% to $ 2.50 per share.Today, investors will follow the data on the consumer confidence index for June, as well as the change in housing prices in April this year. This will allow us to assess the state of the economy. Let me remind you that fears of a recession have intensified recently, as the Federal Reserve is trying to combat rising inflation with aggressive rate hikes.
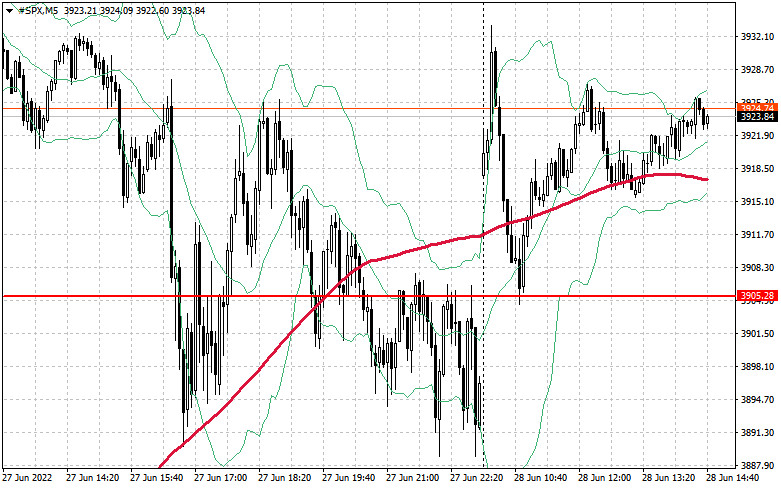
As for the technical picture of the S&P 500 Whether the bullish rally will continue is a big question. To do this, buyers today need to take control of the resistance of $ 3,942, which was tested earlier this week. A break in this range will push the trading instrument up to the $ 3,975 area, where large sellers will return to the market again. At a minimum, there will be those who want to lock in profits on long positions. A more distant target will be the $ 4,013 level. In case of pessimism and another talk about high inflation and the need to fight it, the trading instrument will easily update the nearest support of $ 3,905, but this will not greatly harm the market. It's another matter if the bulls bring $ 3,870 to the test. A breakdown of this range will lead to a new sale at $ 3,826 and $ 3,788. The material has been provided by InstaForex Company - www.instaforex.com |
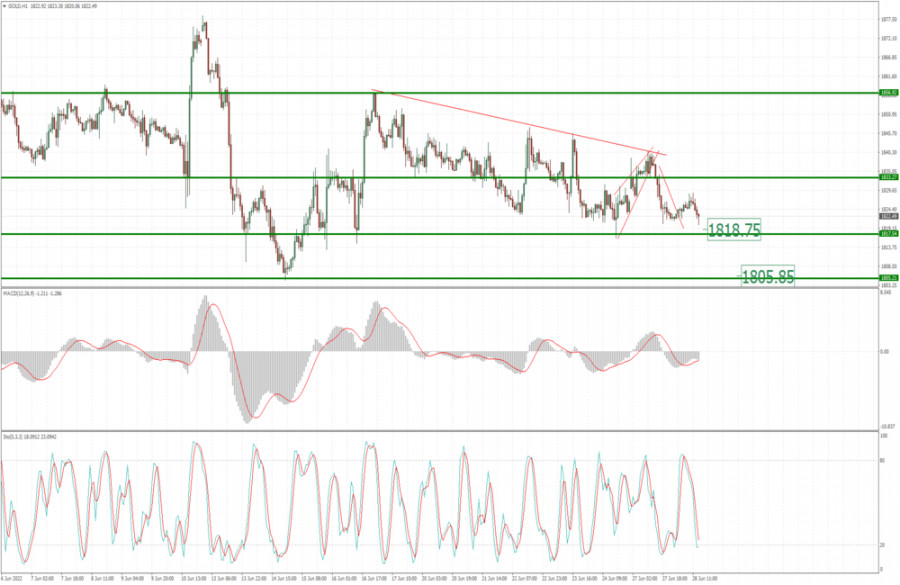
| Analysis of Gold for June 28,.2022 - First downside objective reached Posted: 28 Jun 2022 04:45 AM PDT Technical analysis:
Gold has been trading downside as I expected. The price reached first downside objective at $1819. Trading recommendation: Due to the rejection of the trendline in the background and breakout of the mini rising wedge, I see potential for further downside movement. Watch for potential selling opportunities on the intraday rallies with the downside objective at $1.805. Stochastic is showing oversold condition but with no signs for further reversal. Key resistance is set at the price of $1.840 The material has been provided by InstaForex Company - www.instaforex.com |
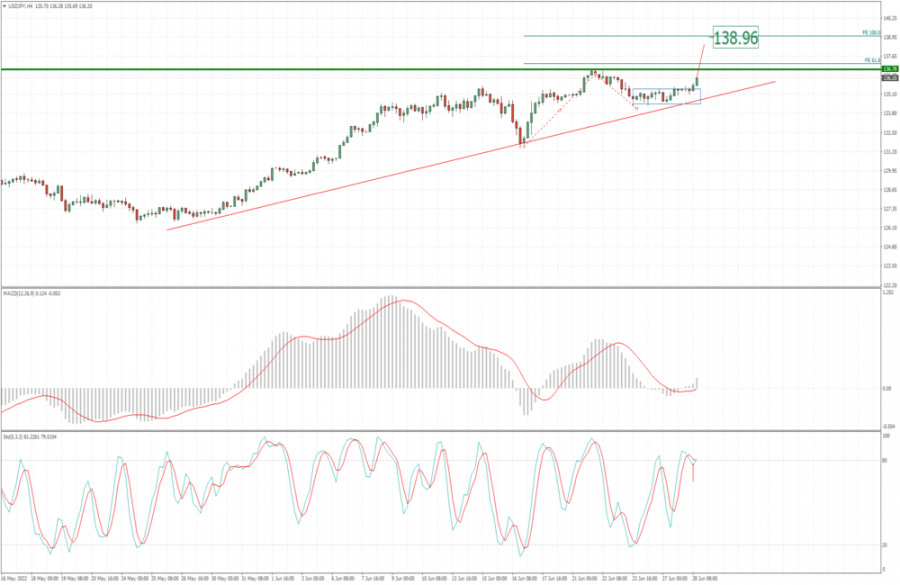
| USD/CHF analysis for June 28, 2022 - Strong upside trend continuation Posted: 28 Jun 2022 04:37 AM PDT Technical analysis:
USD/JPY has been trading upside and the upside trend is resuming. I expect further rise and potential for the next upside references. Trading recommendation: Due to the breakout of consolidation and strong upside trend. I see potential for the further continuation. Watch for potential buying opportunities on the intraday dips with the upside objectives at 136.75 and 139.00. Stochastic is showing overbought condition but new fresh bull cross, which is good sign for further rally. Key support is set at the price of 134.60 The material has been provided by InstaForex Company - www.instaforex.com |
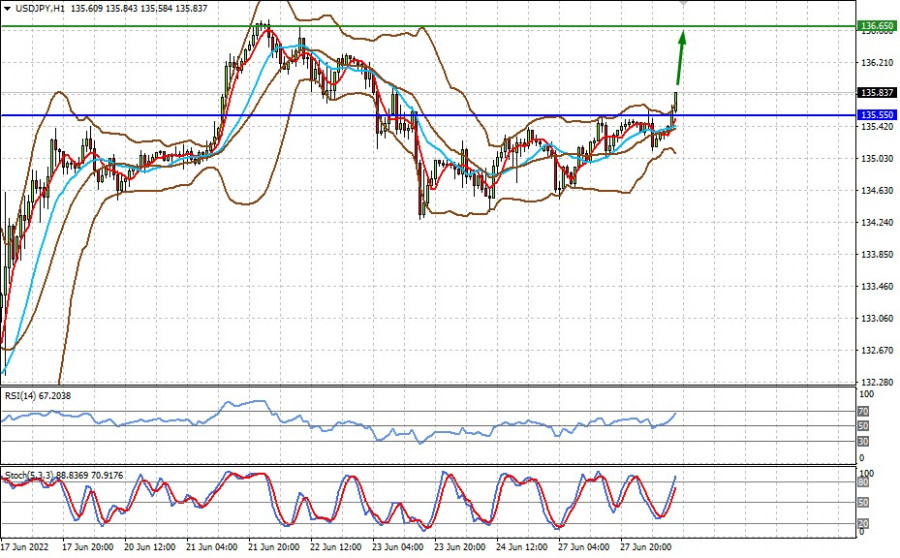
| Posted: 28 Jun 2022 04:33 AM PDT The currency market continues to move in a tight horizontal channel, driven by many factors that balance each other. They prevent the formation of a distinct trend, but since dollar already halted its growth, euro has every chance of rising noticeably in the short term. This is also possible in other currencies pair with dollar. In principle, the reason why the market is like this right now is because dollar is overbought and Treasury bonds eased its sell-offs, leading to the stop of yield growth. Another factor is the rate hikes implemented by world central banks, as well as the impending increase of ECB's cost of borrowing, which reduces the difference in interest rates and supports the exchange rates of currencies traded against dollar. While relative calm has been established in the forex market, the crypto market continues to suffer significant problems, ruining not only holders of bitcoins and other crypto instruments, but also companies. For example, the well-known crypto hedge fund Three Arrows Capital defaulted on a loan in the amount of more than $670 million. Problems in the crypto market arose after the factors supporting it earlier changed dramatically at the beginning of this year. Most likely, if central banks continue to tighten policies and trigger a stagflation, the market will collapse further. This is why many are closely monitoring the data on inflation, as well as business activity indices in Europe and the United States. Forecasts for today:
USD/JPY The pair is trading upwards, thanks to lower market tensions and growing risk appetite. Further increase above 135.55 will bring the pair to 136.65.
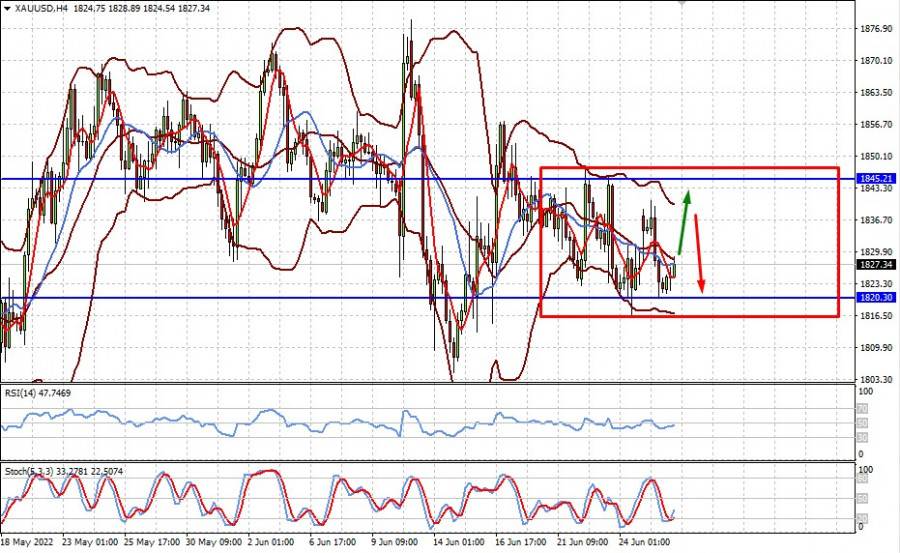
XAU/USD Spot gold is consolidating in the range of 1820.30-1845.20. There is a high chance that it will remain trading within these levels until the end of this week. The material has been provided by InstaForex Company - www.instaforex.com |
| Bitcoin looks "oversold," but is in no hurry to recover Posted: 28 Jun 2022 04:30 AM PDT Bitcoin continues its recovery phase, and as part of a gradual consolidation, the asset managed to steadily gain a foothold above $20k. At the same time, there is an increase in network activity and a growing demand for cryptocurrency within the cryptocurrency industry. Social activity also indicates the passage of a period of panic and the gradual awareness of the onset of a local bottom. But at the same time, Bitcoin failed to gain a foothold above the 200-day moving average. This is a bearish signal and indicates the dominance of sellers in the market.
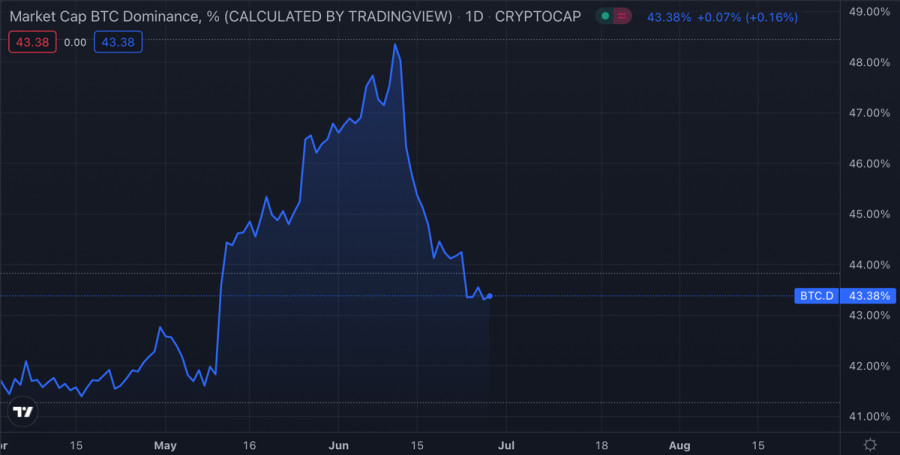
The level of Bitcoin dominance in mid-June, before the historic capitulation, reached 48% due to the growing interest in cryptocurrency. As of June 28, everything has changed dramatically. The level of influence of Bitcoin on the market has decreased to 43%, and the altcoin market shows local growth. This is also a negative signal that indicates a decrease in investment activity in relation to the main cryptocurrency.
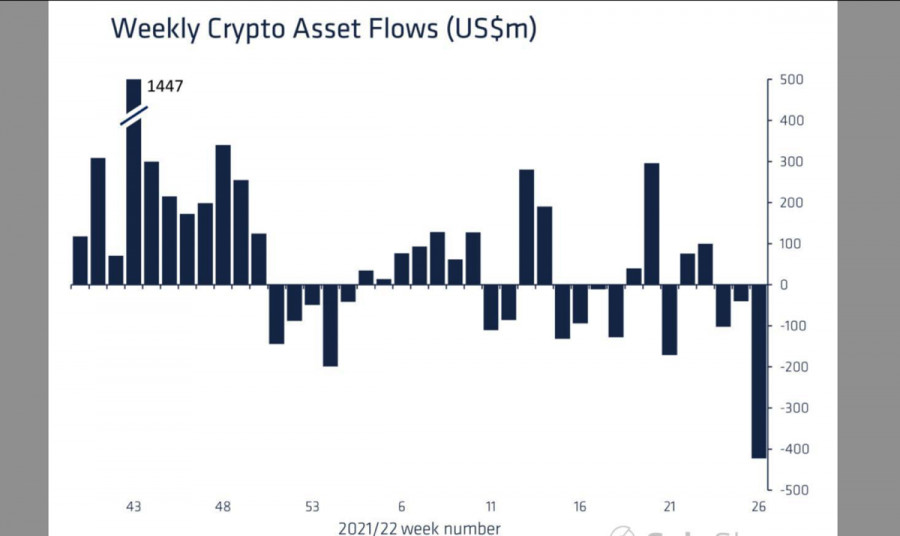
Similar dynamics is demonstrated by the weekly report from CoinShares, according to which investors withdrew $420 million from Bitcoin. This is a record withdrawal of funds from a single asset, and therefore it can be assumed that this is the next stage of the mass capitulation of investors of all stripes. Recent information showed long-term hodlers that kept the cryptocurrency for 2-5 years also began to sell their stocks.
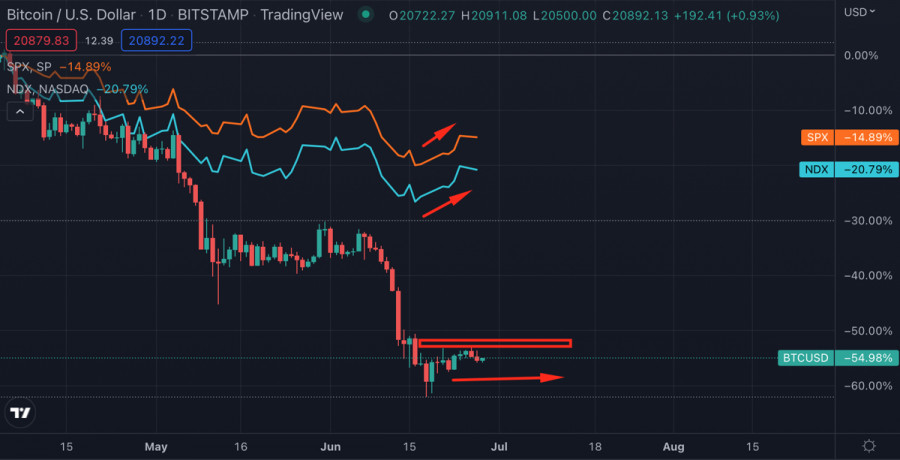
Another important signal can be seen on the correlation chart of stock indices and BTC. The NDX and SPX indicators had a full bullish day and went beyond the local fluctuation ranges. Bitcoin did not, which indicates the ongoing capitulation of the investors of the first cryptocurrency. All these facts point to a radical decline in the investment attractiveness of BTC, even despite the stabilization of the situation and consolidation of the price above $20k.
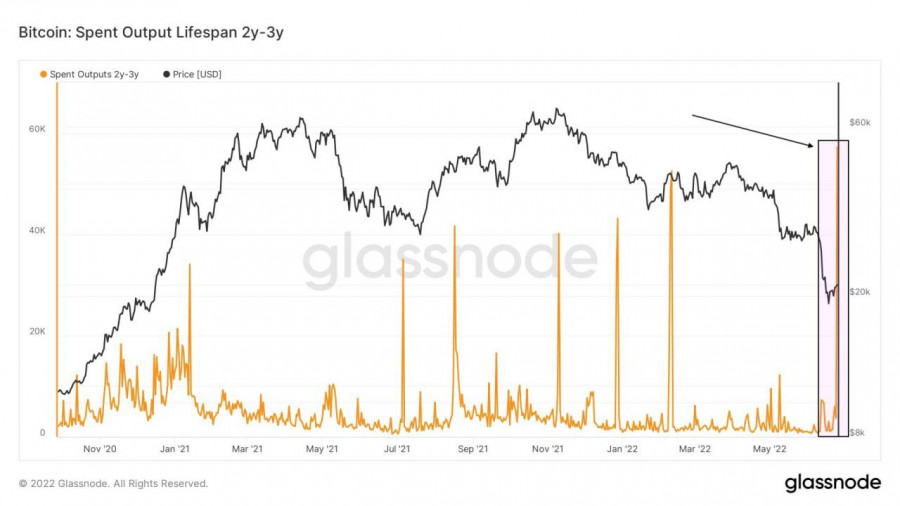
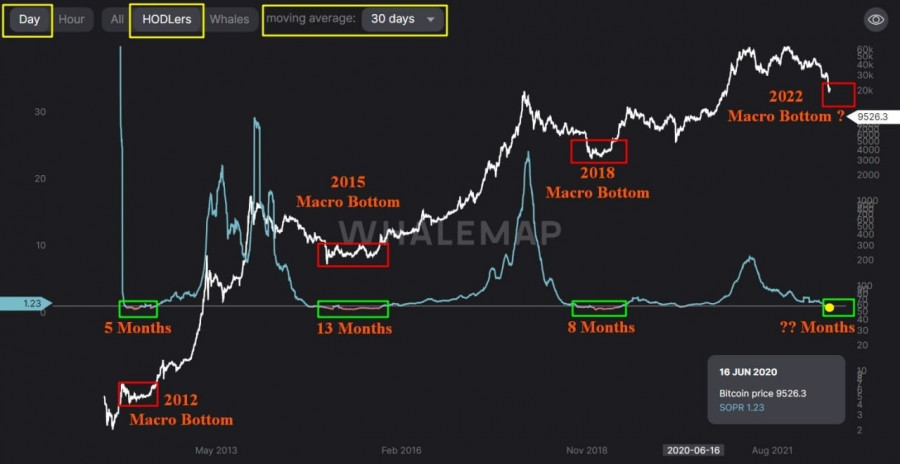
This is due to a total lack of liquidity and a tense situation in the market. Investors are not ready to enter the asset due to a significant outflow of capital. Do not discount the problems of miners who have accumulated a significant part of the BTC market supply in six months. If these reserves are sold, the market will collapse, and Bitcoin will update the local bottom. With this in mind, the lack of investment in a digital asset is now a positive signal indicating the strategic thinking of investors. The main task of the market now is to complete the process of capitulation of investors. And there is an important technical indicator here that indicates how long this process can last. And, therefore, how long can the process of price stabilization and subsequent accumulation of BTC coins last to reach new heights. The 30-day average SOPR for long-term holders of Bitcoin goes into the red, which has happened only three times in history. In fact, this can be perceived as a process of capitulation of long-term investors.
According to the historical context, the decline in the metric to this zone preceded the formation of a local bottom. The timing of the completion of the Bitcoin bear cycle took from 5 to 13 months. This suggests that the market has just begun the process of capitulation, which we have already seen with the outflow of capital from crypto funds. Given the global economic crisis, record inflation, and war in Europe, there is every reason to believe that the market and Bitcoin will recover for a maximum of time. The material has been provided by InstaForex Company - www.instaforex.com |
| Trading plan for NASDAQ on June 28, 2022 Posted: 28 Jun 2022 04:27 AM PDT
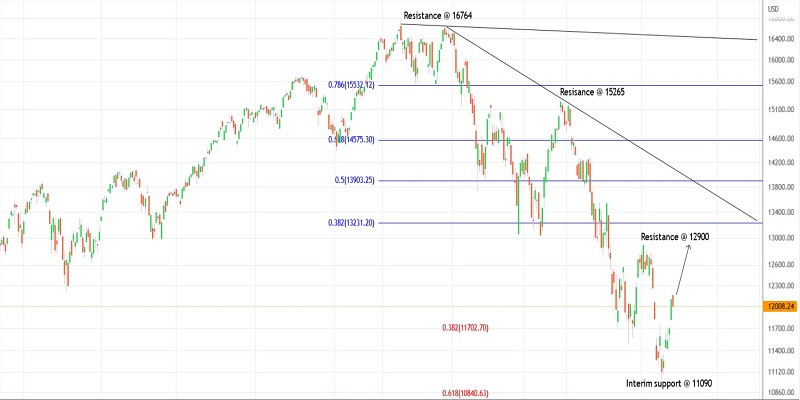
Technical outlook:The NASDAQ rose above the 12,175 highs on Monday before finding resistance and pulling back. The index closed lower at around 12,000, indicating a probability of a continued correction for the next few days. Bulls will be poised to hold prices above the 11,090 interim support to keep the near-term structure intact. Near-term upside potential remains through 12,900. The NASDAQ has been dropping since November 2021 after printing all-time highs at around 16,764. Since then, prices collapsed over the next several months to 11,090. A high probability remains for a three-wave corrective pullback that could push the price up to 14,75 in the next several weeks. The NASDAQ has initiated a potential lower degree upswing since June 16, 2022, after printing the 11,090 lows. Further evidence is required to confirm that a bottom is in place and a break above 12,900 will encourage bulls. Traders might be preparing to cautiously hold long positions against 11,000 going forward. Trading plan:Potential rally through 12,900 and up to 14,575 against 11,000 Good luck! The material has been provided by InstaForex Company - www.instaforex.com |
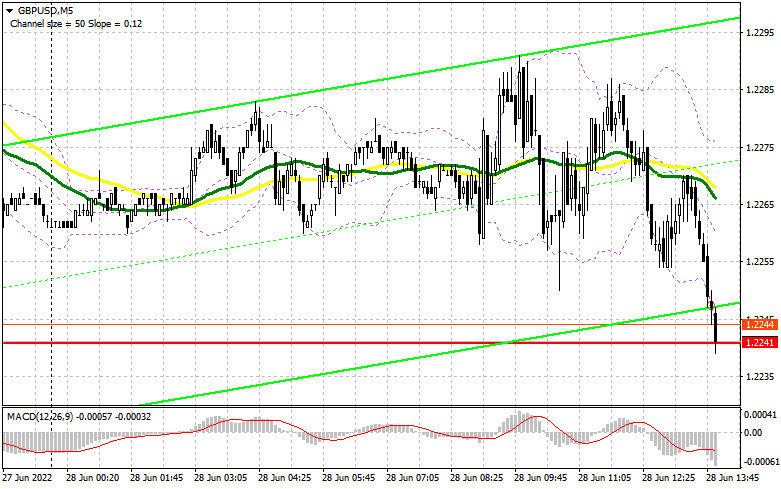
| Posted: 28 Jun 2022 04:23 AM PDT In my morning forecast, I paid attention to the 1.2317 level and recommended making decisions from it. Let's look at the 5-minute chart and figure out what happened there. The attempt to grow to 1.2317 failed, as volatility during the European session was extremely low. At the time of preparation of the material, the pair declined to the support area of 1.2241, which may lead to the formation of signals to enter the market. From a technical point of view, nothing has changed, nor has the strategy itself changed. And what were the entry points for the euro?
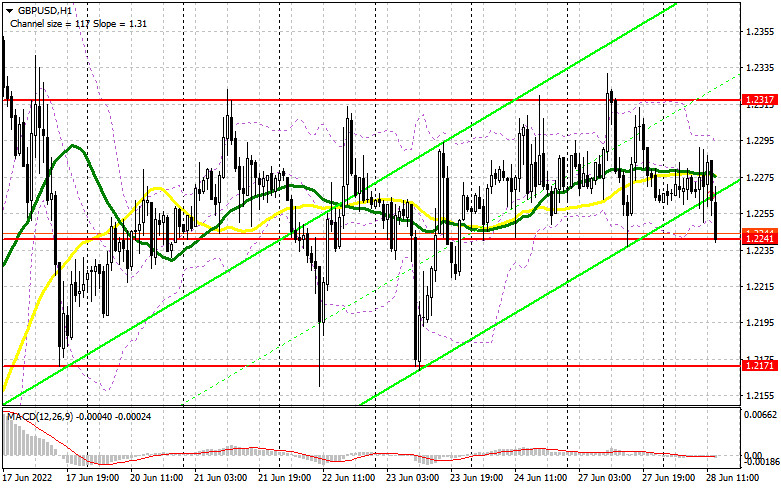
To open long positions on GBP/USD, you need: The lack of statistics on the pound and the low trading volume indicates a wait-and-see attitude of both buyers and sellers. During the US session, data on the balance of foreign trade in US goods and the consumer confidence index were released today, which may return pressure on the dollar, provided that the reports turn out to be worse than economists. If the figures coincide with the forecasts, most likely the pair will continue trading in the side channel with the prospect of protecting the support of 1.2241. The formation of a false breakdown there will give a signal to open long positions in the expectation of growth to the nearest level of 1.2317. In the morning forecast, I said that this level is critically important for bulls since by returning it under control, it will be possible to count on the resumption of the bull market formed on June 14. A breakout and a top-down test of 1.2317 will give a buy signal based on the 1.2400 update. A similar breakthrough at this level will lead to another entry point into long positions with the prospect of reaching 1.2452, where I recommend fixing the profits. A more distant target will be the 1.2484 area. If GBP/USD falls and there are no buyers at 1.2241 in the afternoon, the pressure on the pair will increase. In this scenario, I advise you to open new long positions only on a false breakout from the lower border of the side channel 1.2171. You can buy GBP/USD immediately for a rebound from 1.2102, or even lower – around 1.2030 with the aim of correction of 30-35 points within a day. To open short positions on GBP/USD, you need: The bears have done everything possible to get back into the market. Now the focus is on 1.2241 and fixing below this range. However, in case of weak US data, it will be possible to observe another upward jerk of the pound. Therefore, only the formation of a false breakdown at 1.2317 will lead to the formation of a sell signal with the prospect of a return to 1.2241. Its breakthrough will lead to a sell-off and a return of GBP/USD to the area of the lower border of the side channel. However, only a consolidation below 1.2241 and a reverse test from the bottom up will give an entry point into short positions. A more distant target will be the 1.2102 area, the test of which will testify to the defeat of buyers. With the option of GBP/USD growth and the absence of bears at 1.2317, we will only have to count on the nearest resistance of 1.2400. A false breakout at this level will give a good entry point into short positions in the expectation of at least some downward correction. If there is no activity at 1.2400, another upward jerk may occur against the background of the demolition of stop orders of speculative sellers. In this case, I advise you to postpone short positions to 1.2452. But even there, I advise selling the pound only in case of a false breakdown, since going beyond this range will increase demand for GBP / USD. Short positions can be viewed immediately for a rebound from 1.2484, or even higher – from 1.2516, counting on the pair's rebound down by 30-35 points inside the day.
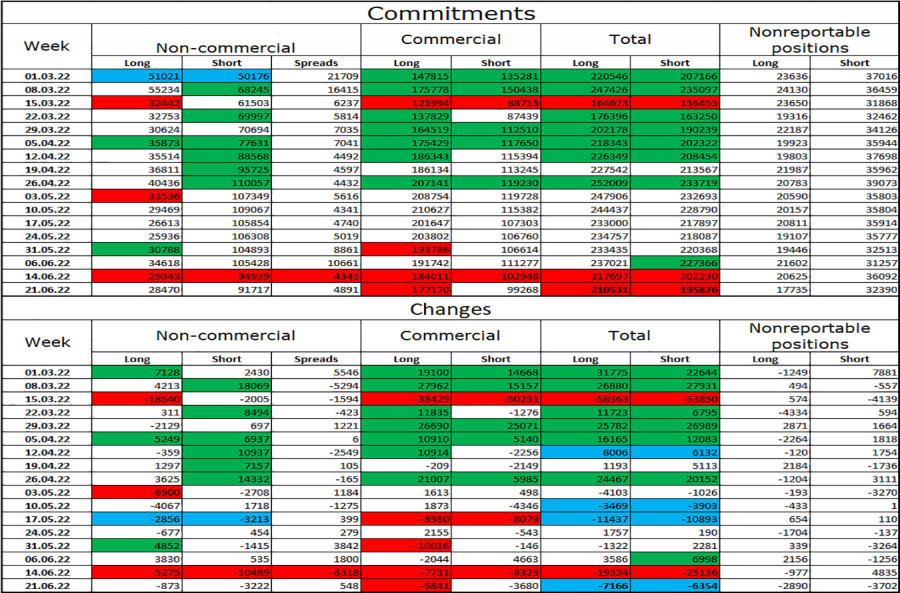
The COT report (Commitment of Traders) for June 21 recorded a reduction in both long and short positions, but the latter turned out to be more, which led to a slight decrease in the negative delta. Last week, inflation data in the UK confirmed the correctness of the Bank of England's position on monetary policy. The sharp inflationary jump in May of this year was nothing surprising for traders since even according to the official forecasts of the regulator, the consumer price index will exceed 11.0% by the end of the year. The big players, of course, took advantage of the moment and increased their long positions as a result of another collapse of the pound, but now, according to the report, we see that fewer people are willing to sell at current lows, which plays on the side of the British pound. No one will be surprised by the policy of the Federal Reserve System and its rate of interest rate increases, so it's time to think about buying cheaper risky assets. The COT report indicates that long non-commercial positions decreased by only 873 to the level of 28,470, while short non-commercial positions decreased by 3,222 to the level of 91,717. This led to a decrease in the negative value of the non-commercial net position from the level of -65,596 to the level of -63,247. The weekly closing price rose to 1.2295 against 1.1991.
|
| Posted: 28 Jun 2022 04:23 AM PDT In my morning forecast, I paid attention to the 1.0603 level and recommended that decisions on entering the market be made from it. Let's look at the 5-minute chart and figure out what happened there. Another attempt to break above 1.0603 failed again. Despite the statements of the President of the European Central Bank, Christine Lagarde, her concern about inflation and the situation in the bond market, buyers of the euro have not managed to break above 1.0603. All this led to the formation of a false breakdown and a signal to open short positions. At the time of writing, the pair has gone down about 25 points. Against this background, the technical picture, as well as the strategy itself, remained unchanged. And what were the entry points for the pound?
To open long positions on EURUSD, you need: Until the moment when trading is conducted below 1.0603, we can expect a larger movement of the pair down. During the American session, data on the balance of foreign trade in goods in the United States and the consumer confidence index are released, which is likely to have a limited impact on the market. I expect further low volatility and trading in the upper part of the 1.0497 – 1.0603 side channel. In the case of strong reports, which will be quite surprising for the market, as well as a decline in the pair, the key task of the bulls will remain to protect the nearest level of 1.0552, which acts as the middle boundary of the side channel. Moving averages pass just above this range, so the formation of a false breakdown there forms a signal to open long positions in the hope of trying to regain the 1.0603 area – the upper limit. A breakout and a top-down test of 1.0603 in the afternoon will deal a very strong blow to the bears' stop orders, which will allow the pair to break out of the side channel with the possibility of updating 1.0640 and building a new uptrend to 1.0663 and 1.0687. A more distant target will be the 1.0714 area, where I recommend fixing the profits. If EUR/USD declines and there are no buyers at 1.0552, nothing terrible will happen – the pair will only move to the lower part of the side channel. In this case, I advise you not to rush into the market: the best option for opening long positions will be a false breakdown in the support area of 1.0497. I advise buying EUR/USD immediately for a rebound only from the level of 1.0448, or even lower – around 1.0388 with the aim of an upward correction of 30-35 points within a day. To open short positions on EURUSD, you need: The fact that the bears did not let the pair into the 1.0603 area, keeps them a fairly good chance of returning the market to their control. If the euro re-rises in the afternoon after weak US data, only the formation of a false breakdown at 1.0603 forms a signal to open short positions with the prospect of returning to the middle of the 1.0549 side channel. A breakdown and consolidation below this range, as well as a reverse test from the bottom up – all this will lead to an additional sell signal with the demolition of buyers' stop orders and a larger movement of the pair down to the 1.0497 area. A more serious struggle will unfold for this level, since issuing EUR/USD lower will be "suicide" for buyers. A breakthrough and a reverse test of 1.0497 from the bottom up will be evidence of a resumption of the bearish trend with the prospect of a rapid decline at 1.0448, where I recommend completely exiting sales. A more distant target will be the 1.0388 area. In case of an upward movement of EUR/USD during the European session, as well as the absence of bears at 1.0603, I advise you to postpone short positions to the next attractive level of 1.0640. The formation of a false breakdown there will be a new starting point for the downward correction of the pair. You can sell EUR/USD immediately on a rebound from the maximum of 1.0663, or even higher – around 1.0687 with the aim of a downward correction of 30-35 points.
The COT report (Commitment of Traders) for June 21 recorded a reduction in both long and short positions, which led to the formation of a larger negative delta, indicating the preservation of bearish sentiment. Last week, Federal Reserve Chairman Jerome Powell spoke, who confirmed his firm position on further raising interest rates in the United States in the hope of fighting the highest inflation in the United States over the past 40 years. The European Central Bank also intends to start raising interest rates next month, which limits the upward potential of the dollar against the euro. Given how risky assets are oversold against the dollar, we can expect a further recovery of the euro after the start of the cycle of tightening monetary policy in the eurozone. The COT report indicates that long non-commercial positions decreased by 11,432 to the level of 195,554, while short non-commercial positions decreased by 1,845 to the level of 211,159. The low exchange rate of the euro makes it more attractive, but at any moment traders can return to buying the US dollar. The reason for this will be the persistence of high inflation and the need for a more aggressive policy on the part of Central Banks. At the end of the week, the total non-commercial net position remained negative and decreased from -6,018 to -15,605. The weekly closing price rose from 1.0481 to 1.0598.
|


| You are subscribed to email updates from Forex analysis review. To stop receiving these emails, you may unsubscribe now. | Email delivery powered by Google |
| Google, 1600 Amphitheatre Parkway, Mountain View, CA 94043, United States | |


Comments