Forex analysis review
Forex analysis review |
- GBP/USD analysis on June 11. The pound has dropped to critical levels.
- EUR/USD analysis on June 11. What are the prospects for the euro currency in the near future?
- Analysis of the trading week of June 6-10 for the GBP/USD pair. COT report.
- Analysis of the trading week of June 6-10 for the EUR/USD pair. COT report. The euro currency collapsed under the pressure
- GBP/USD analysis on June 10. The pound also decided to continue the corrective wave
- EUR/USD analysis on June 10. Inflation in America continues to rise
- GBP/USD: plan for the American session on June 10 (analysis of morning deals). The pound collapsed after US inflation data
- June 10, 2022 : EUR/USD daily technical review and trading opportunities.
- June 10, 2022 : EUR/USD Intraday technical analysis and trading plan.
- June 10, 2022 : GBP/USD Intraday technical analysis and significant key-levels.
- Outlook for pound sterling looks increasingly bleak
- Technical analysis of GBP/USD for June 10, 2022
- Technical analysis of EUR/USD for June 10, 2022
- EUR/USD Plunges As Expected, Median Line As Target
- Trading plan for NZDUSD for June 10, 2022
- European stock market plunges sharply
- Trading plan for AUDUSD for June 10, 2022
- Trading plan for Ripple for June 10, 2022
- Follow up to our silver bearish signal.
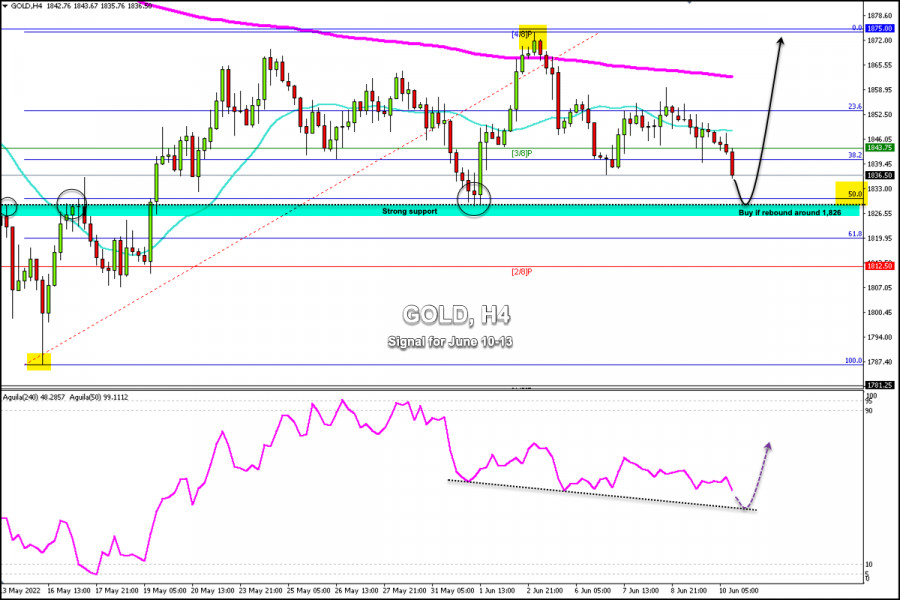
- Trading Signal for Gold (XAU/USD) on June 10-13, 2022: buy in case of rebound from $1,826 (50% Fibonacci - strong support)
- Short-term technical analysis on Gold for June 10, 2022.
- EURUSD rejected at Ichimoku cloud resistance.
- Is Bitcoin nearing capitulation?
- SPX falls below 4,000 price level.
- EUR/USD: trading plan for American session on June 10 (analysis of morning trades). EUR drops following US inflation report
| GBP/USD analysis on June 11. The pound has dropped to critical levels. Posted: 11 Jun 2022 03:46 AM PDT
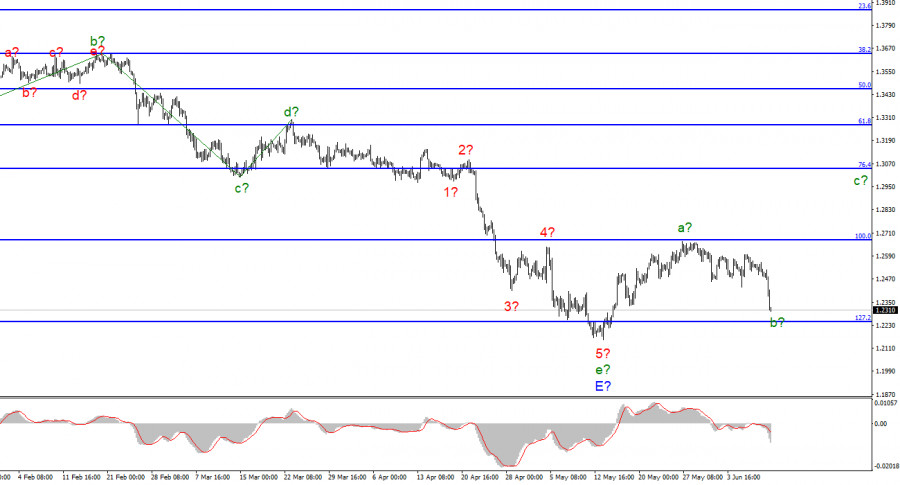
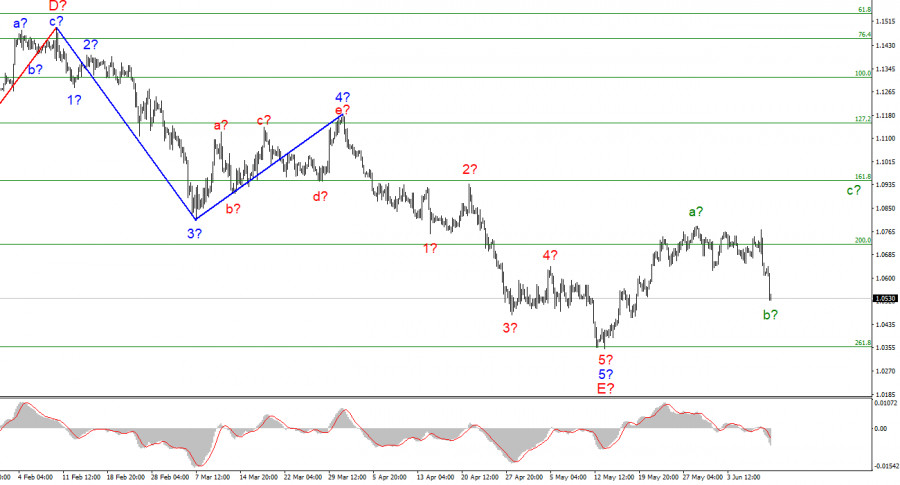
For the pound/dollar instrument, the wave markup continues to look very convincing and does not require adjustments. The downward section of the trend is completed, and the wave e-E, although it has taken a rather complex form, however, is also a five-wave in the structure of the five-wave downward section of the trend, as well as for the euro/dollar instrument. Thus, both instruments presumably completed the construction of downward trend sections. According to the British, the construction of an upward section of the trend has begun, which I currently interpret as a corrective one. I believe that it will turn out to be three-wave, but there is also a second option, in which it will take a pulsed, five-wave form. The construction of the corrective wave b is presumably continuing, within which five waves are already visible. Thus, in the near future, the construction of wave c with targets located around 30 figures may begin. I will note once again that the wave markings of the euro and the pound are very similar now, so we can expect that both currencies will move approximately the same in the next few weeks. If the news background remains the same negative for the British, it is possible to complicate the downward section of the trend. The pound falls down The exchange rate of the pound/dollar instrument decreased by 185 basis points on June 10. If we take into account the report on American inflation, which deservedly caused an increase in demand for the dollar, then everything looks quite expected. However, it should also be noted that the decline of the instrument began in the morning and at the time of the release of the inflation report, the pound had already dropped by 50 points. Wave b has almost dropped to the low of the entire downward trend segment. It can end at the lowest point of this section. An unsuccessful attempt to break through the 1.2246 mark will indicate that the market is not ready for stronger sales. But I also think that the market reaction to the inflation report was excessively strong. 180 points of losses due to one report that showed nothing unexpected. Almost everyone expected a new acceleration of inflation, so where did such a reaction come from? We can only talk about one thing – the market is not ready for sales, but for purchases of the pound. So far, I don't want to believe this, because if this version is correct, then the wave markup will undergo certain changes, and the downward trend section looks quite complete and convincing and I would not like to change it. Thus, I can only hope that next week, when the Fed raises the interest rate by 50 basis points, the market will no longer increase demand for the dollar. The probability of such a scenario is low, but there is nothing more to hope for. The market has long been aware of the FOMC's plans, so it can sell it instead of buying the dollar. In general, the whole hope of the British lies in the Fibonacci level of 127.2%. General conclusions. The wave pattern of the pound/dollar instrument still assumes the completion of the construction of wave E and the entire downward trend segment. Thus, I now advise buying the British for each MACD signal "up" with targets located above the peak of wave a, not lower than the estimated mark of 1.3042, which corresponds to 76.4% Fibonacci. Under certain circumstances, wave marking can become much more complicated, but now there are no signals for such an option.
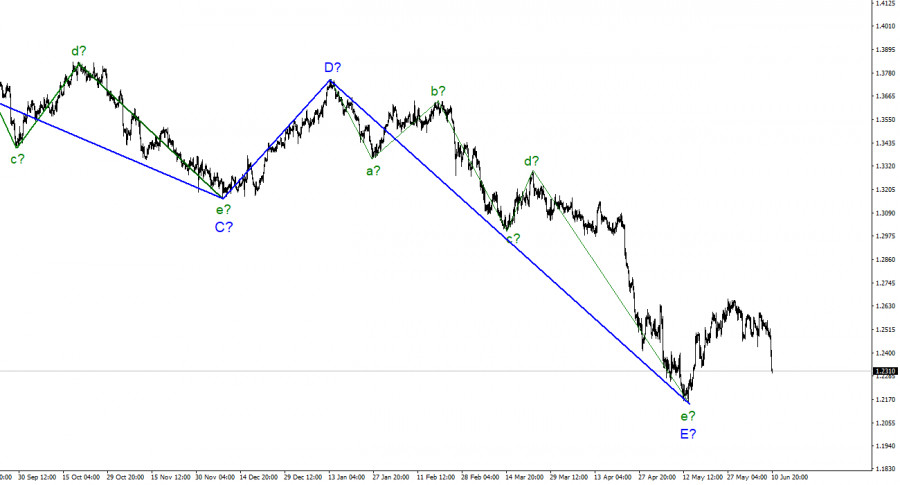
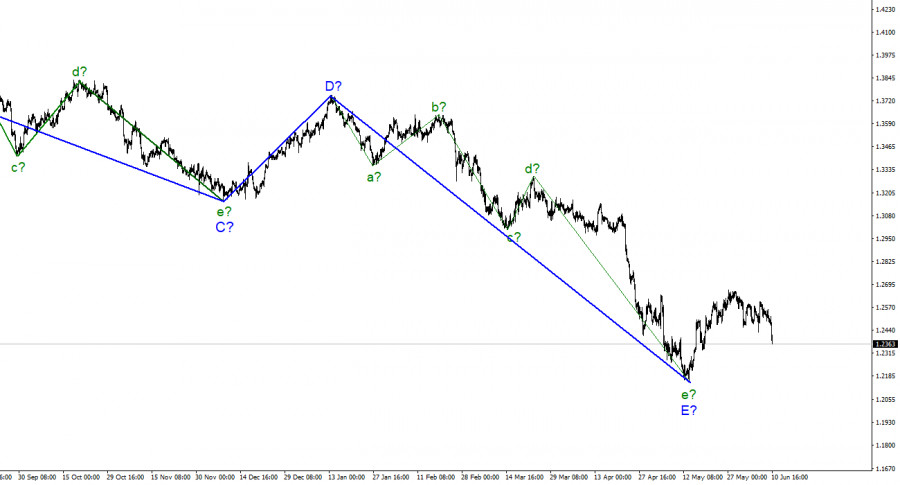
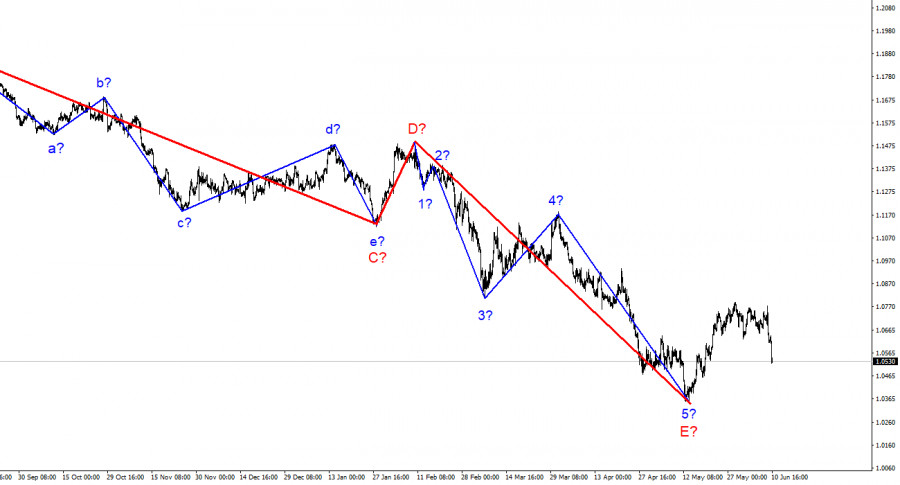
On the larger scale, the entire downward trend section looks fully equipped. Therefore, the continuation of the decline of the instrument below the 22nd figure is postponed indefinitely for the time being. Wave E has taken a five-wave form and looks quite complete. The construction of at least three waves ascending trend sections has begun. The material has been provided by InstaForex Company - www.instaforex.com |
| EUR/USD analysis on June 11. What are the prospects for the euro currency in the near future? Posted: 11 Jun 2022 03:46 AM PDT
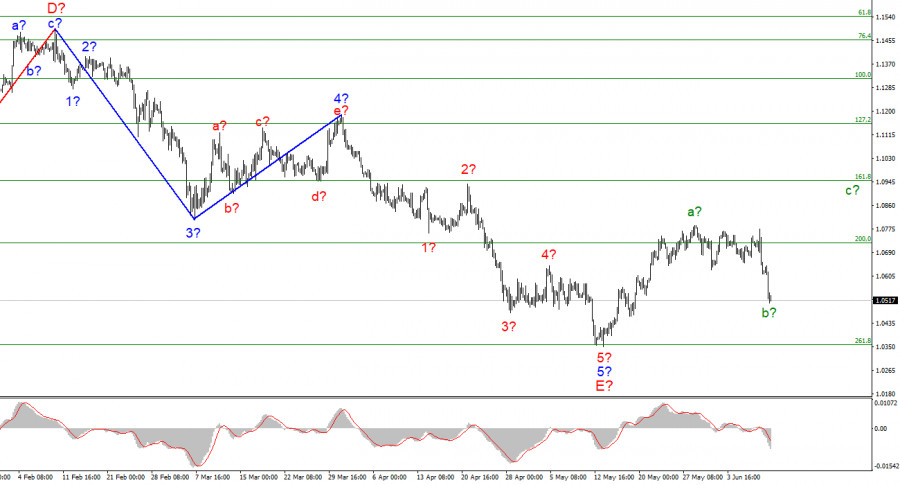
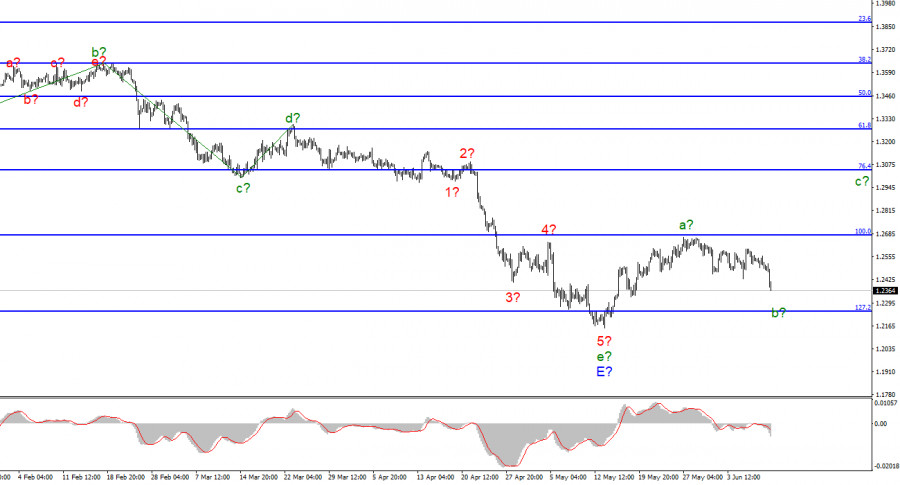
The wave marking of the 4-hour chart for the euro/dollar instrument continues to look convincing and does not require adjustments. The instrument has completed the construction of the descending wave 5-E, which is the last in the structure of the descending trend section. If this is true, then at this time the construction of a new upward section of the trend has begun. It can turn out to be three-wave, or it can be pulsed. At the moment, two waves of a new section of the trend are visible. Wave a is completed, and wave b takes a three-wave form, as I expected, and the decline in the quotes of the instrument has resumed and is currently even stronger than I expected. Wave b is already taking on a rather deep look, but the wave marking is not broken - the instrument can decline even to the low of the downward trend section, which is recognized as completed. The only option in which the decline of the euro can resume for a long time is the rapid completion of the correction section of the trend and the construction of a new downward impulse. However, to identify this option, you need at least the completion of the ascending wave c, the targets of which are located about 9-10 figures. The euro currency failed to cope with market pressure. The euro/dollar instrument fell by 105 basis points on Friday. The report on US inflation, which showed a new acceleration in price growth, led to an increase in demand for the US dollar, which had been high before after the ECB meeting and Christine Lagarde's speech. Let me remind you that although the ECB promised to raise rates in the summer and autumn, the market was not satisfied with this approach and expected the regulator to take a tougher stance. It was difficult to say whether it was right or not. I think that after a long downtime, the ECB began to tighten its rhetoric, and this is already good, this change should have had a favorable effect on the euro currency. But the market decided otherwise, and the report on American inflation completely unsettled it. As I have already said, the correction section of the trend is continuing its construction, and wave b may turn out to be quite deep, its goals are located up to the level of 261.8% Fibonacci. However, I still believe that this wave will complete its construction at the beginning of next week. The question is, how long will the overall increase in quotes continue? If the news background is interpreted by the market in the same way as last week, then the entire wave marking will change very quickly, and the construction of the downward trend section will resume. This option is especially likely if the Fed raises the interest rate next week, as expected, by 50 basis points. Therefore, it will be doubly difficult for the euro currency next week. If such a market reaction followed the generally good results of the ECB meeting, then what will happen when the Fed raises the rate by 50 points at once? The tool is walking on the razor's edge again and can fall at any moment. General conclusions. Based on the analysis, I conclude that the construction of the downward trend section is completed. If so, then now you can buy a tool with targets located near the estimated mark of 1.0947, which equates to 161.8% Fibonacci, for each MACD signal "up". It is best to first wait for the completion of the construction of wave c-b.
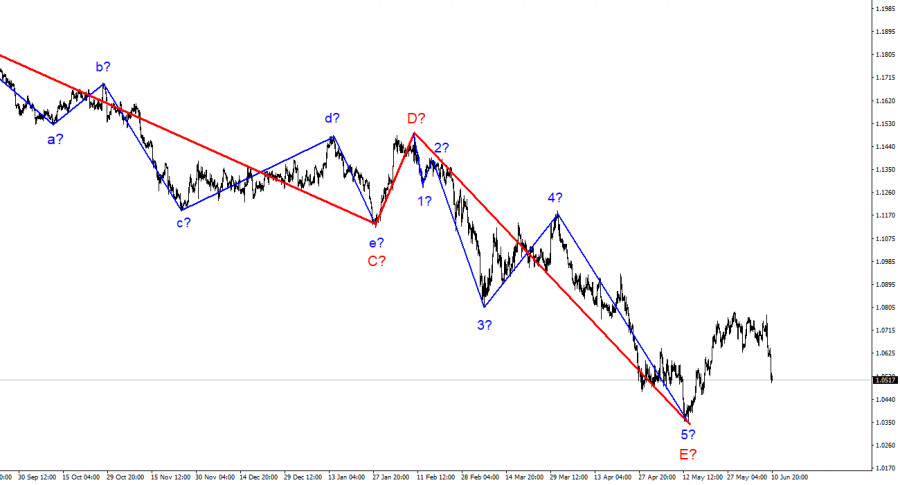
On a larger scale, it can be seen that the construction of the proposed wave E has been completed. Thus, the entire downward trend has acquired a complete look. If this is indeed the case, then in the future for several months the instrument will rise with targets located near the peak of wave D, that is, to the 15th figure. The material has been provided by InstaForex Company - www.instaforex.com |
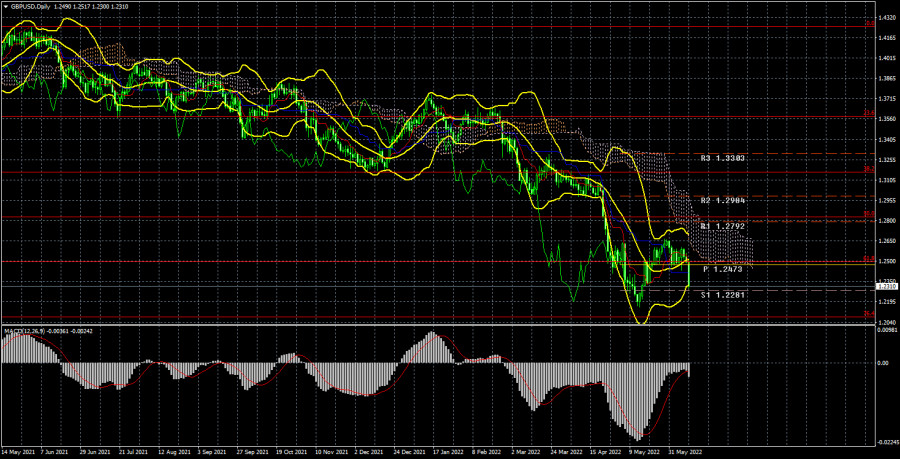
| Analysis of the trading week of June 6-10 for the GBP/USD pair. COT report. Posted: 11 Jun 2022 01:58 AM PDT Long-term perspective.
The GBP/USD currency pair has fallen by 180 points during the current week. Thus, the pair also failed to enter the Ichimoku cloud, as did its closest relative euro/dollar. The pound failed to even work out the lower boundary of the Ichimoku cloud and has already consolidated back below the critical line. Therefore, the technical picture, from our point of view, is now unambiguous. The bulls have made a sluggish attempt to start an upward correction or an upward trend, but the whole movement looks just like a pullback. Recall that during the downward trend, both the euro and the pound's upward corrections are very weak. Given that this trend is long-term, traders may get the impression that both European currencies are falling slowly and not too much, however, we would like to note that the downward movement is stable, without prolonged consolidations, and upward pullbacks are almost minimal. Isn't this a sign of a strong trend? Therefore, the euro and the pound are falling strongly against the US currency. In recent years, many have been analyzing the movements of cryptocurrencies, in particular bitcoin, and it flies from side to side very quickly. Therefore, against the background of bitcoin, the fall or growth of the euro or the pound looks faded. But for currencies, this is a strong movement. Let's go back to the pound. Last week, the drop was observed only on Friday. It was on this day that a report on American inflation was published in the States, which eventually brought the pair down. In principle, the market's reaction to the inflation that rose to 8.6% was logical. The following picture turns out: the Fed raised the rate to 1%, and inflation has been growing and growing. Consequently, the chances are greatly increased that the Fed will continue to raise the rate in the fall and winter. Remember, we said that one decline in the consumer price index cannot be considered a trend? And so it turned out. The fact that inflation slowed to 8.3% in April turned out to be a banal accident, and in May everything fell into place. Therefore, the dollar again gets an excellent opportunity to strengthen its position even more. COT analysis. The latest COT report on the British pound showed insignificant changes. During the week, the Non-commercial group opened 3.8 thousand buy contracts and 0.5 thousand sell contracts. Thus, the net position of non-commercial traders increased by 3.3 thousand. However, the mood of the major players remains "pronounced bearish". And the pound, despite the growth of the net position, still resumed falling. The net position has been falling for 3 months, which is perfectly visualized by the green line of the first indicator in the illustration above or the histogram of the second indicator. Therefore, two increases in this indicator hardly unambiguously indicate the end of the downward trend in the pound. The Non-commercial group has opened a total of 105 thousand sales contracts and only 34 thousand purchase contracts. Thus, the difference between these numbers is more than three times. Note that in the case of the pound sterling, the COT reports data very accurately reflect what is happening on the market: the mood of traders is "very bearish", and the pound has been falling against the US dollar for a long time. In the last few weeks, the pound has shown growth, but even in the illustration in this paragraph (daily TF), this movement looks very weak. Since in the case of the pound, the COT report data shows the real picture of things, we note that a strong divergence of the red and green lines of the first indicator often means the end of the trend. Therefore, formally, now we can count on a new upward trend. However, weak geopolitical, fundamental, and macroeconomic backgrounds for European currencies continue to put pressure on these currencies. Analysis of fundamental events. There was not a single interesting event in the UK this week. Hardly anyone now takes business activity indices seriously. The pound spent most of the week in a side-channel (visible on the lower TF), but on Friday, it collapsed due to the US inflation report. Thus, the bulls did not keep the initiative in their hands, and now every new negative event for the pound can provoke a new fall. Given that the Bank of England is unlikely to raise the key rate this month, and the Fed is guaranteed to raise it, we are inclined to believe that the pair's decline will continue, and the 2-year lows will be updated. Inflation in the UK already exceeds the American one, so here the pound is in a disadvantageous position itself. Trading plan for the week of June 13-17: 1) The pound/dollar pair completed an upward correction very quickly, and now there is very little chance of a new uptrend. The pair could not even work out the Senkou Span A line. Thus, purchases are not relevant again now, and they can be considered no earlier than fixing the price above the Ichimoku cloud. The pair retains theoretical chances of growth, but the pound's position and the aggressiveness of the bulls are not at the level to be sure of growth. 2) The pound sterling, we can say, resumed the downward trend, as it consolidated below the critical line. Formally, on a 24-hour TF, a lateral correction could begin, which is popularly called a "swing". However, so far everything looks as if the fall will continue. Currently, sales with a target of 1.2080 (76.4% Fibonacci) are relevant. Explanations of the illustrations: Price levels of support and resistance (resistance /support), Fibonacci levels - target levels when opening purchases or sales. Take Profit levels can be placed near them; Ichimoku indicators (standard settings), Bollinger Bands (standard settings), MACD (5, 34, 5); Indicator 1 on the COT charts - the net position size of each category of traders; Indicator 2 on the COT charts - the net position size for the "Non-commercial" group. The material has been provided by InstaForex Company - www.instaforex.com |
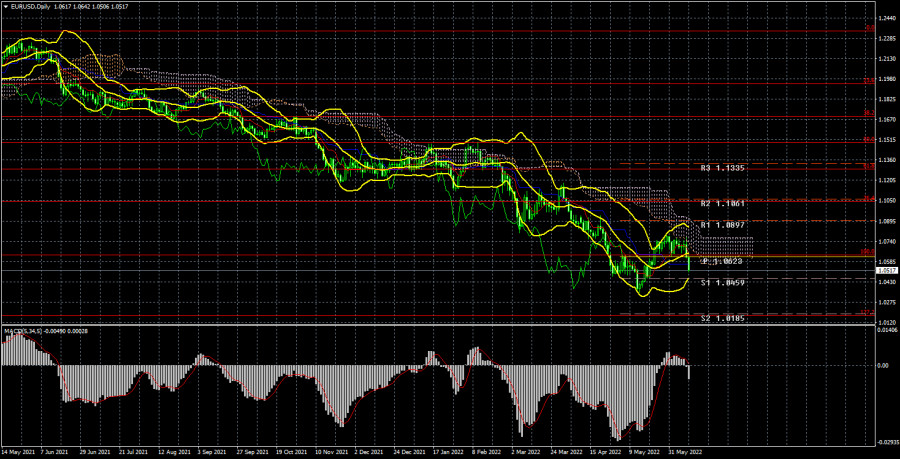
| Posted: 10 Jun 2022 11:29 PM PDT Long-term perspective.
The EUR/USD currency pair has decreased by 200 points during the current week. To be honest, what happened this week does not fit into the current technical picture a bit and at the same time fully corresponds to it. Let's figure it out. As part of a long-term downward trend, the pair has adjusted by 450 points in recent weeks. This is very small, considering that the entire trend is more than 2000 points. On the other hand, was there a correction? Thus, it is possible to resume sales of the euro currency. Further, for the first time in a long time, the ECB specifically stated that rates would rise, and the APP program would end on July 1. "Hawkish" rhetoric? Yes. But for some reason, the euro currency rushed down after the announcement of the results of the regulator's meeting. The readings of the Ichimoku indicator are very important here, which is a trending environment, and even on a 24-hour timeframe, give very strong and accurate signals. And what does the Ichimoku indicator tell us? The fact that the pair once again failed not only to overcome but even to go inside the Ichimoku cloud. This moment shows that the bulls remain extremely weak, and the euro currency has just formally adjusted but is not capable of anything more. How can we not remember the most important fundamental factor here? No matter how hard the ECB tries to tighten monetary policy, it is still far behind the Fed, which in two months may raise its rate to 2%. How can we not recall the main geopolitical factor - the military conflict in Ukraine - which primarily threatens economic losses to Europe itself. How can we not remember that the unprecedented sanctions imposed by the European Union against Russia will play against the European Union itself? Oil prices are rising, gas prices are rising, inflation is rising, the ECB is taking a weak position, and the food crisis, although it will not lead to hunger, will significantly limit the range of goods on the shelves of European stores. This means that food prices will also rise. In the United States, meanwhile, everything is fine (except for inflation), and the military conflict in Eastern Europe affects them insofar as. COT analysis. The latest COT reports on the euro currency raised a lot of questions. Recall that in the last few months, they have shown a frank "bullish" mood of professional players, but at the same time, the European currency has been falling all the time. At this time, the situation has not changed. The European currency tried to show growth, but last week it collapsed like a stone. Therefore, we again have a situation in which the mood of the major players is "bullish", but the euro is falling at the same time. During the reporting week, the number of buy contracts decreased by 6.3 thousand, and the number of shorts from the "Non-commercial" group decreased by 4.5 thousand. Thus, the net position decreased by 1.8 thousand contracts per week. The number of buy contracts exceeds the number of sell contracts of non-commercial traders by 50 thousand. The second indicator in the illustration above perfectly shows that the net position has been positive for a long time, and the chart of the pair's movement in the same illustration shows a downward movement. From our point of view, this is because the demand for the US dollar remains much higher than the demand for the euro currency. The "respite" for the euro, which has been observed in recent weeks, did not last long, and the global downward trend remains in force. Therefore, we believe that it is still impossible to rely on the data of COT reports on the euro currency when predicting the future movement of the euro/dollar pair. Analysis of fundamental events. During the current week, there was one important event in the European Union - the ECB meeting. If we omit all the unimportant information, the conclusions are as follows: the Central Bank of the European Union has finally begun to look toward raising the rate. Lagarde's hopes that inflation would begin to decline by itself were not justified. Inflation continues to rise, so we need to show at least some actions so that the public and the electorate can see that the regulator is not standing aside, watching the rising prices for everything. However, even 2 rate increases in 2022 will not stop inflation now. We have a great example in the face of the Fed, which raised rates by 0.75%, and inflation in the States has already risen to 8.6% y/y (according to yesterday's report). Thus, to stop inflation, the rate should rise to at least 3-3.5%. America is ready for such a scenario, but the European Union is not. Plus, it is completely unclear how the conflict in Ukraine will continue. Most experts continue to say that it will last at least a year. Trading plan for the week of June 13-17: 1) On the 24-hour timeframe, the pair stopped just a step away from the minimum for the last 20 years - 1.0340 and has already rushed to it again. Almost all factors still speak in favor of the long-term growth of the US dollar. Traders failed to overcome the Ichimoku cloud, so the upward movement and purchases of the euro currency are still not relevant. It is necessary to wait at least for overcoming the Senkou Span B line and only after that consider buying the euro currency. 2) As for the sales of the euro/dollar pair, they are still more relevant now. The price has consolidated back below the critical line, so we have a new sales signal at our disposal with a target of 1.0172 (127.2% Fibonacci), which is already below 20-year lows. Explanations of the illustrations: Price levels of support and resistance (resistance /support), Fibonacci levels - target levels when opening purchases or sales. Take Profit levels can be placed near them; Ichimoku indicators (standard settings), Bollinger Bands (standard settings), MACD (5, 34, 5); Indicator 1 on the COT charts - the net position size of each category of traders; Indicator 2 on the COT charts - the net position size for the "Non-commercial" group. The material has been provided by InstaForex Company - www.instaforex.com |
| GBP/USD analysis on June 10. The pound also decided to continue the corrective wave Posted: 10 Jun 2022 05:47 PM PDT
For the pound/dollar instrument, the wave markup continues to look very convincing and does not require adjustments. The downward section of the trend is completed, and the wave e-E, although it has taken a rather complex form, however, is also a five-wave in the structure of the five-wave downward section of the trend, as well as for the euro/dollar instrument. Thus, both instruments, presumably, have completed the construction of downward trend sections. According to the British, the construction of an upward section of the trend has begun, which is currently interpreted as a corrective one. I believe that it will turn out to be three-wave, but there is also a second option, in which it will take a pulsed five-wave form. Now, presumably, the construction of the corrective wave b is continuing, within which five waves are already visible. Thus, in the near future, the construction of wave c with targets located around 30 figures may begin. I will note once again that the wave markings of the euro and the pound are very similar now, so we can expect that both currencies will move approximately the same in the next few weeks. The US inflation report also hit the pound The exchange rate of the pound/dollar instrument has already decreased by 145 basis points on June 10 and continues to fall. The decline in quotes was expected since the inflation report exceeded market expectations and since wave b for the euro/dollar instrument should have taken at least a three-wave form, and a similar wave for the pound/dollar instrument was already three-wave at that time. Thus, so far everything corresponds to the current wave markup, but I will not hide that I did not expect such a strong decline in the instrument. Let me remind you that the euro currency had reasons to decline last night and this morning since the results of the ECB meeting could be regarded differently. The market decided that the rhetoric of the ECB and Christine Lagarde was not "hawkish" enough, it cannot be blamed for this. The British dollar fell by only 50 points yesterday, which is not so much. But today, the report on American inflation caused an increase in demand for the dollar, which led to elongation in the waves b for both instruments. Now I expect that these waves will complete their construction in the near future since otherwise, it will be necessary to make adjustments to the wave layout. And it looks quite holistic, and I would not like it to become more complicated. Nevertheless, the difficult news background for the euro and the pound may lead to the fact that the market will continue to increase demand for the dollar. Let me remind you that the Fed will also hold a meeting this month, and the US regulator has almost decided to raise the interest rate by 50 basis points. Moreover, today's inflation report can assure them that the rate needs to be raised quickly, so it can rise by 50 points in July and September. All this can lead to an even greater increase in the US dollar. General conclusions The wave pattern of the pound/dollar instrument still assumes the completion of the construction of wave E and the entire downward trend segment. Thus, I now advise buying the British for each MACD signal "up" with targets located above the peak of wave a, not lower than the estimated mark of 1.3042, which corresponds to 76.4% Fibonacci. Under certain circumstances, wave marking can become much more complicated, but there is no reason to assume this right now. On the higher scale, the entire downward trend section looks fully equipped. Therefore, the continuation of the decline of the instrument below the 22nd figure is postponed indefinitely for the time being. Wave E has taken a five-wave form and looks quite complete. The construction of a minimum three-wave ascending trend section has begun. The material has been provided by InstaForex Company - www.instaforex.com |
| EUR/USD analysis on June 10. Inflation in America continues to rise Posted: 10 Jun 2022 05:46 PM PDT
The wave marking of the 4-hour chart for the euro/dollar instrument continues to look convincing and does not require adjustments. The instrument has completed the construction of the descending wave 5-E, which is the last in the structure of the descending trend section. If this is true, then at this time the construction of a new upward section of the trend has begun. It can turn out to be three-wave, or it can be pulsed. At the moment, two waves of a new section of the trend are visible. Wave a is completed, and wave b takes a three-wave form, as I expected, and the decline in the quotes of the instrument has resumed and is currently even stronger than I expected. Wave b is already taking on a rather deep look, but the wave marking is not broken - the instrument can decline even to the low of the downward trend section, which is recognized as completed. The only option now in which the decline of the euro can resume for a long period is the rapid completion of the correction section of the trend and the construction of a new downward impulse. However, to identify this option, you need at least the completion of the ascending wave c, the targets of which are located about 9-10 figures. The US inflation report shocked the market The euro/dollar instrument declined by 100 basis points on Thursday, and today - by another 100. Thus, in a little more than a day, the euro currency fell in price by 200 points. Let me remind you that yesterday the results of the ECB meeting became known, and although, in my opinion, they were not bad for the euro, the market decided otherwise and started new sales. From the point of view of wave marking, such a move was expected, since wave b had to take a three-wave form. However, the decline of the instrument continued this morning, when there was no news. Thus, you need to be prepared for the fact that the wave marking will become more complicated, and the downward section of the trend will take a more complex and extended form. I don't believe in this option yet, since the wave pattern has not raised any questions in recent months and does not require adjustments, but this is the market - anything can happen here. Today, the US released an inflation report for May. The consumer price index has grown once again and has already amounted to 8.6% y/y. Core inflation, on the contrary, decreased and amounted to 6% y/y However, the market did not pay any attention to the base value and decided this: if inflation continues to rise, even despite the Fed's interest rate increase to 1%, then the regulator will raise the rate further and even more, and will not even think about taking a break in the cycle of tightening monetary policy. Thus, US inflation has significantly increased the likelihood that the Fed will act tougher and more aggressive than previously planned. In recent weeks, FOMC members have hinted several times at a possible break in the rate hike this fall, but if inflation continues to rise, there will be no break. The demand for the dollar is growing and this is already going against the current wave markup, which implies an increase in the instrument. General conclusions Based on the analysis, I conclude that the construction of the downward trend section is completed. If so, then now you can buy a tool with targets located near the estimated mark of 1.0947, which equates to 161.8% Fibonacci, for each MACD signal "up". It is best to first wait for the completion of the construction of wave c-b.
On a larger scale, it can be seen that the construction of the proposed wave E has been completed. Thus, the entire downward trend has acquired a complete look. If this is indeed the case, then in the future for several months the instrument will rise with targets located near the peak of wave D, that is, to the 15th figure. The material has been provided by InstaForex Company - www.instaforex.com |
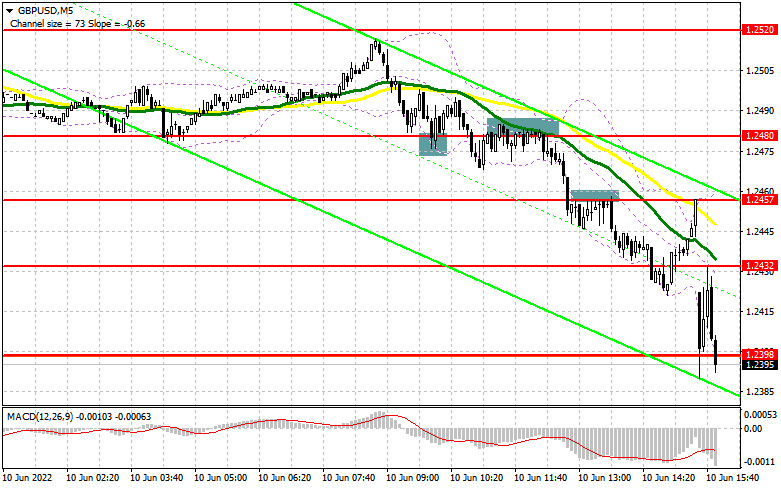
| Posted: 10 Jun 2022 05:46 PM PDT In my morning forecast, I paid attention to the level of 1.2480 and recommended making decisions on entering the market. Let's look at the 5-minute chart and figure out what happened. A false breakout in the first half of the day led to a signal to open long positions, but the normal upward movement did not take place. After some time, the bears regained control over 1.2480, and a reverse test from the bottom up led to a sell signal. As a result, the pound quickly fell to 1.2457 and consolidated lower, giving an additional signal for short positions. Already after the US data, the pound collapsed to the area of 1.2389, allowing more than 100 points of profit to be taken from the market. And what were the entry points for the euro this morning?
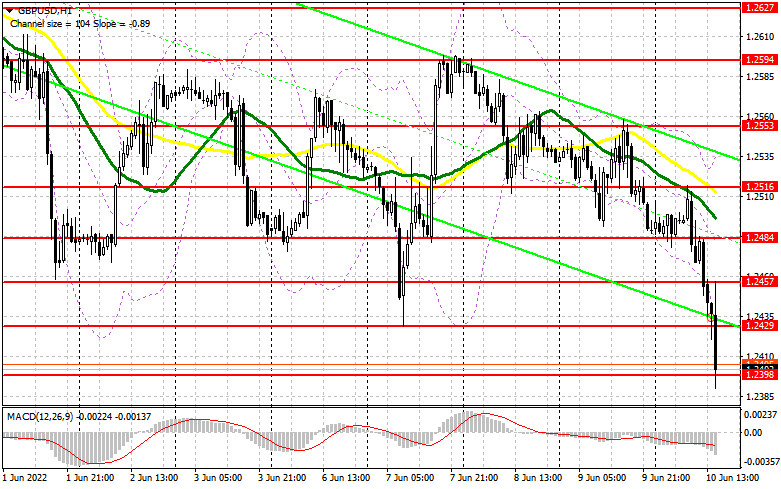
To open long positions on GBP/USD, you need: Buyers of the pound have nothing to count on today, so it's better not to rush to find the bottom - obviously, it won't be today. Only the formation of a false breakdown at 1.2398 will lead to the first signal to open long positions in the calculation of an upward rebound at the end of the week. An equally important task for the bulls in the afternoon will be to return the resistance of 1.2429 under control, which will be quite difficult to do in the current conditions when there will be a lot of people willing to sell the pound with each growth. A breakout and a reverse top-down test of 1.2429 will reduce the pressure and allow you to get out to 1.2457 and 1.2484, where I recommend fixing the profits. In the event of a further decline in the pound, which is more likely, as well as the absence of buyers at 1.2398, the pressure on the pair will increase. This will open the road to 1.2371. For this reason, I advise you not to rush purchasing. It is best to enter the market after a false breakdown at this level. I do not advise buying GBP/USD immediately on the bounce, only false breakouts in the area of 1.2331 and 1.2280 will allow you to count on a correction of 30-35 points within a day. To open short positions on GBP/USD, you need: Of course, the formation of a false breakout at 1.2429 would be an ideal scenario for those who did not have time to sell the pound in the first half of the day. For this reason, I recommend focusing on 1.2429. If the bears push through 1.2398, then the reverse test from the bottom up of this range, by analogy with what I analyzed above, will form an additional sell signal, allowing GBP/USD to fall into the area of 1.2371, from which there is a direct road to 1.2331, where I recommend fixing the profits. The longer-range target will be a minimum of 1.2280. With the option of GBP/USD growth and lack of activity at 1.2429, an upward jerk may occur against the background of the demolition of stop orders at the end of the week. In this case, I advise you to postpone short positions until 1.2457. I advise you to sell the pound there only if there is a false breakdown. Short positions can be made immediately for a rebound from 1.2484, or even higher - from 1.2516, counting on the pair's rebound down by 30-35 points inside the day.
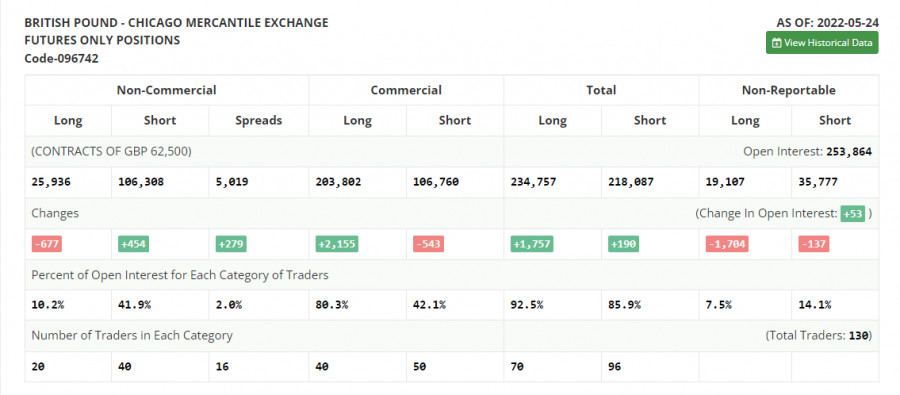
The COT report (Commitment of Traders) for May 24 recorded a reduction in long positions and an increase in short ones. However, this did not significantly affect the balance of power. Despite the growth of the pound since the middle of this month, the market remains completely under the control of sellers. Only the lack of fundamental statistics, to which the pair have been reacting quite negatively lately, and small profit-taking from annual lows allowed GBP/USD to recover a little. There are no other objective reasons for growth. The economy continues to slide into recession, inflation is breaking new records, and the cost of living in the UK is steadily rising. The Bank of England continues to rush between two fires, but even despite all this, the governor of the Bank of England, Andrew Bailey, continues to say that the regulator is not going to give up on raising interest rates yet. Rumors spread that the US Central Bank plans to pause the cycle of interest rate hikes as early as September of this year continues to gain momentum, which puts little pressure on the US dollar and leads to a strengthening of the pound. The COT report for May 24 indicated that long non-commercial positions decreased by -667, to the level of 25,936, while short non-commercial positions increased by 454, to the level of 106,308. This led to an increase in the negative value of the non-commercial net position from the level of -79,241 to the level of -80,372. The weekly closing price rose from 1.2481 to 1.2511.
|
| June 10, 2022 : EUR/USD daily technical review and trading opportunities. Posted: 10 Jun 2022 11:50 AM PDT
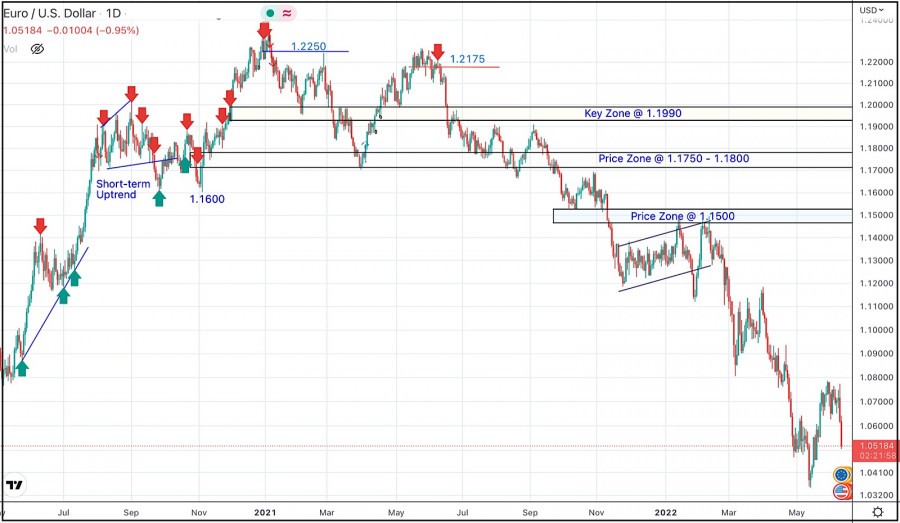
In late September, Re-closure below the price level of 1.1700 has initiated downside-movement towards 1.1500 where some recovery was witnessed. Shortly after, Price levels around 1.1700 managed to hold prices for a short period of time before another price decline took place towards 1.1200. Then the EURUSD has temporarily moved-up within the depicted movement channel until downside breakout occurred recently. Since then, the price zone around 1.1500 has applied significant SELLING pressure when a valid SELL Entry was offered upon the previous ascending movement towards it. Shortly after, the EURUSD looked oversold while approaching the price levels of 1.0800. That's where the recent upside movement was previously initiated. That's why, the recent movement towards 1.1200 was considered for another SELL Trade which is already running in profits now. The current ascending movement above 1.0600 enabled further advancement towards 1.0800 where bearish rejection could be applied. The material has been provided by InstaForex Company - www.instaforex.com |
| June 10, 2022 : EUR/USD Intraday technical analysis and trading plan. Posted: 10 Jun 2022 11:48 AM PDT
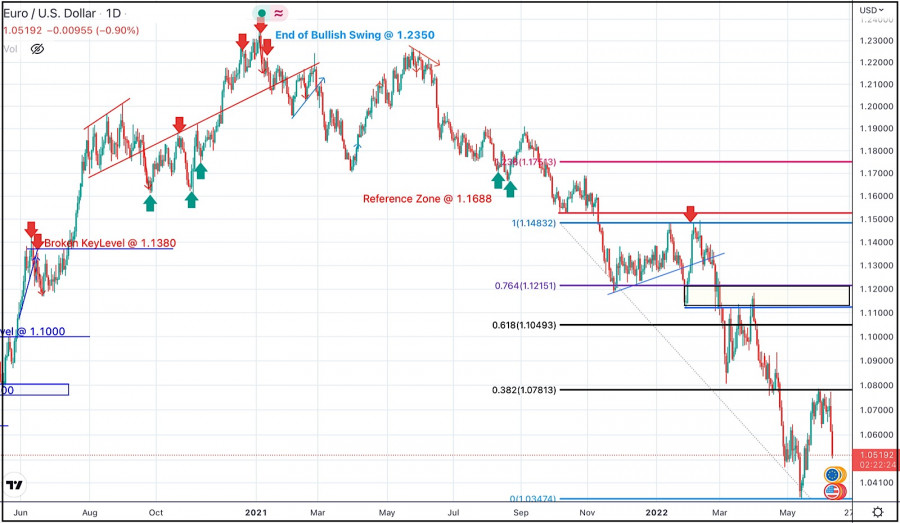
In late September, Re-closure below the price level of 1.1700 has initiated downside-movement towards 1.1500 where some bullish recovery was witnessed. Shortly after, another price decline took place towards 1.1200. Then the EURUSD has temporarily moved-up within the depicted movement channel until downside breakout occurred. The EURUSD looked oversold while approaching the price levels of 1.0800. That's when an upside movement was initiated towards 1.1200. Th recent movement towards 1.1200 was suggested for another SELL opportunity which already reached its targets. The previous ascending movement above 1.0600 enabled further advancement towards 1.0800 where evident bearish rejection could be applied. On the other hand, the pair remains under selling pressure to re-visit the new daily low around 1.0350. The material has been provided by InstaForex Company - www.instaforex.com |
| June 10, 2022 : GBP/USD Intraday technical analysis and significant key-levels. Posted: 10 Jun 2022 11:45 AM PDT
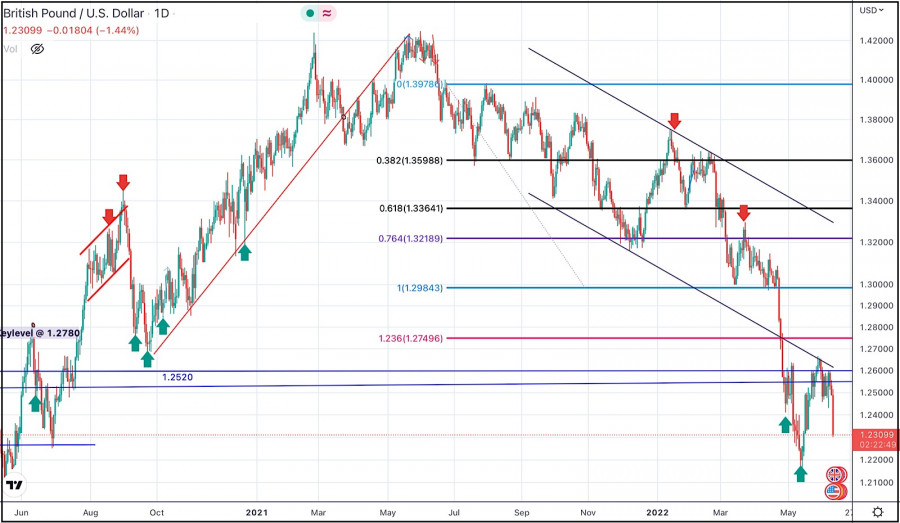
The short-term outlook turned bearish when the market went below 1.3600. This enhanced the bearish side of the market initially towards 1.3400 then 1.3200 which initiated a strong bullish movement towards 1.3600 for another re-test. The recent bullish pullback towards 1.3600 should have been considered for SELL trades as it corresponded to the upper limit of the ongoing bearish channel. Shortly after, Bearish persistence below 1.3360 enabled bearish continuation towards 1.2980 - 1.3000. The price level of 1.3000 stood as intraday Support where a short-term sideway movement could be established . This happened before two successive bearish dips could take place towards 1.2550 and 1.2200. Considerable bullish rejection was expressed around 1.2200. Hence, bullish breakout above 1.2550 was needed to abolish the short-term bearish scenario for sometime. Quick bullish advancement was executed towards 1.2650 where some bearish resistance is encountered. The GBP/USD pair remains under bearish pressure to challenge the new low around 1.2150 again. Hence, recent bearish reversal signs around 1.2650 was considered for SELLING the pair. Initial bearish target is located just belo 1.2150. The material has been provided by InstaForex Company - www.instaforex.com |
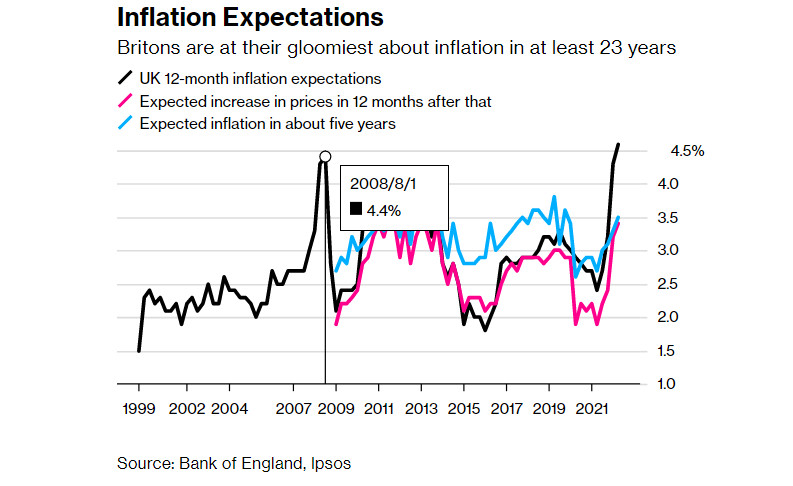
| Outlook for pound sterling looks increasingly bleak Posted: 10 Jun 2022 08:43 AM PDT A large-scale crisis in the cost of living in the UK threatens to completely stop the growth of the national economy. Consumers and businesses are expected to rein in spending as taxes rise and inflation rises to 10%. With this in mind, the maximum that can be achieved in terms of production in the fourth quarter is hardly much higher than the data of the last quarter of 2021. In a report released on June 8, the association of manufacturers of Great Britain said the economy was barely holding its ground in the second and third quarters and would even shrink slightly in the last three months of the year. In general, for 2023, GDP will grow by only 0.6%, which is much lower than the official forecast from the Bank of England. The UK is increasingly at risk of falling into a recession as rising prices reduce household living standards and increase the cost to companies and their employees. The Organization for Economic Cooperation and Development (OECD) echoed the producers' associations in confirming that growth risks stalling next year as consumer spending shrinks in the face of higher prices. The OECD and the International Monetary Fund say that the UK is facing the highest and most persistent inflation among the industrialized countries of the G7. Price overpressureInflation reached a 40-year high of 9% in April, and it is expected that this level has not even reached the peak that will traditionally fall in October, when a further sharp increase in electricity bills is predicted.
Consumers surveyed in May expected in-store prices to rise 4.6% over the next 12 months. This figure rose from 4.3% in February and 2.4% a year ago. Even after five years, inflation is expected to be at 3.5%, well above the 2% target. Overall, more than three out of every four British adults are concerned about the rising cost of living, with low-income and vulnerable people expressing the greatest concern. 77% of people over the age of 16 are "very or somewhat concerned" about an inflationary shock, according to an Office for National Statistics poll following the rise in electricity prices in April. And 68% of those who are concerned report that they are already spending less on essentials. All this leads to a drop in demand for goods from British manufacturers. In this regard, bankruptcies in the British economy have intensified. Although the overall insolvency rates of companies and entrepreneurs in the first three months of this year were about the same as in 2021, the overall picture is much worse if we exclude the smallest firms and companies that were liquidated during the solvency period. Insolvency filings more than doubled in the first quarter, according to the bankruptcy office, with preliminary guidance data for April showing a 21% year-on-year increase. And this trend is unlikely to subside as rising energy and material costs make life difficult for British businesses. Nearly 1,900 UK companies were in financial distress at the end of March, up 19% from a year earlier, according to another private study. Consumer spending and business investment are also expected to rise less than previously forecast this year and remain flat in 2023. The chairman of the association expressed great concern about the state of the industry on the island. Nevertheless, the Bank of England is more than resolute so far. What is worth is only one statement by finance minister Rishi Sunak, that none of the British banking institutions has grounds to demand state aid in the event of a crisis. The statement did not come out of nowhere. Before that, eight major financial institutions, including HSBC Holdings plc, Lloyds Banking Group plc, and Barclays plc, conducted a traditional self-assessment of assets. The so-called solvability estimate is published for the first time. The Bank of England ordered lenders to check themselves in 2019, but the original publication deadline was delayed due to the Covid outbreak. The assessment will be repeated in 2024 and then every two years. Each firm must submit a report showing how the all-important segments—lending and taking deposits—could continue if the firm failed. The settlement rules are there to give the authorities or new management the time they need to restructure or liquidate the firm. In its report, for example, Barclays said that the separation of its retail banking from investment banking has simplified the group and reduced the likelihood that customers and clients will be exposed to a disruption elsewhere in the company or company turmoil. Obviously, the Bank of England took into account not only the experience of 2008, when taxpayers paid billions of pounds to support organizations such as the Royal Bank of Scotland. As far as I understand, two pandemic years of ultra-soft policies, when banks were swimming in cheap loans, were also taken into account. These finances, as in 2008, almost completely leaked to the financial markets of secondary and speculative instruments, having little effect on the financing of real production. This was partly a consequence of the quarantine, because the enterprises themselves requested fewer loans, because they were not sure of the ability to work fully in the face of restrictions and the threat of another wave of the epidemic. And yet, there is a feeling that the British Treasury has finally realized the need for targeted or at least intra-sector assistance specifically to manufacturers. It is also quite logical in terms of reducing the debt burden on the British, who are now confident that their taxes will not be used to pay out insane dividends to shareholders or bonuses to bank management. The seriousness of the central bank's intentions is confirmed by the clearly stated position that even if the bank needs to be closed, customers will be able to continue accessing their accounts as usual. But there is a big catch in all this. In fact, to keep the economy going, this step should have been taken two years ago. Now the regulator's reserves are depleted, all kinds of support and development funds have long been exhausted, and the difficult six months are still ahead. Still, better late than never. The Bank of England expressed confidence that none of the institutions included in the review is expected to go bankrupt due to the fact that none of them is too large to bear systemic risks. It is a bit worrying that the adjustment regimes are largely based on the experience of the 2008 crisis. Adjustment planning for the regulator is often based on the increasingly rare assumption that the bank will fail on Friday night and that the firm and regulators can handle the fallout while the markets are closed. British confidence in the actions of the Bank of England is steadily fallingThe report showed that public confidence in the Bank of England is at an all-time low and Britons expect above-target inflation to continue for years to come. For the first time in history, more people were dissatisfied than satisfied with the work of the central bank, according to a quarterly study of British attitudes to consumer prices, and it cannot be said that there are no grounds for this. Along with the decline in approval, only 25% said they were satisfied with the performance of the Bank of England, respondents said they were more pessimistic about inflation than at any time since the poll began in 1999. These results will no doubt increase pressure on Bank of England Governor Andrew Bailey and his colleagues to secure an unprecedented fifth consecutive rate hike next week. We can expect a quarter-point increase, bringing the total rate increase to 1.25%. This is not at all good news, primarily because if people stop believing in the ability of the central bank to control consumer prices, there is a risk that they will seek higher wages as compensation, which could lead to a self-winding 1970-style inflation spiral years, which will lead to an even greater increase in the cost of living. The rising cost of living will scare away some of the immigrants who were in England for the sake of earnings. This means that this event will be followed by their outflow, an even greater shortage of cheap labor, and the need to raise the wages of producers again. And these are only internal economic factors. The conflict in Ukraine, in which Britain is a stakeholder and supplier of one of the parties, and the ongoing outbreaks of coronavirus in China also worsen the forecasts. In general, the future of the British economy looks quite bleak. Obviously, the British currency will also be under attack. So, we can expect further development of the trend for the pound/dollar currency pair. The material has been provided by InstaForex Company - www.instaforex.com |
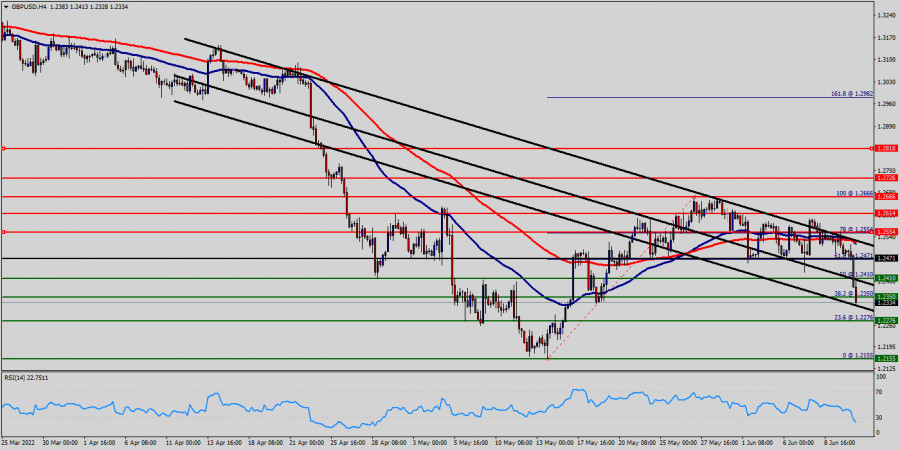
| Technical analysis of GBP/USD for June 10, 2022 Posted: 10 Jun 2022 08:37 AM PDT Overview: The GBP/USD pair has faced strong resistance at the level of 1.2410 because support had become resistance. So, the strong resistance has been already formed at the level of 1.2410 and the pair is likely to try to approach it in order to test it again. However, if the pair fails to pass through the level of 1.2410, the market will indicate a bearish opportunity below the new strong resistance level of 1.2410 (the level of 1.2410 coincides with a ratio of 50% Fibonacci).
Thus, the market is indicating a bearish opportunity below 1.2350 so it will be good to sell at 1.2350 with the first target of 1.2276. It will also call for a downtrend in order to continue towards 1.2155. The daily strong support is seen at 1.2155. However, the stop loss should always be taken into account, for that it will be reasonable to set your stop loss at the level of 1.2430 The material has been provided by InstaForex Company - www.instaforex.com |
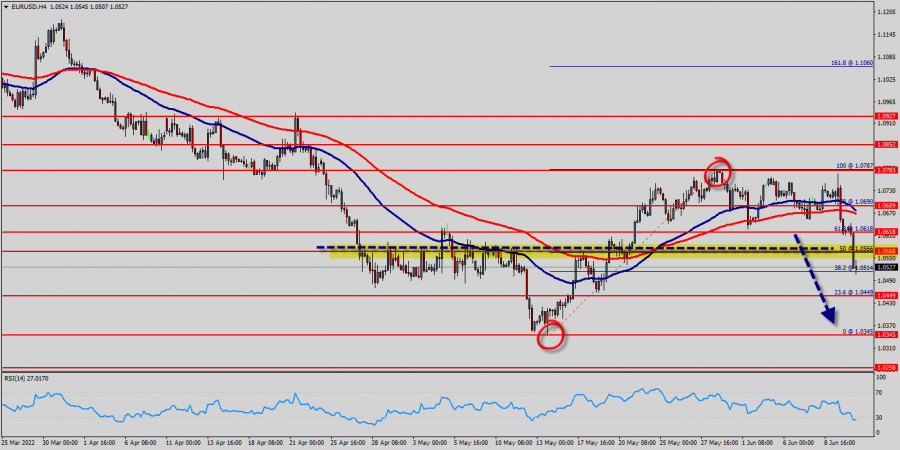
| Technical analysis of EUR/USD for June 10, 2022 Posted: 10 Jun 2022 08:14 AM PDT Overview: As expected, the EUR/USD pair continues to move downwards from the level of 1.0618. Yesterday, the pair dropped from the level of 1.0618 to the bottom around 1.0514. Today, the first resistance level is seen at 1.0568 followed by 1.0618, while daily support 1 is seen at 1.0449. According to the previous events, the EUR/USD pair is still moving between the levels of 1.0618 and 1.0449; for that we expect a range of 169 pips (1.0618 - 1.0449). Currently, the price is in a bearish channel. This is confirmed by the RSI indicator signaling that we are still in a bearish trending market.
If the EUR/USD pair fails to break through the resistance level of 1.0618 , the market will decline further to 1.0449. This would suggest a bearish market because the RSI indicator is still in a positive area and does not show any trend-reversal signs. The pair is expected to drop lower towards at least 1.0345 with a view to test the daily bottom . On the contrary, if a breakout takes place at the resistance level of 1.0618 (the double top), then this scenario may become invalidated. The material has been provided by InstaForex Company - www.instaforex.com |
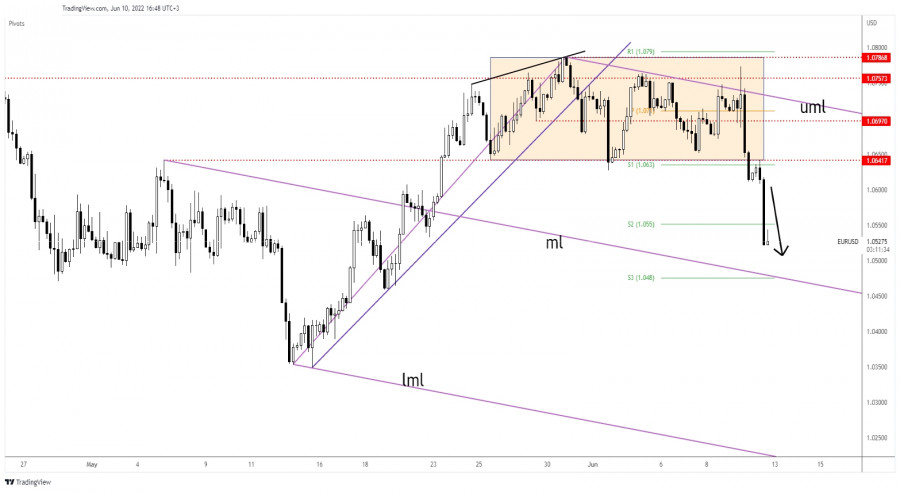
| EUR/USD Plunges As Expected, Median Line As Target Posted: 10 Jun 2022 07:58 AM PDT The EUR/USD pair is trading in the red at 1.0515 at the time of writing. DXY's strong rally forced USD to appreciate versus its rivals. As you know from my previous analysis, the currency pair is expected to drop after escaping from the range pattern. Fundamentally, USD was boosted by higher US inflation. The CPI rose by 1.0% versus 0.7% expected, while the Core CPI surged by 0.6% compared to the 0.5% growth forecasted. EUR/USD Massive Drop
The EUR/USD pair signaled a deeper drop after confirming its breakdown through the 1.0641 key support. Now, it is about to reach the descending pitchfork's median line (ml) which is seen as dynamic support and as a downside target. After its massive drop, we cannot exclude a temporary rebound. A bounce-back could bring new selling opportunities. After registering only a false breakout with great separation through the upper median line (uml), the EUR/USD pair signaled that the upside is over and that sellers could take the lead. EUR/USD ForecastThe retest of 1.0641 signaled a downside continuation. Dropping and closing below yesterday's low of 1.0611 represented a selling opportunity. Now, it's too late to go short as the rate could hit the median line (ml) soon. A temporary rebound could bring new selling opportunities. Also, a valid breakdown below the median line (ml) could bring new short signals. The former low of 1.0354 is seen as a potential downside obstacle. The material has been provided by InstaForex Company - www.instaforex.com |
| Trading plan for NZDUSD for June 10, 2022 Posted: 10 Jun 2022 07:46 AM PDT
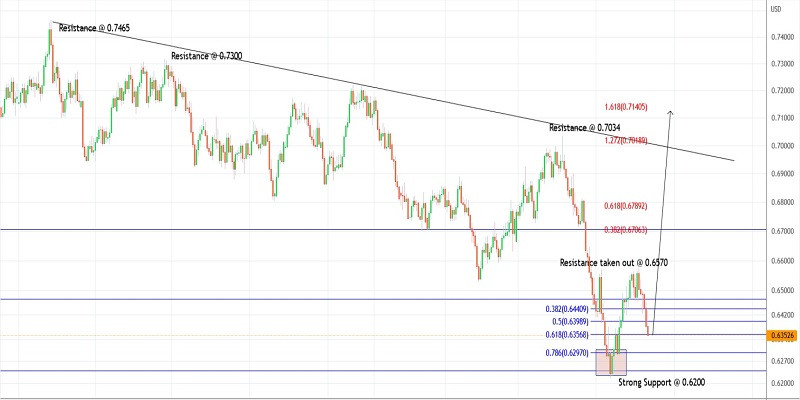
Technical outlook:NZDUSD has dropped through fresh intraday lows around 0.6350 on Friday. Prices have reached formidable support before finding some bids coming. The currency pair is seen to be trading around the 0.6360 level at this point in writing and is expected to resume its rally towards 0.6790 and higher going forward. NZDUSD has already carved a meaningful lower degree upswing between the 0.6230 and 0.6575 levels as seen on the daily chart. Also, note that prices broke above the initial resistance seen around the 0.6570 mark as bulls registered themselves. The currency pair has now retraced from the above upswing through the Fibonacci 0.618 level around the low of 0.6350. NZDUSD is now looking poised to turn bullish from here and produce yet another upswing towards 0.6790 and 0.7100. For the above structure to hold, prices must stay above the 0.6200 support. Traders might be preparing to initiate fresh long positions now just below the 0.6200 mark. Trading plan:Potential rally towards 0.6790 and 0.7100 against 0.6200 Good luck! The material has been provided by InstaForex Company - www.instaforex.com |
| European stock market plunges sharply Posted: 10 Jun 2022 07:34 AM PDT During Friday's trading, key stock indices in Western Europe fell by more than 1%. Investors are worried that a permanent increase in inflation and rising interest rates will soon trigger a recession in the European economy. The STOXX Europe 600, which represents large, mid and small capitalization European companies, fell by 1.44% to 428.14 points. Meanwhile, stocks of German real estate company TAG Immobilien AG topped the decline list, losing 5.6% in value. The British FTSE 100 index was down by 1.01%, while the French CAC 40 and German DAX lost 1.58% and 1.39% respectively.
Biggest and least gainers Swiss banking group Credit Suisse Group AG has fallen by 5.7%. On the eve the company denied information that it is being bought by US bank State Street Corp. The market capitalisation of French energy company Electricite de France SA sank by 1.1%. Earlier, the company reported that the majority of its shareholders voted to receive their dividends for 2021 in the form of securities. The share price of British oil and gas company Genel Energy PLC declined by 1.5% on news that Genel Energy chief executive Bill Hicks is resigning. GSK, a British pharmaceutical company, rose by 1.6%. Earlier, the drugmaker's management announced that the latest trial of RSV vaccine for older adults had shown positive results. Securities of Dutch online food ordering and delivery company Just Eat Takeaway have jumped by 4.8%. Earlier Bloomberg news agency reported that private equity firms were showing interest in Just Eat Takeaway's US unit Grubhub. Factors of market pressure On Friday, European investors were actively discussing the European Central Bank's decision announced the day before. Thus, the regulator kept the benchmark interest rate at a record low of zero and the deposit rate remained at minus 0.5%. The rate on marginal loans was kept at 0.25%. In addition, the European Central Bank has confirmed that it would end net purchases under our asset purchase programme as of 1 July 2022. The ECB said in a press release that it intended to raise key interest rates by 25 basis points at the end of its July meeting. In addition, the European Central Bank plans to raise rates again in September. The level of this increase will depend on medium-term inflation forecasts. Earlier, the ECB's Governing Council noted a record May inflationary pressure in the euro area. Thus, last month the consumer price level in the eurozone soared by 8.1% year-on-year. Market analysts had previously forecast an increase of only 7.7%. May's result was an all-time record and more than quadrupled the European Central Bank's target of 2%. The European regulator cited rising energy and food prices amid the armed conflict in Ukraine as the main reason for such a sharp inflation surge in May. At the same time, the ECB downgraded its growth forecasts. The central bank expects annual real GDP growth of 2.8% in 2022, 2.1% in 2023, and 2.1% in 2024. On the price front, the new staff projections foresee yearly inflation at 6.8% in 2022 before declining to 3.5% in 2023 and 2.1% in 2024. On Friday, European traders await the evening publication of the US Department of Labor's report on the nation's consumer price movements over the past month. According to analysts' preliminary forecasts, inflation in May will remain at the level of the previous month and stand at 8.3% year-on-year. Fresh data will enable an assessment of the current state of the US economy. In addition, the Department of Labor's report will traditionally be an important support for the US Federal Reserve when deciding on further monetary policy tightening. The next meeting of the US regulator will be held next week. The central bank is expected to increase its key rate by a further 50 basis points. In addition, the US Federal Reserve will release its 2022 forecasts for key indicators of the US economy at the end of next week's meeting. Trading results As for yesterday's trading session, European stock market indicators also declined on Thursday on the back of the announcement of the European Central Bank (ECB) meeting results. As a result, the STOXX Europe 600 fell by 1.36% to 434.38 points. The British FTSE 100 index shed by 1.54% to 7,471.47 points, the French CAC 40 lost 1.4% to 6,358.46 points (its lowest value in a fortnight) and the German DAX dropped by 1.71% to 1,4198.8 points. Swedish helmet manufacturer MIPS AB plummeted by 7.4% as management announced long-term targets for key financial indicators. Norwegian oil producer Var Energi ASA was down by 8.7%. The market capitalisation of Italian energy company Eni SpA slipped by 2.4%. The share price of French fashion brand owner Kering declined by 1.5%. British American Tobacco PLC's capitalisation has fallen by 2%. Even confirmed revenue and profit growth forecasts for 2022 could not help the stock. The material has been provided by InstaForex Company - www.instaforex.com |
| Trading plan for AUDUSD for June 10, 2022 Posted: 10 Jun 2022 07:17 AM PDT
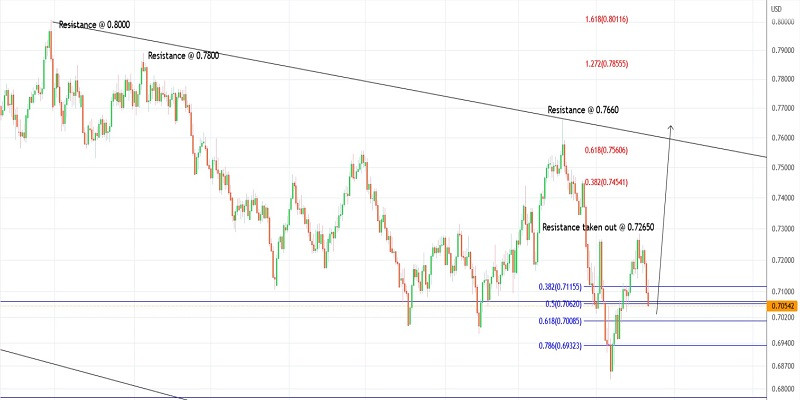
Technical outlook:AUDUSD has dropped through fresh intraday lows around 0.7050 on Friday. The currency pair still has some room until strong support comes in around the 0.7000 level. Bulls will be inclined to hold prices above the recent swing low at the 0.6830 mark to keep the structure encouraging for yet another rally towards 0.7550. AUDUSD has carved a lower degree upswing between the 0.6953 and 0.7282 levels in the past few trading sessions. Furthermore, bulls have successfully shown themselves by breaking the initial resistance around the 0.7265 mark early this month. Prices are correcting lower since then before resuming the next leg higher through 0.7550 and further. AUDUSD still has the potential to go close to the 0.6950 level, which is the Fibonacci 0.618 retracement of the recent upswing described earlier. It the structure unfolds accordingly, bulls will remain poised to be back in control and push through the projected targets. Watch out for the next resistance to be taken out around the 0.7660 mark going forward. Trading plan:Potential rally through 0.7550 against 0.6800 Good luck! The material has been provided by InstaForex Company - www.instaforex.com |
| Trading plan for Ripple for June 10, 2022 Posted: 10 Jun 2022 06:49 AM PDT
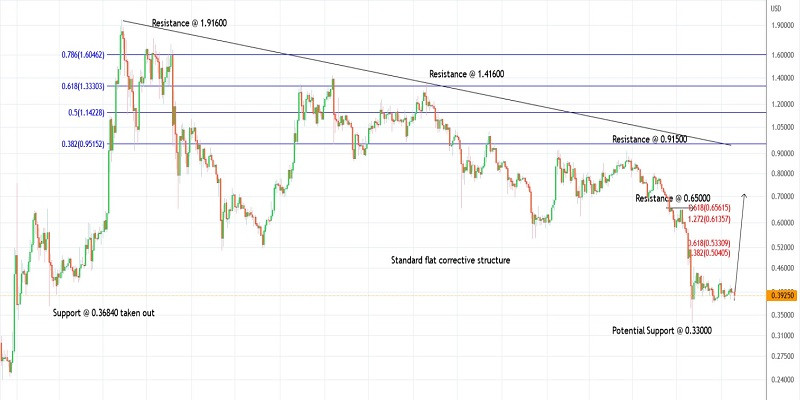
Technical outlook:Ripple has dropped through the $0.39000 mark on the intraday chart on Friday, testing the lower range of consolidation. The crypto has been drifting sideways after rallying through the $0.46300 mark on May 13, 2022. Bulls will be poised to hold prices above the recent swing lows registered around the $0.33300 level to keep the structure constructive. Ripple had raised through an all-time high of $1.91600 before reversing lower. The drop between $1.91600 through $0.33300 looks like a complex corrective structure. Furthermore, Ripple has taken out support around 0.36840 as well. Ideally, the price should resume its rally from here and push through the $0.65500 mark in the near term. Ripple faces resistance around $0.65000, followed by $0.91500, while support is seen around the $0.33000 mark. A push above $0.65000 and subsequently $0.91500 will encourage further advancement through the $1.41600 levels. Traders will remain poised to hold long positions for now with risk below the $0.33000 level. Trading plan:Potential rally through $0.65000 against $0.33000 Good luck! The material has been provided by InstaForex Company - www.instaforex.com |
| Follow up to our silver bearish signal. Posted: 10 Jun 2022 06:36 AM PDT
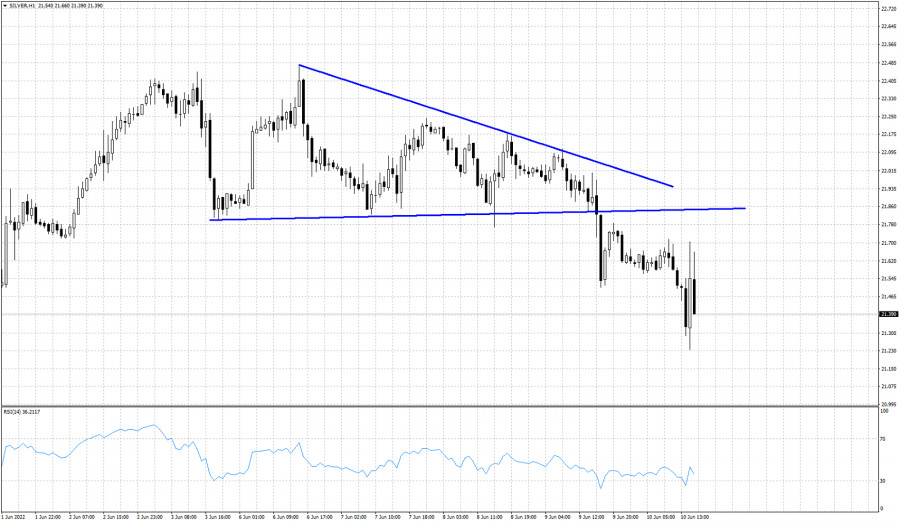
Blue lines- descending triangle pattern Yesterday in our Silver analysis we noted the bearish descending triangle pattern in the short-term and warned traders that a break in Silver price below $21.82 would be a bearish signal and price should then fall towards $21.20. Today's low in Silver was at $21.23. Silver remains under pressure and with a lower high, chances favor more downside to be seen until the end of the session. Resistance is at $21.82 where we once had support. Silver has formed a lower high at $21.70 and as long as price is below this level, we remain bearish for the near term. The material has been provided by InstaForex Company - www.instaforex.com |
| Posted: 10 Jun 2022 06:34 AM PDT
Early in the American session, gold (XAU/USD) was trading with considerable losses. Currently, it is trading at 1,836 with a bearish bias on 4-hour charts but with strong support in the area of 50%, Fibonacci around 1,826. The tightening of central banks from around the world has reignited fears about growth and investors are seeking refuge in the US dollar. Anxiety among investors and sentiment around the dollar is mounting ahead of the Fed meeting next week. Gold was falling on Friday and trading near 1,833. Relevant support is seen on the 4-hour chart at 1,826. If it is broken and the asset closes below this level, it could lead to further losses. Thus, gold could reach 61.8% Fibonacci at 1,819. The US inflation data may be the key to define the next direction of gold. XAU/USD has one last support and we could see a strong technical bounce if it tests the 1,826 area. This level supported gold on May 13, 16, and 31 and is likely to show its strength now. Gold could bounce back and resume its uptrend. The eagle indicator favors the downside in the short term. However, the price could find support around the downtrend channe, which could favor a technical rebound in the coming hours. In the 4-hour chart, we can see that gold is approaching the support at 1,826. Therefore, we should expect a rebound in this area, in case gold manages to stay above it, traders will ahve an opportunity to buy with targets at 1,843 and 1,849 (21 SMA). The material has been provided by InstaForex Company - www.instaforex.com |
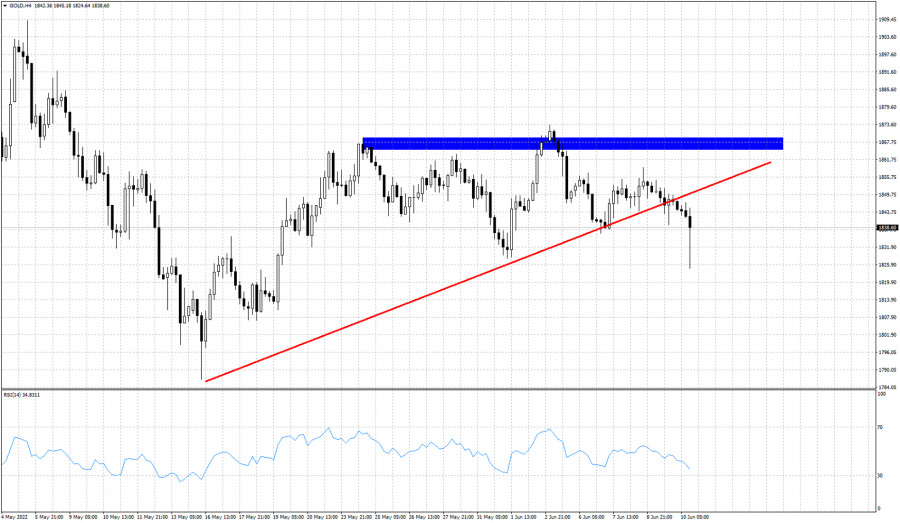
| Short-term technical analysis on Gold for June 10, 2022. Posted: 10 Jun 2022 06:30 AM PDT
Red line -support trend line (broken) Gold price has provided several signs of weakness since yesterday. Price failed to recapture $1,855 and instead price broke below $1,840 support level and the red upward sloping support trend line. Bears are taking control of the short-term trend. Price has made new lower lows and lower highs. Gold is expected to move lower towards $1,820-25 over the next few sessions. Resistance is now found at $1,860 and as long as price is below this level, bears will have the upper hand. The material has been provided by InstaForex Company - www.instaforex.com |
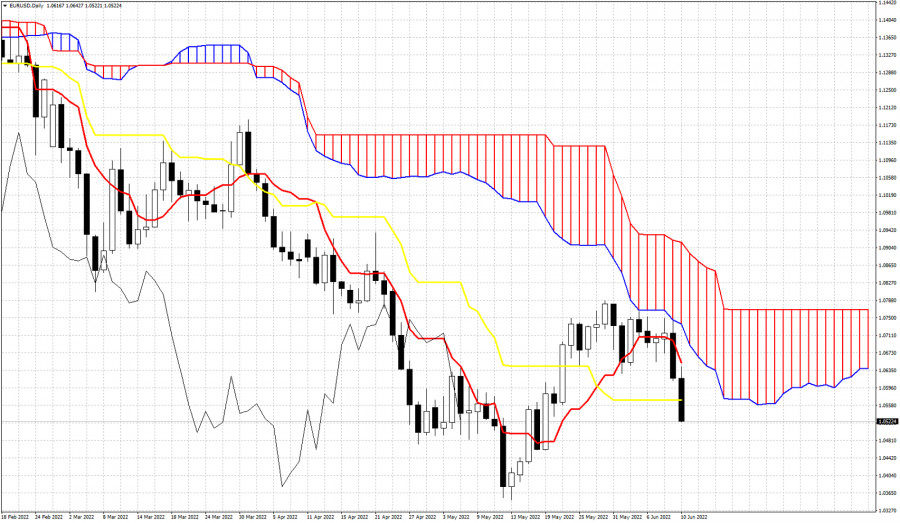
| EURUSD rejected at Ichimoku cloud resistance. Posted: 10 Jun 2022 06:27 AM PDT
The day yesterday ended very badly for EURUSD bulls. At the beginning bulls were seeing price entering the close hoping for a close inside it after a long time. Instead of a trend change to neutral, price not only closed below the Kumo (cloud), it got rejected and broke down below the tenkan-sen (red line indicator). Today EURUSD remains under pressure. Price is breaking below the kijun-sen (yellow line indicator). This is bearish price action. Price is also trading below last week's low. EURUSD bulls need to step in right now. This is their last line of defense. If the do not defend 1.0550, EURUSD will be in danger of seeing even lower levels below 1.03. The material has been provided by InstaForex Company - www.instaforex.com |
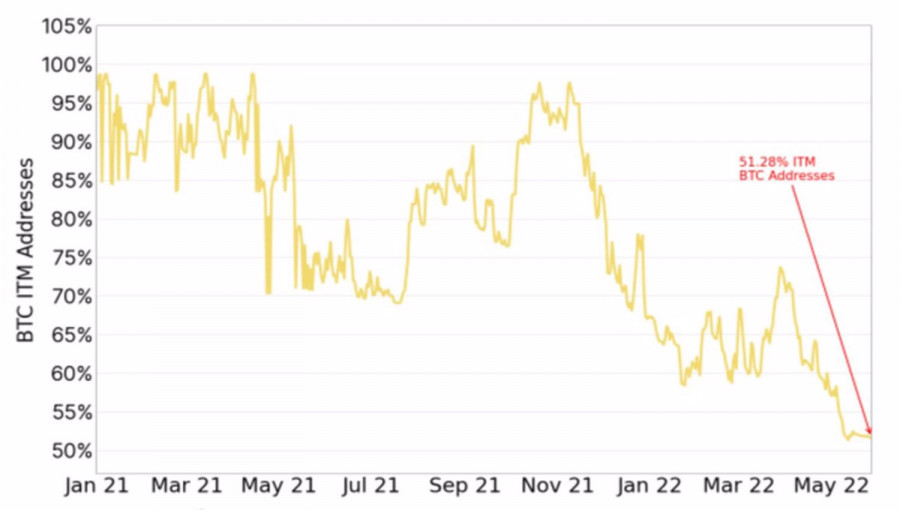
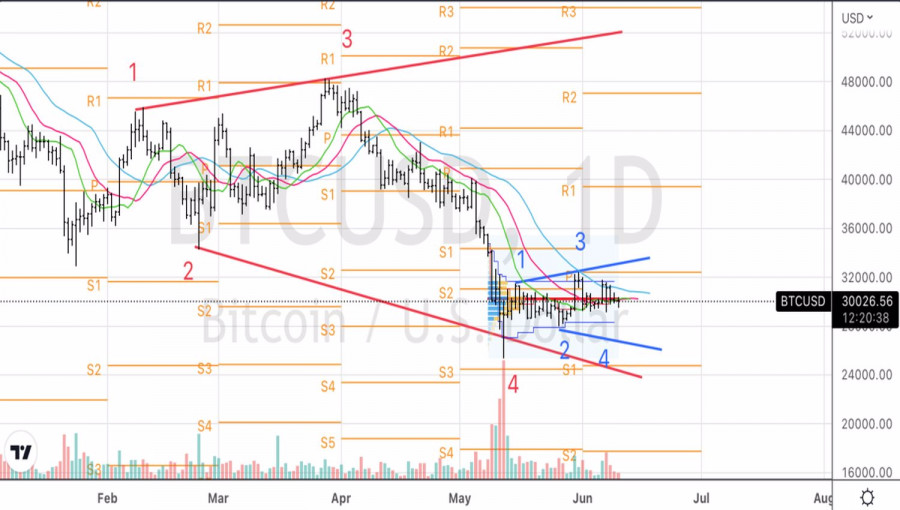
| Is Bitcoin nearing capitulation? Posted: 10 Jun 2022 06:25 AM PDT The stabilization of Bitcoin near the psychologically important mark of 30,000 allows you to take a breath and speculate at what levels the cryptocurrency will capitulate. According to digital asset company Bequant, it is already on its way, as the share of anonymous wallets "in the money," that is, those of their owners who purchased a token at a price below the current one, has fallen to a multi-month low of 51%. Glassnode, referring to the decrease in the share of profitable accounts in the market capitalization to 18-25%, calls the area 20,560–23,600. After reaching it, BTCUSD quotes will collapse like a house of cards. Dynamics of the share of anonymous Bitcoin wallets "in the money"
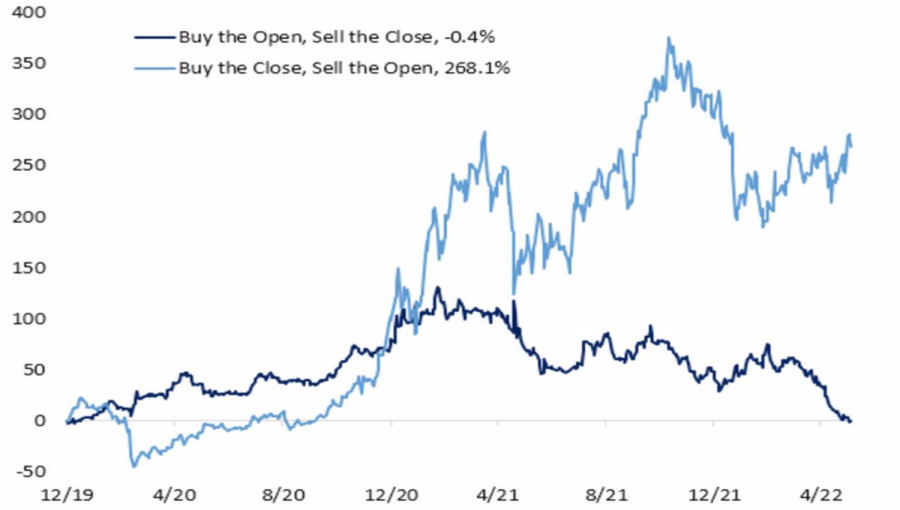
The more time passes, the more you realize that Bitcoin is a normal risky asset, the value of which depends on economic cycles. Due to the pandemic, the associated global recession, and massive monetary stimulus from the Fed and other central banks, the leader of the cryptocurrency sector has skyrocketed. However, the massive tightening of monetary policy brought it down to earth. In 2020–2021, the Fed stuffed the markets and the global economy with cheap liquidity, now it is taking it out of the system. Where else will BTCUSD go, if not downward? If during the previous two years Bitcoin grew thanks to the thirst for profit, then this year its fans are closely following the macroeconomic statistics in the United States. It may give clues about the Fed's next steps. A pause in the process of monetary restriction will have a positive impact on the entire class of risky assets, including cryptocurrencies. Unsurprisingly, in such an environment, their association with the US Tech Index continues to strengthen. The increased influence of the Nasdaq Composite on BTCUSD is evidenced not only by their correlation, but also by the completely different efficiency of investing in risky assets now and in the past. If buying Bitcoin at the close of the U.S. stock market and then selling it at the open made a profit of 270% in 2020, then in 2022 there would be an 8% loss. On the contrary, purchases at the opening followed by a sale at the close of the stock market two years ago would have practically not changed the deposit, while this year they would have led to its drawdown by 30%. Bitcoin Strategies
Thus, during periods of "bullish" markets, the cryptocurrency grows faster than the Nasdaq Composite, during "bearish" conditions it falls more sharply than the stock index. This allows Bitcoin to be considered a riskier asset than stocks. BTCUSD, Daily chart
Technically, the inability of BTCUSD to hold below the fair value at 30,200 will indicate the weakness of the bulls and will be the basis for further decline. However, I do not expect too deep drawdown and still hope that Bitcoin will be able to cling to the 24,500–25,000 convergence area. Its subsequent growth to 28,400 and 30,200 can become the basis for purchases within the framework of the formation and implementation of the parent and child patterns of the Broadening Wedge. The material has been provided by InstaForex Company - www.instaforex.com |
| SPX falls below 4,000 price level. Posted: 10 Jun 2022 06:21 AM PDT
|
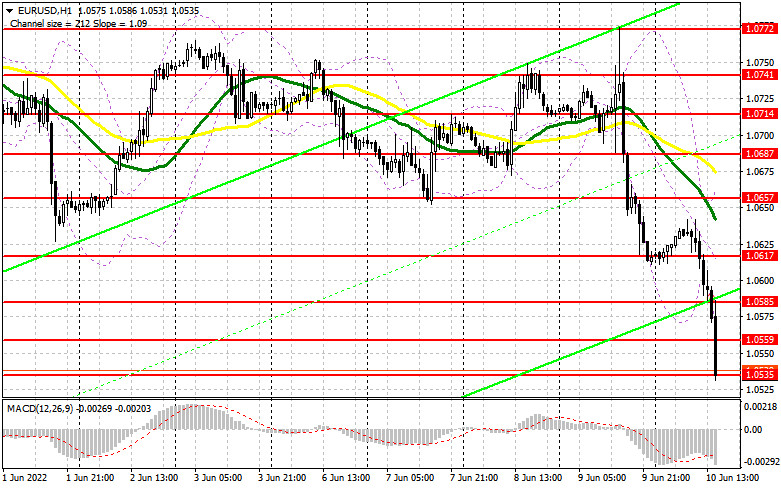
| Posted: 10 Jun 2022 06:18 AM PDT In the morning article, I highlighted several levels and recommended taking decisions with those levels in focus. Now let's look at the 5-minute chart and try to figure out what actually happened. A drop below 1.0602 and an upward test of this level gave an excellent sell signal within the trend that appeared after the ECB meeting. It triggered a sharp downward movement even before the release of inflation data. The pair declined by 40 pips. Traders were hardly surprised by a decrease in the euro after the inflation report. which I have repeatedly mentioned such a possibility. The pair slid by 30 pips amid a breakout, an upward test of 1.0559, and a sell signal. At the time of writing the article, that signal had already led to a breakout of 1.0535.
What is needed to open long positions on EUR/USD Bulls lost the upper hand after inflation in the United States soared in May, reaching another record level. Contrary to the expectations of the Federal Reserve System, which assumed that inflation had achieved its peak in April, the figure did not decline. Now, the central bank needs to act more aggressively. It is quite difficult to predict what will happen next. Oil prices are firmly above $100 per barrel for a long time. Prices are also surging for various categories of goods and services. Although Janet Yellen believes that a recession in the US economy looks unlikely, the figures show the opposite. The main task of the bulls is to protect the support level of 1.0535. A false breakout of this level may lead to a slight upward correction of the euro to 1.0559 and even to 1.0585 where I recommend locking in profits. It is better to open long positions from 1.0585 only after a breakout and a downward test of this level, which will bring new buying opportunities. So, the pair could even reach 1.0617. If EUR /USD continues to decrease, it is recommended to buy only after a false breakout of 1.0499. If bulls show no energy at this level, traders will rush to close stop-loss orders, pushing the pair to 1.0462. At this level, you may also open long positions. You can buy EUR/USD immediately at a bounce from the level of 1.0423 or even a low of 1.0391 with an upward intraday correction of 30-35 pips. What is needed to open short positions on EUR/USD Sellers continue to push the pair lower. I think the downward movement will continue and I would not advise counting on a strong upward correction at the end of the week. If EUR/USD rises sharply in the afternoon, only a false breakout of 1.0559 will generate a sell signal with the prospect of a return to 1.0535. Given that trading is carried out below the moving averages, especially after such negative news, bulls will definitely be unable to regain the upper hand in the short term. A decline below 1.0535, as well as an upward test of this level, will give an additional sell signal. In this case, EUR bulls will close stop-loss orders. The pair is likely to slump to 1.0499 or to 1.0499. In this case, a more distant target will be the 1.0462 level where I recommend closing all short positions. If EUR/USD climbs during the American session and bears show no energy at 1.0559, a correction may occur. It is better to open short positions after a false breakout of 1.0585. You can sell EUR/USD immediately at a bounce from a high of 1.0617 or even 1.0657, keeping in mind a downward intraday correction of 30-35 pips.
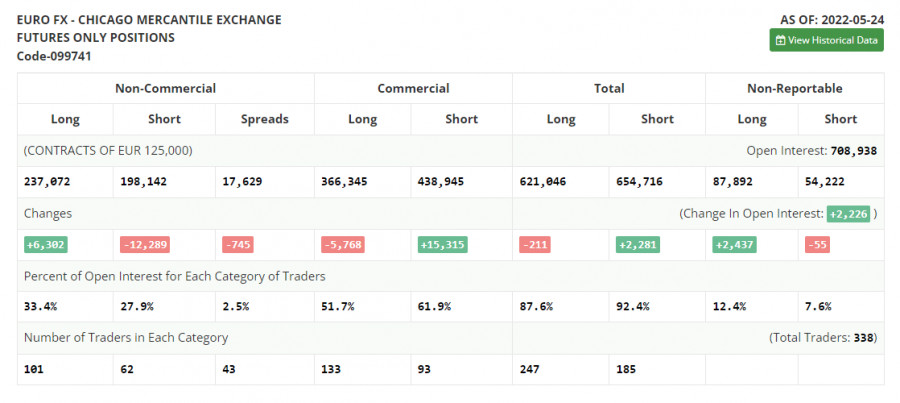
COT report The COT report for May 24 logged a rise in the number of long positions and a decline in the number of short positions. Traders continued opening long positions, expecting a more aggressive monetary policy from the ECB. Although last week, there were fewer comments about a key interest rate hike in the near future, the euro/dollar pair managed to retain its upward potential. Now, analysts suppose that the ECB will raise the deposit rate by one-fourth of a basis point as early as July. The next two hikes will take place in September and December. By the end of the year, the benchmark rate is expected to be at the level of 0.25%. However, some experts are sure that the central bank will have to take more aggressive measures. A lot depends on the inflation report for May of this year. The indicator may jump to 7.7% on a yearly basis, thus increasing pressure on politicians. Against the backdrop, the regulator may raise the key interest rate up to 0.5% from the current zero level. The COT report unveiled that the number of long non-commercial positions increased by 6,302 to 237,072 from 230,770, while the number of short non-commercial positions declined by 12,289 to 198,142 from 210,431. The euro's low price is making the currency more attractive for mid-term traders. According to the weekly results, the total non-commercial net position increased to 38,930 from 20,339. The weekly close price jumped to 1.0734 from 1.0556.
Signals of technical indicators Moving averages EUR/USD is trading below 30- and 50-period moving averages, indicating the resumption of a bearish trend. Remark. The author is analyzing the period and prices of moving averages on the 1-hour chart. So, it differs from the common definition of classic daily moving averages on the daily chart. Bollinger Bands In case of a rise, the upper border at 1.0657 will act as resistance. Definitions of technical indicators
|

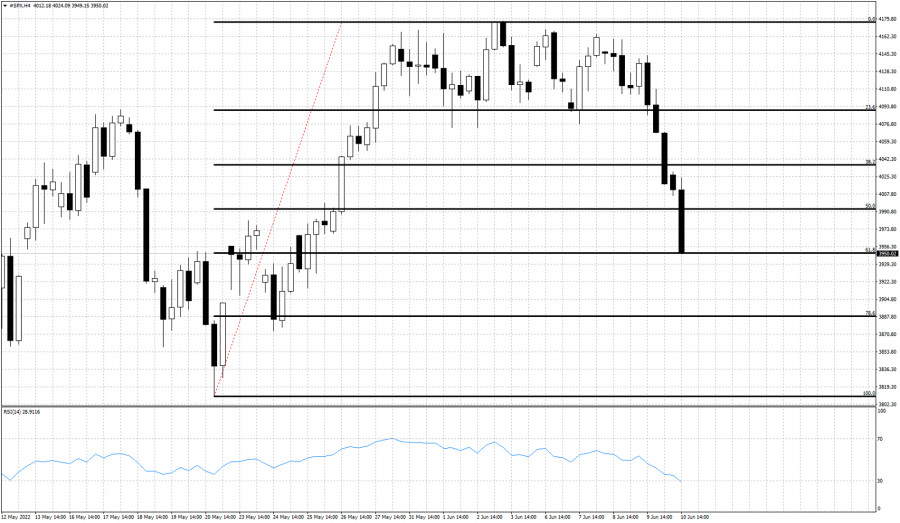 analysis warning SPX bulls that price was vulnerable to a move towards 4,000 and lower. Today price has broken below the 4,000 and has reached the 61.8% Fibonacci retracement of the entire rise from the 3,810 lows. Short-term trend is bearish as price is making lower lows and lower highs. The RSI is far from oversold levels and there is still no bullish divergence evident. Support is found at current levels of 3.950 but I would not expect more than a short-term bounce. The downside in stocks is expected to continue over the coming sessions.
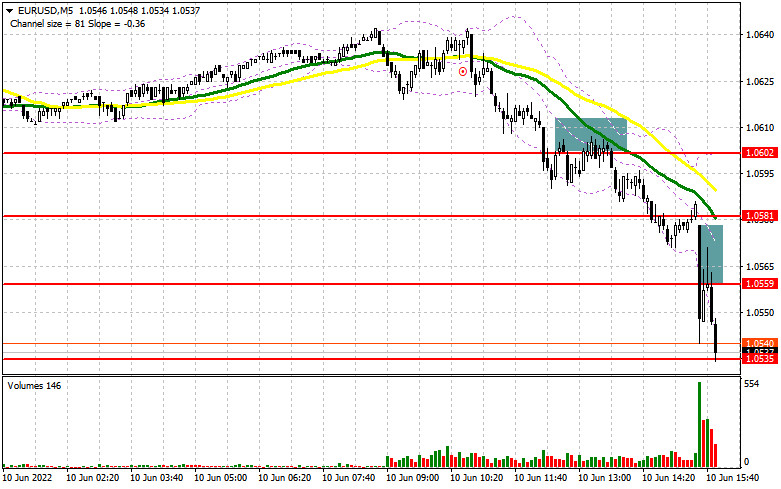
| You are subscribed to email updates from Forex analysis review. To stop receiving these emails, you may unsubscribe now. | Email delivery powered by Google |
| Google, 1600 Amphitheatre Parkway, Mountain View, CA 94043, United States | |


Comments