Forex analysis review
Forex analysis review |
- Technical analysis of GBP/USD for June 27, 2022
- EURUSD: Who is preparing the revolution?
- Pound hit the hole
- Technical analysis of EUR/USD for June 27, 2022
- Gold challenging major support
- June 27, 2022 : EUR/USD daily technical review and trading opportunities.
- June 27, 2022 : EUR/USD Intraday technical analysis and trading plan.
- June 27, 2022 : GBP/USD Intraday technical analysis and significant key-levels.
- European stock market soars at beginning of week
- Oil continues to rise
- Bitcoin settles at 21,708, new sell-off in play
- Trading Signal for Gold (XAU/USD) on June 27-28, 2022: buy in case of rebound at $1,825 (weekly support - GAP)
- GBP/USD: downside invalidated, further growth in cards
- USD/JPY: upside continuation or larger drop?
- EUR/USD: attention at resistance
- Trading plan for SPX500 on June 27, 2022
- GBP/USD analysis on June 27. An unexpected increase in orders in the US caused an increase in demand for the dollar.
- EUR/USD analysis on June 27. We are waiting for a new increase in inflation in the eurozon
- EUR/USD analysis on June 27, 2022. New week brings same problems
- No real progress for Cardano the last two months.
- Technical analysis on Gold.
- Trading plan for Dow Jones on June 27, 2022
- GBP/USD on June 27, 2022
- Technical analysis on GBPUSD.
- Technical analysis on EURUSD.
| Technical analysis of GBP/USD for June 27, 2022 Posted: 27 Jun 2022 02:43 PM PDT
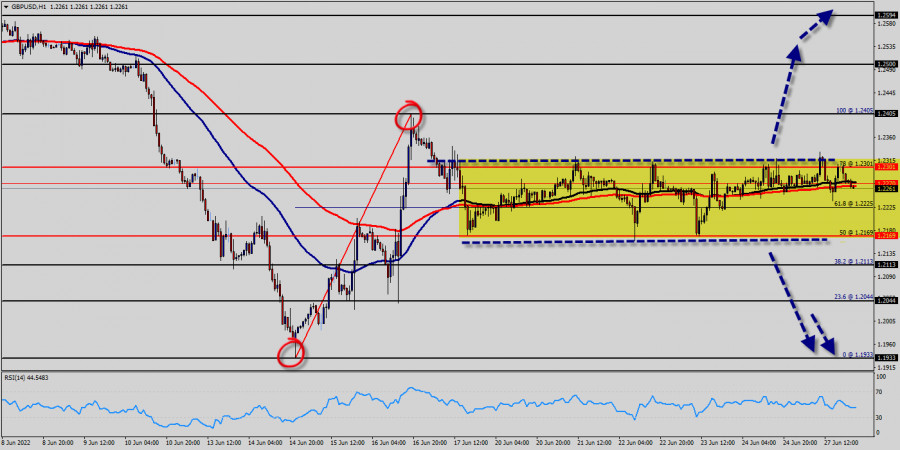
The GBP/USD pair didn't make any significant movements yesterday. The bias remains bearish in the nearest term testing 1.2169 or lower. Immediate support is seen around 1.2169. A clear break below that area could lead price to the neutral zone in the nearest term. Price will test 1.2113, because in general, we remain bearish on June 27th, 2022. Yesterday, the market moved from its bottom at 1.2169 and continued to rise towards the top of 1.2263. Today, on the one-hour chart, the current rise will remain within a framework of correction. However, if the pair fails to pass through the level of 1.2301 (major resistance), the market will indicate a bearish opportunity below the strong resistance level of 1.2301 (the level of 0.9910 coincides with tha ratio of 78% Fibonacci retracement). Since there is nothing new in this market, it is not bullish yet. Sell deals are recommended below the level of 1.2301 with the first target at 1.2169 so as to test the double bottom. If the trend breaks the double bottom level of 0.9802, the pair is likely to move downwards continuing the development of a bearish trend to the level of 1.2113 in order to test the weekly support 1. The level of 1.2113 is a good place to take profits. Moreover, the RSI is still signaling that the trend is downward as it remains strong belowthe moving average (100). This suggests that the pair will probably go down in coming hours. Uptrend scenario : An uptrend will start as soon, as the market rises above resistance level 1.2301, which will be followed by moving up to resistance level 1.2405. Further close above the high end may cause a rally towards 1.2500. Nonetheless, the weekly resistance level and zone should be considered. The material has been provided by InstaForex Company - www.instaforex.com |
| EURUSD: Who is preparing the revolution? Posted: 27 Jun 2022 02:42 PM PDT The tops can't, the bottoms don't want to. A revolutionary situation has developed in the EURUSD pair, and it is preparing for a storm. However, the market is completely calm, which allows investors to sharpen their swords. Indeed, weak data on the US economy increased the likelihood of a recession, forcing the futures market to expect an increase in the federal funds rate to 3.31% instead of 3.51% a week earlier. The bears simply do not want to attack, worrying that a lot of positive things have already been taken into account in the dollar exchange rate. Can the bulls organize a correction? The European Central Bank faces an extremely difficult task. It cannot tighten monetary policy too quickly without solving the fragmentation problem. In addition, the risks of recession in the eurozone are even higher than in the United States. The bulls on EURUSD should keep in mind that at one not very good moment Moscow will simply turn off the gas. The contribution of oil and natural gas prices to the CPI growth in Europe is significantly higher than in the United States. As a result, the ECB should rely even more on factors that it does not control than the Federal Reserve. Dynamics of inflation in European countries
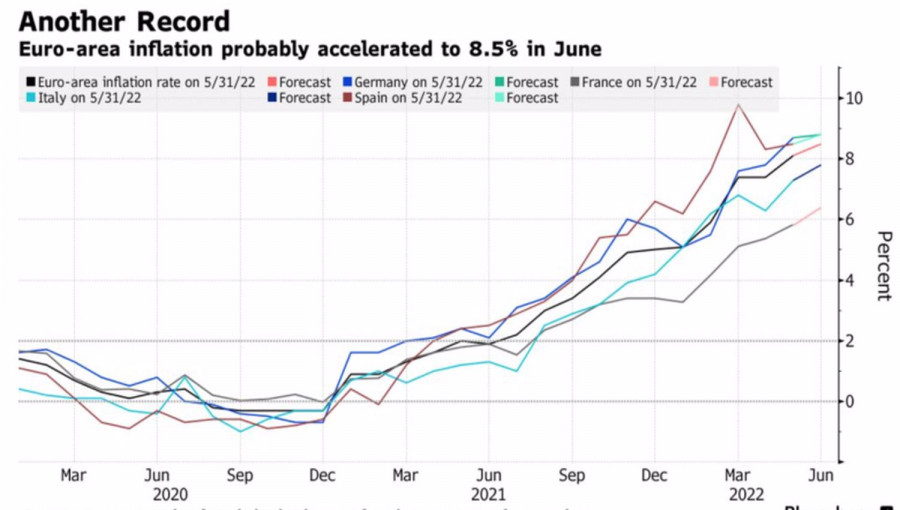
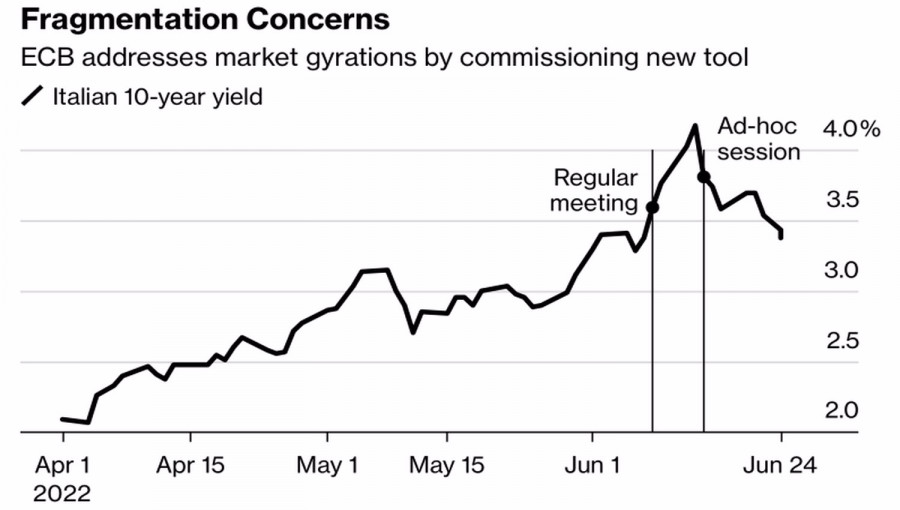
According to Bloomberg experts, consumer prices in the eurozone will reach a new record high of 8.5% in June. The Bank for International Settlements urges the ECB and other central banks not to be shy and raise rates, however, if ECB President Christine Lagarde and her colleagues go too far, a soft landing for the economy of the currency bloc will not be seen as their ears. As a result, investors draw parallels from 2011, when, after rising borrowing costs, the ECB had to reduce them soon. At the same time, there is a lot of talk in Forex about a repeat of the debt crisis of 2011-2012. With its emergency meeting and pledge to create an anti-fragmentation program, the Governing Council defused the situation by pushing Italian bond yields below the psychologically important 4%. However, who said that the sale of European debt will not resume again? Italian bond yield dynamics
Along with the release of data on European consumer prices and the US PCE, investors will be closely watching the meeting of central bankers in Sintra, Portugal. Five years ago, Mario Draghi's high-profile statements about the normalization of the ECB's monetary policy became one of the drivers of the EURUSD rally by 14% for the year. Perhaps Lagarde will be able to shake the financial markets with something? EURUSD, daily chart
EURUSD, hourly chart
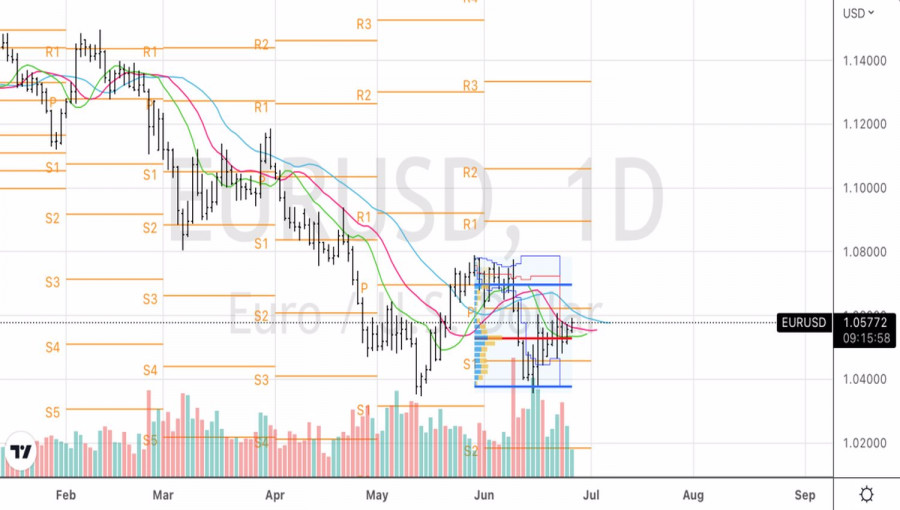
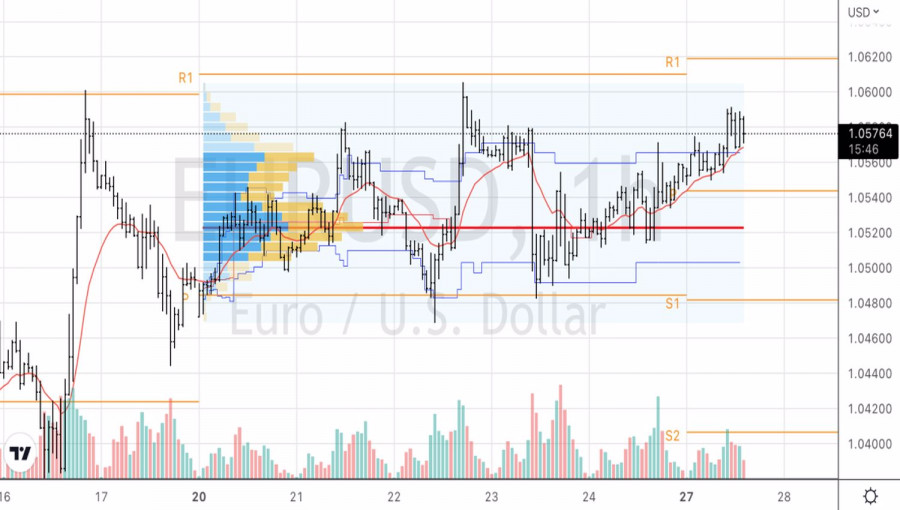
Technically, on the EURUSD daily chart, consolidation is in the range of 1.045-1.06 and does not seem to stop. Only a breakthrough of resistance at 1.06 will help clarify the situation, however, there is a high probability that the bulls will not be able to break through the area above the reference level of 1.0625 and the upper line of fair value at 1.0695. Rebound from them can be used for short positions. On the hourly time frame, the bulls' inability to take the pair outside the range of fair value 1.05-1.057 is a sign of their weakness and a reason to open shorts. The material has been provided by InstaForex Company - www.instaforex.com |
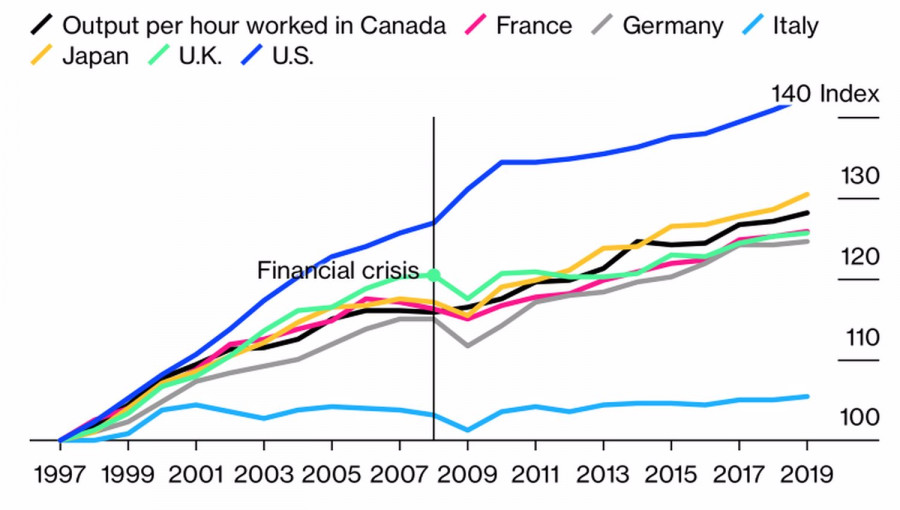
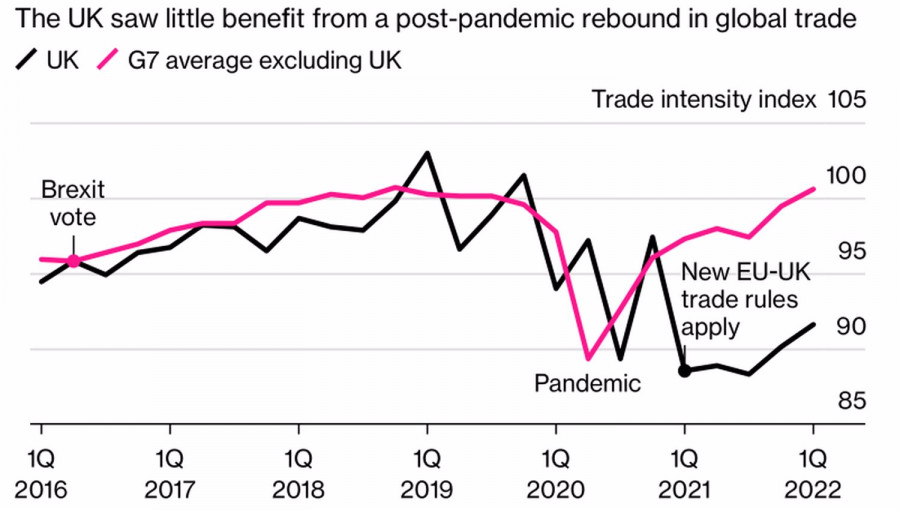
| Posted: 27 Jun 2022 02:42 PM PDT Parallels with the 1970s are heard at every turn. The same high inflation. The same desire of central banks to press it to the nail with the help of aggressive tightening of monetary policy. The same rise in prices in the commodity market. For Britain, this is well known. Almost half a century ago, due to poor performance, it was called the "sick man of Europe." It looks like those times are back, which does not allow the GBPUSD bulls to raise their heads. Great Britain, which has not yet fully recovered from the pandemic and periodically feels the echoes of Brexit in its own skin, is in a deep hole. Inflation is rising faster than in the US and the eurozone, GFK consumer confidence is at its worst since the beginning of accounting about 50 years ago, business activity has collapsed to its lowest level in two years, and retail sales fell by 0.5% m/m in May . It is quite possible that the economy has already plunged into recession and is much more exposed to the risks of stagflation than its main competitors. Blame it on poor productivity and Brexit, which has ruined foreign trade. As Bloomberg's analysis shows, Britain's GDP has not received much preference from the recovery of global trade amid increased economic activity after the pandemic. Productivity dynamics in the world's major economies
British and global trade dynamics
Not surprisingly, as macroeconomic statistics of high inflation and the worst cost-of-living crisis in decades are deteriorating, the population is starting to strike. Railroad workers, lawyers... Who's next? Most likely teachers and doctors. In the week leading up to July 1, the pound does not expect anything good either. According to Bloomberg analysts, the negative current account balance in the first quarter reached almost £40 billion, the highest since the beginning of accounting. The hole that has emerged needs to be covered with something, but with what, if the appeal of British assets is below the baseboard? Since the Brexit referendum, the FTSE 100 has lost about 10% in dollar terms, while the S&P 500 has gained nearly 50%. GBPUSD, daily chart
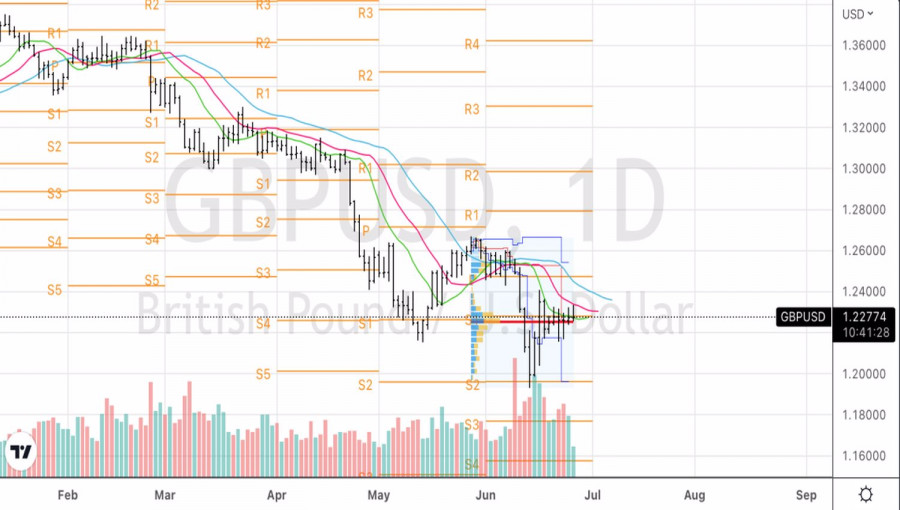
The positions of the pound really look extremely vulnerable, however, there are always two currencies in any pair. The fact that the latest US macro statistics are signaling an approaching recession is leading to a drop in US Treasury yields and weakening the US dollar. As a result, the GBPUSD fell into a consolidation, the way out of which will be determined by the conjuncture of the US securities market. If the S&P 500 continues to rise and debt market rates fall, the pound may strengthen against the US dollar, even though Britain is again beginning to be considered the sick man of Europe. Technically, on the GBPUSD daily chart, consolidation continues in the range of 1.217-1.234 within the Splash and Shelf pattern. A breakthrough of resistance at 1.234 is a reason to open long positions. On the contrary, quotes falling below 1.217 should be used for shorts. The material has been provided by InstaForex Company - www.instaforex.com |
| Technical analysis of EUR/USD for June 27, 2022 Posted: 27 Jun 2022 02:25 PM PDT
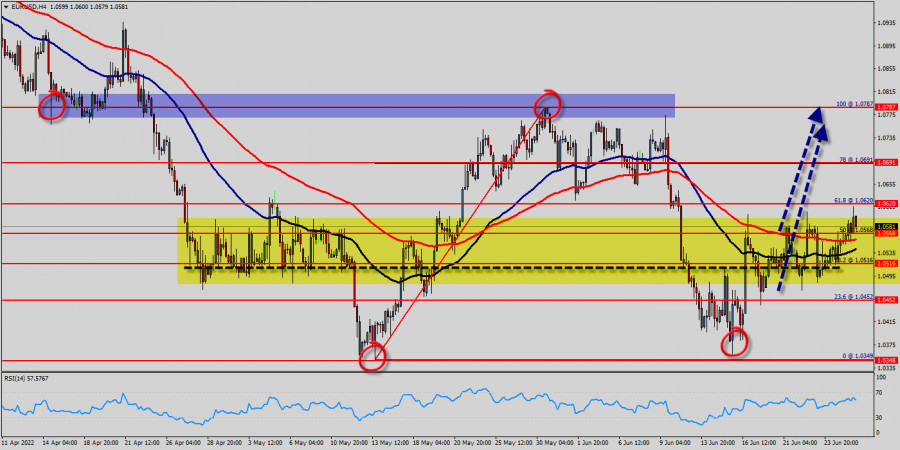
The EUR/USD pair continues to move upwards from the level of 1.0568. Today, the first support level is currently seen at 1.0568, the price is moving in a bullish channel now. Furthermore, the price has been set above the strong support at the level of 1.6613, which coincides with the 50% Fibonacci retracement level. This support has been rejected three times confirming the veracity of an uptrend. According to the previous events, we expect the EUR/USD pair to trade between 1.0568 and 1.0691. So, the support stands at 1.0568, while daily resistance is found at 1.0691. Today, the first support level is seen at 1.0568, the price is moving in a bullish channel now. Furthermore, the price has been set above the strong support at the level of 1.0568, which coincides with the 50% Fibonacci retracement level. This resistance has been rejected several times confirming the veracity of an uptrend. Additionally, the RSI starts signaling an upward trend. Therefore, the market is likely to show signs of a bullish trend around the spot of 1.0568. In other words, buy orders are recommended above the spot of 1.0568 with the first target at the level of 1.0691; and continue towards 1.0787 (double top). However, if the EUR/USD pair fails to break through the resistance level of 1.0691 today, the market will decline further to 1.0454. The material has been provided by InstaForex Company - www.instaforex.com |
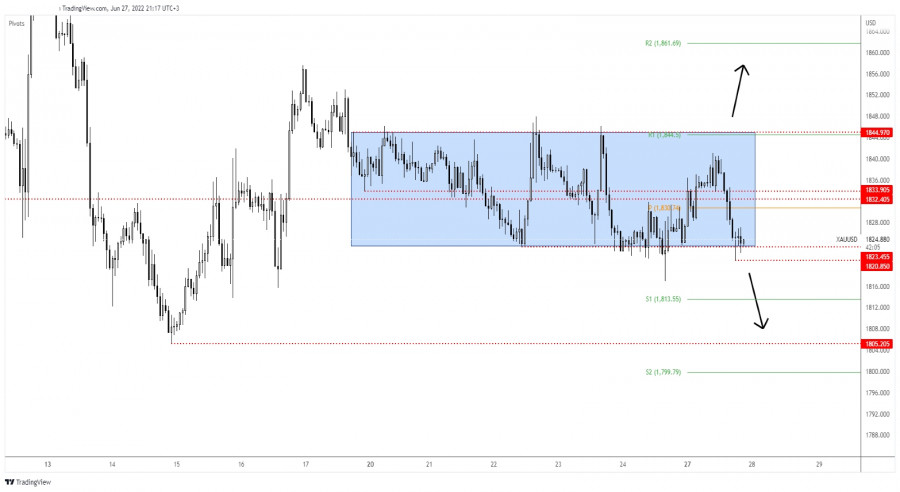
| Gold challenging major support Posted: 27 Jun 2022 12:57 PM PDT The price of gold plunged in the short term after failing to approach and reach the 1,844 key level. It has climbed as much as 1,841 where it has found strong resistance. It was traded at 1,824 at the time of writing. Technically, the rate reached a major support zone, so XAU/USD could try to rebound again. The yellow metal dropped even if the Dollar Index plunged. Probably, XAU/USD will continue to move sideways. Fundamentally, the US data came in better than expected, so Gold is somehow expected to slip lower. Tomorrow, the US is to release the CB Consumer Confidence indicator which is seen as a high-impact event and is expected at 100.0 below 106.4 in the previous reporting period. This could bring high volatility and sharp movements. XAU/USD Undecided!
You already know from my previous analyses that XAU/USD is trapped between 1,823 and 1,844. After failing to stabilize below 1,823 in the last attempt, Gold signaled a potential rebound. Still, its failure to approach and retest the 1,844 key resistance signalings exhausted buyers and a potential sell-off. Now, it challenges 1,823 again, so it remains to see how it will react after its current drop. XAU/USD Outlook!After its strong drop, we cannot exclude a new bullish momentum from around the 1,823 static support. 1,820 today's low represents critical static support. Dropping and closing below this obstacle could activate further drop and could bring fresh selling opportunities with a first downside target at the 1,816 former low. The material has been provided by InstaForex Company - www.instaforex.com |
| June 27, 2022 : EUR/USD daily technical review and trading opportunities. Posted: 27 Jun 2022 11:16 AM PDT
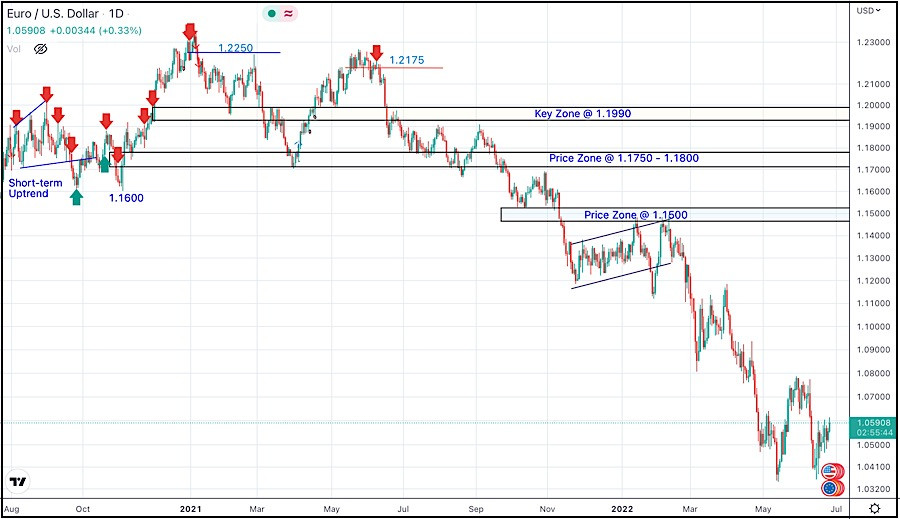
In late September, Re-closure below the price level of 1.1700 has initiated downside-movement towards 1.1500 where some recovery was witnessed. Shortly after, Price levels around 1.1700 managed to hold prices for a short period of time before another price decline took place towards 1.1200. Then the EURUSD has temporarily moved-up within the depicted movement channel until downside breakout occurred recently. Since then, the price zone around 1.1500 has applied significant SELLING pressure when a valid SELL Entry was offered upon the previous ascending movement towards it. Shortly after, the EURUSD looked oversold while approaching the price levels of 1.0800 few weeks ago. That's where the recent upside movement was previously initiated. However, the recent movement towards 1.1200 was considered for another SELL Trade which already reached its targets Any ascending movement towards 1.0800 should be watched for selling pressure and a possible SELL entry. The material has been provided by InstaForex Company - www.instaforex.com |
| June 27, 2022 : EUR/USD Intraday technical analysis and trading plan. Posted: 27 Jun 2022 11:14 AM PDT
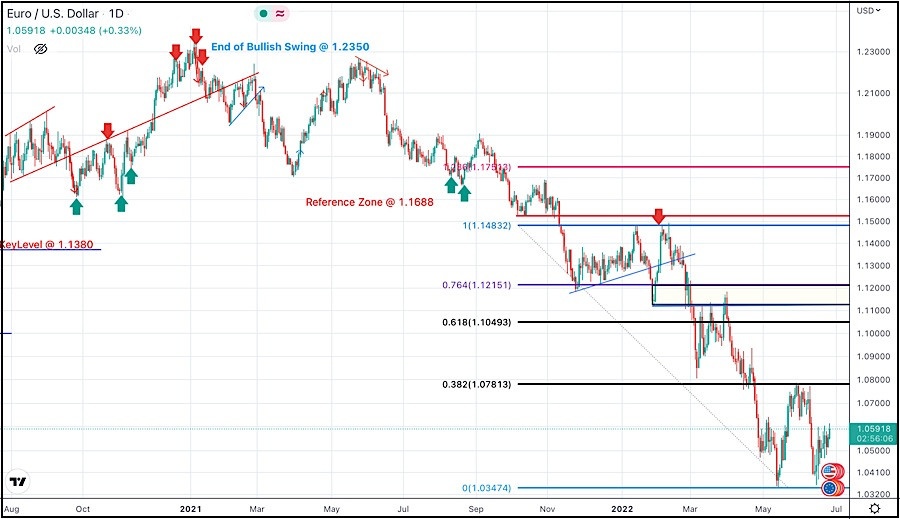
The EURUSD looked oversold while approaching the price levels of 1.0800. That's when a temporary upside movement was approaching the price levels around 1.1200. This recent movement towards 1.1200 was suggested for another SELL opportunity which already reached its targets beyond the price level of 1.0400. The previous ascending movement above 1.0600 enabled further advancement towards 1.0800 where evident bearish rejection arises again. Currently, the EURUSD pair remains trapped between 1.0350 (the newly recorded Low) and 1.0750 which corresponds to the nearest existing SUPPLY level. On the other hand, the pair remains trapped under selling pressure to challenge the recent daily low around 1.0350 until breakout occurs. The material has been provided by InstaForex Company - www.instaforex.com |
| June 27, 2022 : GBP/USD Intraday technical analysis and significant key-levels. Posted: 27 Jun 2022 11:12 AM PDT
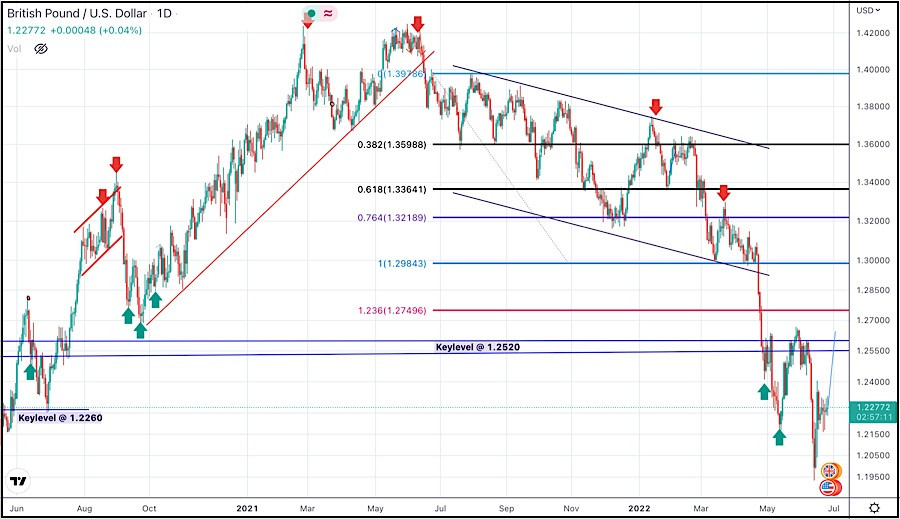
Recently, the GBP/USD pair remained under bearish pressure to challenge the new low around 1.2150 again which was temporarily bypassed few days go. Immediate bullish rejection was expressed around 1.1950 bringing the pair back above 1.2150 again towards higher price levels. Bullish persistence above 1.2300 will probably enable further bullish continuation towards 1.2550 and probably 1.2650 where further decisions can be taken. On the other hand, another bearish visit may be expected to challenge the price level of 1.1950 again if sufficient bearish momentum is expressed. The material has been provided by InstaForex Company - www.instaforex.com |
| European stock market soars at beginning of week Posted: 27 Jun 2022 10:24 AM PDT In Monday's trading the key Western European stock indices were rising steadily. By midday they had reached a two-week high, following the US and Asian stock markets. Investors around the world eased fears that decisive moves by major central banks could trigger a recession in the global economy. The STOXX Europe 600 composite index of Europe's leading companies rose by 0.65% to 415.63 points. Last Friday the index posted its best result in more than three months. The British FTSE 100 soared by 0.86% to settle at 7268.5 points. The French CAC 40 also rose by 0.86% to 6125.7 points. The German DAX jumped by 1.46% to 13305.86 points.
Risers and fallers Mining stocks posted the biggest gains on Monday. BHP climbed by 3.5%, Anglo American gained 3.1%, Antofagasta rose by 2.7%, Rio Tinto added 3.2% and Glencore jumped by 3.3%. The rally of the French automotive sector was also impressive, with Renault up by 2.4% and Michelin up by 1.1%. Shares in Dutch multinational conglomerate Prosus soared by 13% as the South African parent company reneged on a promise not to sell its shares to China's Tencent. It is expected that the earnings from the securities will be used to support a major share buyback program. Italian bank Intesa Sanpaolo SpA gained 2.6% on news that the company is launching a €3.4bn buyback program. The market capitalisation of British consultancy Aquila Services Group Plc increased by 1.9%. The company posted a pre-tax profit of $881,200 for the fiscal year ended March, compared with $276,000 a year earlier. Meanwhile, Italian insurer Assicurazioni Generali (-2.8%) and gas company Italgas (-2.3%) were among the lowest performing securities traded on European exchanges. Market conditions The major upside factor for the European stock market today was investors' anticipation of additional economic growth in China. The day before, coronavirus restrictions were lifted as Shanghai authorities reported no cases of COVID-19 infection for the first time in two months. The news of a sharp increase in the value of energy companies' stocks proved to be another major reason for the rise in European stock exchanges. Eni, TotalEnergies, Shell and BP were up by 0.38%, 1.48%, 1.77% and 1.4% respectively. Investors' attention is now focused on the European Central Bank's annual forum in Sintra, Portugal. As part of the three-day event, representatives of the European regulator are scheduled to speak on how to tackle record levels of inflation. Trading results European stock indices performed spectacularly on Friday amid investors' expectations of weaker inflation, including due to falling commodity prices. Meanwhile, on Wednesday and Thursday, stock markets in Europe tumbled noticeably on market worries about a global economic recession due to hawkish monetary policies by the world's major central banks. As a result, the composite index of Europe's leading companies STOXX Europe 600 soared by 2.6% to 412.90 points. During the past week, the index gained 2.4% and closed the week on the positive side for the first time in a month. Stocks of advertising company Adevinta ASA (+10%), pharmaceuticals company Recordati SPA (+7.6%) and cruise operator Carnival (+8.7%) were the top performers in the STOXX Europe 600 index. The British FTSE 100 gained 2.7%. The French CAC 40 added 3.2%, while the German DAX rose by 1.6%. The stock price of Spanish technology giant Indra Sistemas SA plummeted by 15%. Previously, the company's management announced the resignation of CFO Javier Lazaro. Borja Garcia-Alarcon Altamirano will become the new CFO. The market capitalisation of Europe's largest tour operator, TUI AG, sank by 3.9%. The previous day the company's management announced the resignation of TUI AG CEO Friedrich Joussen at the beginning of autumn. CFO Sebastian Ebel will become the company's new CEO. German online retailer Zalando SE dropped 1.6% on weaker-than-expected second quarter results. In addition, the management of Zalando revised down its annual forecast and expects the company's revenue in 2022 to grow by only 3%, rather than the 12-19% previously expected. However, domestic statistics from Eurozone member states proved to be an important upward factor for the European indicators on Friday. Thus, on Friday morning it became known that in June the German business confidence index (indicator of business climate) for the economy of Germany fell to 92,3 points from 93 points in May. Analysts had forecast an average drop to 92.9. UK retail sales fell 0.5% in May month-on-month, reversing a rise in April. The print beat the market estimate of a 0.7% decline. The material has been provided by InstaForex Company - www.instaforex.com |
| Posted: 27 Jun 2022 10:09 AM PDT
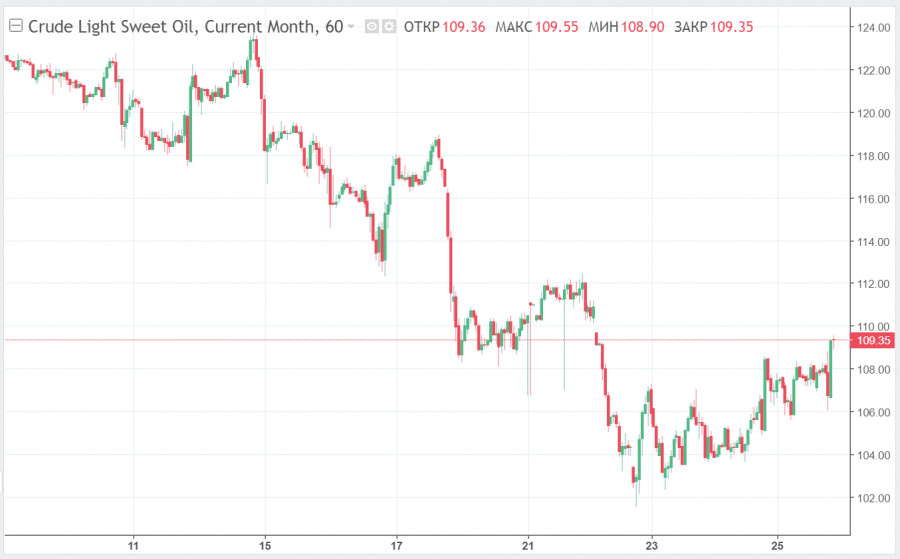
On Monday, oil continued to rise due to investors' expectations of new sanctions against Russia. Brent crude oil futures for August at London's ICE Futures Exchange advanced by 1.47% to $110.70 a barrel. By that time, WTI crude oil futures for August on the NYMEX electronic session had gained 1.63% to $109.35. Moreover, Brent crude oil jumped by 2.8%, while WTI crude oil surged by 3.2% last Friday. Oil quotes may stop recovering due to the G7 leaders' plans to revive the nuclear deal with Iran. This move helps to find alternatives to Russian oil amid US slow economic growth. A French government spokesman said the EU's foreign policy chief had met with the top Tehran officials to resume nuclear talks. Moreover, the G7 has not yet reached an agreement on reducing Russia's revenues from oil exports. Nevertheless, US National Security Advisor Jake Sullivan said to the media that the discussions on this issue were held in the US government. Sullivan assured the public that the initiative did not encounter any resistance and its implementation required only technical aspects. Notably, in early June it was reported that the US was strongly advocating for compulsory reduction in prices of Russian energy resources coming to global markets. This ambitious idea may become an alternative to the earlier actively discussed EU ban on Russian oil imports. It is obvious that it is impossible to remove one of the largest world's oil producers from the market without causing a global energy crisis. Therefore, high oil prices are even beneficial for Russia as producing and selling less oil the country generates quite comparable profits with that of previous times. The anti-Russian sanctions have produced negative outcomes for EU and the US residents so far. They have had to deal with record fuel prices, rapid price growth, and local authorities' calls for economy. It is difficult to imagine that any country can limit other country's profits from oil exports. There are few examples of implementing such measures in the world's history. Therefore, the EU will have to introduce its own measures. For instance, the EU could impose an import duty on Russian energy supplies. Thus, the country can allow the supply of oil and oil products from Russia, but impose a special duty of $30 per barrel. Earlier, Poland had already proposed that the EU should impose the common size of duties on Russian oil and gas at the level of 25-35% of the market value. According to a poll of economists from Germany's Ifo Institute for Economic Research, this measure is considered the most effective alternative to embargo or reduction of imports. Experts believe that this move will force Russia to cut energy exports prices and thus reduce its revenues. It is clear that this scenario will be possible in case Russia agrees to such conditions. The outcome will depend on Russia's desire to negotiate. Moreover, it will be determined by the redirection of oil exports to Eastern countries, including the balance of supply and demand on the global market. At the summit in Germany, G7 leaders will discuss the US proposal to reduce Russia's revenues from its energy exports. However, many EU countries, including the German government, considered this ambitious plan without much enthusiasm. Some European leaders doubted that it could be properly implemented. The talks between US President Joe Biden and Chinese President Xi Jinping are due to take place within the next few weeks. The day before, it was reported that the French authorities supported the US idea to introduce a cap on oil prices. However, unlike the US, they do not favor the introduction of measures by the buyers themselves unilaterally, but for its coordination with the exporters.Amid discussions of special measures for Russian energy resources, Ecuador's Energy Ministry reported that oil production in the country could be halted in two days due to the protests. Currently, oil production in Ecuador is at a critical level, declining by over 50%. It is almost impossible to transport the necessary materials and diesel fuel to maintain the oil production at the required level due to vandalism, seizure of oil wells and road closures. |
| Bitcoin settles at 21,708, new sell-off in play Posted: 27 Jun 2022 09:50 AM PDT The price of Bitcoin plunged in the short term and it seems very heavy after failing to confirm a larger rebound. It was traded at 20,722 at the time of writing. BTC/USD dropped by 5.91% from 21,868 yesterday's high to 20,575 today's low. Technically, the crypto could move sideways in the coming period, but you should keep in mind that the bias remains bearish. In the last 24 hours, BTC/USD is down by 3.0% but it's still up by 0.98% in the last 7 days. BTC/USD Bears In Control!
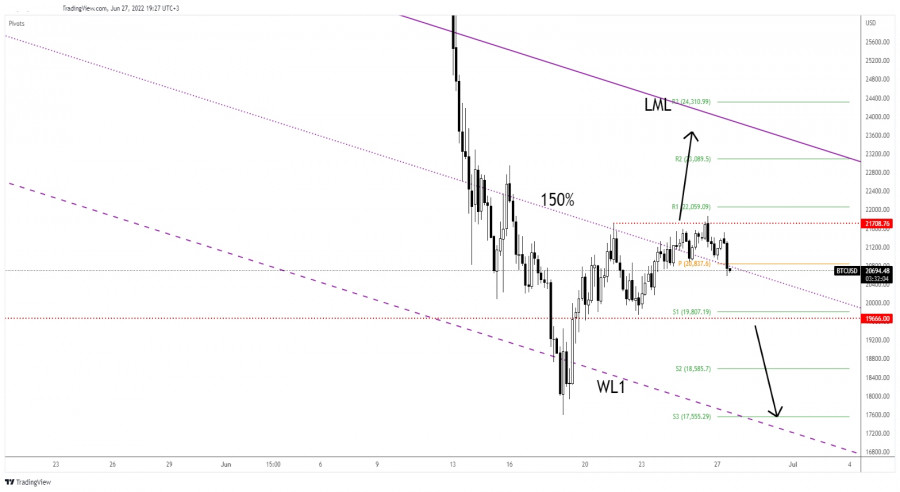
BTC/USD challenges the 150% Fibonacci line and the weekly pivot point of 20,837. These are seen as downside obstacles. As you can see on the H4 chart, the rate found resistance at 21,708 again. It has registered only a fasle breakout through this upside obstacle signaling that the upside movement is over. It's trapped between 21,708 and 19,666 levels. In the short term, it could come back down to test and retest the immediate downside obstacles. BTC/USD Outlook!Stabilizing below the pivot point (20,837) and under the 150% Fibonacci line may activate a deeper drop towards the S1 (19,807) and down to the 19,666 key level. As you already know from my analyses, only a valid breakout above the 21,708 could activate an upside continuation. The material has been provided by InstaForex Company - www.instaforex.com |
| Posted: 27 Jun 2022 09:24 AM PDT
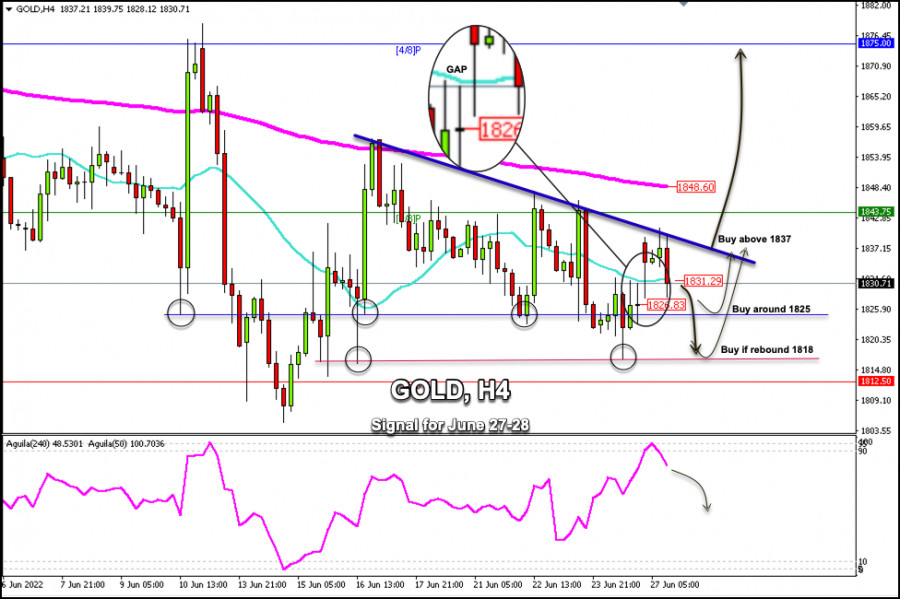
XAU/USD continued to struggle to break out of the bearish channel formed on June 16. In the European session, the price reached the top of the downtrend channel at around 1,840. Below this level, gold is under strong downward pressure. The metal is currently trading at 1,831 around the 21 SMA with a bearish bias. At the opening of the negotiations on June 27, gold left a GAP at 1,826. This has not been covered. Gold is likely to extend its fall in the next few hours and could close this gap. It could even reach the support of 1,818. The recent sharp drop in commodity and energy prices appears to have allayed fears about the risk of a further rise in inflationary pressure. It is a factor that weighs on gold that is considered a safe haven. According to the 4-hour chart, gold has weekly support of 1,825 and monthly support of 1,818. Both levels are expected to give gold a technical rebound and it could once again reach the 1,837 area. One last support has turned into a strong bottom for gold at around 2/8 Murray (1,812). Should gold remain under strong downward pressure, this level could be an opportunity to buy and above this level and gold is expected to resume its bullish cycle again. Gold could turn more bullish if it breaks the downtrend channel at around 1,837 and consolidates above the 200 EMA located at 1,848. If this scenario comes true, gold could reach 4/8 Murray at 1,875 and could even reach the psychological level of 1,900. Our trading plan for the next few hours is to buy gold at around 1,825 or around 1,818. This zone will give us an opportunity to buy gold in the hope that it will be able to make a technical bounce. Below 1,815, gold could resume its downtrend. The eagle indicator is giving overbought signals and it is likely that in the next few hours gold will continue its downward trend and may consolidate at around 1,825-1,818. The material has been provided by InstaForex Company - www.instaforex.com |
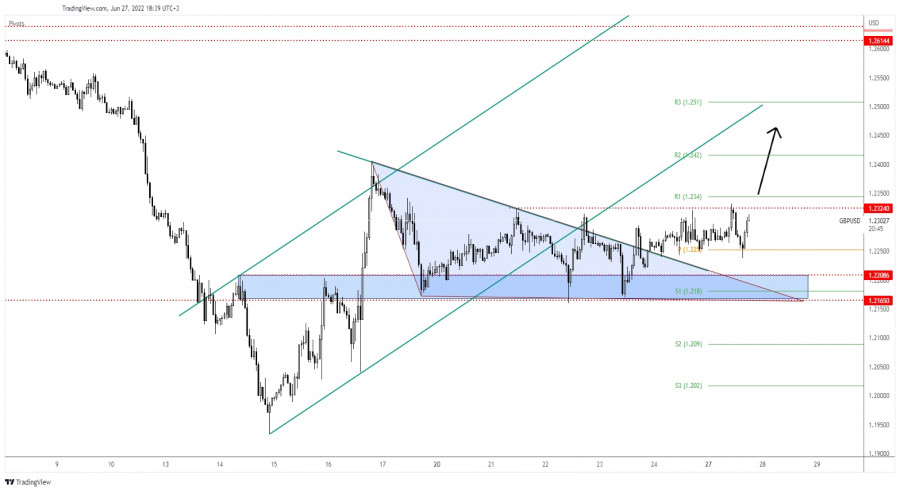
| GBP/USD: downside invalidated, further growth in cards Posted: 27 Jun 2022 09:24 AM PDT The GBP/USD pair is extending its sideways movement. I'll wait for the rate to escape this pattern before going long or short. The price dropped a little after reaching the 1.2331 level but the retreat ended as the Dollar Index's drop weakened the USD. Fundamentally, the USD remains sluggish in the short term after the Flash Services PMI and the Flash Manufacturing PMI reported worse than expected data on Thursday signaling a slowdown in expansion in both sectors. On Friday, the US and UK data came in mixed. Today, the US Durable Goods Orders, Core Durable Goods Orders, and Pending Home Sales reported a 0.7% growth each, beating expectations but the USD is still in a corrective phase in the short term versus its rivals. GBP/USD Range Pattern!
GBP/USD is trapped between 1.2324 and 1.2165. The 1.2208 - 1.2165 support area held so the rate came back higher towards the 1.2324 static upside obstacle. The price escaped from the triangle pattern signaling strong upside pressure. After escaping from the up-channel pattern, the GBP/USD pair signaled a potential strong drop. Still, its failure to make a new lower low invalidated a larger sell-off. In the short term, it could continue to move sideways as the Dollar Index moves sideways as well. GBP/USD Outlook!The weekly R1 (1.2340) is seen as a crucial upside obstacle. A valid breakout above this level activates an upside continuation. This scenario could bring new long opportunities with a potential upside target at the uptrend line. The material has been provided by InstaForex Company - www.instaforex.com |
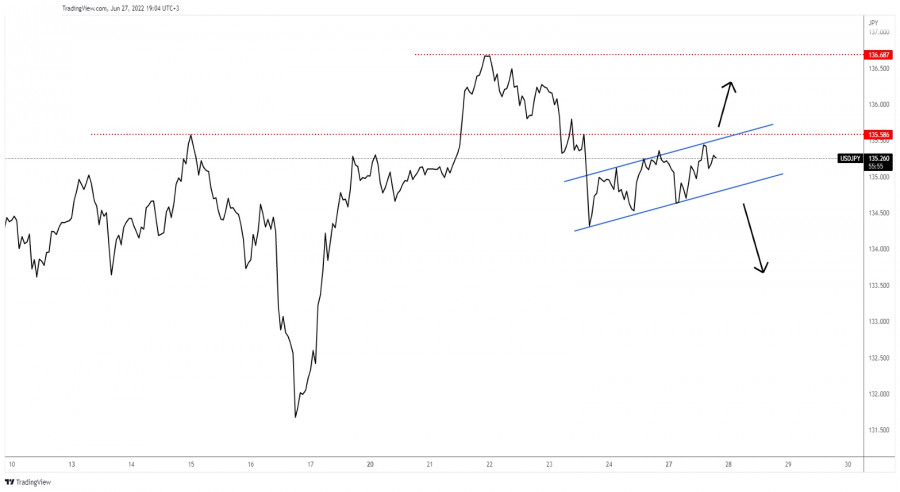
| USD/JPY: upside continuation or larger drop? Posted: 27 Jun 2022 09:23 AM PDT
USD/JPY Up Channel!The USD/JPY pair increased in the short term after ending its strong drop. Now, it is trading at 135.24 at the time of writing. The price action developed an up-channel pattern, a flag formation that could bring a downside continuation. As you already know from my analyses, 135.58 represented an upside obstacle in the past. So, this level and the channel's upside line are seen as upside obstacles. On the other hand, the channel's downside line represents a downside obstacle. I'll wait for the rate to escape from this pattern before buying or selling. USD/JPY Trading Conclusion!Jumping and stabilizing above the 135.58 and above the channel's upside line activates a potential growth towards the 136.68 higher high. Staying below the upside obstacles and dropping below the minor uptrend line (channel's downside line) validates more declines. The material has been provided by InstaForex Company - www.instaforex.com |
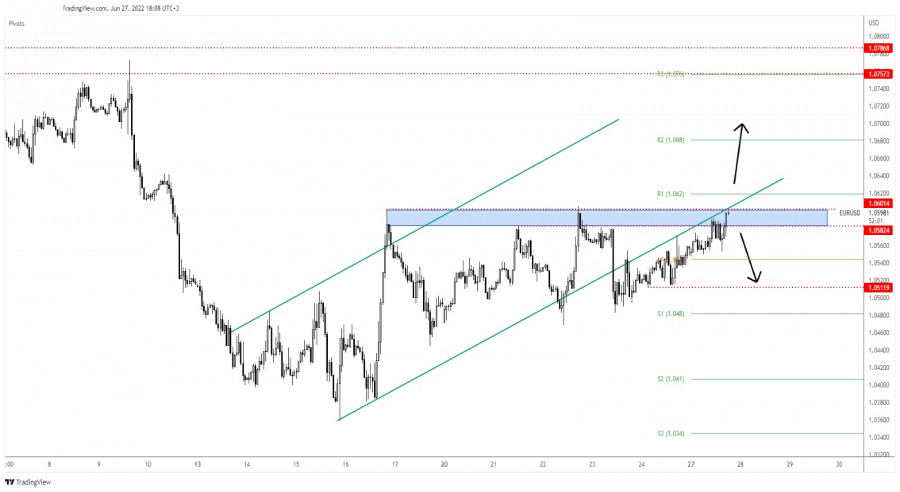
| EUR/USD: attention at resistance Posted: 27 Jun 2022 08:38 AM PDT The EUR/USD pair rallied at the time of writing as the Dollar Index dropped again. DXY's further drop towards 103.41 former low should force the USD to depreciate versus its rivals. The index signaled that the upside is limited, so a deeper drop is in the cards. Surprisingly or not, the USD depreciates even if the US data came in better than expected earlier today. The Pending Home Sales rose by 0.7% versus a 3.5% drop expected, Durable Goods Orders surged by 0.7% compared to the 0.1% growth estimated, while the Core Durable Goods Orders registered a 0.7% growth exceeding the 0.4% growth forecasted. Maybe the greenback drops as the US CB Consumer Confidence is expected to drop from 106.4 points to 100.0 points. EUR/USD Breakout Attempt!
As you can see on the H1 chart, the rate continued to increase along the broken uptrend line. Now, it challenges this dynamic resistance as well. The price pressures the 1.0601 static resistance, so it remains to see how it will react around these strong resistance levels. Taking out the resistance levels may signal an upside continuation. On the other hand, registering only false breakouts indicates that the leg higher ended and that the EUR/USD pair could turn to the downside. EUR/USD Outlook!Jumping, closing, and stabilizing above the weekly R1 (1.0620) could activate further growth and could bring a new buying opportunity with a major upside target at 1.0757. The material has been provided by InstaForex Company - www.instaforex.com |
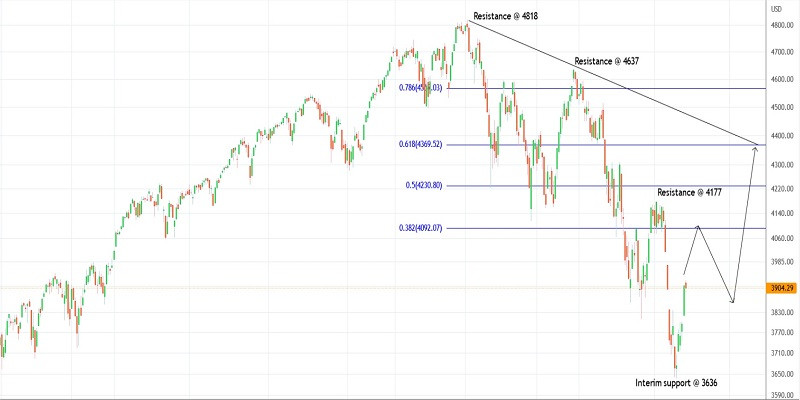
| Trading plan for SPX500 on June 27, 2022 Posted: 27 Jun 2022 08:21 AM PDT
Technical outlook:SPX500 rallied through the 3,927 highs in the early hours of the New York trade on Monday before finding resistance and pulling over. The index dropped through the 3,636 lows on June 17, 2020, before bulls were back in control. The index is seen to be trading close to the 3,900-10 levels at this point in writing and is expected to push through 4,092 and up to 4,369 in the next several trading sessions. SPX500 has been dropping since January 04, 2022, after printing all-time highs at 4,818. The index might have found interim support at around the 3,636 mark and is now pulling back. If the above structure holds well, the potential remains for a rally towards 4,090 at least, which is the Fibonacci 0.382 retracement of the entire drop. SPX500 has potentially carved a lower degree upswing between 3,636 and 3,927 in the past few trading sessions. The index might continue higher from current levels or might produce a corrective drop towards 3,780 before resuming higher again. Either way, traders might be inclined to hold long positions against 3,600. Trading plan:Potential rally through 4,090 and up to 4,370 against 3,600 Good luck! The material has been provided by InstaForex Company - www.instaforex.com |
| Posted: 27 Jun 2022 08:02 AM PDT
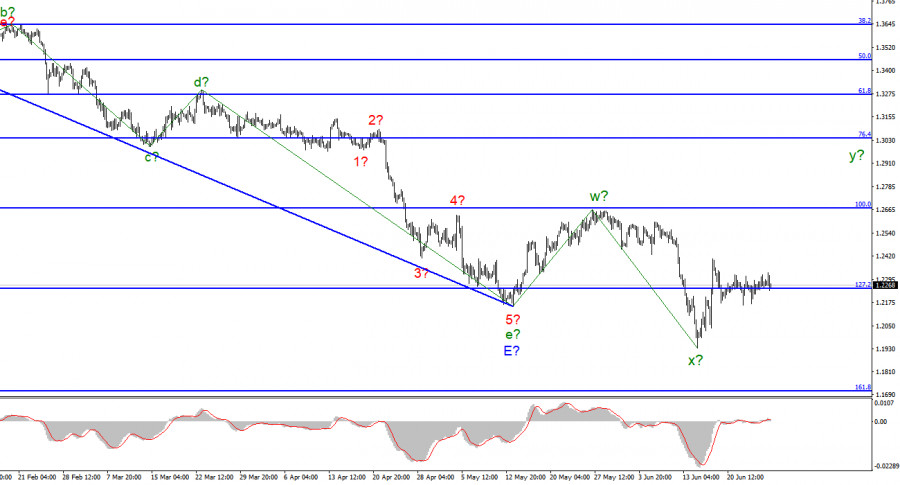
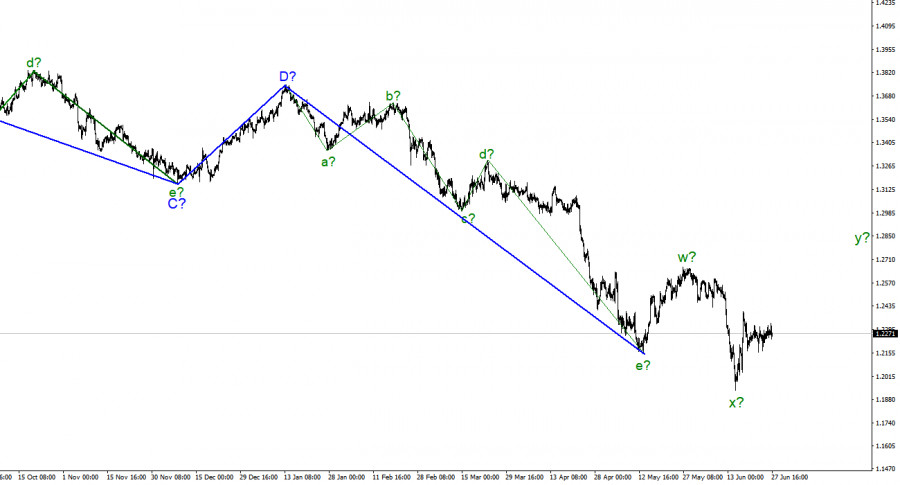
According to the pound/dollar instrument, the wave marking now requires additions and adjustments, but it may still take a more or less digestible form. At the moment, the last downward wave has gone beyond the low of the expected downward trend segment, which I consider completed. Thus, the classical correction structure a-b-c will no longer work. Nevertheless, wave analysis allows for the construction of various correction structures, so a more complex three-wave formation w-x-y can be constructed. Anyway, the pound and the euro continue to show a very high degree of correlation, and both instruments should build approximately the same trend areas. Ascending. At the same time, according to the euro currency, it can be a classic a-b-c, and according to the pound, a rarer w-x-y. But in both cases, the instruments should now build an ascending wave, which should go beyond the peak of the previous ascending one. The wave marking on the British now looks not quite unambiguous, but still has the right to life. The fact that a stronger appreciation of the US currency did not begin after the Fed meeting is encouraging and gives chances for building the necessary upward wave. American statistics unexpectedly supported the dollar. The exchange rate of the pound/dollar instrument increased by 10 basis points on June 27. Market activity on Monday was again very low, but still not as low as in European terms. There was no news in the UK today, but just an hour ago a report on orders for durable goods in the United States was released. I didn't expect this report to have a strong impact on market sentiment, and it didn't. However, I cannot but note that the market did not stay away from this report either. It should start with the fact that the indicator of orders for durable goods has three components. The overall indicator, the indicator excluding transport orders, and the indicator excluding defense orders. For all three, values were expected to be slightly above zero, and in the case of the baseline, a slight reduction in volumes. However, real data showed that not everything is as bad as the market expected. The base indicator grew by 0.7% in May, the indicator excluding transport – by 0.7%, and excluding defense orders – by 0.6%. The market responded to these data by increasing demand for the US currency, but still, the report was not so important that the American grew significantly. It managed to grow in price by only 30-40 basis points. This change did not affect the wave marking in any way, as it is insignificant. All three central bank presidents (Lagarde, Bailey, and Powell) will speak on Wednesday. I think that their speeches can finally bring the market out of the stupor in which it has been for more than a week. Wave marking is such a thing that does not assume any time frame, so the current ascending wave can be built as much as you want in time. However, when the tool is in one place, it makes working with it much more inconvenient. And we are all interested in working for profit, and not watching how the tool moves horizontally. Therefore, I hope that the events of this week will be able to move both instruments off the ground. General conclusions. The wave pattern of the pound/dollar instrument has become clearer. I still expect the construction of an upward wave within the corrective upward structure. If the current wave marking is correct, then the instrument will continue to increase with targets located above the calculated mark of 1.2671, which corresponds to 100.0% Fibonacci. I recommend buying each MACD signal "up".
On an older scale, the entire downward trend section looks fully equipped but may take on a more extended form. If the current correctional structure still takes an even more non-standard form, then adjustments will have to be made. The material has been provided by InstaForex Company - www.instaforex.com |
| EUR/USD analysis on June 27. We are waiting for a new increase in inflation in the eurozon Posted: 27 Jun 2022 08:02 AM PDT
The wave marking of the 4-hour chart for the euro/dollar instrument continues to look convincing and does not require adjustments. In addition, the markup has not changed in recent weeks, as the market is completely calm. The instrument has completed the construction of a downward trend segment. If the current wave marking is correct, then the construction of a new upward trend section has begun at this time. It can turn out to be three-wave, or it can be pulsed. At the moment, two waves of a new section of the trend are visible. Wave A is completed, and wave b is also presumably completed. If this is indeed the case, then the construction of an ascending wave c has now begun. The instrument has not decreased under the low of the descending trend section, so the wave marking still retains its integrity. However, I note that the downward section of the trend may complicate its internal wave structure and take a much more extended form. Unfortunately, a very promising wave markup may be broken due to the news background. But at the moment, the chances of building an upward wave c remain. Only the news background can interfere. Lagarde's speeches and European inflation The euro/dollar instrument rose by 25 basis points on Monday. Market activity remains very low, which it was on Friday, although there were a couple of reports on Friday and today too. Nevertheless, after several relatively active days, the market took a pause, which lasted for the second day. Of course, in such conditions, the wave pattern is even less likely to complicate or change. I am still waiting for the euro quotes to rise, but I feel that it can be a long wait. This week, the most interesting will be the report on inflation in the European Union. Let me remind you that for all central banks, the issue of reducing inflation is now the most important. Thus, every new report that indicates its growth is a stone in the garden of the central bank. And in the case of the European Central Bank, there are already a lot of stones in the garden. The market expects that inflation in the EU will rise to 8.4%. It seems that the growth rate of this indicator is slowing down a bit, but I think it's just a coincidence. The ECB has never raised the rate yet and will only completely abandon the quantitative stimulus program in July. Thus, inflation has no reason to decrease. Nevertheless, next month the ECB may still go to an unprecedented event for itself and raise the rate for the first time in many years. If this happens, the demand for the European currency may grow slightly, since before that the market was forced to look at the instrument through the prism of tightening monetary policy only by the Fed. If the ECB at least starts the process of tightening the PEPP, it can give an impetus to growth. However, I will also remind you that the Fed may raise the rate next month, and by 75 basis points at once. Therefore, the euro currency needs to take advantage of the moment and increase as much as possible before this happens. General conclusions Based on the analysis, I conclude that the construction of the downward trend section is completed. If so, then now you can buy a tool with targets located near the estimated mark of 1.0947, which equates to 161.8% Fibonacci, for each MACD signal "up". Wave b is presumably completed. An unsuccessful attempt to break through the level of 261.8% indicates that the market is not ready for new sales of the instrument.
On a larger scale, it can be seen that the construction of the proposed wave E has been completed. Thus, the entire downward trend has acquired a complete look. If this is indeed the case, then in the future for several months the instrument will rise with targets located near the peak of wave D, that is, to the 15th figure. The material has been provided by InstaForex Company - www.instaforex.com |
| EUR/USD analysis on June 27, 2022. New week brings same problems Posted: 27 Jun 2022 07:02 AM PDT
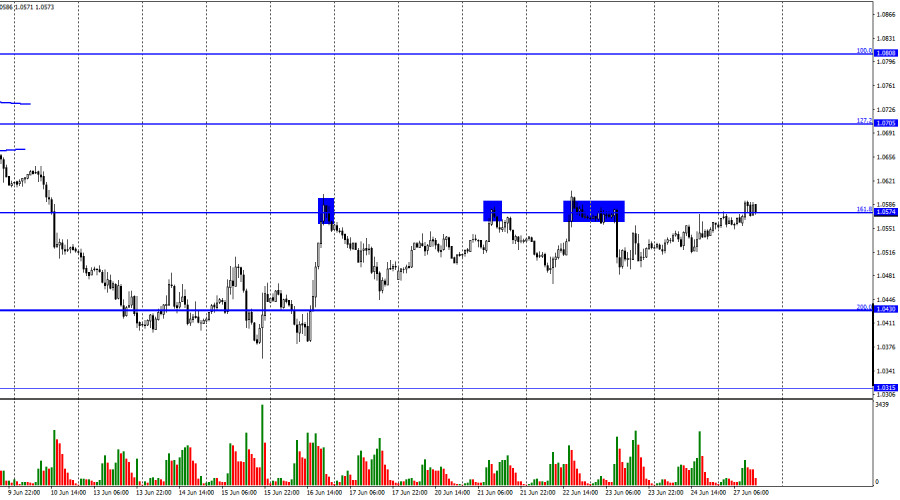
On Friday, EUR/USD returned to the 161.8% Fibonacci retracement level located at 1.0574. This time, the price failed to rebound from this level but it also failed to close above it. On Monday, the euro/dollar pair closed the session just above this mark although I don't think that 15 pips are enough to say that there was a firm close above the level. Therefore, the price may still rebound from the level of 1.0574 and move downwards to the 200.0% Fibonacci retracement level at 1.0430. However, the pair may again fail to reach it. A new week brought the same problems, and the start of the weekly session looks very sluggish. The information background is almost empty although markets are waiting for some important reports in the middle and at the end of the week. In the meantime, let's try to figure out whether the euro has any upside potential in the coming days. Most traders and analysts are fully focused on what the Fed and the ECB are going to do. The current situation is unfavorable for the euro. The US Federal Reserve raised the rate at its last meeting by 0.75%. The regulator is likely to do the same at its next meeting in July. Therefore, the hawkish stance of the Fed officials is obvious. The US dollar gains support from such a policy and limits the upside potential of the euro. At the same time, the ECB is expected to raise the rate for the first time next month. I think that this will be an increase of no more than 0.25%. If this scenario is true, then the chance that the euro will strengthen next month is very slim. The European currency may show slight growth ahead of the ECB meeting. So, it is still possible that the pair may rise but this movement is likely to be very moderate. If the quote closes firmly above the level of 1.0574, the pair may then head for the 1.0705 target.
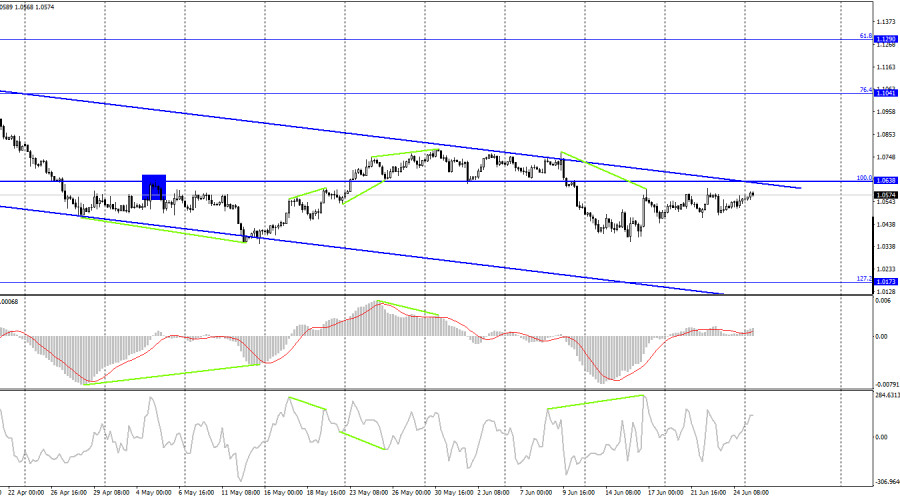
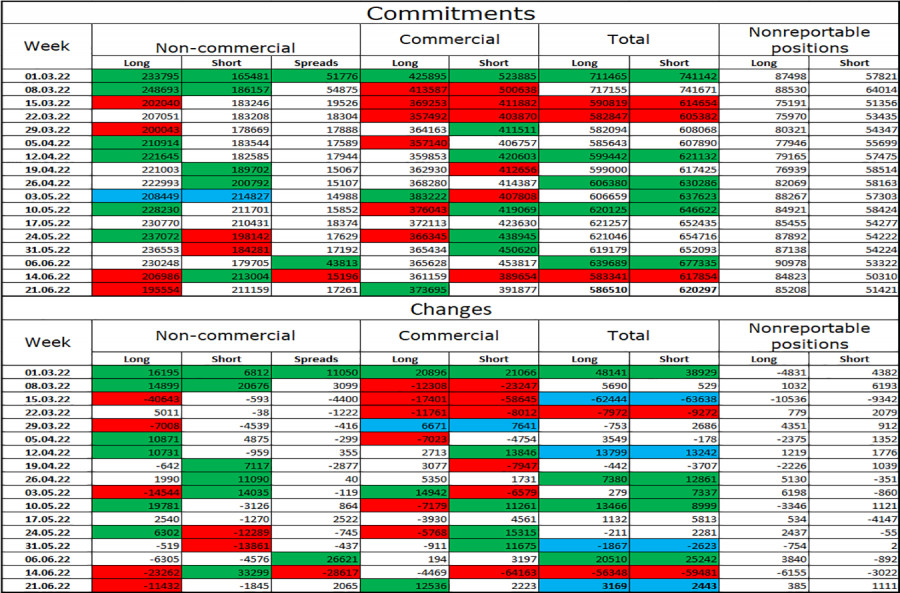
On the 4-hour time frame, the euro/dollar pair resumed its movement towards the upper line of the descending trend channel, which characterizes the market sentiment as bearish. I call this trajectory "a movement" rather than "growth" since it is too weak to be called otherwise. Consolidation of the price above the trend channel will significantly increase the chances for growth to the 76.4% fibo level located at 1.1041. Commitments of Traders (COT):
Last week, traders closed 11,432 Long contracts and 1,845 Short contracts. This indicates that the bearish sentiment has intensified. The total number of opened Long contracts stands at 195,000, while the number of Short contracts is 211,000. Although the difference is minor, it still shows that bulls are losing ground. In recent months, the non-commercial category of traders was mostly bullish on the pair, which did not support the euro in any way. The possibility of a rise in the euro was getting higher in recent weeks. However, the latest COT reports showed that the European currency may soon face a new sell-off. There is nothing that the Fed or the ECB can do to support the euro. Economic calendar for US and EU: US – Durable goods orders (12-30 UTC).US – Pending home sales (14-00 UTC).EU – ECB President Christine Lagarde speaks (18-30 UTC). On June 27, there are several important events both in Europe and the US. I think that the statement by Christine Lagarde will draw the most attention. Today, the influence of the information background will be weak. EUR/USD forecast and trading tips: I would recommend selling the pair on H1 after a rebound from the level of 161.8% - 1.0574 with the next target at 1.0430. It is possible to earn around 60-70 pips on such rebounds every day. You can consider buying the euro when the price settles firmly above the trend channel on H4 with the target at 1.1041. The material has been provided by InstaForex Company - www.instaforex.com |
| No real progress for Cardano the last two months. Posted: 27 Jun 2022 06:54 AM PDT
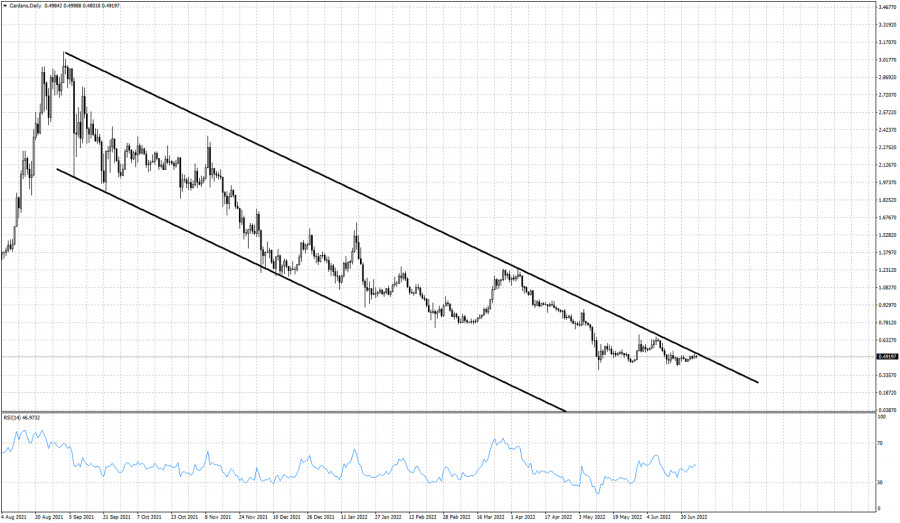
Black lines- bearish channel Cardano price is around $0.48 almost where it was back in the beginning of May. Price remains trapped inside a downward sloping bearish channel. For the last two months price is mostly moving sideways. Resistance by the bearish channel is found at $0.535. The RSI has moved above oversold levels into neutral territory. A rejection at current levels could lead to new lows in Cardano towards $0.30. Traders need to be cautious. There is no sign of a reversal in trend. The material has been provided by InstaForex Company - www.instaforex.com |
| Posted: 27 Jun 2022 06:48 AM PDT
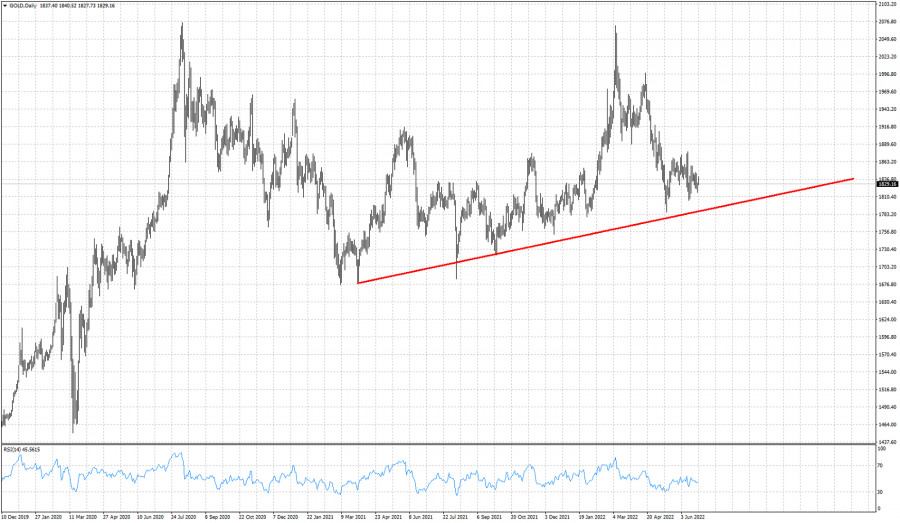
Red line -trend line support Gold started the week higher reaching as high as $1,940 at the beginning of the trading session. Price started trading the week right on top of the key short-term resistance and cloud resistance that we mentioned in a previous post. So far bears remain in control as price has failed to break resistance and is moving lower. Long-term support trend line coming from March 2021 lows remains intact. Currently this long-term support is at $1,790-$1,800. Bulls need to defend this support at all costs. Failure to do so will lead Gold price towards $1,700 and maybe lower. Short-term resistance remains at $1,840-60. So far bulls seem too weak to break it. The material has been provided by InstaForex Company - www.instaforex.com |
| Trading plan for Dow Jones on June 27, 2022 Posted: 27 Jun 2022 06:47 AM PDT
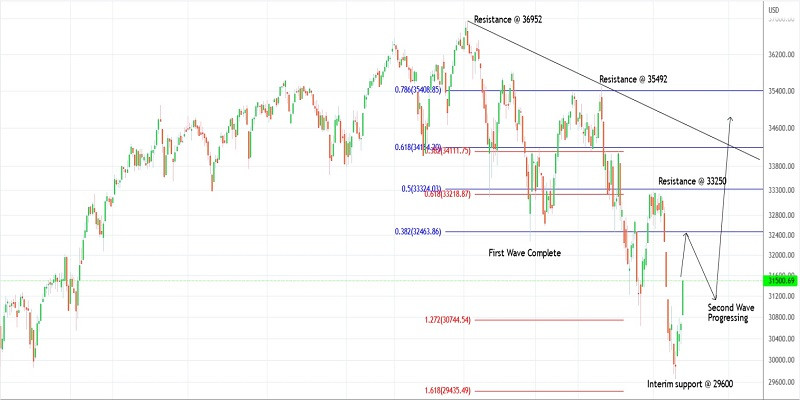
Technical outlook:Dow Jones rose to the 31,570 highs intraday on Monday before finding resistance. The index had earlier dropped through the 29,600 lows before bulls came back in control. It is seen to be trading at around the 31,400-50 zone at this point in writing and is expected to push through the 32,500 levels in the next few trading sessions. Ideally, prices would hold above 29,600 for now. The Dow Jones has carved a meaningful top at around the 36,952 highs on January 05, 2022. Since then, the benchmark index has remained in control of bears sliding over 6,900 points towards 29,600 on June 17, 2022. Ideally, bulls are expected to remain in control over the next several trading sessions pushing prices through 32,400 and up to 34,200. Dow Jones has also managed to carve a lower degree upswing between 29,600 and 31,570 in the past few trading sessions. The index could produce intraday corrective drops but prices are expected to stay above the 29,600 interim lows going forward. Traders might be preparing to hold long positions with a potential short-term target of around 32,400. Trading plan:Potential rally towards 32,400 and 34,200 against 29,000 Good luck! The material has been provided by InstaForex Company - www.instaforex.com |
| Posted: 27 Jun 2022 06:45 AM PDT
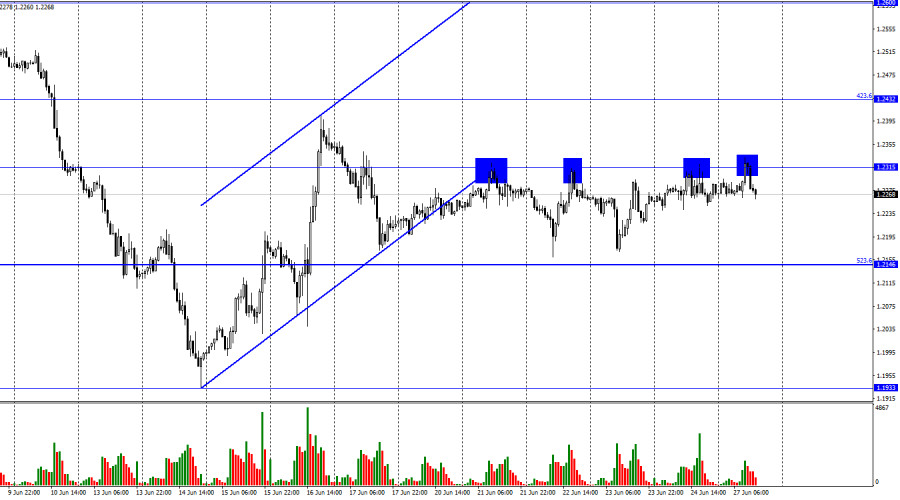
Hi, dear traders! According to the H1 chart, the pound sterling has bounced off 1.2315 downwards on Friday and early on Monday. Over the past 5 days, the pair tested this level four times, only to retrace towards the Fibo level of 523.6% (1.2146). This indicates that bearish traders are not ready for new sell-offs and that bulls have the initiative. However, bullish activity has been rather weak, and the pair continues to move near 1.2315. There are no events in the UK, and the US pending home sales index is unlikely to influence traders. Last week, GBP/USD ignored more important events. The pair would likely leave the sideways range of 1.2146-1.2315 only when either traders decide to act decisively or if they react to an important event. The only notable events on this week's economic calendar are statements by Christine Lagarde, Andrew Bailey, and Jerome Powell. However, Lagarde and Powell both spoke last week, and it did not resume the trend. The same could happen this week, unless there is an important statement by Andrew Bailey regarding interest rate hikes at the next BoE meeting. The policy of both the ECB and the Fed is clear for market players.
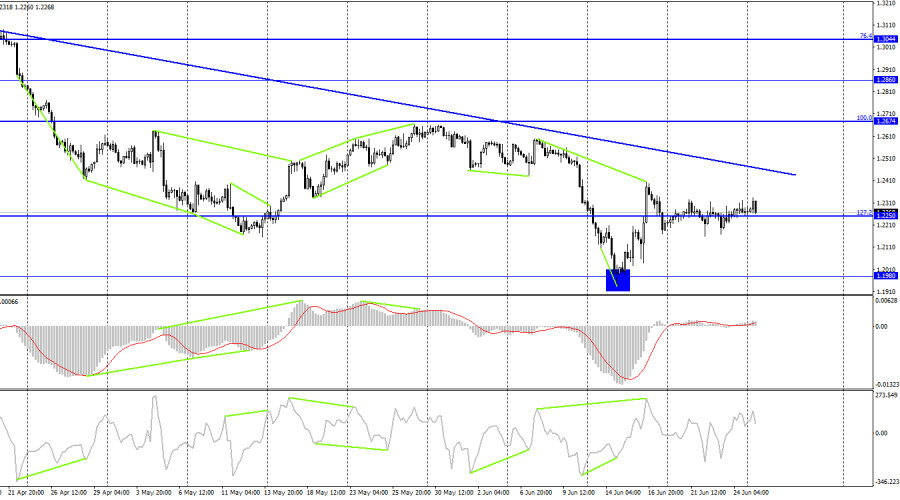
According to the H4 chart, GBP/USD reversed downwards and fell to the retracement level of 127.2% (1.2250) after forming a bearish CCI divergence. If the pair settles below this level, it could then continue to slide down towards 1.1980, where it reversed upwards earlier. The descending trend channel indicates that trader sentiment is bearish. GBP/USD could only rise significantly after it closes above the trend line. Commitments of Traders (COT) report:
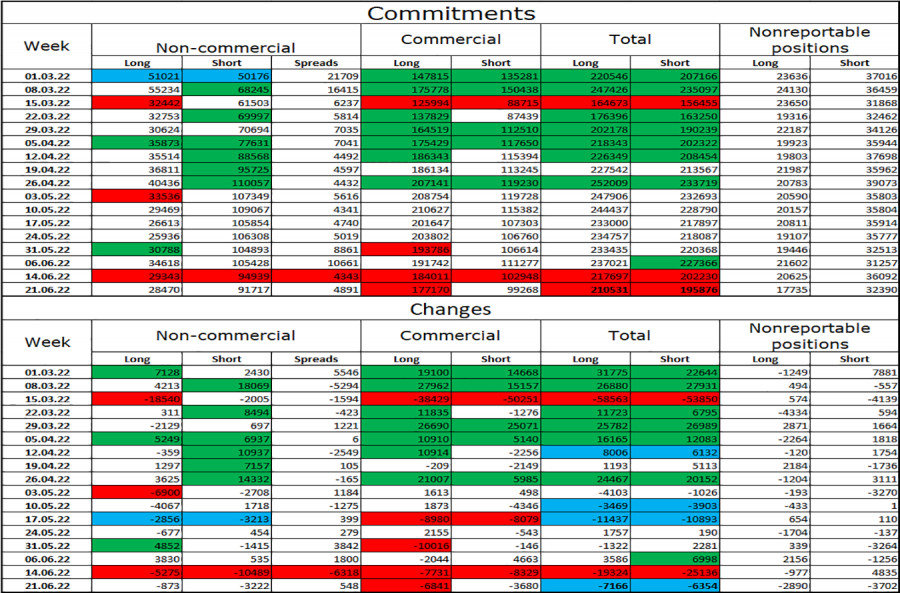
Non-commercial traders became slightly more bullish last week. Traders closed 873 Long positions and 3,222 Short positions. Market players remain bearish on GBP/USD, and Long positions continue to greatly outnumber Short ones. Major players continue to decrease their exposure to GBP, and their sentiment has remained unchanged recently. GBP/USD could continue to fall in the next several weeks, despite the gap between Long and Short positions potentially indicating a trend reversal. At this point, the news and data releases are more important for market players, and they do not give support to the pound sterling. US and UK economic calendar:US - Durable Goods Orders (12-30 UTC).US - Pending Home Sales (14-00 UTC).There are no events in the UK today, and US data releases are unlikely to influence traders. Outlook for GBP/USD:Traders are recommended to open short positions if GBP/USD bounces off 1.2315 on the H1 chart, with 1.2146 being the target. Long positions can be opened if the pair settles above the trend line on the H4 chart, targeting 1.2674. The material has been provided by InstaForex Company - www.instaforex.com |
| Posted: 27 Jun 2022 06:42 AM PDT
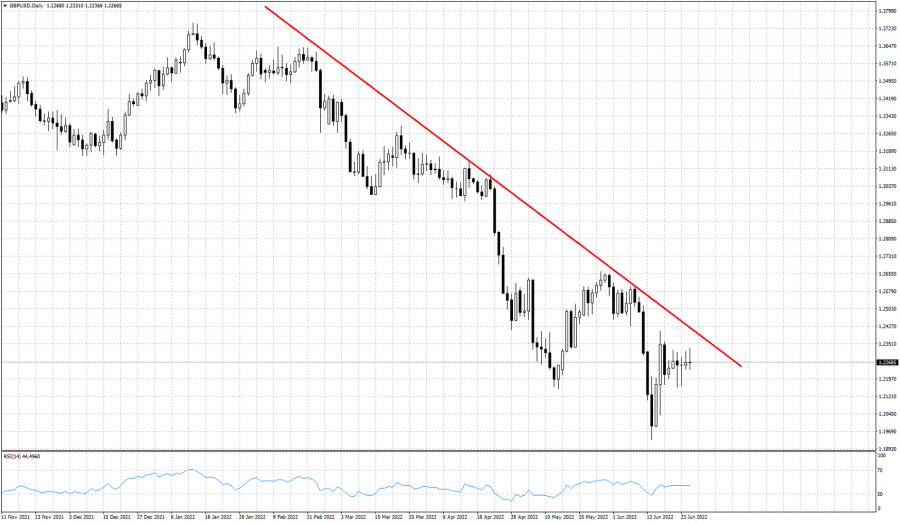
Red line -resistance trend line GBPUSD continues to trade sideways for the last couple of sessions around 1.2270-1.2330. Medium-term trend remains bearish as price continues to trade below the key downward sloping resistance trend line. Price is making lower lows and lower highs since January of 2022. The RSI has turned higher from oversold levels to neutral territory. A rejection at the red resistance trend line could lead to new lows for GBPUSD towards 1.19. As long as price is below the trend line, we remain bearish. Upside potential is limited to the trend line resistance at 1.2425. Support is found at 1.2150 and a break below this level would be a sign of weakness implying that a new round of selling might be starting over again. The material has been provided by InstaForex Company - www.instaforex.com |
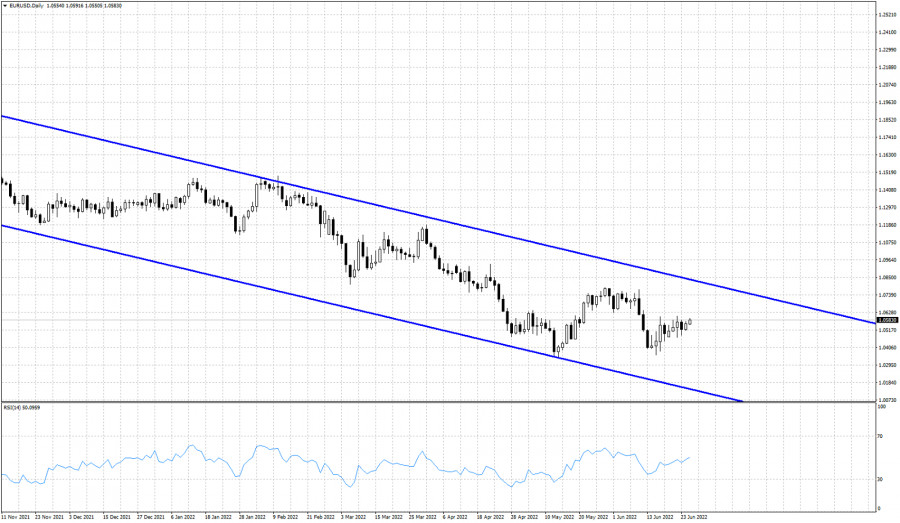
| Posted: 27 Jun 2022 06:38 AM PDT
Blue lines- bearish channel EURUSD continues to trade inside the medium-term downward sloping channel since May of 2021. Price has reached as low as 1.0360 recently and is bouncing higher towards 1.06. As we mentioned in previous posts, there is important resistance around 1.0570-1.0580. EURUSD has the potential to move higher. EURUSD if it breaks above the short-term resistance, price can reach the upper channel boundary resistance at 1.0820-1.08. Support is found at 1.0470-1.0490 area. As long as we trade above this level, bulls have hopes for a move higher. At current levels I prefer to be bullish for the near term as long as support at 1.0470 is held. Upside potential is considerable and should not be ignored. The material has been provided by InstaForex Company - www.instaforex.com |
| You are subscribed to email updates from Forex analysis review. To stop receiving these emails, you may unsubscribe now. | Email delivery powered by Google |
| Google, 1600 Amphitheatre Parkway, Mountain View, CA 94043, United States | |




Comments