Forex analysis review
Forex analysis review |
- BTC update for June 20,.2022 - Potential for the downside breakout of the channel
- Trading Signal for Ethereum (ETH/USD) on June 20-21, 2022: buy above $1,045 (21 SMA - 1/8 Murray)
- Calm start of the week for Gold.
- EUR/USD Technical Analysis and Trading Tips on June 20, 2022
- Ichimoku cloud indicator analysis on EURUSD for June 20th, 2022.
- USDJPY short-term strategy.
- Bitcoin analysis for the week starting June 20th, 2022.
- GBP/USD: Will the Bank of England join the "all for 50" club?
- Forex forecast 06/20/2022 EUR/USD, GBP/USD, USDX, SP500 and Bitcoin from Sebastian Seliga
- EUR/USD analysis for June 20, 2022 - Re-test phase in the background and potential for downside movement
- Meta launches digital clothing store
- Trading plan for USDZAR for June 20, 2022
- Trading tips for gold
- Analysis of Gold for June 20,.2022 - Key pivot at $1.835 on the test
- Technical analysis of GBP/USD for June 20-25, 2022
- Gold stays afloat despite more aggressive Fed policy
- Trading plan for USDMXN for June 20, 2022
- Powell's report at the US Senate Banking Committee will drive the markets (Expect AUD/USD to resume growth and USD/CAD to
- EUR/USD: Preview of the week, Powell's 'two-day marathon' will set the tone for trading
- EUR/USD: plan for US trade on June 20. Buyers of EUR stuck at 1.0549
- Video market update for June 20, 2022
- Trading plan for USDCHF on June 20, 2022
- Technical analysis recommendations on EUR/USD and GBP/USD for June 20, 2022
- Technical analysis of EUR/USD for June 20-25, 2022
- Analysis and trading tips for GBP/USD on June 20
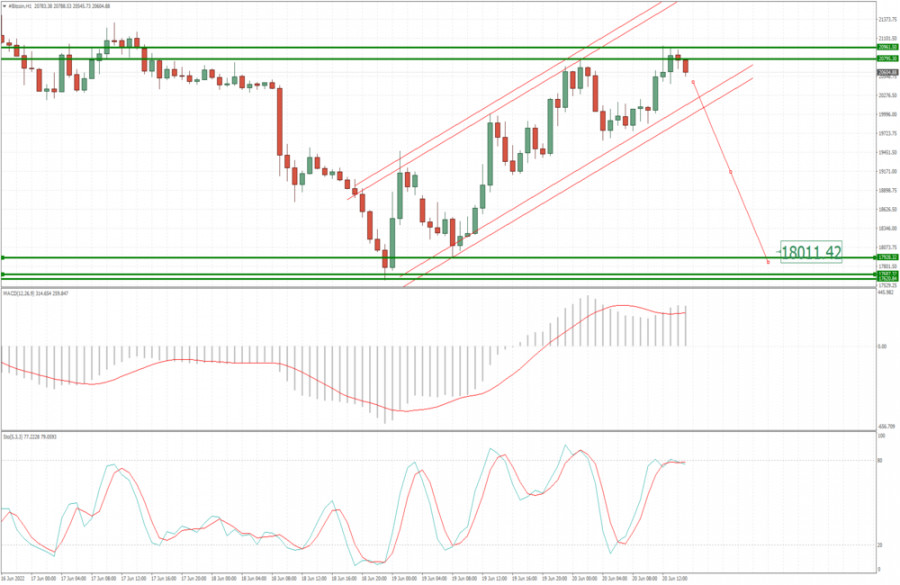
| BTC update for June 20,.2022 - Potential for the downside breakout of the channel Posted: 20 Jun 2022 08:23 AM PDT Technical analysis:
BTC has been trading at the resistance pivot at $21.000. The trend is to the downside and there is defined upside channel. Breakout potential to the downside is the option. Trading recommendation: Due to strong downside trend in the background, I see potential for the downside continuation and potential breakout of the upside channel. In case of the downside breakout of the channel, watch for selling opportunities with the downside objective at $18.000. Stochastic is showing fresh bear cross in the background and the negative reading, which is good sign for further downside movement. Key resistance is set at the price of $21.000 The material has been provided by InstaForex Company - www.instaforex.com |
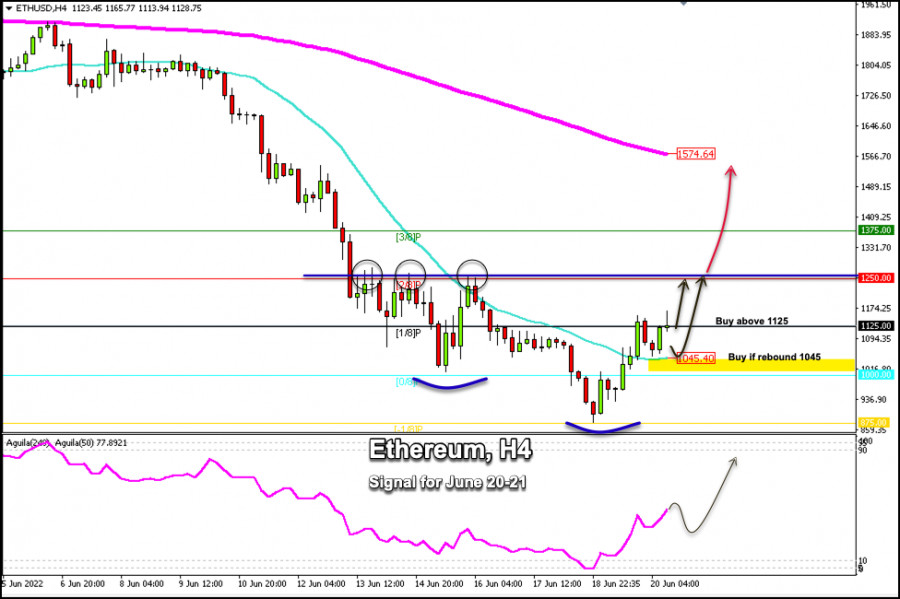
| Trading Signal for Ethereum (ETH/USD) on June 20-21, 2022: buy above $1,045 (21 SMA - 1/8 Murray) Posted: 20 Jun 2022 07:51 AM PDT
Ethereum (ETH/USD) fell to new lows at $878 on Saturday, this level was last seen on Jan 3, 2021. Since this level, Ethereum has been bouncing and has recovered over 30%. It is currently trading at around 1,125 about 1/8 Murray. Cryptocurrency market sentiment has stabilized. Bitcoin has bounced from the low of 17,566 to $20,970 with a gain of more than 20%. Retail buying, profit-taking on short positions and strong overselling have all acted as support for a strong bottom which is likely to see the market recover some of the losses of the last few weeks. Another fact that sets the stage for the recovery of cryptocurrencies is the change in market sentiment. Risk assets such as the Nasdaq-100 index are bouncing and this could favor the recovery of Ether in the coming days. According to the 4-hour chart, we can see that Ether reached the -1/8 Murray line at 875. This level represents extremely oversold conditions which were proven when the eagle indicator reached the 5-point level. Since June 18, the eagle indicator has been giving a positive signal. So, any pullback in ETH is likely to be seen as an opportunity to buy with targets at the strong resistance of 2/8 Murray located at 1,250. Seeing that Ether broke the 21 SMA and is now consolidating above this level adds a positive outlook. As long as it keeps trading above $1045, a recovery is likely in the next few days. If the bullish trend persists and the price breaks sharply and closes above 2/8 Murray at 1,250 on the daily chart, we could expect an upward acceleration. The price could reach the EMA 200 located at 1,774, which would mean a recovery of more than 80% of ETH /USD. On the downside, if ETH consolidates below the 0/8 Murray located at the psychological level of $1000, we could expect a sharp drop and it could reach the area of -1/8 Murray at $875. Our trading plan for the next few hours is buy ETH/USD above 1/8 Murray located at 1,125 or wait for a technical bounce from 1,045 (21 SMA) with targets at 1,250 and 1,574. The eagle indicator is giving a positive signal which supports our bullish strategy. The material has been provided by InstaForex Company - www.instaforex.com |
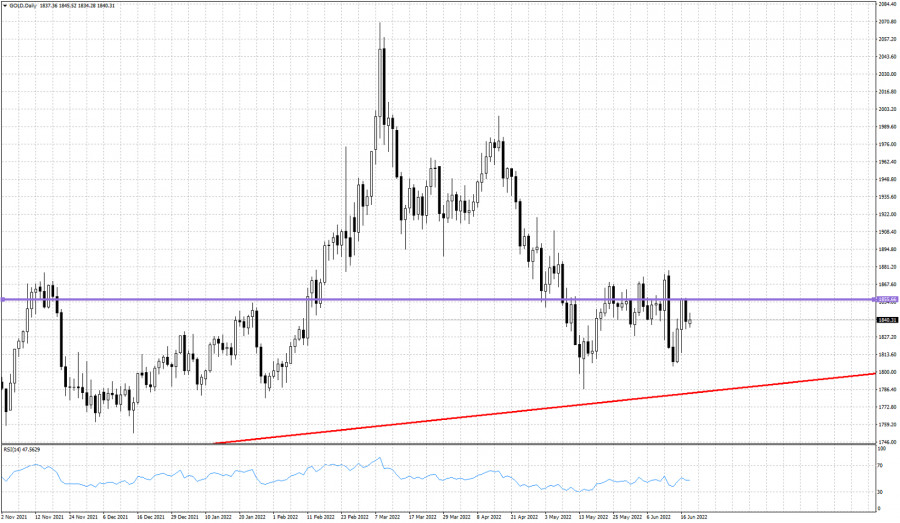
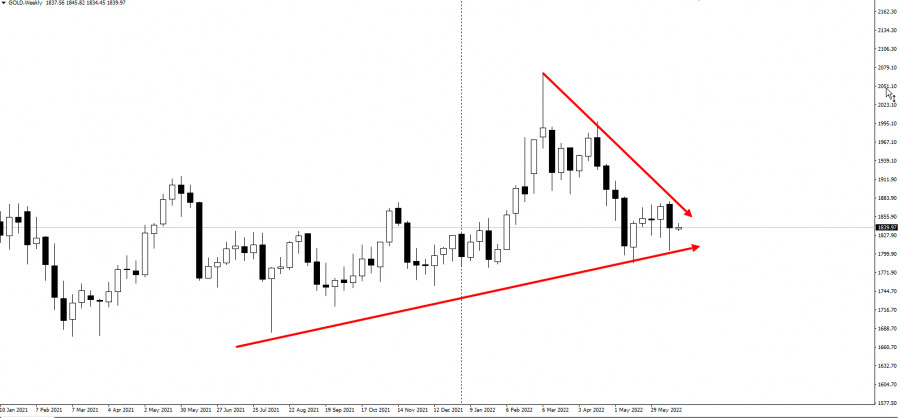
| Calm start of the week for Gold. Posted: 20 Jun 2022 06:35 AM PDT
Red line -weekly support trend line Purple line- major pivot area Gold price has started the week very quietly relative to the last week which was very volatile. Gold price continues to trade around the $1,840-60 area which is considered a pivot area. This price range attracts Gold price like magnet and no break out or break down has so far been able to create distance from this level. Prices get pulled back towards this area again. Gold price continues to respect the long-term upward sloping red support trend line. As long as price is above $1,800-$1,790, bulls have hopes for another move higher towards $1,900. In the near term bulls will need to break above $1,860 and stay above it in order to hope for a challenge of the $1,900 level. Price has made no real progress over the last couple of months as price is attracted towards the $1,840-60 zone. Traders need to be patient. The material has been provided by InstaForex Company - www.instaforex.com |
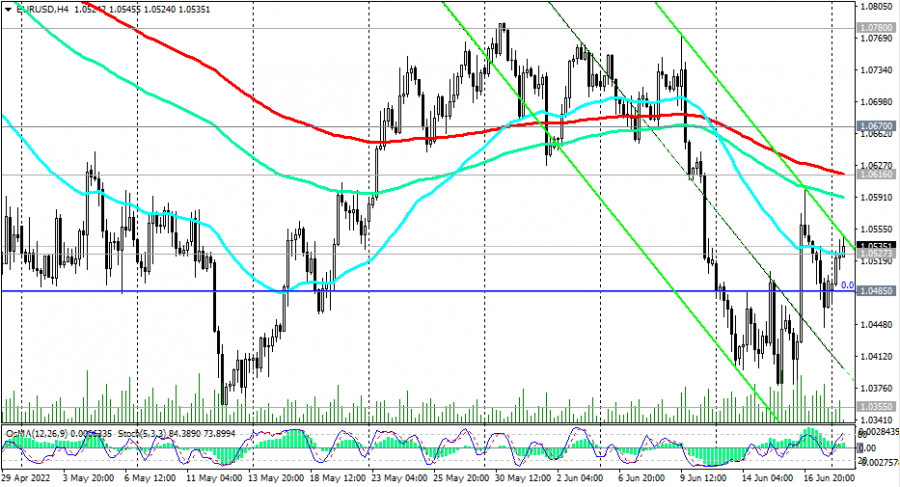
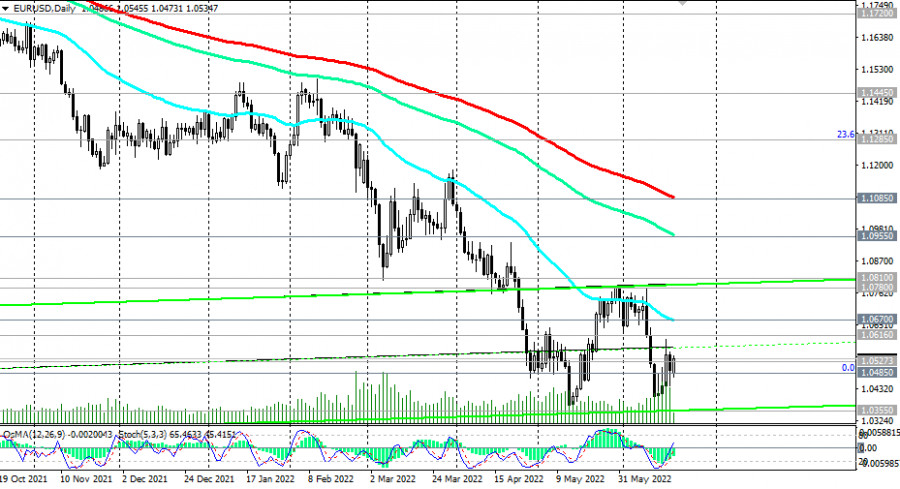
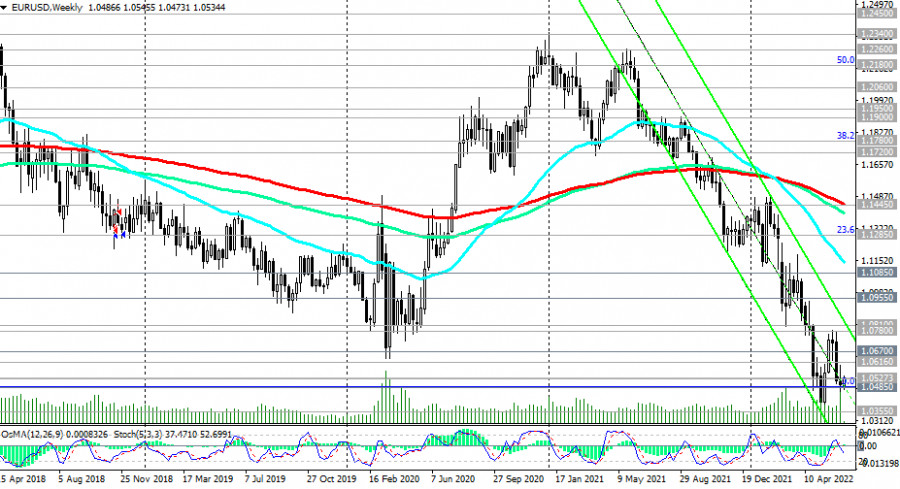
| EUR/USD Technical Analysis and Trading Tips on June 20, 2022 Posted: 20 Jun 2022 06:32 AM PDT
As of this writing, EUR/USD is trading near 1.0535, testing an important short-term resistance level at 1.0527 (200 EMA on the 1-hour chart). In case of its breakout, the upward correction may continue to the resistance level of 1.0616 (200 EMA on the 4-hour chart).
EUR/USD is in the zone of a long-term bearish market below the key resistance levels 1.0955 (144 EMA on the daily chart) and 1.1085 (200 EMA on the daily chart). Therefore, for now, its further corrective growth will most likely be limited by the resistance level of 1.0670 (50 EMA on the daily chart), and in the main scenario, there will be a rebound from the resistance level of 1.0527.
A breakdown of the local support level 1.0485 will return downside risks to 1.0300, and further towards parity with the euro against the dollar against the backdrop of a steady strengthening of the dollar and a deterioration in the prospects for the Eurozone. In an alternative scenario, the price will break through the resistance levels of 1.0527, 1.0616, and 1.0670 and grow to the local resistance levels of 1.0780, 1.0800, and 1.0810. Further movements will largely depend on the dynamics of the dollar and the actions of the Fed and the ECB regarding their monetary policies.
Support levels: 1.0500, 1.0485, 1.0400, 1.0355, 1.0300, 1.0200, 1.0100, 1.0000 Resistance levels: 1.0527, 1.0616, 1.0670, 1.0780, 1.0800, 1.0810, 1.0955, 1.1000, 1.1085 Trading Tips Sell Stop 1.0470. Stop-Loss 1.0565. Take-Profit 1.0400, 1.0355, 1.0300, 1.0200, 1.0100, 1.0000 Buy Stop 1.0565. Stop-Loss 1.0470. Take-Profit 1.0616, 1.0670, 1.0780, 1.0800, 1.0810, 1.0955, 1.1000, 1.1085 The material has been provided by InstaForex Company - www.instaforex.com |
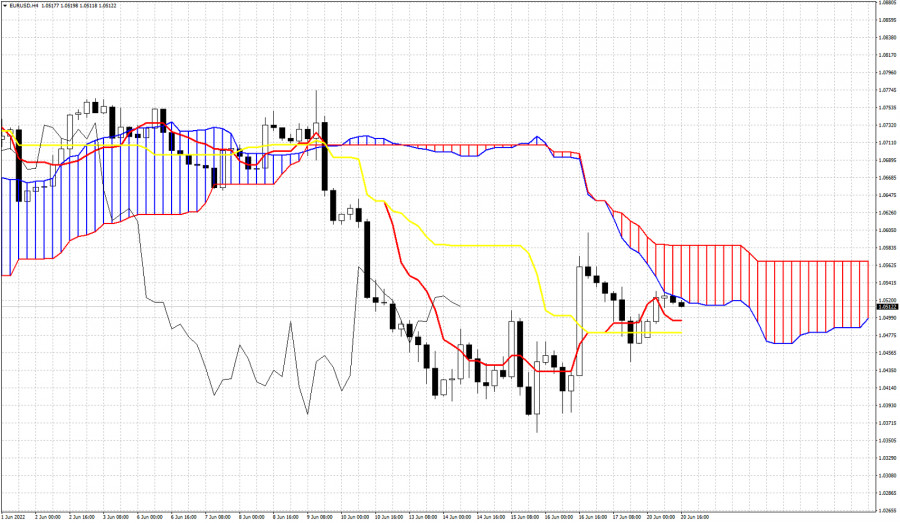
| Ichimoku cloud indicator analysis on EURUSD for June 20th, 2022. Posted: 20 Jun 2022 06:29 AM PDT
EURUSD is trading above 1.05. Even in the 4 hour chart price remains below the 4 hour Kumo (cloud). This indicates that trend remains bearish. Price is above the tenkan-sen (red line indicator) and the kijun-sen (yellow line indicator). This is supportive for the short-term. But bulls need to show more signs of strength and push price above the cloud. Support by the tenkan-sen is at 1.0495 and by the kijun-sen at 1.0480. Bulls need to defend these support levels. Failure to hold above these support levels will lead EURUSD back towards 1.03. Bulls are challenging the lower cloud boundary. They will need to break inside the cloud to change trend to neutral. The material has been provided by InstaForex Company - www.instaforex.com |
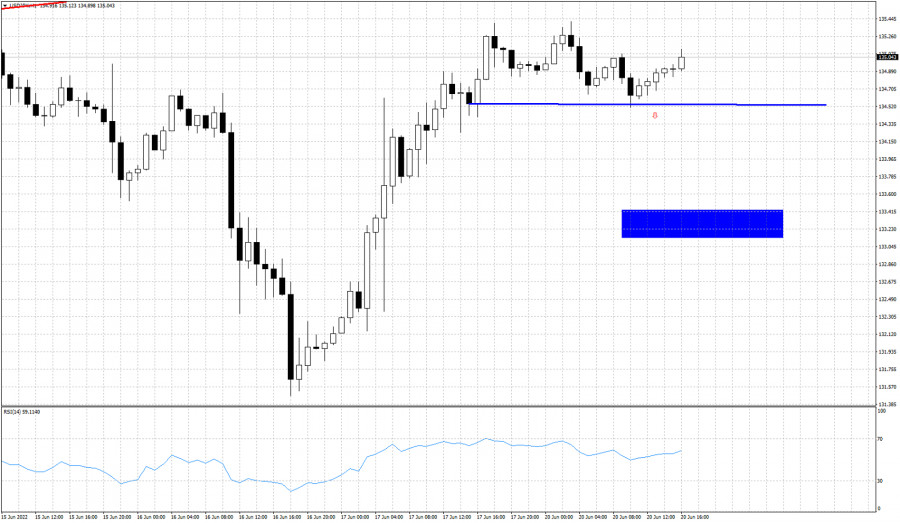
| Posted: 20 Jun 2022 06:26 AM PDT
Blue line -support Blue rectangle- target if support fails to hold USDJPY is trading around 134.93. Price is again near its 2022 highs. The chances of a major reversal and pull back towards 130 remain high. Today however we will focus on a short-term pull back that might be triggered soon. After a sharp rise from 131.47 towards 135.35, price is moving sideways over the last couple of days. Support is at 134.50. Failure to hold above this support will be a bearish signal. If the break down occurs, we should then expect USDJPY price to move towards the blue rectangle target area. The material has been provided by InstaForex Company - www.instaforex.com |
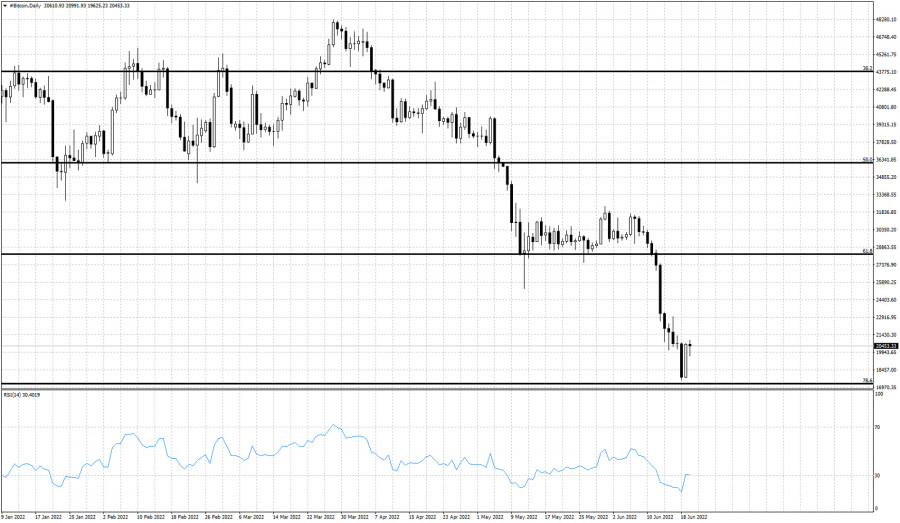
| Bitcoin analysis for the week starting June 20th, 2022. Posted: 20 Jun 2022 06:22 AM PDT
Black lines- Fibonacci retracement levels Bitcoin technically remains in a bearish trend. Over the last few weeks we have given several warnings to bulls that if specific price levels were broken, price would fall towards $20,000 and lower. In our most recent analysis we noted that a break below the 61.8% Fibonacci retracement was a new bearish signal and price was expected to continue lower towards the 78.6% retracement level. Price over the weekend has reached our target area and is now bouncing off support. The RSI from oversold levels is bouncing higher and this is normal after such a long down trend. The RSI has made new lower lows. There is no sign of a bullish divergence. This means that any upside bounce should be short-lived. Bitcoin price chart justifies a bounce towards $25,000-$27,000 but it will be considered as a counter trend bounce. Over the last few years we have witnessed such deep pull backs in Bitcoin price. It is not the first time we see a more than 70% decline after a strong rally. Is this time going to be different?In any case, I do not see the formation of a major low or the signs of a major reversal yet. The material has been provided by InstaForex Company - www.instaforex.com |
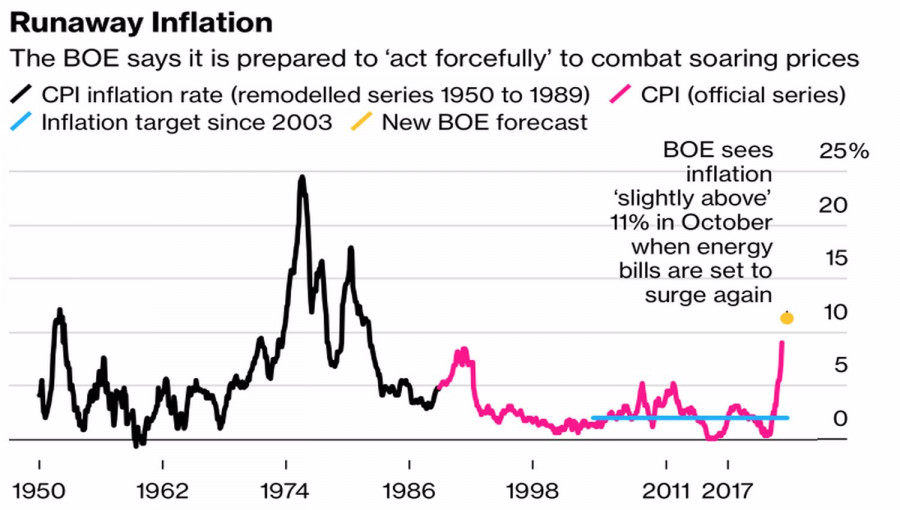
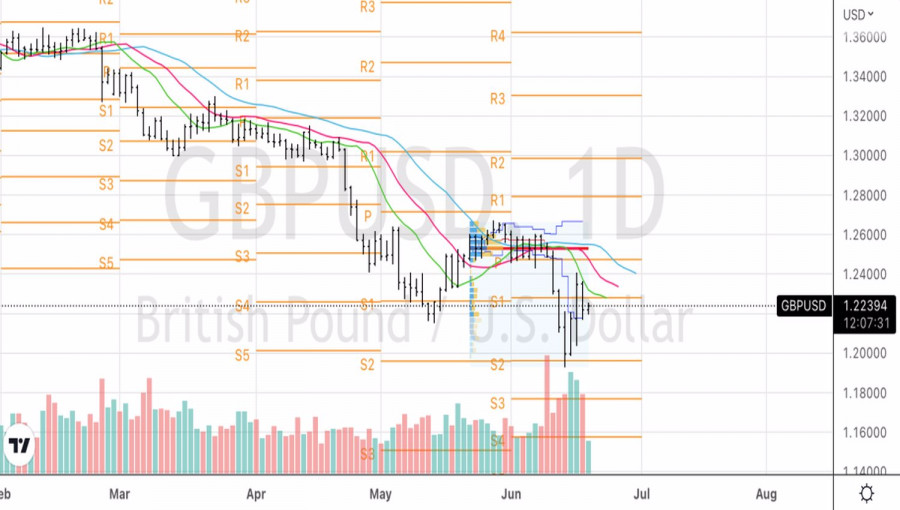
| GBP/USD: Will the Bank of England join the "all for 50" club? Posted: 20 Jun 2022 06:16 AM PDT The Bank of England's 25 bps rate increase and its words about the readiness to act decisively if high inflation takes root in the British economy was enough to push the GBPUSD quotes above 1.24. According to Capital Economics, consumer prices in the UK will rise faster than US prices, at least until mid-2023, which forces the BoE to act aggressively. The futures market expects borrowing costs to rise to 3% by the end of 2022, just short of the FOMC consensus for a federal funds rate of 3.4%. The Bank of England, like many other regulators, is between a rock and a hard place. On the one hand, according to Bloomberg experts, inflation will accelerate to 9.1% in May. At the same time, Natixis expects it to rise to 10%, while the BoE itself predicts an acceleration to 11% in 2022. According to BoE chief economist Huw Pill, if evidence continues to show that consumer prices lead to higher wages, the central bank may raise the repo rate by 50 bps. Dynamics and forecasts of inflation in Britain
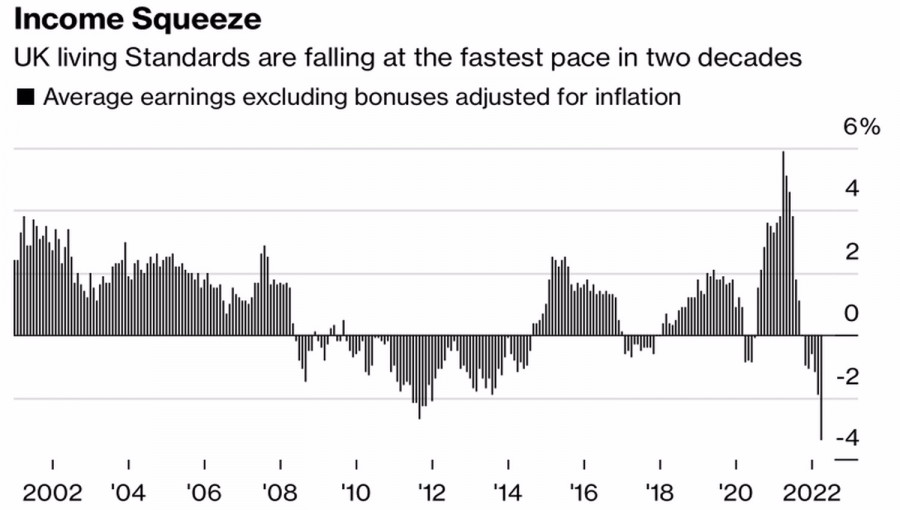
On the other hand, the UK population is facing the most severe cost of living crisis in at least two decades, and 71% of UK citizens polled by YouGov say their costs will increase significantly over the next 12 months. This is the worst result out of 18 countries participating in the survey. For comparison, in the US the figure is 48%. Dynamics of real wages in Britain
In this regard, the publication of statistics on retail sales and business activity in Britain, which, most likely, will continue to slow down, can play a cruel joke on the sterling. Capital Economics believes that the UK economy is unlikely to grow in the next three years, which is a serious obstacle to the BoE monetary restriction. Thus, the economic calendar in the week leading up to June 24 looks very busy for the pound. Releases of data on inflation, retail sales, as well as purchasing managers' indices promise increased volatility in the GBPUSD pair. Based on the input data, investors will weigh whether the BoE will join the "all for 50" club or continue to increase borrowing costs gradually, as it has done before. In addition, the deterioration of macro statistics can provoke talk about a pause in the process of monetary restriction, which is bad news for the pound. GBPUSD, Daily chart
Technically, there is a pronounced downward trend on the GBPUSD daily chart with a pullback in the direction of dynamic resistances – moving averages, which are part of the Williams Alligator indicator. The inability to overcome the first line of defense of the "bears" in the form of EMA and the pivot point at 1.228 indicates the weakness of the "bulls." As a result, there is an opportunity to implement Linda Raschke's "Holy Grail" strategy and form shorts on a break of support at 1.2165. The material has been provided by InstaForex Company - www.instaforex.com |
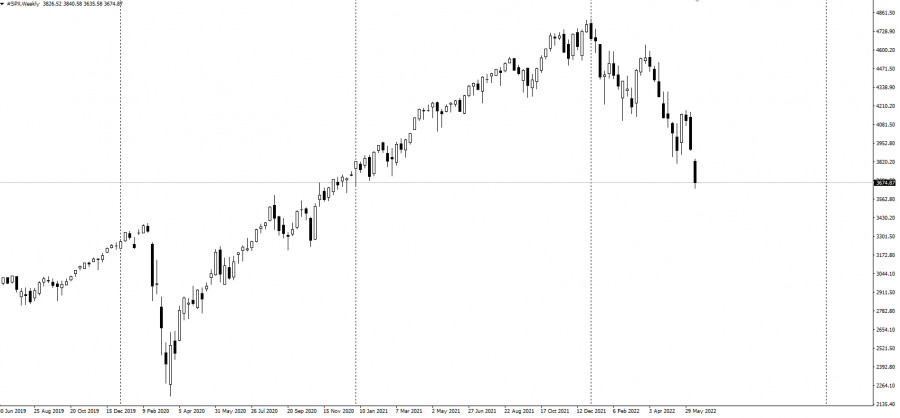
| Forex forecast 06/20/2022 EUR/USD, GBP/USD, USDX, SP500 and Bitcoin from Sebastian Seliga Posted: 20 Jun 2022 05:56 AM PDT Let's take a look at the technical picture of EUR/USD, GBP/USD, USDX, SP500 and Bitcoin. The material has been provided by InstaForex Company - www.instaforex.com |
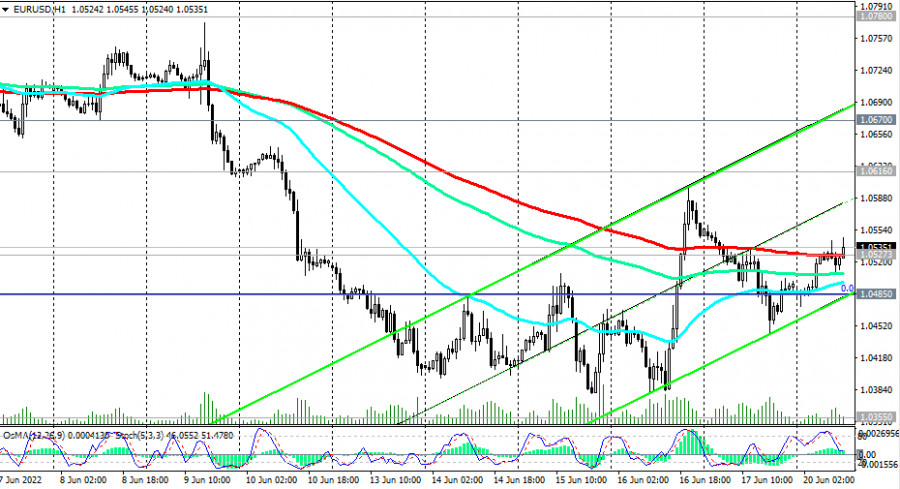
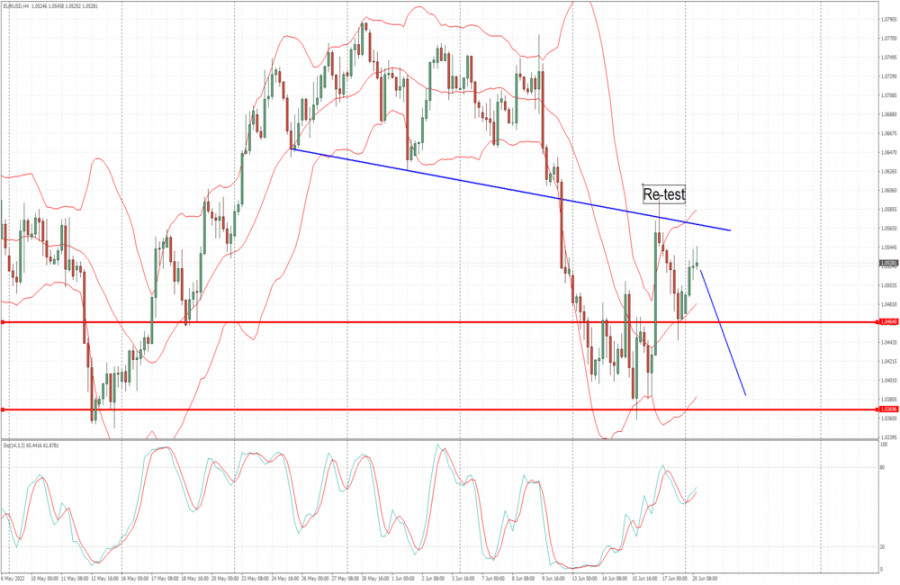
| Posted: 20 Jun 2022 05:09 AM PDT Technical analysis:
EUR/USD has been trading sideways at the price of 1.0520. Anyway, I see Re-test in the background and potential for the downside movement. Trading recommendation: Due to the re-test of the lower trend-line in the background, I see potential for further downside movement. Watch for the intraday rallies for the potential downside opportunities with the downside objectives at 1.0665 and 1.0370. Key resistance is set at the price of 1.0600 The material has been provided by InstaForex Company - www.instaforex.com |
| Meta launches digital clothing store Posted: 20 Jun 2022 05:04 AM PDT While Bitcoin is trying to recover after it plunged below $20,000 and reached another annual low, probably considered temporary around $17,850, Meta announced that it was launching a designer digital clothing store. However, the key point is that the company is launching a store in the metaverse where users can purchase clothes for their avatars. Meta believes that clothing and other accessories will become a significant part of users' identity expression and this will encourage them to spend money on digital clothing that can be worn on all Meta applications, including Facebook and Instagram.
Obviously, Zuckerberg's new plan and Facebook's redesign have already been implemented. Metaverse is a digital analogue to our real world. Many companies, clothing manufacturers in particular, have started to actively partner with it to capitalize on users' need for identity expression. A new clothing store named "Meta Avatars Store'' will allow users to buy clothes from different brands for their metaverse avatars. The store will feature digital outfits designed by such fashion brands as Balenciaga, Prada and Thom Browne, and will be available for Meta avatars on Facebook, Instagram and Messenger. Pricing for each of the available garments has not yet been revealed. As noted above, Facebook's redesign and renaming to Meta is associated with the fact that the metaverse will extend in the coming years and the need for these digital items will only increase. The company plans to take the lead. "Digital goods will be an important means of self-expression in the metaverse and a big driver of the creative economy. I'm excited to add more brands and bring it to VR soon," founder and CEO of Meta Mark Zuckerberg recently said. Speaking of virtual reality, Zuckerberg is referring to Horizon Worlds, Meta's flagship metaverse app which can only be used by owners of Meta's Quest, a line of VR headsets. However, Meta's stock is plummeting amid the current events. The main reason is that an early pivot to the metaverse would be costly. In his interview, Zuckerberg noted that Facebook will lose a significant amount of money over the next three to five years due to the innovations and changes in the company. As for Bitcoin's short-term prospects, it is clear that only few traders are willing to buy even at the current lows. To develop bulls' initiative, they should be active around $20,800. Only consolidation above this range will quickly return the trading instrument to $21,850. This move will calm down investors deeply shocked after Bitcoin plummeted below $18,000 at the weekend. A breakout of the nearest support around $19,600 and another consolidation below that range would result in Bitcoin's move to reach the low of $18,400 again, and then it is close to $17,540. The material has been provided by InstaForex Company - www.instaforex.com |
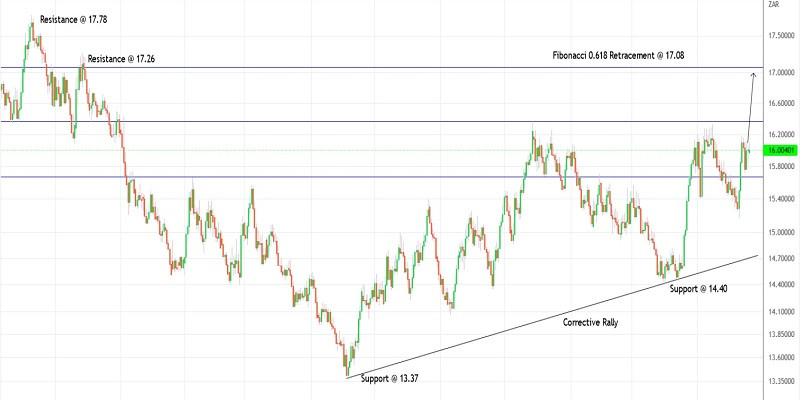
| Trading plan for USDZAR for June 20, 2022 Posted: 20 Jun 2022 04:58 AM PDT
Technical outlook:USDZAR has risen through the 16.08 intraday high on Monday after having recovered from the $15.16 lows registered on June 09, 2022. The currency pair is seen to be trading close to 16.00 at this point of writing and is expected to rally towards the 17.00-10 zone going forward. Bulls will be poised to hold prices above the 14.40 initial support to keep the structure intact. USDZAR has been broadly unfolding a larger degree countertrend rally since the last year, having printed lows around the 13.37 mark. The first wave within the corrective phase terminated through the 16.35 mark, which is also the 0.50 Fibonacci retracement of the larger degree downswing (not seen here completely). USDZAR completed its second wave around the 14.40 levels, which is the interim support now. If the above-proposed structure holds well, bulls are on their way to terminate the last leg higher towards 17.00-10, which is the Fibonacci 0.618 retracement of the above downswing (19.30 through 13.37 levels). A high probability remains for a bearish turn thereafter. Trading plan:Potential rally through 17.10 against 15.10 Good luck! The material has been provided by InstaForex Company - www.instaforex.com |
| Posted: 20 Jun 2022 04:57 AM PDT
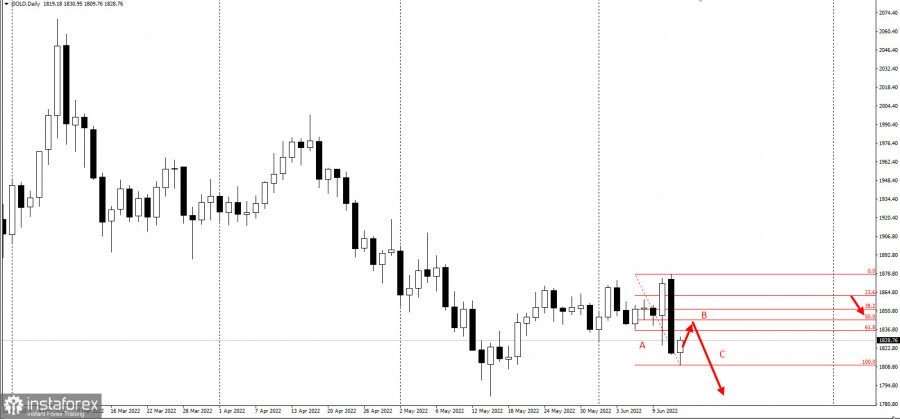
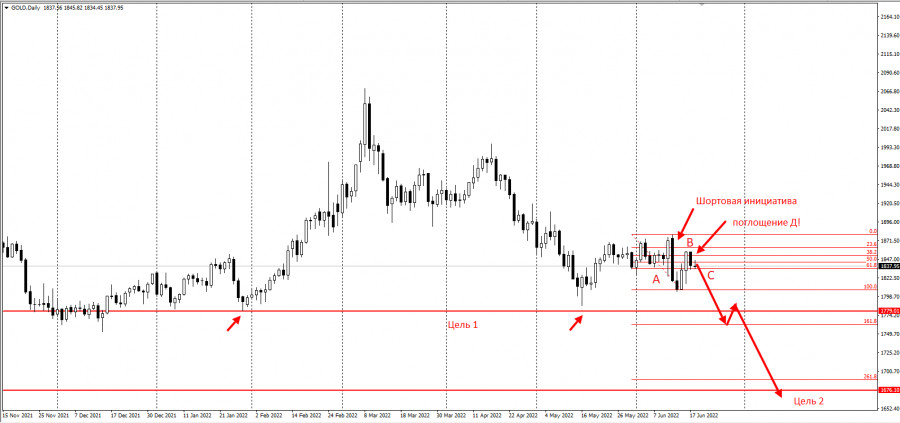
The trading plan presented last June 16 talked about a decrease in gold prices.
That came true today after wave C began to form in the daily chart, in the form of an absorption.
Given that there is a three-wave (ABC) pattern, where wave A represents the selling pressure in the market, traders can open short positions from current prices up to the 50% retracement level. Set stop loss at 1873 and take profit on the breakdown of 1809, 1777 and 1675. This strategy is based on the Price Action and Stop Hunting methods. Good luck and have a nice day! The material has been provided by InstaForex Company - www.instaforex.com |
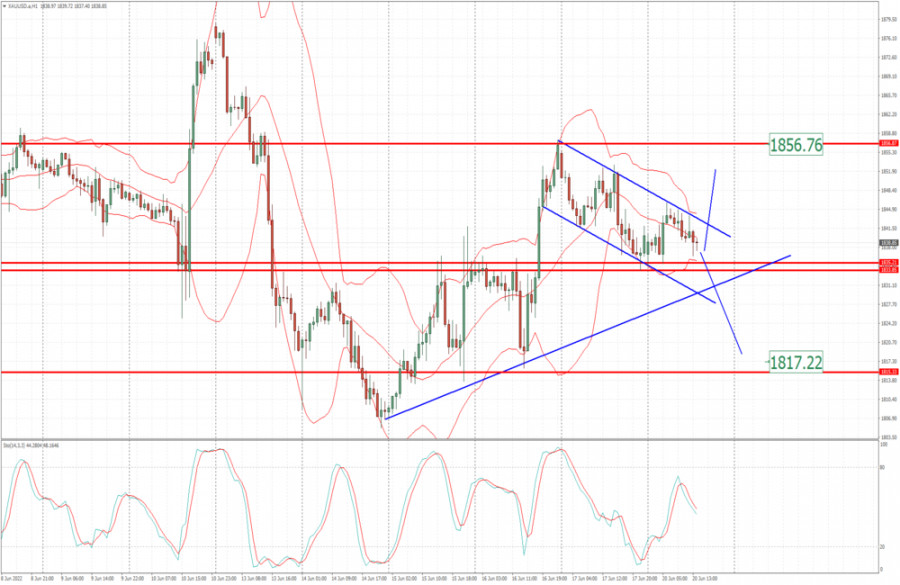
| Analysis of Gold for June 20,.2022 - Key pivot at $1.835 on the test Posted: 20 Jun 2022 04:53 AM PDT Technical analysis:
Gold has been trading sideways at the price of $1.838. Gold is near the important pivot at $1.835. Watch for potential breakout of rejection of key pivot to confirm further direction. Trading recommendation: Due to the sideways regime and key pivot at $1.835, watch for potential price action at the key pivot. In case of the rejection of the support $1.835, watch for upside opportunities with the objective at $1.856. In case of the downside breakout of support at $1.835, watch for selling opportunities with the downside objective at $1.817. Stochastic oscillator is showing fresh bear cross, which is sign for the downside momentum. The material has been provided by InstaForex Company - www.instaforex.com |
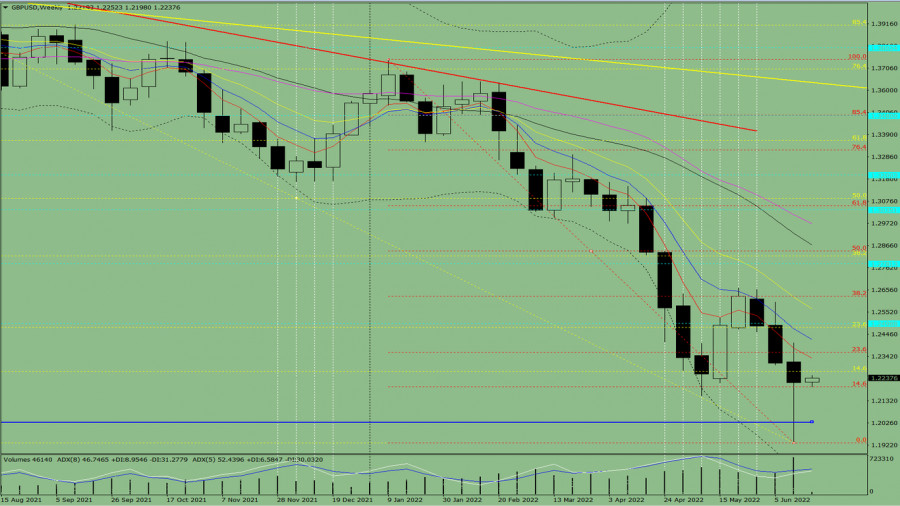
| Technical analysis of GBP/USD for June 20-25, 2022 Posted: 20 Jun 2022 04:51 AM PDT trend analysis GBP/USD will attempt to move up this week, from 1.2217 (closing of the last weekly candle) to 1.2270, the 14.6% retracement level (yellow dotted line). Then, it will go to the 14.6% retracement level at 1.2477 (yellow dotted line), before rolling back downwards.
Fig. 1 (weekly chart) comprehensive analysis: Indicator analysis - uptrend Fibonacci levels - uptrend Volumes - uptrend Candlestick analysis - uptrend Trend analysis - uptrend Bollinger bands - uptrend Monthly chart - uptrend All this points to an upward movement in GBP/USD. Conclusion: The pair will have an upward trend, with no first lower shadow on the weekly white candle (Monday - up) and no second upper shadow (Friday - up). And during the week, the price will rise from 1.2217 (closing of the last weekly candle) to the 14.6% retracement level at 1.2270 (yellow dotted line), move to the 14.6% retracement level at 1.2477 (yellow dotted line), then rollback downwards Alternatively, the quote could attempt to move down from 1.2217 (closing of the last weekly candle) to the support level at 1.2030 (thick blue line), then bounce back to 14.6% retracement level at 1.2197 (red dotted line). The pair is likely to increase after reaching this level. The material has been provided by InstaForex Company - www.instaforex.com |
| Gold stays afloat despite more aggressive Fed policy Posted: 20 Jun 2022 04:45 AM PDT
The gold market ended last week with a loss of 2%; however, many investors see it as a win against the most aggressive Federal Reserve in nearly 30 years. With inflation reaching a new 40-year high last month, the US central bank had no choice but to raise interest rates by 75 basis points. It also hinted at further aggressive action, with interest rates potentially rising to 3.5% by the end of this year and reaching 4.00% in 2023. Most likely, another 75 bp increase will happen next month as inflation remains the biggest threat to the US economy.
Despite this hawkish sentiment, gold prices ended the week just below $1,850 an ounce, a critical psychological level. This is much better than the stock market, which lost 5%. Also, this year, gold prices remain relatively unchanged, while the broad stock market index is down nearly 23%.
High volatility is one of the reasons why gold managed to hold its positions, regardless of the aggressive tightening of the Fed's monetary policy. Inflation continues to rise and the central bank's hawkish stance raises the risk that the economy will slip into recession. George Milling-Stanley, chief strategist at State Street Global Advisors, said gold has nothing to fear from the Fed, noting that the optimal level of gold in a portfolio is around 10%, but in turbulent times it can double. Similarly, analysts at Societe Generale said gold could rise above $2,000 an ounce in the third quarter. The dispute on which is better between gold and bitcoin has also been settled as Bitcoin fell below $20,000. Since the beginning of the year, its price has fallen by 59%. Some analysts expect digital currencies to fall further as rising interest rates reduce market liquidity. The material has been provided by InstaForex Company - www.instaforex.com |
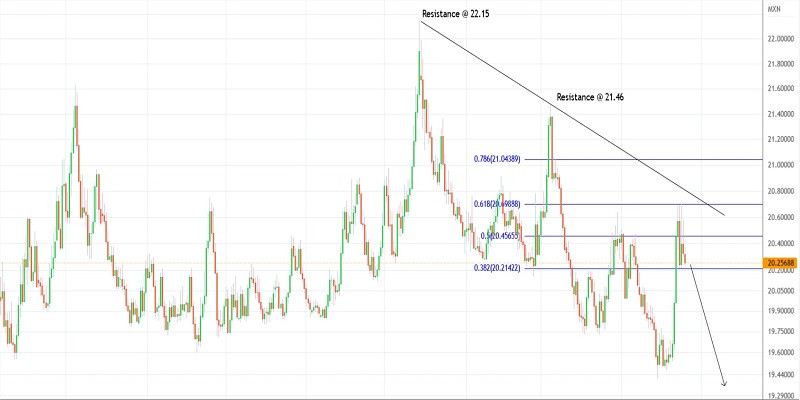
| Trading plan for USDMXN for June 20, 2022 Posted: 20 Jun 2022 04:31 AM PDT
Technical outlook:USDMXN has dropped through the 20.25 mark on Monday after falling through the 20.70 high over the last week. The Mexican Peso might continue to get stronger as bears prepare to come back in control from here. The near-term target might be seen below the 19.40 mark to complete the pattern, which is unfolding since hitting the level of 22.15. USDMXN has been dropping since the 22.15 high registered on November 26, 2021, and bears might be inclined to push it again below 19.40 before giving in to bulls. If the above structure holds well, bears might be inclined to take control from here breaking below the 19.40 mark. The recent boundary being worked upon is found between the 21.46 and 19.40 levels respectively. USDMXN has also tested the 0.618 Fibonacci retracement of the above downswing around the 20.70 mark and hence high probability remains for a bearish turn from here. On the flip side, if bulls are successful in printing another high close to 21.46, the structure will turn in their favor. We shall update according to the price action going forward. Trading plan:Potential drop below 19.40 against 21.46 Good luck! The material has been provided by InstaForex Company - www.instaforex.com |
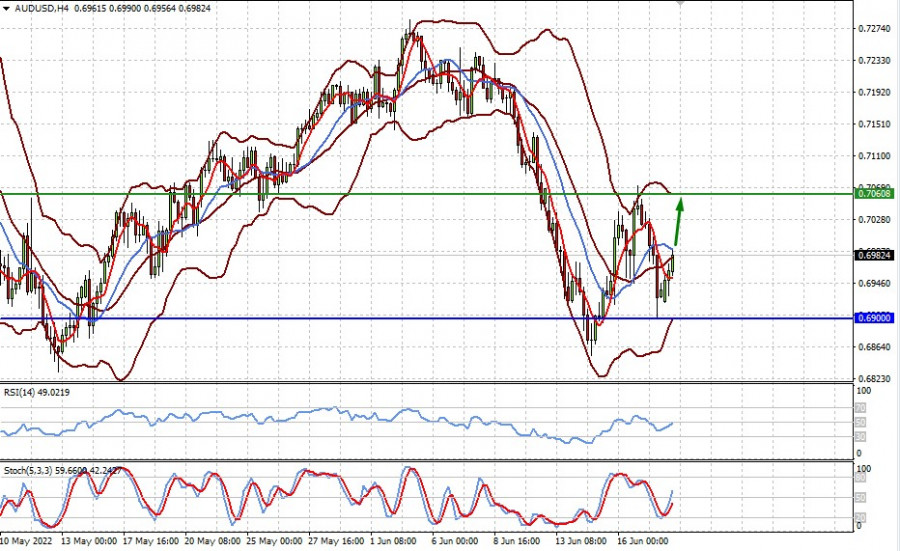
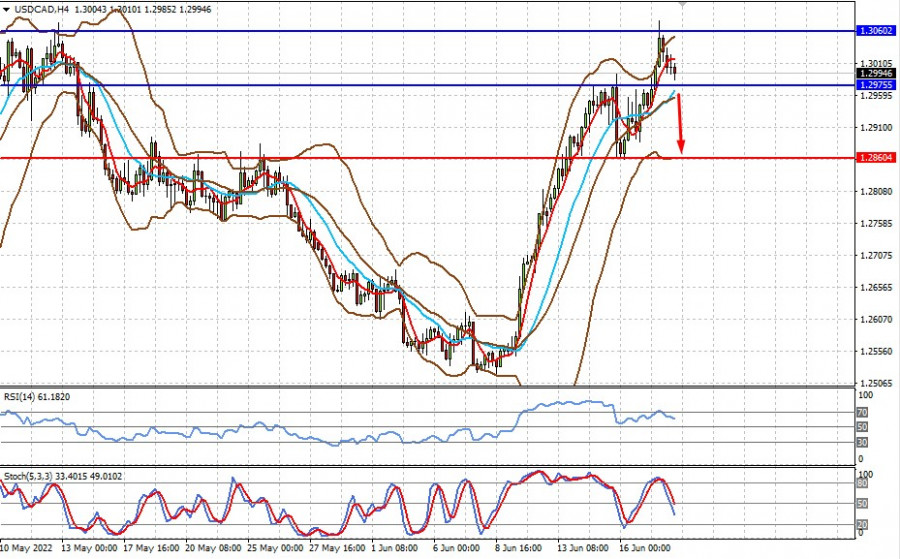
| Posted: 20 Jun 2022 04:20 AM PDT World markets ended the week with a fall in stock indices, weakening the price of commodity assets and limiting the growth of dollar. All this happened because of extremely high volatility. Another reason is the revised expectations of rate hike in the United States, that is, an immediate increase of 0.75%, not by 0.50%. The Swiss National Bank also raised the discount rate for the first time in many years, making the investor realize that the process of raising rates will be sustainable and long-term. Only the stabilization of inflationary pressure both in Europe and in the States will stop it. Monetary authorities in Western countries are already trying to solve the problems in their economies, especially the persistent sharp rise in prices caused by recent sanctions. But European and American leaders, for political reasons, do not want to acknowledge this, worsening the overall situation. The tone of markets this week will depend on the speech of Fed Chairman Jerome Powell at the US Senate Banking Committee. Much will rely on what he will say about inflation, as well as measures to contain it and the general situation in the US economy. Any words that will hint that a tight monetary policy will continue until inflation is completely defeated can definitely cause a new wave of sell-offs in the stock markets and an increase in dollar. But if Powell repeats what he said last week following the Fed's monetary policy meeting, that is, the rates will not rise immediately by 0.75%, but may be less or even stop amid the stabilization of inflation, the dollar will weaken, while other currencies, such as euro, will rise. In any case, it is important to monitor the dynamics of US Treasury yields as it will signal the next movements of the market. Forecasts for today:
AUD/USD The pair found support at 0.6900. Continued positive market sentiment and Powell's softer stance on the Banking Committee could prompt the pair to rise to 0.7060.
USD/CAD The pair faced an obstacle at 1.3060 and rebounded from this level. Rising oil prices and possible increase in risk appetite will encourage the pair to fall to 1.2975, then to 1.2860. The material has been provided by InstaForex Company - www.instaforex.com |
| EUR/USD: Preview of the week, Powell's 'two-day marathon' will set the tone for trading Posted: 20 Jun 2022 04:15 AM PDT At the start of the new trading week, the euro-dollar pair is again trying to develop a corrective growth. EUR/USD bears could not gain a foothold within the 3rd figure, so they quickly lost control over the fourth price level. The sellers of the pair have a rather difficult task: they need to hold their positions in the area of 5-year price lows, at 1.0360–1.0340. Moreover, for the development of the downward trend, it is necessary to go to the base of the 3rd figure, that is, to break through to 20-year lows.
The task is really difficult, which is why the EUR/USD bears failed to realize it last week, even despite the Fed's 75-point interest rate hike. The unexpected decision by the Fed allowed traders to decline to around 1.0360, but further prospects were in doubt. Market participants failed to approach the key support level of 1.0340 (a five-year low), not to mention overcoming this price milestone. As a result, the sellers fixed their profits, as there was a high risk of "catching the price bottom." The buyers, as expected, seized the initiative by organizing a corrective counteroffensive. To strengthen their positions, they need to break through the resistance level of 1.0570 (the lower boundary of the Kumo cloud on the D1 timeframe, coinciding with the Tenkan-sen and Kijun-sen lines). In other words, for the development of the downward trend, sellers of EUR/USD should at least go to the base of the 4th figure, and at most gain a foothold within the third figure. Buyers, in turn, should identify themselves at the borders of the 6th figure in order to qualify for more ambitious targets (among which is a return to the price range of 1.0640–1.0760). The pair may soon fluctuate within a wide-range flat (in the range of 1.0450–1.0550), on the eve of a kind of "marathon" by Jerome Powell. On Wednesday, the head of the Federal Reserve will begin his two-day speech in the US Congress. First, he will present a semi-annual report on monetary policy to the House Committee on Financial Services, and on Thursday to the Committee on Banking, Housing, and Urban Affairs. Given the fundamental importance of this event, neither the bulls nor the EUR/USD bears are likely to tempt fate by opening large positions in favor or against the greenback. Following the results of the June meeting of the Fed, Powell expressed his readiness to increase the interest rate at an active pace: he said that at the next meeting in July, the Fed could resort to either a 50-point or 75-point increase. At the same time, the head of the US regulator made it clear that the parameters of monetary policy will be tightened, even despite the projected decline in the main economic indicators. Note that Federal Reserve Bank of Kansas City President Esther George opposed the rate increase by 75 points (having the right to vote in the Committee, she insisted on a 50-point increase). Commenting on her position, she stated that the rapid increase in the interest rate should be viewed through the prism of "increasing political uncertainty with the simultaneous beginning of exhaustion of the balance sheet." In other words, she opposed "shock therapy," which certainly has its downside.
In general, it is now safe to say that the Fed will increase the rate at each subsequent meeting—at least until the end of this year. The only question is how fast the central bank will tighten the parameters of monetary policy. Powell can answer this question during his speech in Congress. That is why this event is key this week. According to CME Group FedWatch, the markets currently estimate the probability of a rate hike by 75 basis points at the July meeting with a probability of 88%. In this case, Powell's task is not to disappoint dollar bulls. If he allows the option of a 75-point step in September, then the dollar will receive additional support, and very significant. In this case, EUR/USD sellers will be able to approach five-year price lows again. Macroeconomic reports this week are of secondary importance. Sales figures on the secondary housing market in the United States will be published tomorrow, PMI indices will be published on Thursday, and the consumer expectations index from the University of Michigan will be published on Friday. You should also pay attention to the Monthly report of the ECB (published on Thursday) and the speeches of representatives of the European Central Bank (in particular, Lagarde will announce her position on Tuesday). However, it is unlikely that the European regulator will tighten its position and retreat on the planned trajectory of rate hikes (0.25% in July, 0.25% in September). Thus, Powell may provoke increased volatility in the EUR/USD pair this week. Judging by his rhetoric at a recent press conference, as well as the "politicization" of the issue of inflationary growth in the United States, it can be assumed that the head of the US regulator will provide significant support to the greenback with his hawkish attitude. Therefore, it is advisable to use any corrective bursts of EUR/USD to open short positions. The nearest downward targets are 1.0500 and 1.0450. The material has been provided by InstaForex Company - www.instaforex.com |
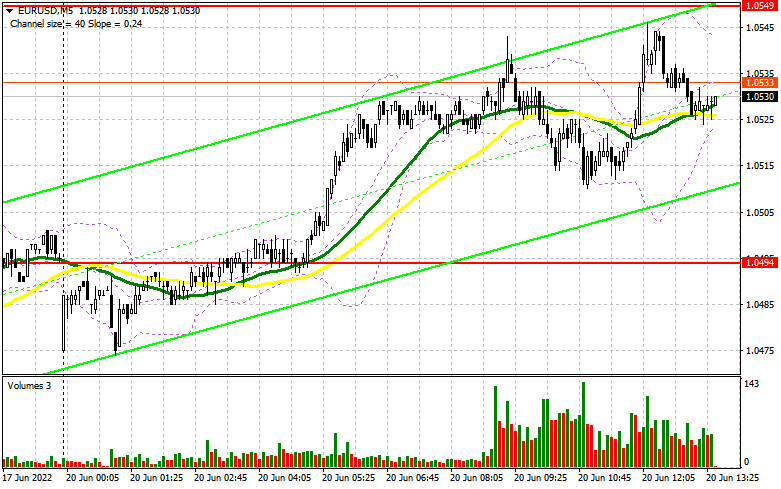
| EUR/USD: plan for US trade on June 20. Buyers of EUR stuck at 1.0549 Posted: 20 Jun 2022 04:00 AM PDT Earlier, I asked you to pay attention to the level of 1.0549 to decide when to enter the market. Let us take a look at the 5-minute chart to clear up the market situation. The absence of data from the eurozone led to a slump in the trading volume and volatility. As a result, the pair got stuck within the sideways channel, unable to hit neither support nor resistance levels mentioned earlier. That is why we did not receive any signal to enter the market. In the second part of the day, the technical picture is likely to be the same.
Conditions for opening long positions on EUR/USD: In the second part of the day, the US is not going to disclose any information. Only FOMC member James Bullard will provide a speech. I suppose that traders still remember Jerome Powell's comments made on Friday about the key interest rate and inflation as well as the US dollar's future. The Fed Chair said that the regulator's approach aimed at consumer price stability added to the confidence in the US dollar as a means of saving. He also pinpointed that the Fed would do everything it could to return inflation to the level of 2%. If Bullard's speech has the same character, bears may try to return pressure on the euro. If the euro drops, bulls should primarily protect the nearest level of 1.0494. Slightly below this level, there are bullish moving averages. Only a false break of this level will give a long signal with the target at the intermediate resistance level of 1.0549. A break and downward test of this level may negatively affect sellers' stop orders, thus providing traders with a long signal with the target at the correction high of 1.0599. The next target is located at 1.0640, where it is recommended to lock in profits. If the euro/dollar pair declines and buyers fail to protect 1.0494, the pair may enter the sideways channel again, thus creating new obstacles for buyers. In this case, traders should be cautious when entering the market. It will be better to go long after a false break of the support level of 1.0429. It is also possible to buy the euro/dollar pair from 1.0360 or lower – from 1.0306, expecting a rise of 30-35 pips. Conditions for opening short positions on EUR/USD: Sellers have every chance to regain control over the market. If the euro/dollar pair climbs in the second part of the day after James Bullard's speech, only a false break of the intermediate resistance level of 1.0549 will give a sell signal with the target at the support level of 1.0494. A lot depends on this level. A break and settlement below this level, weak data from the eurozone as well as an upward test will give an additional sell signal. In this case, the pair may slide to 1.0429. Traders should be very cautious opening sell orders since bulls are likely to benefit from the correction and increase the volume of long positions. It is obvious that the euro is oversold and now, the number of traders who want to open more short positions has dropped. A break and settlement below 1.0429 may push the price to 1.0360, where it is recommended to leave the market. If the pair climbs during the US trade and bears fail to protect 1.0549, it will be wise to avoid selling until the price hits 1.0599. A false break of this level may give a start to a new downward correction. It is also possible to sell the asset after a bounce off the high of 1.0640 or higher – from 1.0663, expecting a decline of 30-35 pips.
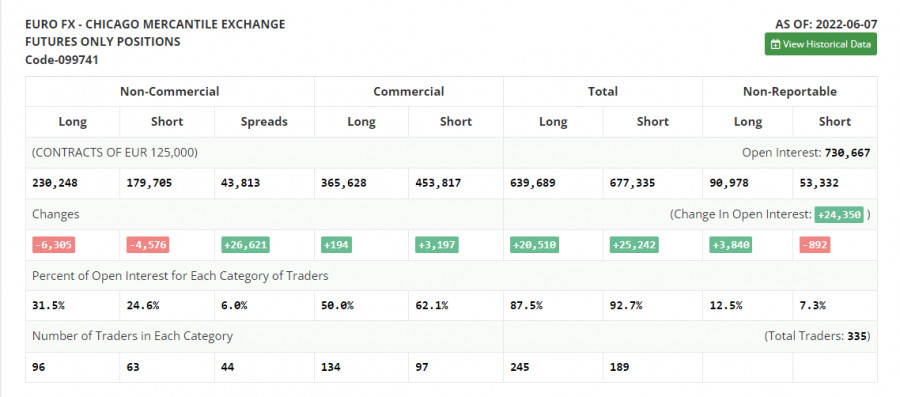
COT report According to the COT report from June 7, the number of both long and short positions slumped. The fact is that most traders were very cautious expecting the ECB meeting. That is why market activity was very low. The time showed that it was a perfect idea to avoid trading. Last week, the ECB's representatives said that the regulator would raise the benchmark rate at the following meeting. However, even this announcement failed to prop up the euro. The US inflation data published on Friday caused a decline in risk assets, including the euro. A further trend of the euro/dollar pair depends on the Fed's decision on monetary policy and forecasts for the next few years. If the regulator's stance remains aggressive, the euro is likely to slide deeper to new yearly lows. The COT report unveiled that the number of long non-commercial positions declined by 6,305 to 230,248, while the number of short non-commercial positions dropped by 4,576 to 179,705. Although the euro is rather cheap, traders are not very interested in it. According to the week's results, the total non-commercial net position decreased to 50,543 against 52,272 a week earlier. The weekly closing price dropped to 1.0710 compared to 1.0742.
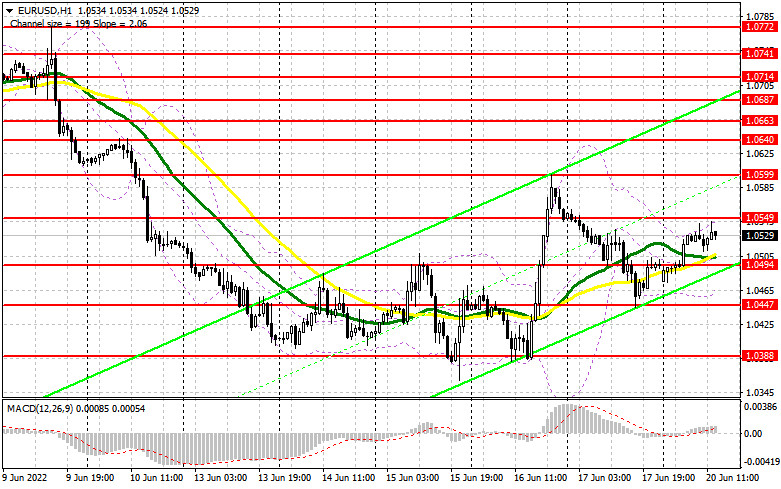
Signals of indicators: Moving Averages Trading is performed above 30- and 50-day moving averages, thus pointing to bulls' attempt to push the euro higher. Note: The period and prices of moving averages are considered by the author on the one-hour chart that differs from the general definition of the classic daily moving averages on the daily chart. Bollinger Bands If the pair increases, the resistance level will be located at the higher limit of the indicator at 1.0550. In case of a decline, the support level will be located at a lower indicator's limit at 1.0465. Description of indicators
|
| Video market update for June 20, 2022 Posted: 20 Jun 2022 03:57 AM PDT Watch for the breakout to confirm further direction.... The material has been provided by InstaForex Company - www.instaforex.com |
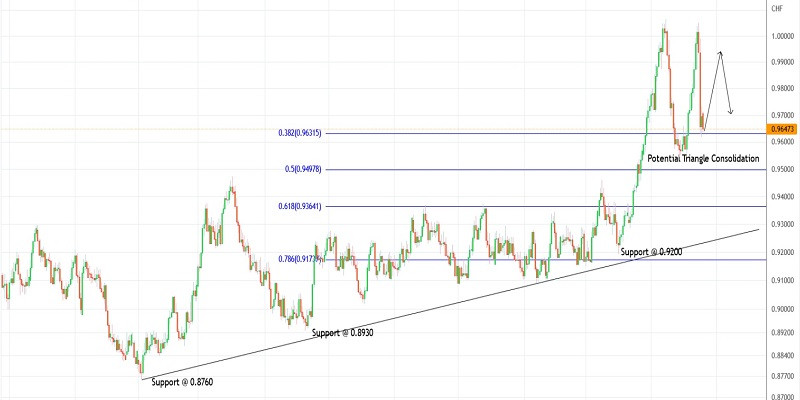
| Trading plan for USDCHF on June 20, 2022 Posted: 20 Jun 2022 03:39 AM PDT
Technical outlook:USDCHF dropped to 0.9630 on Monday after reversing sharply from the 1.0050 highs over the last week. The currency pair might be drifting within a potential triangle consolidation and could continue trading within a range between 1.0060 and 0.9550. Bulls might be looking to hold prices above 0.9550 in the near term. USDCHF has produced a religious uptrend since registering the 0.8760 lows on January 06, 2021. Bulls remained in control and managed to settle at highs around 1.0064 before pulling back sharply through 0.9550. Please note that 0.9550 is also close to the Fibonacci 0.382 retracement of the entire rally between 0.8760 and 1.0064. USDCHF might continue drifting sideways for a few more trading sessions before breaking out higher above 0.0064. Please note that the potential remains for a drop towards 0.9360 if prices break below 0.9550 going forward. Also, note that 0.9360 is the Fibonacci 0.618 retracement of the above rally and potential bullish reversal zone. Trading plan:Potential drop through 0.9350-60 against 1.0064 Good luck! The material has been provided by InstaForex Company - www.instaforex.com |
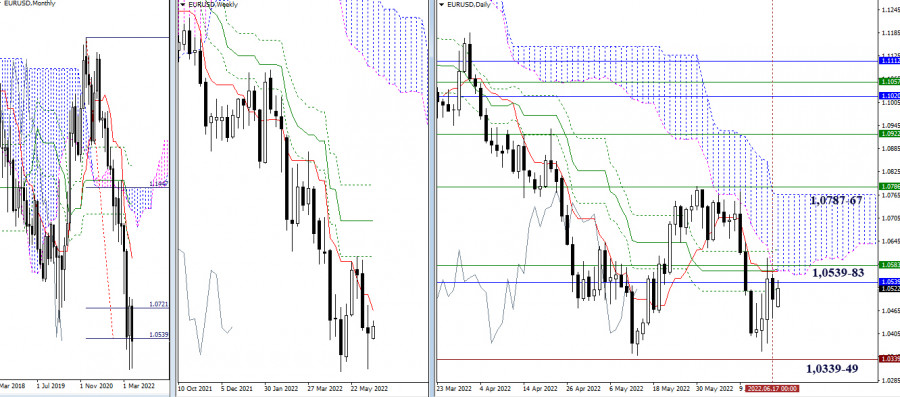
| Technical analysis recommendations on EUR/USD and GBP/USD for June 20, 2022 Posted: 20 Jun 2022 03:30 AM PDT EUR/USD
Higher timeframes Last week was closed with a candle of uncertainty. Bears failed to complete the correction and return to the downward trend. The local lows of 1.0339 – 1.0349 remained unconquered. For bulls to develop and consolidate the advantage, they first need to overcome the accumulation of resistance in the area of 1.0539 – 1.0583. As a result, the pair will restore support for the daily Ichimoku cross and the weekly short-term trend, while entering the daily cloud. The next important step is to overcome the resistance of the weekly Fibo Kijun (1.0787) and enter the bullish zone from the daily cloud (1.0767). If the bulls can complete these tasks, then it will be possible to assess the future targets.
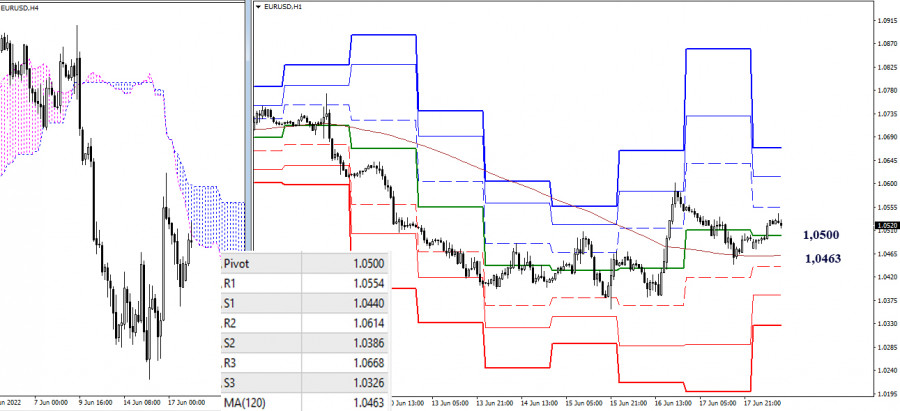
H4 – H1 The key levels at 1.0500 (the central pivot point of the day) and 1.0463 (weekly long-term trend) continue to help bulls maintain their edge. If the rise continues, the resistance of the classic pivot points will serve as upward references within the day, which today are located at 1.0554 – 1.0614 – 1.0668. The breakdown of key levels (1.0500 – 1.0463), reliable consolidation below, and reversal of the moving average can change the current balance of power in favor of bears, who will strengthen their moods, trying to restore the downward trend first on the lower timeframes, and then on the higher timeframes. The supports of the classic pivot points, which are the benchmarks for the development of the decline, are currently at 1.0440 – 1.0386 – 1.0326. *** GBP/USD
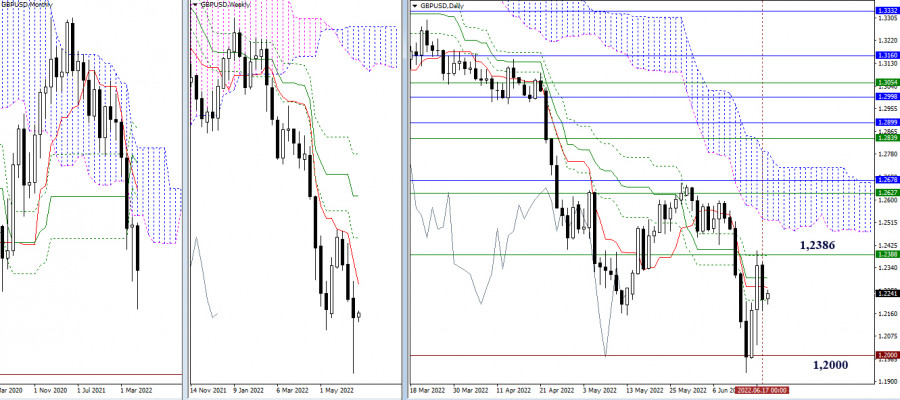
Higher timeframes Last week, having met the psychological support of 1.2000, the pair indicated a slowdown, which resulted in the formation of a weekly rebound. As a result, this level (1.2000) is still the main benchmark for bears in the current segment. For bulls in the current situation, new opportunities and targets will appear after the liquidation of the daily Ichimoku death cross (1.2213 – 1.2265 – 1.2300 – 1.2386) and the return of the weekly short-term trend (1.2386).
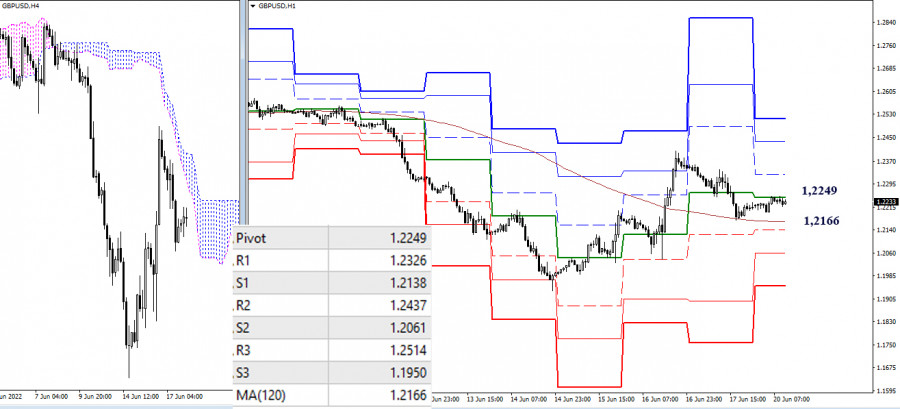
H4 – H1 The key levels of the lower timeframes today are located at 1.2249 (the central pivot point of the day) and 1.2166 (the weekly long-term trend). They continue to provide attraction and support, helping to keep the advantage of the bulls. Additional reference points for the rise within the day are the resistance of the classic pivot points, which can be noted at 1.2326 – 1.2437 – 1.2514. If the key levels are lost, then bears will strengthen their positions, conquering the support of the classic pivot points, which today can be noted at 1.2138 – 1.2061 – 1.1950. *** In the technical analysis of the situation, the following are used: higher timeframes – Ichimoku Kinko Hyo (9.26.52) + Fibo Kijun levels H1 - Pivot Points (classic) + Moving Average 120 (weekly long-term trend) The material has been provided by InstaForex Company - www.instaforex.com |
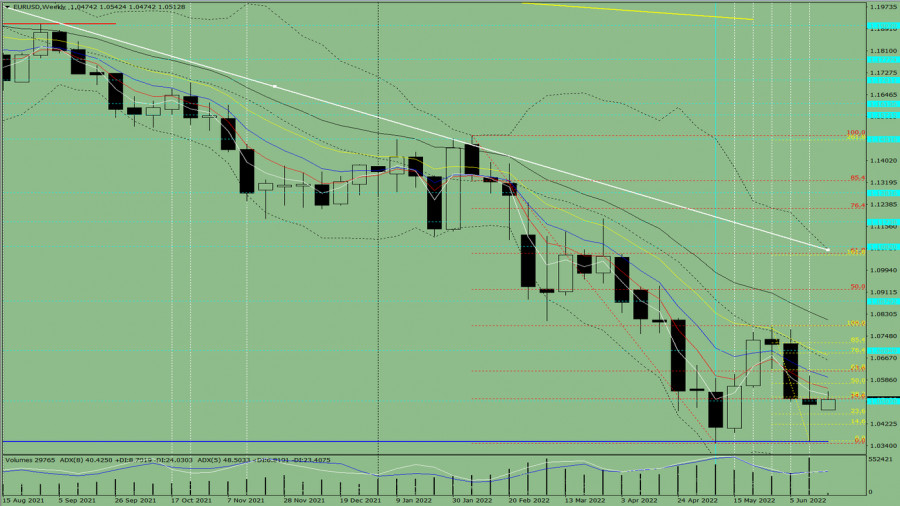
| Technical analysis of EUR/USD for June 20-25, 2022 Posted: 20 Jun 2022 03:30 AM PDT trend analysis EUR/USD will attempt to move up this week, from 1.0494 (closing of the last weekly candle) to 1.0623, the 61.8% retracement level (yellow dotted line). Then, it will go to 1.0695, the historical resistance level (blue dotted line).
Fig. 1 (weekly chart) comprehensive analysis: Indicator analysis - uptrend Fibonacci levels - uptrend Volumes - uptrend Candlestick analysis - uptrend Trend analysis - uptrend Bollinger bands - uptrend Monthly chart - uptrend All this points to an upward movement in EUR/USD. Conclusion: The pair will have an upward trend, with no first lower shadow on the weekly white candle (Monday - up) and a second upper shadow (Friday - down). And during the week, the price will rise from 1.0494 (closing of the last weekly candle) to the 61.8% retracement level at 1.0623 (yellow dotted line), then move to the historical resistance level at 1.0695 (blue dotted line). Alternatively, the quote could attempt to move down from 1.0494 (closing of the last weekly candle) to the support level at 1.0355 (thick blue line), then bounce back and start an uptrend. The material has been provided by InstaForex Company - www.instaforex.com |
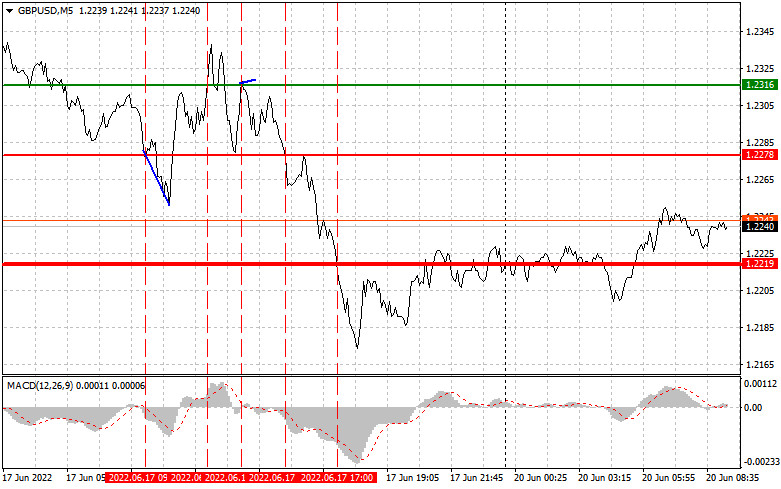
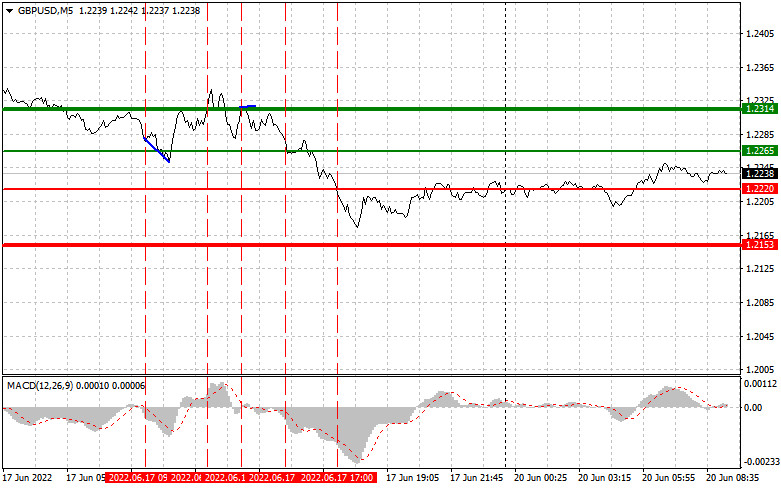
| Analysis and trading tips for GBP/USD on June 20 Posted: 20 Jun 2022 03:22 AM PDT Analysis of transactions in the GBP / USD pair GBP/USD reaching 1.2278 prompted a sell signal in the market. Coincidentally, the MACD line started to move below zero, so the pair dipped by 20 pips. Shortly after that, pound jerked up and hit 1.2316, forming a buy signal. At that time, the MACD line was far from zero, limiting the upside potential of the pair. When the pair tested the level again, the MACD line was moving up, but the price increase was still limited, bringing losses. Similarly, short positions at 1.2278 and long positions at 1.2219 all ended with losses.
Dollar quickly regained all its losses last Friday after the monetary policy committee voted 6-3 to raise the bank rate by 25 basis points to 1.25%. Meanwhile, the lack of statistics in the UK did not support the pound, as did the speech of Bank of England representative Silvana Tenreyro. Dollar rose further because Fed Chairman Jerome Powell spoke a lot about more interest rate hikes in the US. There is also no data to be released in the UK today, and the speech of MPC member Jonathan Haskel is of little interest to the market. There will also be a speech from Fed representatives in the afternoon, but the statements may not have much effect as the tone will most likely remain aggressive. For long positions: Buy pound when the quote reaches 1.2265 (green line on the chart) and take profit at the price of 1.2314 (thicker green line on the chart). There is a chance for a rally today, but only in the morning. Nevertheless, remember that when buying, the MACD line should be above zero, or is starting to rise from it. It is also possible to buy at 1.2220, but the MACD line should be in the oversold area as only by that will the market reverse to 1.2265 and 1.2314. For short positions: Sell pound when the quote reaches 1.2220 (red line on the chart) and take profit at the price of 1.2153. Pressure will return if there are no active purchases below 1.2220. However, when selling, make sure that the MACD line is below zero or is starting to move down from it. Pound can also be sold at 1.2265, but the MACD line should be in the overbought area, as only by that will the market reverse to 1.2220 and 1.2153.
What's on the chart: The thin green line is the key level at which you can place long positions in the GBP/USD pair. The thick green line is the target price, since the quote is unlikely to move above this level. The thin red line is the level at which you can place short positions in the GBP/USD pair. The thick red line is the target price, since the quote is unlikely to move below this level. MACD line - when entering the market, it is important to be guided by the overbought and oversold zones. Important: Novice traders need to be very careful when making decisions about entering the market. Before the release of important reports, it is best to stay out of the market to avoid being caught in sharp fluctuations in the rate. If you decide to trade during the release of news, then always place stop orders to minimize losses. Without placing stop orders, you can very quickly lose your entire deposit, especially if you do not use money management and trade large volumes. And remember that for successful trading, you need to have a clear trading plan. Spontaneous trading decision based on the current market situation is an inherently losing strategy for an intraday trader. The material has been provided by InstaForex Company - www.instaforex.com |


| You are subscribed to email updates from Forex analysis review. To stop receiving these emails, you may unsubscribe now. | Email delivery powered by Google |
| Google, 1600 Amphitheatre Parkway, Mountain View, CA 94043, United States | |


Comments