Forex analysis review
Forex analysis review |
- How to trade GBP/USD on June 8? Simple tips for beginners.
- How to trade EUR/USD on June 8? Simple tips for beginners.
- EUR/USD. State of emergency in the US and the growth of the oil market: the safe dollar reminded itself again
- Gold reclaims $1,850 and hopes for a move towards $1,900 are renewed.
- EURUSD Daily candle gives hopes to bulls.
- Short-term technical analysis on GBPUSD gives hopes to bulls.
- Ethereum respects key support and bounces higher.
- AUD/USD still bullish post RBA
- EUR/USD extends its range
- Trading Signal for GBP/USD on June 7-8, 2022: buy above 1.2505 or if breaks 1.2530 (200 EMA - bullish pennant)
- Stock markets continue to plunge
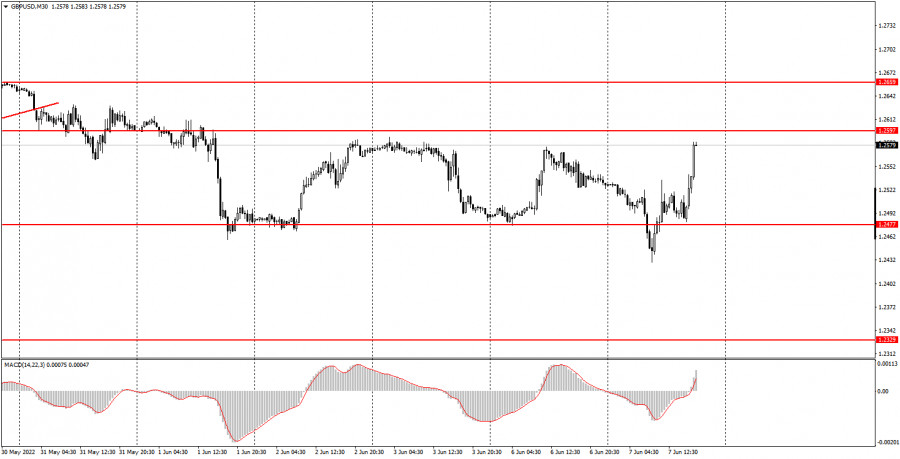
| How to trade GBP/USD on June 8? Simple tips for beginners. Posted: 07 Jun 2022 02:42 PM PDT Analysis of Tuesday's deals:30M chart of the GBP/USD pair
The GBP/USD pair showed a very volatile movement on Tuesday, more than 150 points per day. Formally, there was an exit from the horizontal channel, but the price returned to it very quickly. Thus, at the end of the day, we can also conclude that the technical picture has not changed at all. Moreover, it is rather difficult to say what caused the rather strong movement during the day, if no important macroeconomic report has been published. There were also no important fundamental events, neither in the UK nor in the US. Therefore, it is rather difficult to say why the pair has passed as many as 150 points. Nevertheless, we are inclined to believe that the flat still remains. The movement from the past few days can also be described as a swing. The essence of the matter does not change. The fact remains that there is no trend movement at this time. 5M chart of the GBP/USD pair
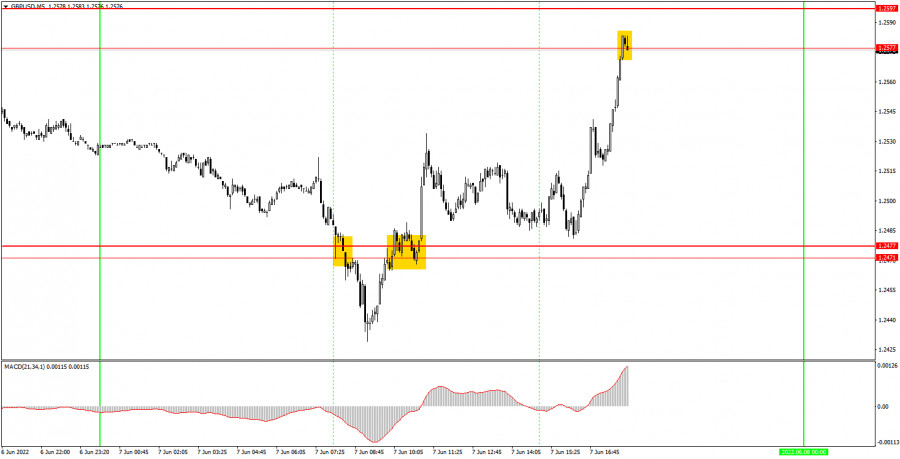
The movement was quite good on the 5-minute timeframe on Friday. Despite the fact that the movement looks flat on the 30-minute time frame, we had a clear trend today on the 5-minute time frame, although the pair often changed direction during the day. However, due to the fact that the levels were chosen correctly, as well as due to their small number, there were few trading signals and all of them were not bad. The first sell signal was formed after overcoming the area of 1.2471-1.2477. After it was formed, the price went down about 30 points, but failed to reach the nearest target level of 1.2371, however, Stop loss could be set to breakeven, so there was no loss on the transaction. The next buy signal was formed when the price settled above the area of 1.2471-1.2477. After that, it went up about 90 points and ideally reached the level of 1.2577, where it was necessary to take profit on the deal. Therefore, novice traders could get 80 points of profit today, which is very good, given the not the best nature of the pair's movement. How to trade on Wednesday:The upward trend is formally canceled on the 30-minute timeframe, however, the pair continues to remain close to its local peaks. At this time, the pair is not exactly within the horizontal channel of 1.2471-1.2477, and only the exit from it will signal the end of the flat. Moreover, even overcoming any of the boundaries cannot guarantee the completion of a flat or "swing". The traffic is very strange right now. On the 5-minute TF it is recommended to trade at the levels 1.2371, 1.2471-1.2477, 1.2577, 1.2597-1.2616, 1.2659-1.2674. When the price passes after opening a deal in the right direction for 20 points, Stop Loss should be set to breakeven. The UK is set to publish only not the most important index of business activity in the construction industry. Meanwhile, the calendar of news and events is completely empty in the US. Thus, novice traders will again have nothing to react to during the day. However, today has shown that volatility, even in this state of affairs, can be very high. Basic rules of the trading system:1) The signal strength is calculated by the time it took to form the signal (bounce or overcome the level). The less time it took, the stronger the signal. 2) If two or more deals were opened near a certain level based on false signals (which did not trigger Take Profit or the nearest target level), then all subsequent signals from this level should be ignored. 3) In a flat, any pair can form a lot of false signals or not form them at all. But in any case, at the first signs of a flat, it is better to stop trading. 4) Trade deals are opened in the time period between the beginning of the European session and until the middle of the American one, when all deals must be closed manually. 5) On the 30-minute TF, using signals from the MACD indicator, you can trade only if there is good volatility and a trend, which is confirmed by a trend line or a trend channel. 6) If two levels are located too close to each other (from 5 to 15 points), then they should be considered as an area of support or resistance. On the chart:Support and Resistance Levels are the Levels that serve as targets when buying or selling the pair. You can place Take Profit near these levels. Red lines are the channels or trend lines that display the current trend and show in which direction it is better to trade now. The MACD indicator (14,22,3) consists of a histogram and a signal line. When they cross, this is a signal to enter the market. It is recommended to use this indicator in combination with trend lines (channels and trend lines). Important speeches and reports (always contained in the news calendar) can greatly influence the movement of a currency pair. Therefore, during their exit, it is recommended to trade as carefully as possible or exit the market in order to avoid a sharp price reversal against the previous movement. Beginners on Forex should remember that not every single trade has to be profitable. The development of a clear strategy and money management are the key to success in trading over a long period of time. The material has been provided by InstaForex Company - www.instaforex.com |
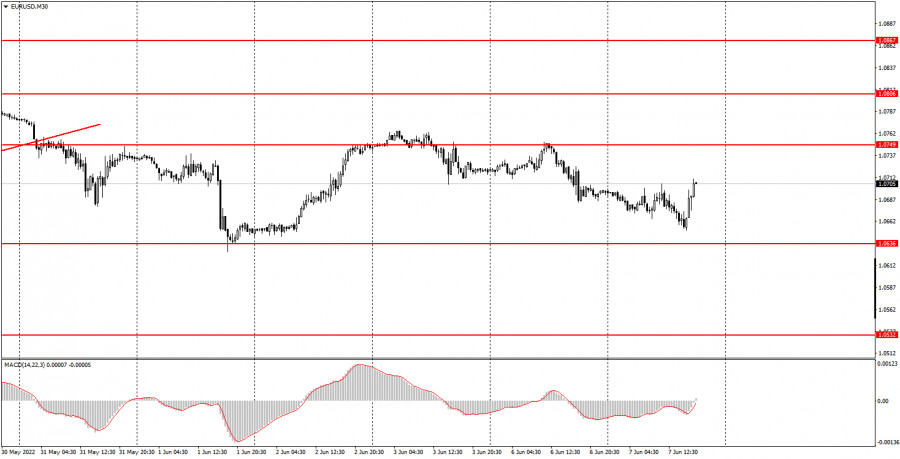
| How to trade EUR/USD on June 8? Simple tips for beginners. Posted: 07 Jun 2022 02:42 PM PDT Analysis of Tuesday's deals:30M chart of the EUR/USD pair
The EUR/USD currency pair showed exactly the movement that we expected to see on Tuesday. In the first half of the day, the pair continued to fall to the lower border of the horizontal channel at 1.0636-1.0749, but then it began to grow in the afternoon. In fact, this growth does not really matter. At this time, if not a classic flat, then a movement very similar in nature has formed. Thus, in the next few hours, the euro's decline can be brought back absolutely easily and simply. Moreover, the euro's growth in the US session was not provoked by important macroeconomic statistics or "foundation". So for now, we state the following conclusion: the price is in a horizontal channel, and this is always dangerous for traders, especially for beginners. Usually the channels have clear boundaries, but in our case, the boundaries of the horizontal channel do not really matter, the pair can work them out rather inaccurately. No important event or report during the day, but, as we can see, the pair did not stand in one place. 5M chart of the EUR/USD pair
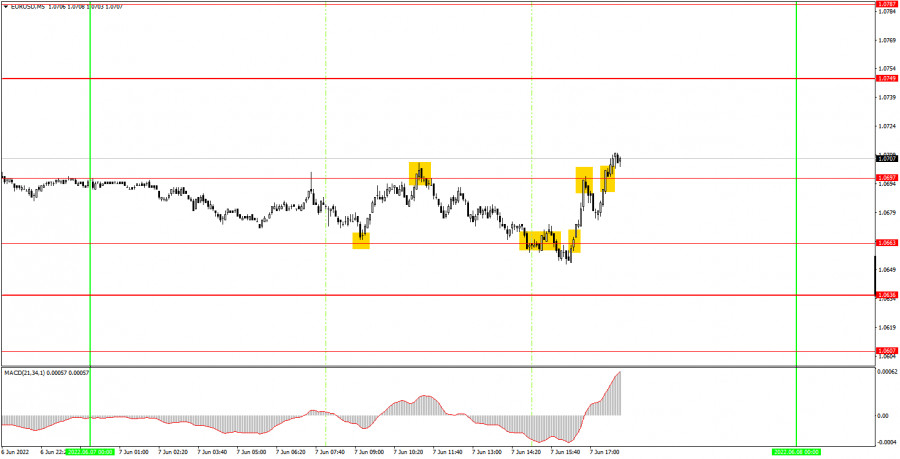
The technical picture on the 5-minute timeframe looks pretty bad all because of the same horizontal channel and the movement inside it. If in the morning the signals were at least more or less digestible, then in the afternoon, blatantly false signals began to form. Well, we warned about a possible flat, and false signals are often formed in a flat. Nevertheless, the first signal to buy near the level of 1.0663 could have been worked out with a long position. The price rose to the level of 1.0697 and rebounded from it, forming a sell signal, after which it again dropped to the level of 1.0663 and even overcame it. Therefore, a short position should have been closed after the price settles above the level of 1.0663. As a result, it was possible to make a profit of 30 points on the first two trades. Further, on a signal to buy near the level of 1.0663, longs should have been reopened, which closed again near the level of 1.0697 - another 15 points of profit. But the sell signal turned out to be false and the pair failed to go down 15 points, so the deal closed at a loss when the price settled above the level of 1.0697. The last buy signal should not have been worked out, since it was formed too late. How to trade on Wednesday:The pair continues to trade inside the horizontal channel on the 30-minute timeframe, so the technical picture has not changed over the past day. As long as the price is between the levels of 1.0636 and 1.0749, there is no need to count on a trend movement. Plus, the news calendar is now empty, so traders have nothing to react to. On the 5-minute TF, it is recommended to trade at the levels of 1.0607, 1.0636, 1.0663, 1.0697, 1.0749, 1.0787-1.0806, 1.0837. When passing 15 points in the right direction, you should set Stop Loss to breakeven. The EU will release a report on GDP for the first quarter in the third assessment. It is unlikely that the third estimate will be very different from the second or the first, so the market reaction to this report is also unlikely to follow. And nothing interesting is planned in America. Therefore, we can assume that the day will again be empty in macroeconomic terms. Basic rules of the trading system:1) The signal strength is calculated by the time it took to form the signal (bounce or overcome the level). The less time it took, the stronger the signal. 2) If two or more deals were opened near a certain level based on false signals (which did not trigger Take Profit or the nearest target level), then all subsequent signals from this level should be ignored. 3) In a flat, any pair can form a lot of false signals or not form them at all. But in any case, at the first signs of a flat, it is better to stop trading. 4) Trade deals are opened in the time period between the beginning of the European session and until the middle of the American one, when all deals must be closed manually. 5) On the 30-minute TF, using signals from the MACD indicator, you can trade only if there is good volatility and a trend, which is confirmed by a trend line or a trend channel. 6) If two levels are located too close to each other (from 5 to 15 points), then they should be considered as an area of support or resistance. On the chart:Support and Resistance Levels are the Levels that serve as targets when buying or selling the pair. You can place Take Profit near these levels. Red lines are the channels or trend lines that display the current trend and show in which direction it is better to trade now. The MACD indicator (14,22,3) consists of a histogram and a signal line. When they cross, this is a signal to enter the market. It is recommended to use this indicator in combination with trend lines (channels and trend lines). Important speeches and reports (always contained in the news calendar) can greatly influence the movement of a currency pair. Therefore, during their exit, it is recommended to trade as carefully as possible or exit the market in order to avoid a sharp price reversal against the previous movement. Beginners on Forex should remember that not every single trade has to be profitable. The development of a clear strategy and money management are the key to success in trading over a long period of time. The material has been provided by InstaForex Company - www.instaforex.com |
| Posted: 07 Jun 2022 02:42 PM PDT The euro-dollar pair is declining for the third consecutive trading day. On Friday, EUR/USD bulls came close to the resistance level of 1.0770 (the lower boundary of the Kumo cloud on the D1 timeframe), but failed to overcome this target. After the release of the Non Farm Payrolls report, the bears seized the initiative and have been holding their grip since then: the pair is gradually sliding towards the support level of 1.0620 (the middle line of the Bollinger Bands indicator on the same timeframe). US President Joe Biden also added fuel to the fire, who just introduced a state of emergency in the United States. If traders push through the above price barrier, they will open their way to the area of the 5th figure, significantly strengthening the bearish sentiment for the pair.
The decline in EUR/USD is primarily due to the general strengthening of the US currency. The US dollar index has been growing for the third day, gradually regaining lost positions. Today, it updated the two-week high, returning to the area of the 102nd figure. The dollar index follows the oil market, which has resumed its growth again. In particular, a barrel of Brent crude oil has already tested the $120 mark today. Let me remind you that last week OPEC+ representatives decided to increase oil production quotas by 648,000 barrels per day (in July and August) instead of the previously planned increase by 432,000 b/d. The oil market plunged somewhat after this decision was announced, but recovered quickly enough. Oil traders came to the conclusion that such a step would not reverse the situation as a whole. According to some estimates, in the third quarter, the global oil deficit will average 400,000 barrels per day. In addition, Saudi Aramco announced that it will raise prices for all grades of exported oil for the countries of Asia, Northwest Europe and the Mediterranean with delivery in July. Thus, Riyadh signaled a shortage of supply. At least the market interpreted this step of the Saudis in this way. Meanwhile, analysts at Goldman Sachs Bank just published a disappointing forecast: they expect the price of oil to continue to rise. In their opinion, Brent will rise to $140 per barrel in the third quarter amid a decrease in supply and a recovery in energy demand in China. The general nervousness of traders intensified yesterday and after the announcement of an emergency situation in the United States due to a potential shortage of electricity generating capacity. Biden's decree states that the emergency regime is being introduced due to the global energy crisis amid extreme weather conditions in the US. Drought and high temperatures have a negative impact on generation and at the same time increase the demand for electricity. The US president also announced a shortage of solar modules, in connection with which he exempted from duties the import of a number of necessary components from Vietnam, Thailand, Cambodia and Malaysia. Given the growing energy crisis, the growth of the oil market, systemic disruptions in supply chains and geopolitical instability, it can be concluded that inflation will only increase in the foreseeable future, despite the fact that in May the first signs of a slowdown in the growth of the US consumer price index and PCE were noted. The US Federal Reserve, in turn, will be forced to respond to a prolonged increase in inflation by revising its strategy towards tightening. It should be recalled here that at the last meeting, the central bank discussed the idea of a 75-point rate increase, but this initiative did not find support from the majority of Committee members. According to Fed Chairman Jerome Powell, the central bank "did not actively discuss" this proposal. That is, he made it clear that the option itself was not completely rejected – everything will depend on the incoming data. Therefore, the latest trends, which indirectly indicate a further increase in inflation, support the US currency. In addition, the demand for a safe greenback is also growing amid rising anti-risk sentiment, due to ongoing geopolitical tensions and the growing energy crisis, which is becoming clearer (the emergency regime in the United States is eloquent evidence of this). But it should be emphasized here that all of the above assumptions that the Fed will resort to more aggressive actions are indirect and hypothetical. None of the Fed members has yet changed their point of view (at least in the public plane) towards a 75-point rate hike in June or July. Therefore, in my opinion, the dollar's current growth is emotional, situational and, accordingly, unreliable. Given this circumstance, it is advisable to go into short positions only after EUR/USD bears overcome the support level of 1.0620 (the middle line of the Bollinger Bands indicator on the daily chart). In this case, the next downward target is the 1.0550 mark – this is the Kijun-sen line on the same timeframe. In any case, longs for the pair look too risky, especially ahead of the European Central Bank's June meeting (Thursday) and the release of data on the growth of the US consumer price index (Friday). The material has been provided by InstaForex Company - www.instaforex.com |
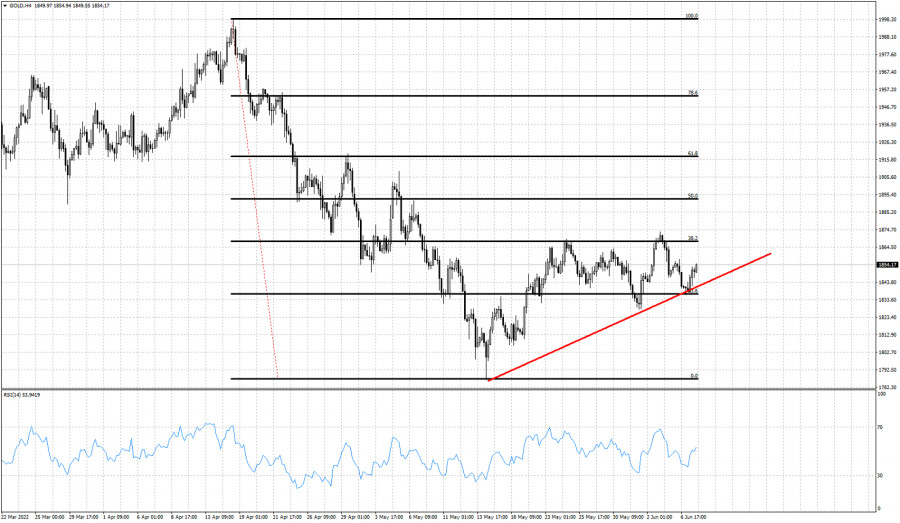
| Gold reclaims $1,850 and hopes for a move towards $1,900 are renewed. Posted: 07 Jun 2022 01:22 PM PDT
Black lines - Fibonacci retracements Red line -support Gold price continues making higher highs and higher lows. Gold price recently lost $1,850 and tested the next immediate support at $1,840. Despite the pull back, Gold price did not break the important low at $1,827. Gold price has formed a higher low. This setup is bullish and will confirm a new bullish signal if price breaks above recent highs. Gold price has support at recent low at $1,836 where we also find the upward sloping red support trend line. Resistance remains key at the 38% Fibonacci retracement where we have seen so far two tests and two rejections. As long as Gold price holds above the support trend line, then we should expect to see a break above the 38% level and a push towards $1,900-$1,910. The material has been provided by InstaForex Company - www.instaforex.com |
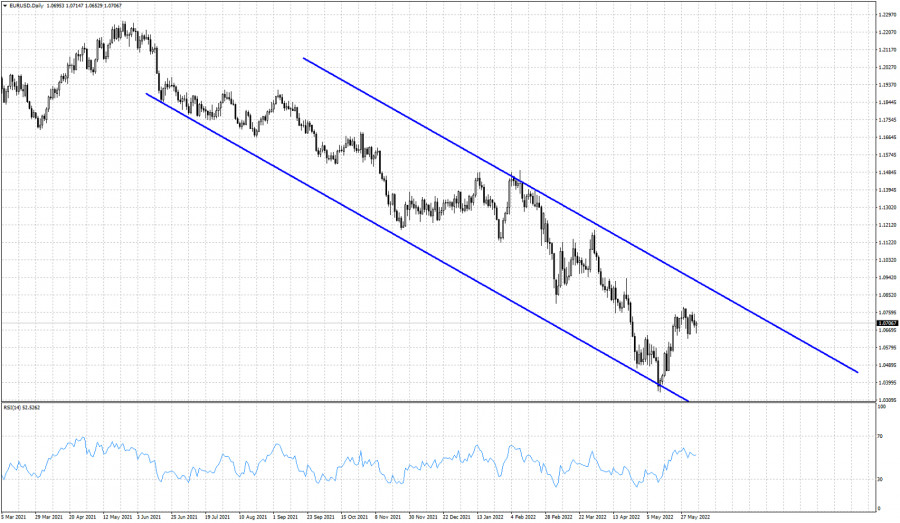
| EURUSD Daily candle gives hopes to bulls. Posted: 07 Jun 2022 12:55 PM PDT
Blue lines -bearish channel EURUSD is trading above 1.07 once again. Today's Daily candle is a glimpse of hope for bulls as price moved as low as 1.0652 but is now trading near its daily highs. EURUSD has formed a higher low relative to the 1.0627 low a few days earlier. Although price remains inside the medium-term bearish channel, there is potential for a move towards the upper boundary near 1.0920. As long as price is above 1.0627 we remain optimistic that bulls will challenge the upper channel boundary. The material has been provided by InstaForex Company - www.instaforex.com |
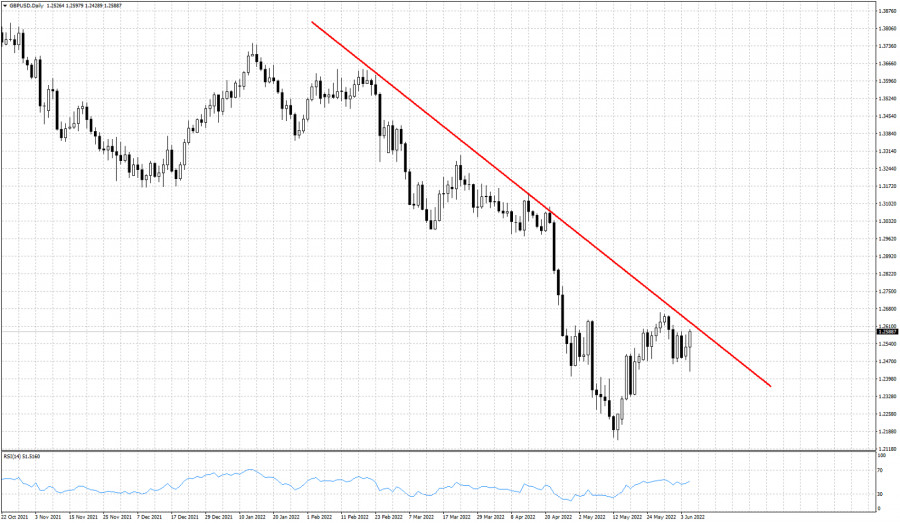
| Short-term technical analysis on GBPUSD gives hopes to bulls. Posted: 07 Jun 2022 12:50 PM PDT
Red line -resistance trend line GBPUSD is trading around 1.2595 still below the key downward sloping resistance trend line. As long as price is below this trend line, GBPUSD is vulnerable to more downside. So far price pulled back towards 1.2428 but on a daily basis we see today's candle as a possible reversal to the upside candle. Price has formed a higher low which is important in order to build a bullish setup. If bulls manage to break above the red resistance trend line at 1.2630, then we will get a new bullish signal that could eventually push price towards 1.2950. Support remains at today's low. Bulls do not want to see price below this level. Breaking below this level will increase chances of a rejection and a move to new lows. The material has been provided by InstaForex Company - www.instaforex.com |
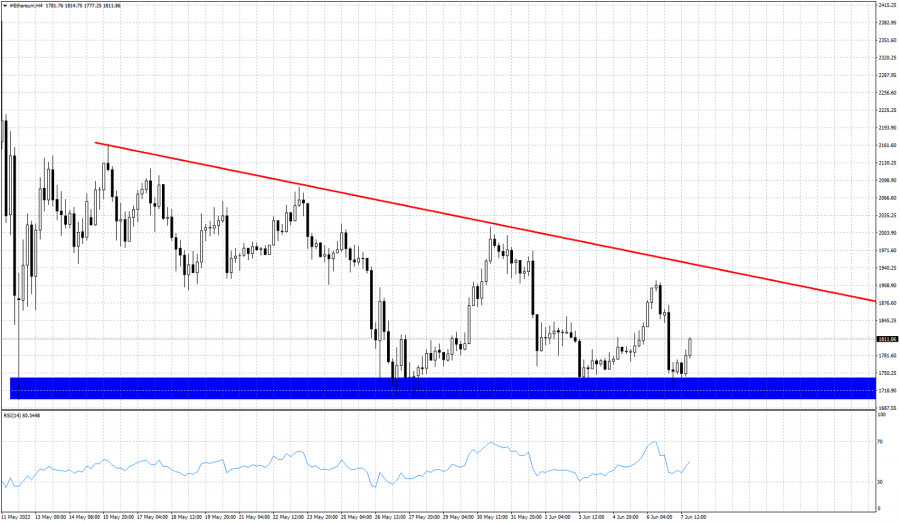
| Ethereum respects key support and bounces higher. Posted: 07 Jun 2022 12:45 PM PDT
Red line - resistance trend line Blue rectangle - horizontal support In our previous analysis on Ethereum, we noted the importance of the $1,700 horizontal support level. Price recently tested this level once again and it was respected. Price is now bouncing higher at $1,845 with potential to reach $1,910. A descending triangle pattern has been formed. The resistance in the 4 hour chart is shown by the red downward sloping trend line. Bulls need to break above this resistance trend line in order to hope for the start of a new upward move. As long as price remains below the red trend line resistance, the chances favor a downward break below $1,700 support. Until then traders need to be patient as there is still plenty of room inside the triangle pattern for price to continue moving sideways. The material has been provided by InstaForex Company - www.instaforex.com |
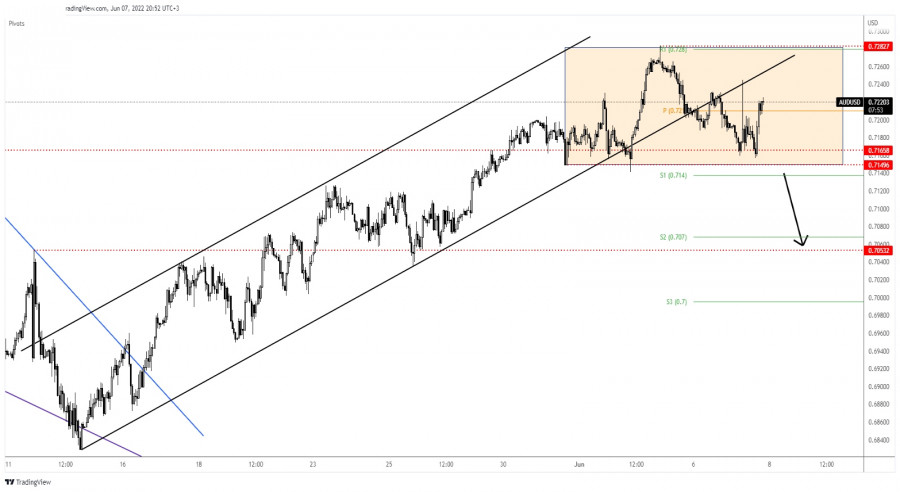
| AUD/USD still bullish post RBA Posted: 07 Jun 2022 12:09 PM PDT The AUD/USD pair plunged after reaching 0.7244. It has dropped to as low as 0.7162 where it has found support. It was traded at 0.7216 at the time of writing. Technically, the price action developed a range pattern. Escaping from this formation could bring fresh opportunities. As you already know, the Reserve Bank of Australia increased the Cash Rate from 0.35% to 0.85% above 0.60% expected. Technically, the bias remains bullish, so the rate could come back higher. Fundamentally, the sentiment could change after the US inflation data publication on Friday. AUD/USD new range pattern
AUD/USD is trapped between 0.7149 and 0.7282 levels. In the short term, it could continue to move sideways. Dropping below the uptrend line, the price was somehow expected to develop a strong drop. Still, as long as it stays above the 0.7149 key support, the bias remains bullish. The price could come back higher o test and retest the near-term resistance levels before bringing new opportunities. AUD/USD forecastA new higher high, a valid breakout through the 0.7282 brings new long opportunities and signals further growth. This scenario could take shape if the Dollar Index drops deeper. Staying below 0.7282 and under the uptrend line followed by a new lower low, a valid breakdown below 0.7149 could activate a larger drop and could bring new short opportunities. The material has been provided by InstaForex Company - www.instaforex.com |
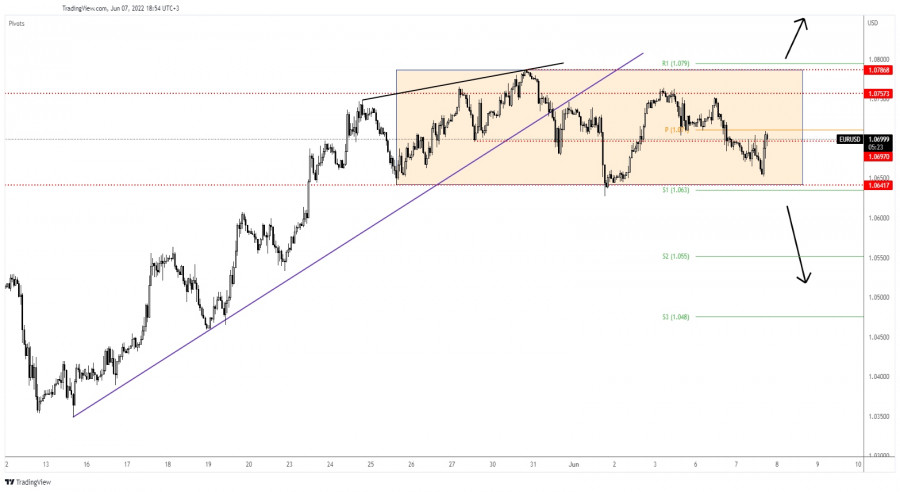
| Posted: 07 Jun 2022 09:59 AM PDT The EUR/USD pair rebounded as the Dollar Index plunged after reaching strong resistance levels. In the short term, the currency pair continues to move sideways, and only escaping from the current range could bring new trading opportunities. Surprisingly or not, the EUR/USD pair bounced back despite the German Factory Orders dropped by 2.7% versus 0.4% growth expected, while the US Trade Balance came in better than expected at -87.1B versus -89.6B forecasts. Fundamentally, the ECB and the US inflation publication could really shake the markets at the end of the week. EUR/USD rebound
Technically, the EUR/USD pair failed to reach 1.0641 key support and now it tries to come back higher. It is trapped between 1.0757 and 1.0641 levels. Personally, I'll wait for the rate to escape from this range before I'll take action. After dropping below the uptrend line, the EUR/USD pair was somehow expected to develop a strong downside movement but unfortunately, the rate failed to make a new lower low. EUR/USD forecastThe EUR/USD pair could activate a larger drop if it makes a new lower low. A valid breakdown below 1.0641 brings new selling opportunities. The material has been provided by InstaForex Company - www.instaforex.com |
| Posted: 07 Jun 2022 09:08 AM PDT
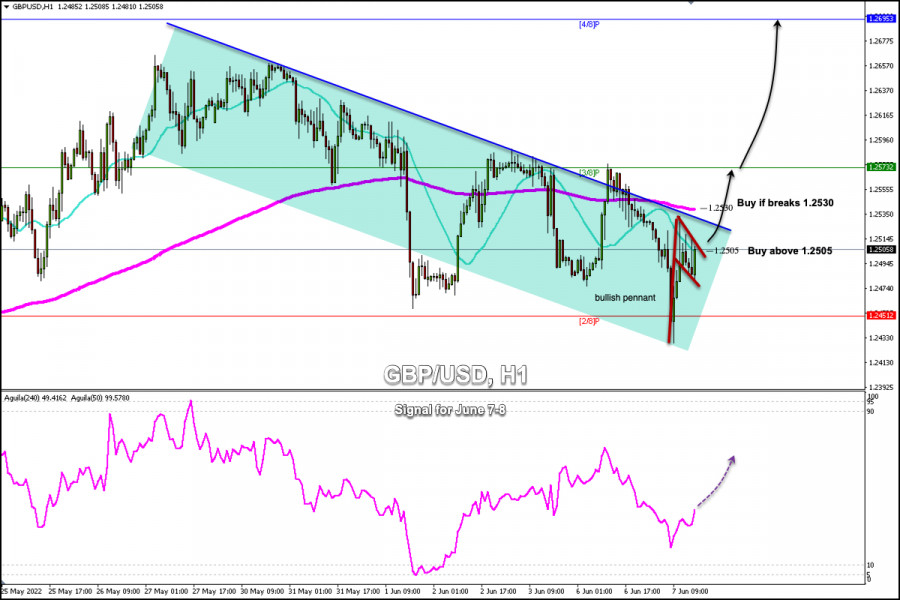
The British Pound vs. US Dollar (GBP/USD) is bouncing back after falling to lows on May 19 at 1.2429 in the European session. Early in the American session, the pound was trading around the key level of 1.2500, this level coincides with the 21 SMA on 1-hour charts. A little further up we can see the 200 EMA located at 1.2530 which could exert bearish pressure and become a resistance, only if it fails to break or consolidate above this level. In the chart above, we can see the formation of a bullish pennant technical pattern. This pattern has a bullish target, the projection is equal to the distance of the size of the flagpole. Therefore, a break and consolidation above 1.2500 could reach the zone 3/8 Murray at 1.2573 -1.2590. Escalating political tensions in the UK could hamper demand for the GBP/USD pair and it could drop again. Yesterday, British Prime Minister Boris Johnson avoided the vote of no confidence. 148 deputies voted against Johnson, while 211 lawmakers voted for him. The market risk sentiment is changing rapidly, this is seen with the fall in US bond yields and the weakness of the US dollar. This negative trend could favor the British pound and manage to consolidate above 1.26 and even reach 4/8 Murray at 1.2695. Our trading plan for the next few hours is to buy the British pound above 1.2505 (21 SMA) or wait for a sharp break above the 200 EMA at 1.2530, with targets at 1.2573 (3/8), 1.26 and 1.2695 (4 /8). The eagle indicator is showing a positive signal which supports our bullish strategy. The material has been provided by InstaForex Company - www.instaforex.com |
| Stock markets continue to plunge Posted: 07 Jun 2022 07:10 AM PDT
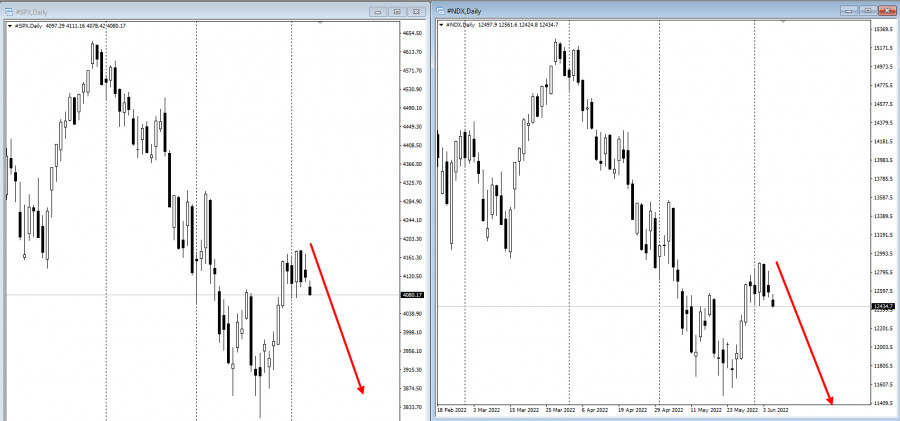
US stock futures fell on Tuesday as risk aversion sentiment gripped markets amid fears that the central bank's tight monetary policy will undermine economic growth. The dollar rose and Treasury yields stabilized. The S&P 500 and Nasdaq 100 futures contracts dropped by at least 1% and continue declining as Treasury yields hovered at their highest levels in nearly a month. Investors are reluctant to take the risk amid fears that the policy to combat inflation will get out of control and stifle economic recovery.
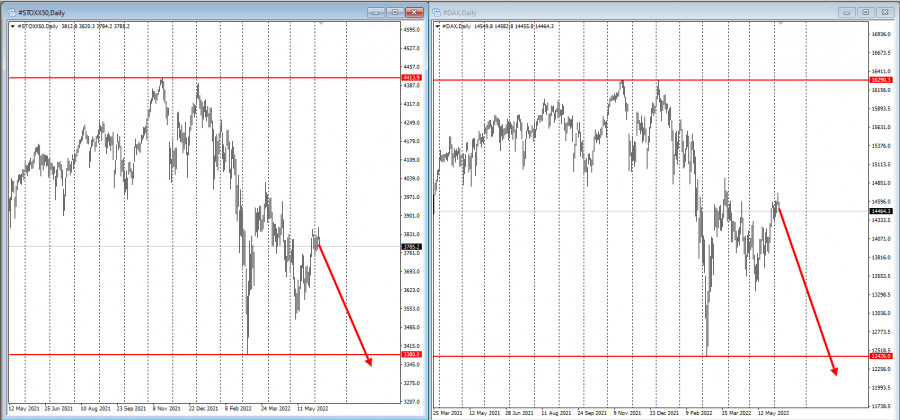
The Stoxx50 index fell as shares of telecom and technology companies were considered. Target Corp. stock went down in the premarket after the retailer cut its profit outlook for the second time in three weeks amid an inventory surplus.
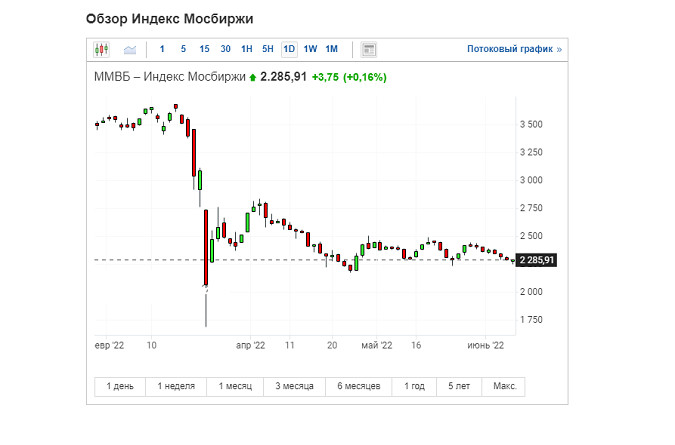
Rising bond yields are adding to concerns about risks to economic growth as central banks start tightening their monetary policy. US benchmark Treasury yields stabilized near 3%, a psychological threshold that could burden new supply this week ahead of important inflation data. The US Consumer Price Index for May will be released on Friday. It will help traders discern the Fed's rate path and whether the interest rate will continue to hike in 50-basis point increments. Strong hiring data last week provided some justification for the central bank's aggressive approach. The European Central Bank is likely to announce on Thursday that it will end its asset purchases and cement the path to exiting from eight years of negative interest rates. Earlier, the Reserve Bank of Australia stunned the market with an outsized hike to combat rising costs. The RBA responded to price pressure with its biggest rate increase in 22 years predicted by just three of 29 economists and indicated that it remained committed to "doing what is necessary" to rein in inflationary pressures. The Moscow Exchange Index continues to gradually decline amid Western sanctions:
Key events to watch this week::
|

| You are subscribed to email updates from Forex analysis review. To stop receiving these emails, you may unsubscribe now. | Email delivery powered by Google |
| Google, 1600 Amphitheatre Parkway, Mountain View, CA 94043, United States | |


Comments