Forex analysis review
Forex analysis review |
- EUR/USD analysis on June 25. The week ended as it should.
- Analysis of the trading week of June 20-24 for the GBP/USD pair. COT report. The pound did not understand what to do with
- Analysis of the trading week of June 20-24 for the EUR/USD pair. COT report. The dollar was not inspired by Powell's promises
- Technical analysis of BTC/USD for June 24, 2022
- June 24, 2022 : EUR/USD daily technical review and trading opportunities.
- June 24, 2022 : EUR/USD Intraday technical analysis and trading plan.
- June 24, 2022 : GBP/USD Intraday technical analysis and significant key-levels.
- Trading Signal for USD/JPY on June 24-27, 2022: sell below 135.07 (downtrend channel - 21 SMA)
- EUR/USD retests sellers, bearish bias intact
- Bitcoin signals exhausted buyers
- GBP/USD in neutral zone
- USD/JPY. Profitable configuration: downward price pullbacks can be used to open longs
- Trading Signal for Gold (XAU/USD) on June 24-27, 2022: buy above $1,825 (21 SMA - downtrend channel)
- Gold: uside could be invalidated
- Trading plan for Litecoin on June 24, 2022
- Has Bitcoin hit bottom?
- The main Asian indicators are adding 0.32-1.85%
- Trading plan for Dogecoin on June 24, 2022
- Trading plan for Bitcoin Cash on June 24, 2022
- Trading plan for Ripple on June 24, 2022
- Trading plan for Ethereum on June 24, 2022
- Trading plan for Bitcoin on June 24, 2022
- Trading plan for USDMXN on June 24, 2022
- Trading plan for USDZAR on June 24, 2022
- US pre-market trading on June 24, 2022. Traders continue to buy up tech stocks
| EUR/USD analysis on June 25. The week ended as it should. Posted: 25 Jun 2022 02:20 AM PDT
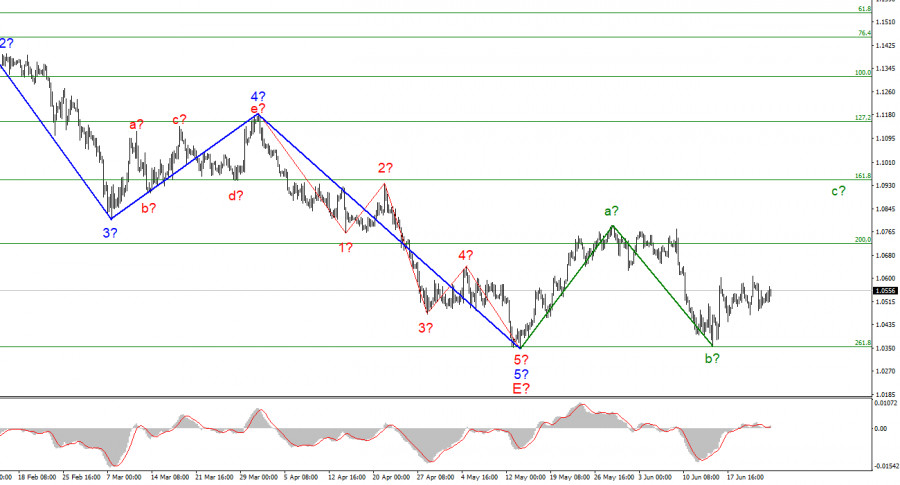
The wave marking of the 4-hour chart for the euro/dollar instrument continues to look convincing and does not require adjustments. The instrument has completed the construction of a downward trend segment. If the current wave marking is correct, then at this time the construction of a new upward trend section has begun. It can turn out to be three-wave, or it can be pulsed. At the moment, two waves of a new section of the trend are visible. Wave A is completed, and wave b is also presumably completed. If this is indeed the case, then the construction of an upward wave has now begun. The instrument has not declined under the low of the downward trend section, so the wave marking still retains its integrity. However, I note that the downward section of the trend may complicate its internal wave structure and take a much more extended form. Unfortunately, a very promising wave markup may be broken due to the news background, which led to a strong decline in demand for the euro currency. But at the moment, the chances of building an upward wave c remain. Only the news background can interfere.It's been a boring week.The euro/dollar instrument rose by 30 basis points on Friday. Market activity was very low. Let me remind you that on Monday and Tuesday, there was practically no news for the euro and the dollar. The same pattern was observed on Friday when the most important report of the day was the consumer sentiment index from the University of Michigan. Market expectations were low, but the value of the report was even lower – only 50.0. At the beginning of 2020, it was more than 100 points, and a year ago it was about 80. Thus, now we are seeing the lowest value in the entire history of the study of this indicator (more than 60 years). Although the indicator itself is not important, still its decline by historical lows says something. The market against the background of this index slightly lowered the dollar, but very slightly.The most important events of the week – Jerome Powell's speeches in Congress also did not attract the attention of the market. Powell repeats the same statements from time to time, so the market simply sees no reason for itself to win back the same thing every time. It is now obvious to everyone that the Fed's interest rate will rise no matter what. One can also recall the indices of business activity in the fields of production and services (as well as composite indices) for the EU and the USA. All six indices declined in June, indicating a noticeable drop in business activity. But since the indices fell both in the US and in the European Union, neither the euro nor the dollar could benefit from these data. As a result, we got a week when the instrument moved horizontally for all five days. The wave markings did not change at all, because there were no movements as such. Therefore, I continue to expect the construction of an ascending wave, according to the current wave markup. The euro currency is difficult, but it still has a chance to grow to 8 figures.General conclusions.Based on the analysis, I conclude that the construction of the downward trend section is completed. If so, then now you can buy a tool with targets located near the estimated mark of 1.0947, which equates to 161.8% Fibonacci, for each MACD signal "up". Wave b is presumably completed. An unsuccessful attempt to break through the level of 261.8% indicates that the market is not ready for new sales of the instrument.
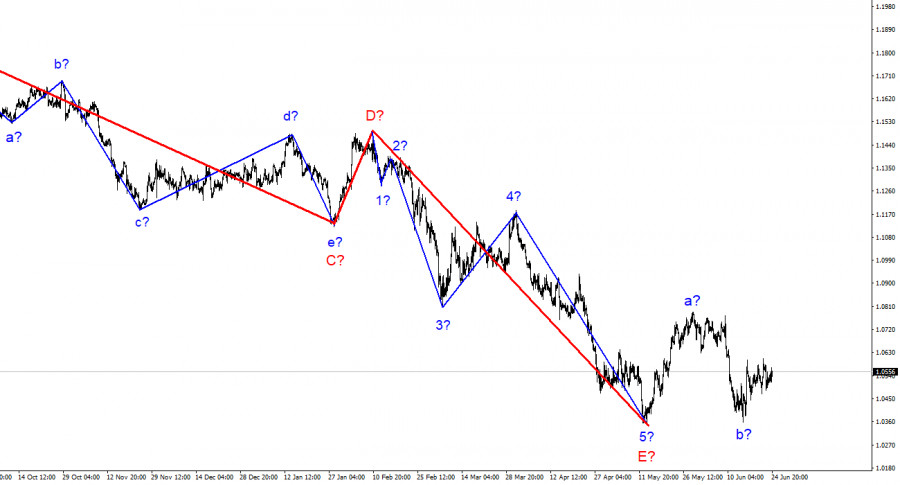
On a larger scale, it can be seen that the construction of the proposed wave E has been completed. Thus, the entire downward trend has acquired a complete look. If this is indeed the case, then in the future for several months the instrument will rise with targets located near the peak of wave D, that is, to the 15th figure. The material has been provided by InstaForex Company - www.instaforex.com |
| Posted: 25 Jun 2022 01:28 AM PDT Long-term perspective.
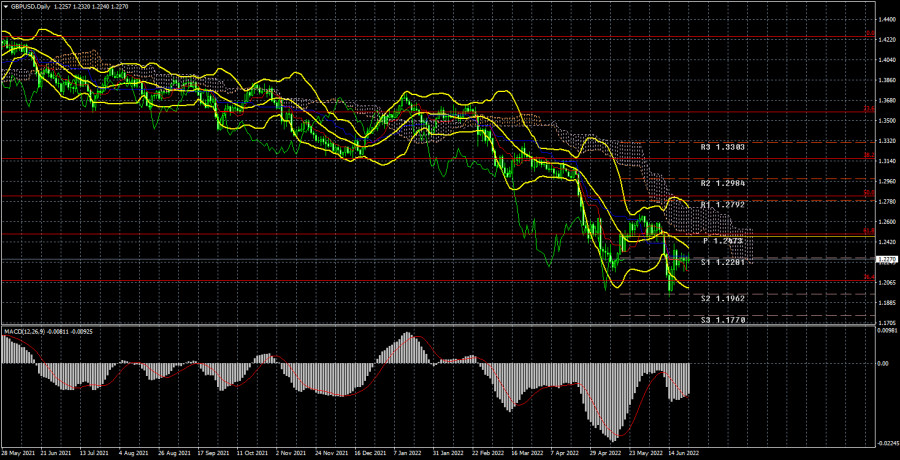
The GBP/USD currency pair has gained 40 points during the current week. In general, the pair was practically immobilized all week and was strictly under the critical line. Thus, the euro and the pound once again showed that they are trading almost identically. The only difference is that the euro is near its 20-year lows, and the pound is near 2-year lows. As you can see, even the fact that the Bank of England has already raised the key rate five times does not play any role for traders. We have already said in previous articles that this is most likely because the market is now completely focused on the US, the Fed, and the US currency, and practically ignores the other factors. That is, formally, the British currency now has grounds for growth, but they do not play any role now. Thus, we can only draw the same conclusion as before: the pound can show corrective, technical growth, but no more. As you can see, it has the same big problems when trying to overcome the critical line – the first obstacle on the way to the formation of a new trend. Not to mention something more. Jerome Powell's speeches in Congress this week only lowered the likelihood of a rise in the pound. Powell once again made it clear that the rate will continue to grow, at a much higher rate than those planned and expected at the beginning of the year. And the US business activity indices, which have already fallen to almost 50.0, did not provoke a dollar sell-off. COT analysis. The latest COT report on the British pound again showed insignificant changes. During the week, the Non-commercial group closed 0.8 thousand buy contracts and 3.2 thousand sell contracts. Thus, the net position of non-commercial traders increased by 2.4 thousand. However, the mood of the major players remains "pronounced bearish". And the pound, despite the growth of the net position, still cannot start an upward trend. The net position has been falling for 3 months, which is perfectly visualized by the green line of the first indicator in the illustration above or the histogram of the second indicator. Therefore, two or three insignificant increases in this indicator hardly unambiguously indicate the end of the downward trend in the pound. The Non-commercial group has now opened a total of 92 thousand sales contracts and only 28 thousand purchase contracts. As you can see, the difference between these numbers is more than three times. Thus, in the case of the pound, the demand for the dollar remains high, and the demand for the pound itself remains low. What to expect from the pound/dollar pair with such input data? Moreover, we can see that neither macroeconomic statistics nor fundamental events support the UK currency. We can only count on corrective growth, but we believe that sooner or later the global downward trend will resume. Analysis of fundamental events. This week, business activity indices in the service and manufacturing sectors were published in the UK, which, admittedly, turned out to be better than in the US or the European Union. But not much better. Their values do not allow us to conclude that everything is fine in Britain now and there is no negative trend. Rather, on the contrary: business activity is also falling, just a little less quickly than in the United States or the European Union. And the report on British inflation showed that prices are growing at the same pace, even a little faster than a month earlier, and the indicator itself does not pay any attention to all the efforts of the Bank of England. Inflation rose to 9.1% y/y, which was exactly in line with forecasts. Therefore, the pound probably did not show a strong reaction to this report. Recall that traders like to react when the actual value of an important report does not coincide with the forecast. Nevertheless, the inflationary trend in the UK is even worse than in the States or in Europe. Inflation is higher, and all the efforts of the regulator pass "by the cash register". Trading plan for the week of June 27-July 1: 1) The pound/dollar pair has started a new round of corrective movement, but there is still very little chance of a new uptrend. The pair could not work out the Senkou Span A line, and could not overcome Kijun-sen. Thus, purchases are not relevant now, and they can be considered no earlier than fixing the price above the Ichimoku cloud. The pair retains theoretical chances of growth, but the pound's position and the aggressiveness of the bulls are not at the level to be sure of growth. 2) The pound sterling, we can say, resumed the downward trend, as it consolidated below the critical line. Formally, a sideways correction could begin on the 24-hour TF, which is popularly called a "swing" or flat, but so far everything looks as if the fall will continue. Currently, sales with targets of 1.2080 and 1.1410 (76.4% and 100.0% by Fibonacci) are relevant. Explanations of the illustrations: Price levels of support and resistance (resistance /support), Fibonacci levels - target levels when opening purchases or sales. Take Profit levels can be placed near them. Ichimoku indicators (standard settings), Bollinger Bands (standard settings), MACD (5, 34, 5). Indicator 1 on the COT charts - the net position size of each category of traders. Indicator 2 on the COT charts - the net position size for the "Non-commercial" group. The material has been provided by InstaForex Company - www.instaforex.com |
| Posted: 25 Jun 2022 01:28 AM PDT Long-term perspective.
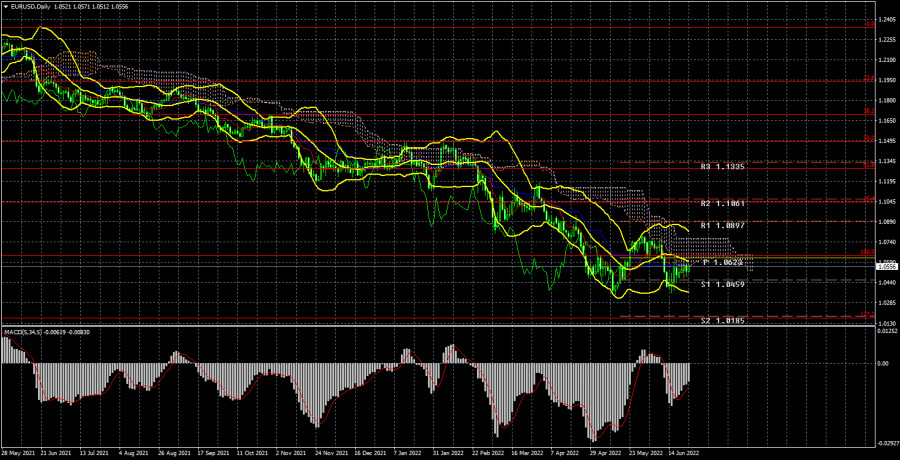
The EUR/USD currency pair has increased by 70 points during the current week. Is it worth saying that this is very little both in terms of volatility and in terms of currency growth? At the same time, the pair openly stood in one place all week, which is especially clearly visible just on the 24-hour TF. Although a week earlier the pair was trading near the critical line, that is, it could overcome it or bounce off it, nothing like this happened this week. Thus, it is simply impossible to draw any new technical conclusions. The global downward trend persists and there is still no sign that an upward trend can begin. Recall that it will be possible to seriously expect an upward trend only after overcoming the Ichimoku cloud. The Ichimoku indicator itself is already trying its best to help the pair, as its lines decrease over time (tend to the price). However, even this does not help the European currency to show at least some growth. Thus, we believe that the euro will continue to fall in the medium term. In the perspective of one or two weeks, the strained growth of the euro may take place, but it will be exclusively a corrective growth. Moreover, this week Jerome Powell assured the US Congress that reducing inflation to 2% remains the main goal of the regulator. The Fed is even ready to neglect the growth of the American economy. And this means that the rates will continue to rise. And any tightening of monetary policy is always a support factor for the currency. At the same time, the ECB continues to take the most passive position. Christine Lagarde has promised to raise rates twice this year, but this approach does not change anything at all in the balance of power between the dollar and the euro. It means that the maximum rate will be 0.5%. The Fed's rate is already 1.75%. COT analysis. The latest COT reports on the euro currency raised a huge number of questions. Recall that in the last few months they have shown a frank "bullish" mood of professional players, but at the same time, the European currency has been falling all the time. At this time, the situation is beginning to change, and again, not in favor of the euro currency. If earlier the mood was "bullish", but the euro was falling, now the mood has become "bearish". What can we expect from the euro in this case? The question is rhetorical. During the reporting week, the number of buy contracts decreased by 11.4 thousand, and the number of shorts from the "Non-commercial" group decreased by 1.8 thousand. Thus, the net position fell again, this time by almost 10 thousand contracts. From our point of view, this fact very eloquently indicates that now even major players do not believe in the euro currency. The number of buy contracts is now lower than the number of sell contracts for non-commercial traders by 16 thousand. Consequently, we can state that now not only the demand for the US dollar remains high, but also the demand for the euro is gradually decreasing. This may lead to a new, even greater fall in the euro currency. In principle, over the past few months or even more, the euro has not been able to show even a strong correction, let alone something more. Its maximum upward movement was about 400 points. All fundamental, geopolitical factors remain in favor of the US dollar. Analysis of fundamental events. During the current week, there has not been a single important or even interesting event in the European Union. Traders could only pay attention to the business activity indices, which managed to fall in June almost to the critical level of 50.0. Their decline has been observed for a long period and, if things continue like this, they will go below the "waterline". In fairness, it should be noted that not everything is good with these indicators in the United States, as business activity indices have fallen even lower than in the European Union. This suggests that both economies are going through hard times right now. But, recall that in the States, the Fed is doing everything to make the economy "cool down", and does it specifically within a certain goal, while in the European Union, the ECB has not even started raising the rate yet, and the economy is already showing that it is hurting and bad. Thus, the ECB simply does not have room for maneuver, therefore the US currency still has a big advantage. Trading plan for the week of June 27-July 1: 1) On the 24-hour timeframe, the pair stopped just a step away from the minimum for the last 20 years - 1.0340, but it could not move away from it in recent weeks. Almost all factors still speak in favor of the long-term growth of the US dollar. Traders failed to overcome the Ichimoku cloud, so the upward movement and purchases of the euro currency are still not relevant. You need to wait, at least, to overcome the Senkou Span B line, and only after that consider buying the euro currency. 2) As for the sales of the euro/dollar pair, they are still more relevant now. The price has fixed back below the critical line, so we have a new sales signal at our disposal with a target of 1.0172 (127.2% Fibonacci), which is already below 20-year lows. The signal will be canceled if the pair is fixed above the Kijun-sen line. Explanations of the illustrations: Price levels of support and resistance (resistance /support), Fibonacci levels - target levels when opening purchases or sales. Take Profit levels can be placed near them. Ichimoku indicators (standard settings), Bollinger Bands (standard settings), MACD (5, 34, 5). Indicator 1 on the COT charts - the net position size of each category of traders. Indicator 2 on the COT charts - the net position size for the "Non-commercial" group. The material has been provided by InstaForex Company - www.instaforex.com |
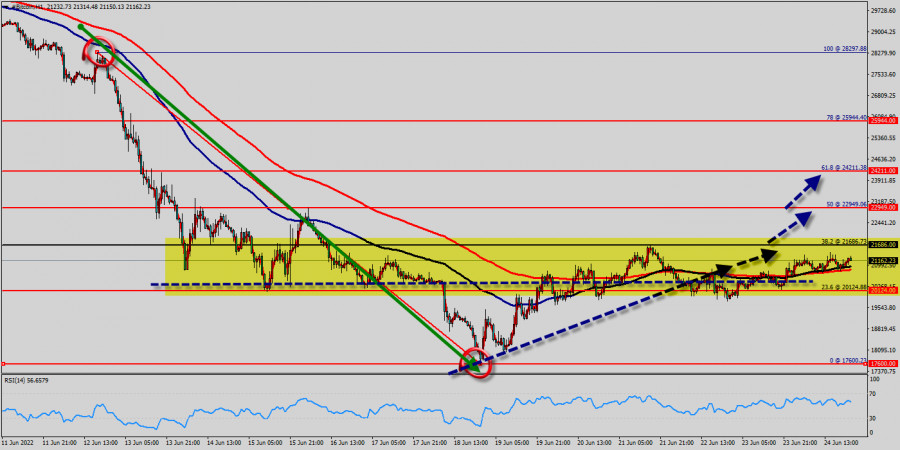
| Technical analysis of BTC/USD for June 24, 2022 Posted: 24 Jun 2022 02:19 PM PDT
We expect to see a strong reaction off this level to push price up towards $21,686 before $22,949 resistance (horizontal swing high resistance). RSI is seeing major support above 60% and a bullish divergence vs price also signals that a reversal is impending. According to the previous events the price is expected to remain between $20k and $23k levels (around $3000). Profit target reached perfectly once again, prepare for a bounce from the area of $21,200. Buy-deals are recommended above $21,200 with the first target seen at $21,686. The movement is likely to resume to the point $22,949 and further to the point $23k. Moreover, in larger time frames the trend is still bullish as long as the level of $20k is not breached. A daily closure above $23k allows the pair to make a quick bullish movement towards the next resistance level around $24k. Trading recommendations : The trend is still bullish as long as the price of $20k is not broken. Thereupon, it would be wise to buy above the price of at $20k or $21k with the primary target at $22k. Then, the BTC/USD pair will continue towards the second target at $23k (a new target is around $24k in coming days). As we know (23/06/2022) : 1 BTC ---> $21,295 approximately 1 ETH ---> $1,222 approximately So, 1 ETH ---> 0.0573 BTC. One Ethereum is only worth 0.0573 Bitcoin. Conclusion : BTC/USD increased within an uptrend channel from the prices of $420k and $21k since a week. The bulls must break through $21,686 in order to resume the uptrend. The material has been provided by InstaForex Company - www.instaforex.com |
| June 24, 2022 : EUR/USD daily technical review and trading opportunities. Posted: 24 Jun 2022 11:01 AM PDT
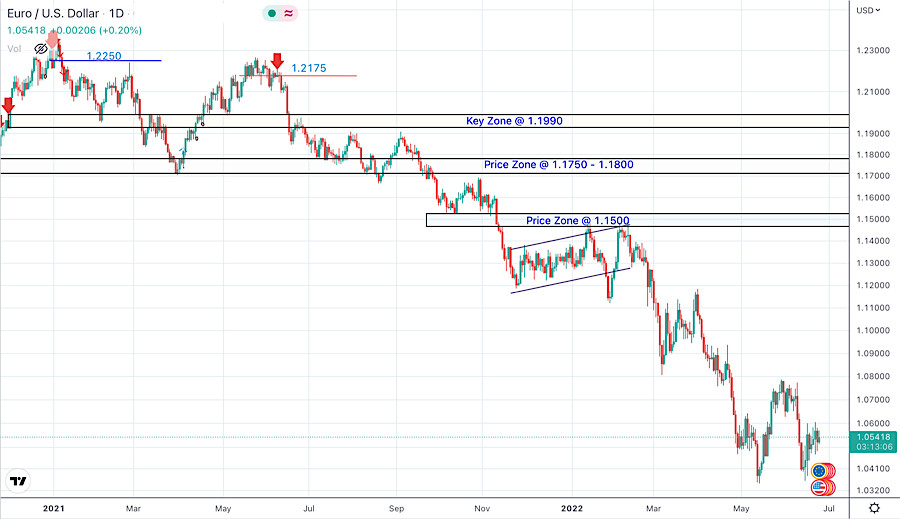
In late September, Re-closure below the price level of 1.1700 has initiated downside-movement towards 1.1500 where some recovery was witnessed. Shortly after, Price levels around 1.1700 managed to hold prices for a short period of time before another price decline took place towards 1.1200. Then the EURUSD has temporarily moved-up within the depicted movement channel until downside breakout occurred recently. Since then, the price zone around 1.1500 has applied significant SELLING pressure when a valid SELL Entry was offered upon the previous ascending movement towards it. Shortly after, the EURUSD looked oversold while approaching the price levels of 1.0800 few weeks ago. That's where the recent upside movement was previously initiated. However, the recent movement towards 1.1200 was considered for another SELL Trade which is already running in profits now. The previous ascending movement above 1.0600 enabled further advancement towards 1.0800 where bearish rejection could be applied again. The material has been provided by InstaForex Company - www.instaforex.com |
| June 24, 2022 : EUR/USD Intraday technical analysis and trading plan. Posted: 24 Jun 2022 11:00 AM PDT
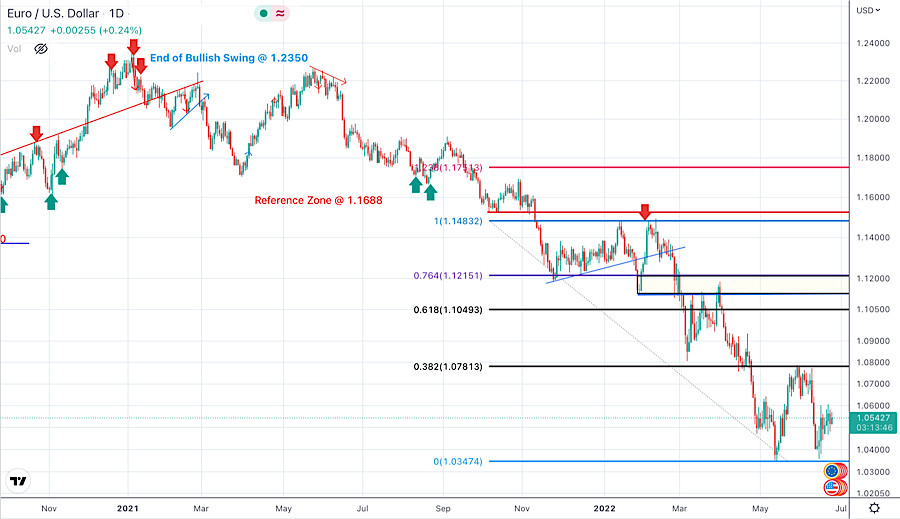
The EURUSD looked oversold while approaching the price levels of 1.0800. That's when a temporary upside movement was approaching the price levels around 1.1200. The recent movement towards 1.1200 was suggested for another SELL opportunity which already reached its targets beyond the price level of 1.0400. The previous ascending movement above 1.0600 enabled further advancement towards 1.0800 where evident bearish rejection arises again. On the other hand, the pair remains trapped under selling pressure to challenge the recent daily low around 1.0350 until breakout occurs in either direction. The material has been provided by InstaForex Company - www.instaforex.com |
| June 24, 2022 : GBP/USD Intraday technical analysis and significant key-levels. Posted: 24 Jun 2022 10:58 AM PDT
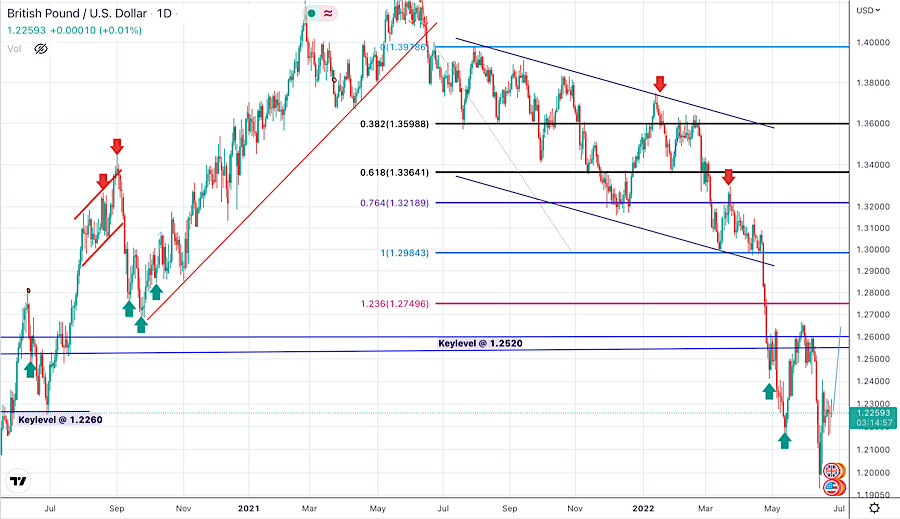
The short-term outlook turned bearish when the market went below 1.3600. This enhanced the bearish side of the market initially towards 1.3360 then 1.3200 which initiated a temporary bullish movement towards 1.3600 for a final re-test. The price level of 1.3600 corresponding to the upper limit of the ongoing bearish channel initiated an aggressive bearish movement towards 1.2980 - 1.3000. The price level of 1.3000 stood a transient Support where a short-term consolidation movement existed. This happened just before two successive bearish dips could take place towards 1.2550 and 1.2160. Considerable bullish rejection was expressed around 1.2200. However, the pair failed to persist above 1.2550. This was needed to abolish the short-term bullish scenario for sometime. Instead, a quick bullish movement was executed towards 1.2650 where extensive bearish rejection existed. The GBP/USD pair remained under bearish pressure to challenge the new low around 1.2150 again which was temporarily bypassed. Immediate bullish rejection brought the pair back above 1.2150 again. Bullish persistence above 1.2300 will probably enable further bullish continuation towards 1.2650 where further decisions can be taken. On the other hand, another bearish visit may be expected to challenge 1.1950 again if sufficient bearish momentum is expressed. The material has been provided by InstaForex Company - www.instaforex.com |
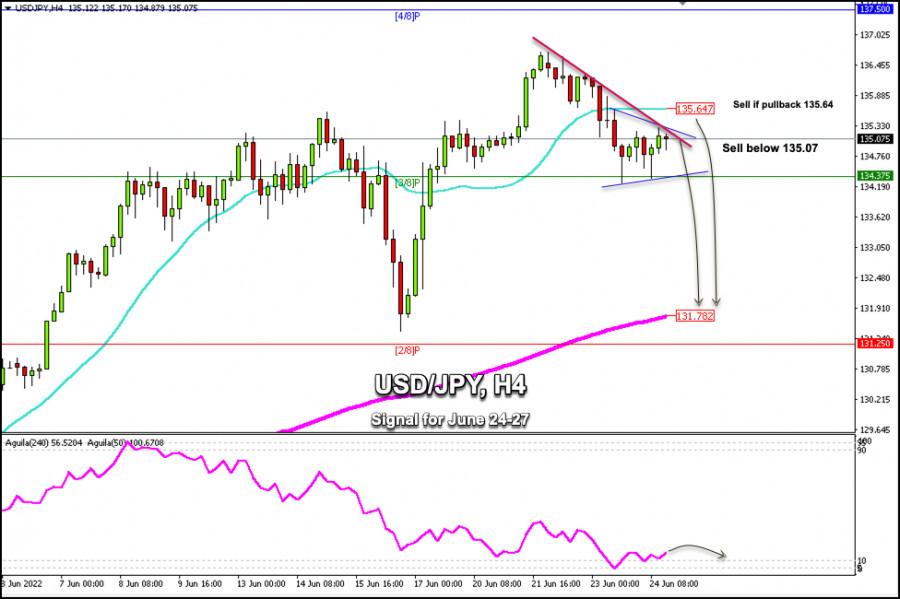
| Trading Signal for USD/JPY on June 24-27, 2022: sell below 135.07 (downtrend channel - 21 SMA) Posted: 24 Jun 2022 09:21 AM PDT
USD/JPY bounced back after hitting the 3/8 Murray support around 134.34. The pair rallied back above the psychological level of 135.00, but it is struggling to consolidate around this level as a bearish channel is in place there. The significant decline in commodity prices this week appears to have eased fears over persistently rising inflationary pressures and is boosting risk appetite. This will help the yen to strengthen and it could continue to advance next week and reach the 200 EMA located at 131.78 against the US dollar. On the other hand, the market sentiment is changing and the risk appetite is increasing as a consequence of the positive dynamics of the equity market. USD/JPY could take advantage of this market trend and strengthen, only if it consolidates below the 21 SMA located at 135.64. On the other hand, for the yen to resume its uptrend, we should expect a daily close above 135.70 as a result of which USD/JPY could hit 136.68, the June 21 high, and even hit 4/8 Murray at 137.50. In case the yen continues to depreciate, there is speculation that the BoJ could force some form of forex intervention that could limit the rise of the USD/JPY pair. According to the 4-hour chart, we can see that the yen has reached the top of the downtrend channel at around 135.30. Below this level, USD/JPY is expected to drop and reach 3/8 Murray at 134.35 and could accelerate the bearish move towards the 200 EMA located at 131.78. Alternatively, a pullback towards the 21 SMA located at 135.64 will be an opportunity to sell in the short term. The yen is likely to have a technical correction as it is showing overbought signs. There is a threat from the Bank of Japan to prevent the pair from rising further. Our trading plan for the next few hours is to wait for a pullback towards 135.64 or sell below 135.07 with targets at 134.37(3/8 Murray), 133.00, and 131.78 (200 EMA). The material has been provided by InstaForex Company - www.instaforex.com |
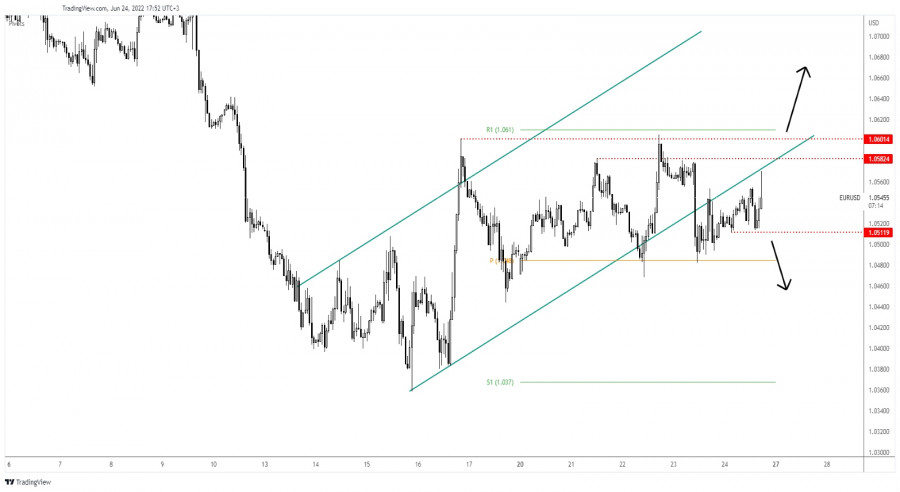
| EUR/USD retests sellers, bearish bias intact Posted: 24 Jun 2022 08:56 AM PDT The EUR/USD pair rallied in the last hours as the Dollar Index dropped again. The pair was trading at 1.0545 at the time of writing. In the short term, the price seems undecided, the Dollar Index is trapped within a range pattern. From the technical point of view, the EUR/USD pair could extend its sideways movement. Fundamentally, the German Ifo Business Climate came in at 92.3 points below 92.8 expected, while the Belgian NBB Business Climate dropped from 1.8 to -1.8 even, though traders expected a potential growth of 2.0%. Earlier, the US Revised UoM Consumer Sentiment dropped from 50.2 to 50.0 weakening the USD. The New Home Sales came in at 696K above 590K expected, but the greenback ignored the positive data and it has depreciated. EUR/USD Shap Movements!
EUR/USD escaped from the up-channel pattern signaling a potential sell-off. Unfortunately, the rate found support on the weekly pivot point of 1.0484 invalidating a new downside movement. Now, it has rebounded and it has retested the broken uptrend line which represents a dynamic resistance. As long as it stays under this line and below the 1.0582 - 1.0601 area, the EUR/USD could drop again. EUR/USD Forecast!A new lower low, dropping and closing below the 1.0511 could activate a downside movement at least until the weekly pivot point. This scenario could bring new short opportunities. Taking out the support represented by the pivot point of 1.0484 could confirm a larger drop. Only a new higher high, jumping and closing above the 1.0601 could bring new long opportunities. The material has been provided by InstaForex Company - www.instaforex.com |
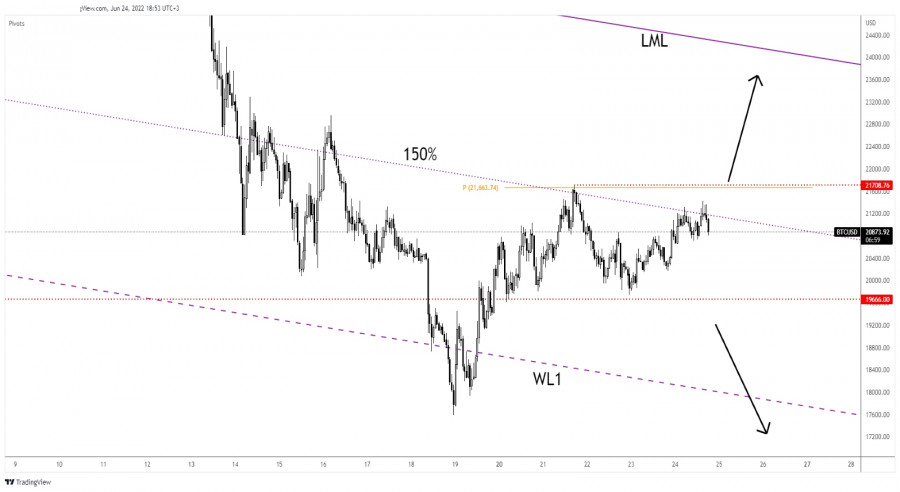
| Bitcoin signals exhausted buyers Posted: 24 Jun 2022 08:54 AM PDT Bitcoin is trading in the red at 20,937 on the H1 chart at the time of writing. BTC/USD dropped by 2.60% from today's high of 21,425 to 20,868 hourly lows. Technically, the bias remains bearish, the crypto could come back down anytime, that's why you have to be careful. BTC/USD is up by 2.38% in the last 24% and by 1.67% in the last 7 days. Still, the price action signaled exhausted buyers, so we cannot exclude a new sell-off. The current retreat formed the altcoins to drop. BTC/USD Bearish Bias!
BTC/USD reached the 150% Fibonacci line where it has found resistance. As you can see, the crypto registered only false breakouts above this dynamic resistance signaling that the rebound could be over. The weeky pivot point of 21,663 and the former high of 21,708 represents critical upside obstacles. The major support is represented by the 19,666 key level. In the short term, BTC/USD could move sideways. Bitcoin Forecast!A new higher high, a valid breakout above the 21,708 activates a broader growth towards the lower median line (LML). This could help the buyers to catch a new long opportunity. The material has been provided by InstaForex Company - www.instaforex.com |
| Posted: 24 Jun 2022 08:51 AM PDT
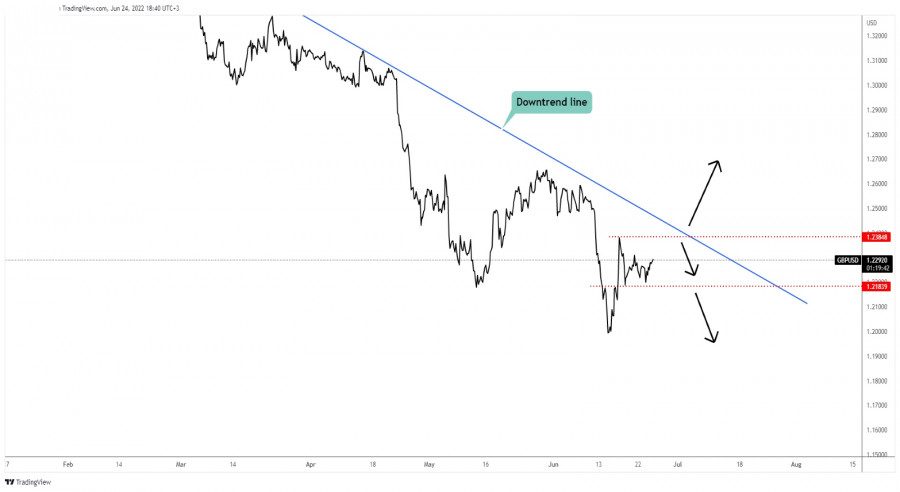
GBP/USD Minor Range Pattern!The GBP/USD pair is trapped between the 1.2384 and 1.2183 levels in the short term. The outlook remains bearish as long as it stays under the downtrend line, so the price could drop deeper if traded below this dynamic upside obstacle. In the short term, the rate could approach and reach the 1.2384 immediate high and the downtrend line. Testing and retesting these upside obstacles may signal a new downside movement. Only jumping and stabilizign above the downtrend line may signal that the downtrend is over and that the buyers could push the price higher. GBP/USD Trading Conclusion!Staying below the downtrend line and dropping below the 1.2183 formers low may activate more declines. This scenario could help the sellers to catch a downside continuation. The material has been provided by InstaForex Company - www.instaforex.com |
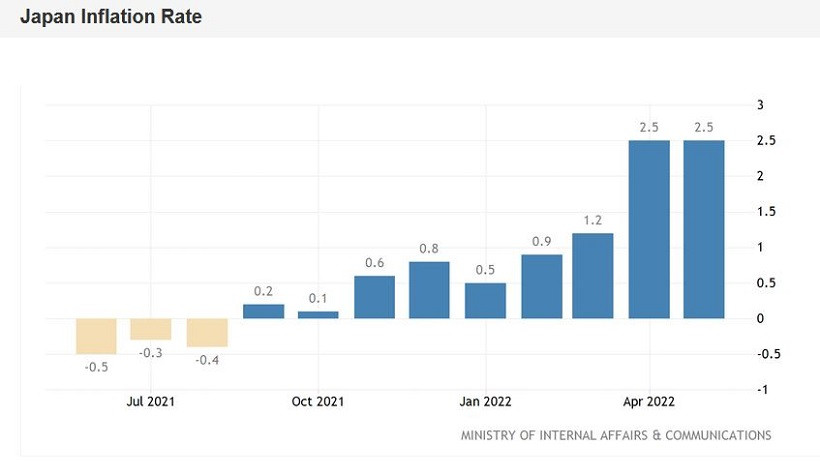
| USD/JPY. Profitable configuration: downward price pullbacks can be used to open longs Posted: 24 Jun 2022 08:30 AM PDT During the Asian session on Friday, Japan published key data on inflation growth for May. The data was released at the level of forecasts, confirming the positive dynamics of inflationary growth. But the Japanese currency reacted to this fact quite phlegmatically, with an eye to the latest statements by representatives of the Bank of Japan. And the results of the last meeting of the Japanese Central Bank were clearly not in favor of the yen. Therefore, the growth of inflation indicators did not excite traders: the price showed a formal reaction, falling by only a few dozen points.
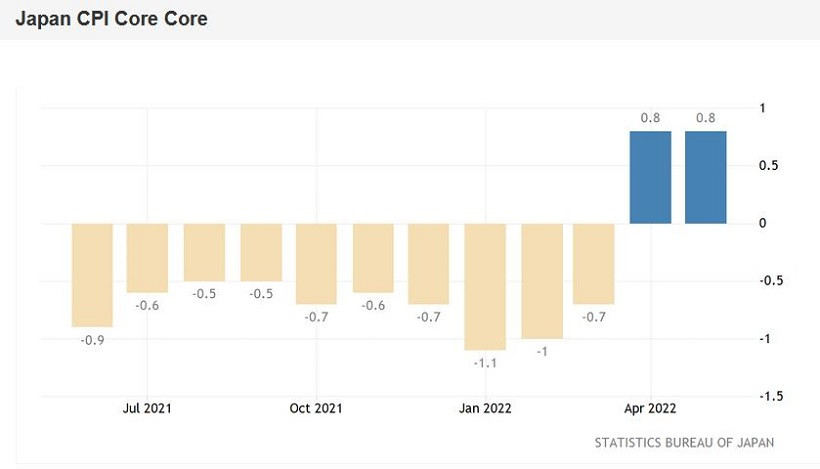
Looking at the USD/JPY weekly chart, we can see that the pair is in the next wave of an upward trend. The first wave was rather protracted: from the beginning of March to the beginning of May. During this period of time, the price rose by 1600 points. Then the bears organized a 400-point correction, after which the second wave of the upward trend began, which we are now seeing. However, USD/JPY buyers now face a more difficult task: they need to overcome 24-year price highs, which is unattainable since 1998. That is why the second wave of the upward trend bogged down much earlier—in the fourth week of growth. Judging by the results of the last five-day period, the buyers of USD/JPY were too tough for the resistance level of 136.50 (the upper line of the Bollinger Bands indicator on the daily chart). Having reached the mark of 136.70, the pair began to slowly but surely retreat, dropping by 200 points. As you can see, the growth of the USD/JPY pair has a wave-like character—a large-scale price rise is replaced by an equally large-scale correction. Therefore, the current decline in prices must also be viewed through the prism of a corrective pullback. Moreover, downward pullbacks are simply necessary in the current conditions, since it is quite risky to open longs in the area of 24-year highs. Whereas corrective pullbacks allow you to open buy orders at a better price. But back to Japanese inflation. Today's release showed that consumer inflation has exceeded the Bank of Japan's 2% target for the second month in a row. The general consumer price index rose to 2.5% in May (a similar result was achieved in April). This is the strongest growth rate of the indicator since November 2014. The consumer price index excluding fresh food prices (the most monitored inflation indicator by the central bank) also showed positive dynamics, rising to 2.1%. The growth rate of this indicator also became the highest since March 2015.
Commenting on the April figures, the trajectory of which was exactly the same as the May release, Bank of Japan Governor Haruhiko Kuroda said that the regulator needs to create conditions for "sustainable inflation" in the country's economy, while the increase in the consumer price index this year "is due to single factors, such as rising energy prices." Arguing his position, he recalled that consumer prices excluding food and energy increased by only 0.8% in annual terms (he ignored the fact that this indicator left the negative area for the first time in many months). In May, this component of the release also came out at around 0.8%. Given this fact, one should not expect tougher rhetoric from the Japanese regulator. By the way, just today, Bank of Japan Deputy Governor Masayoshi Amamiya repeated the main message of his "boss" that the regulator will adhere to a relaxed monetary policy to further support the economy. Thus, the yen paired with the dollar, in the foreseeable future, will be guided by the behavior of the American currency: the Japanese currency has no own arguments for its strengthening. Greenback, in turn, took a break after the recent rally. The US dollar index has been fluctuating in the range of 103.80–104.50 for several days, reflecting the indecision of both dollar bulls and their opponents. US Fed Chair Jerome Powell left a double impression during his speech in Congress: on the one hand, he announced further steps to tighten monetary policy, but, on the other hand, he did not specify the expected pace of the rate hike. This factor put some pressure on the dollar, temporarily extinguishing its ambitions. Nevertheless, the divergence of the positions of the Fed and the Bank of Japan still persists. The Fed is pondering how much to raise the interest rate in July (the choice is between a 50-point and 75-point increase), while the Japanese regulator continues to declare a dovish position. That is why it is advisable to use any corrective price declines as an excuse to open long positions. On the D1, W1, and MN timeframes, the pair is either on the top or between the middle and top lines of the Bollinger Bands indicator. In addition, on the daily and weekly charts, the Ichimoku indicator has formed one of its strongest bullish signals. The upward targets are 136.00 and 136.70 (24-year highs). The material has been provided by InstaForex Company - www.instaforex.com |
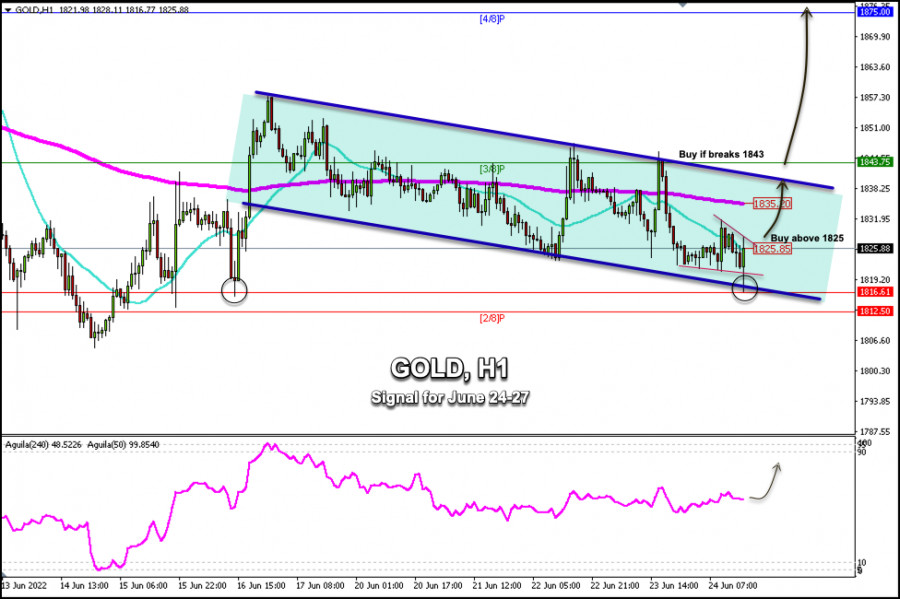
| Trading Signal for Gold (XAU/USD) on June 24-27, 2022: buy above $1,825 (21 SMA - downtrend channel) Posted: 24 Jun 2022 07:54 AM PDT
Early in the American session, gold (XAU/USD) reached the support of 1,816. This level coincides with the low of June 16. From this level, Gold is bouncing and now trading at around 1,825. If the price manages to stay above the 21 SMA, it could continue its climb and reach the 200 EMA located at 1,835. It could even reach the top of the downtrend channel at around 1,840. Since June 16, gold is trading inside a downtrend channel. At the opening of the American session, gold quickly retraced and fell towards the bottom of the downtrend channel at around 1,816. US Treasury yields are trading below their highs, slightly showing a technical correction signal, which could stage a recovery in gold if the price consolidates above 1,825. A sharp break of the downtrend channel formed on the 1-hour chart and a daily close above 1,843 could be a positive sign and gold could quickly reach 4/8 Murray located at 1,875. Conversely, we would expect gold to continue oscillating within the downtrend channel. If it fails to break the top of the downtrend channel at 1,840, it could fall back. Also, from that point, a pullback towards 1,816 or even towards 2/8 Murray at 1,812 is expected. The equity market is developing a rally. Since the European session, these markets along with the cryptocurrency market are showing positive dynamics. This factor is likely to help gold as investor sentiment for risk appetite is increasing. Our trading plan for the next few hours is to buy gold above the 21 SMA located at 1,825 with targets at 1,835 and 1,840. Additionally, a sharp break above 1,843 will be a signal to resume buying with targets at 1,875. The Eagle indicator is giving a positive signal which supports our bullish strategy. The material has been provided by InstaForex Company - www.instaforex.com |
| Gold: uside could be invalidated Posted: 24 Jun 2022 07:50 AM PDT The price of gold rallied in the last minutes after the US data dump. Still, this could be only a temporary rebound. XAU/USD was trading at the 1,827 level at the time of writing and it continues to stay above the 1,823 key level. Technically, the yellow metal is still trapped within a range pattern, the breakdown needs confirmation. Fundamentally, XAU/USD received a helping hand earlier as the Revised UoM Consumer Confidence dropped unexpectedly from 50.2 to 50.0 points. The USD plunged after the US data, so Gold took advantage of this situation. XAU/USD Range Breakout!
As you can see on the H1 chart, the price failed to take out the resistance represented by the 1,844 signaling strong sellers around that level. Also, it has registered only a false breakout above the weekly pivot point of 1,841 announcing strong bearish pressure. Now, it has dropped but it has failed to stabilize under the 1,823 static support. The US data pushed the rate above this key level again, otherwise, it would have been traded in the sellers' territory. The 1,832 - 1,833 represent an immediate upside obstacle. XAU/USD Forecast!Coming back and stabilizing below the 1,823 could confirm the breakdown below this key support and could open the door for a larger drop. Only a valid breakout above the 1,833 could activate further growth towards the 1,844 again. A larger downside movement could be confirmed by a valid breakdown below 1,816 today's low. This scenario could bring us new short opportunities. The material has been provided by InstaForex Company - www.instaforex.com |
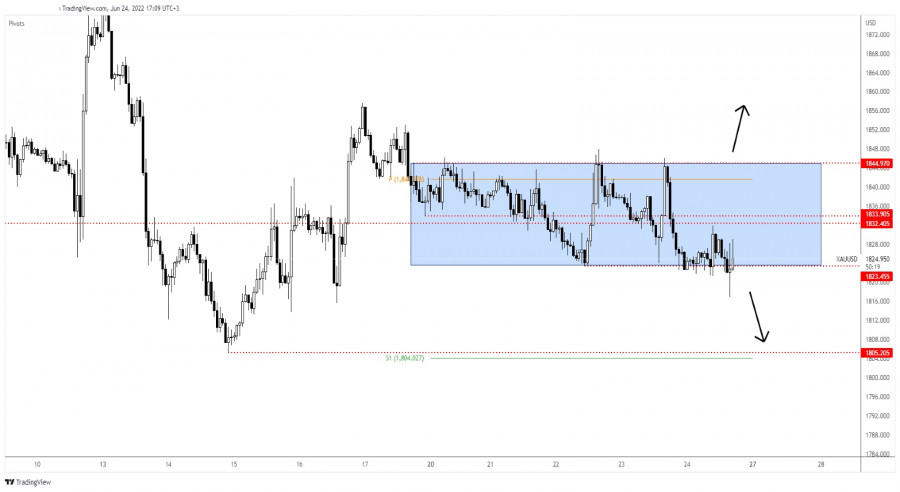
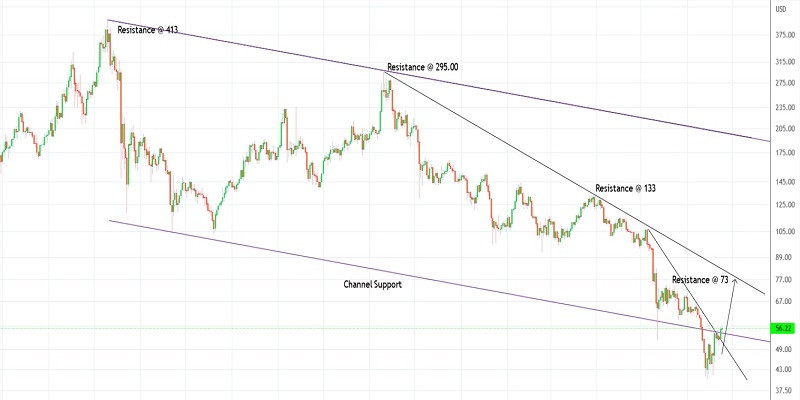
| Trading plan for Litecoin on June 24, 2022 Posted: 24 Jun 2022 07:46 AM PDT
Technical outlook:Litecoin climbed to the $57.00 intraday high on Friday, after finding support close to $52.00 on Thursday. The crypto might have carved a bottom at around $40.00 or is very close to carving one soon. Bulls might remain inclined to hold prices above $40.00 to keep the near-term structure constructive and push through the $73.00 initial resistance. Litecoin has been dropping since May 2021 after printing all-time highs at around the $403.00 mark as seen on the daily chart here. The crypto might have terminated a larger degree corrective wave close to $40.00 as bulls are pushing prices above the channel support. Also, the immediate trend line resistance seems to have broken as prices enter the buy zone targeting the $73.00 resistance next. Litecoin has potentially carved a lower degree upswing between $40.00 and $55.00-56.00 in the past few trading sessions. If a meaningful bottom is in place, prices will push through initial resistance at $73.00 and confirm that bulls are back in control. Traders might be preparing to hold long positions from here on. Trading plan:Potential rally towards $73.00 against $40.00 Good luck! The material has been provided by InstaForex Company - www.instaforex.com |
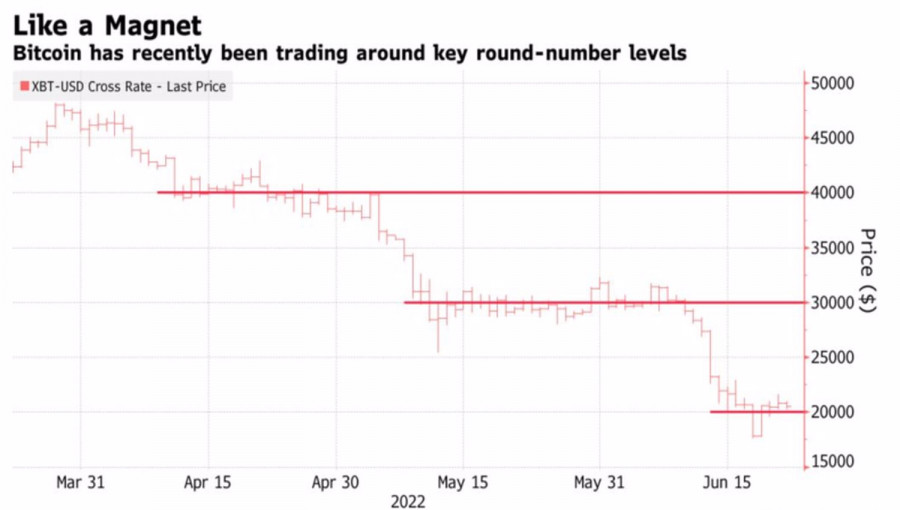
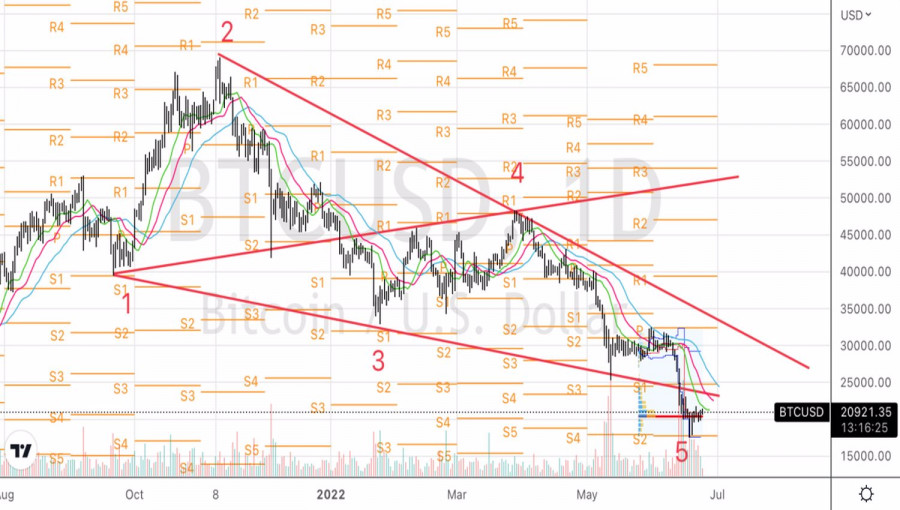
| Posted: 24 Jun 2022 07:43 AM PDT Bitcoin seemed to have reached the bottom when there was a knock from the bottom of the bunker. By the end of June, against the background of large-scale sales, the market value of all cryptocurrency assets had decreased to $939 billion. In November 2021, it was about $3 trillion! How, in this case, can we not talk about the collapse? Will Bitcoin and other cryptocurrencies disappear? They will not disappear, since the psychology underlying them is skeptical about the management of the money supply by the current government is eternal. Another thing is that it's early days yet. After captivating sales, BTCUSD quotes have entered a phase of consolidation, which looks quite logical at current levels. Indeed, the token has previously entered a narrow trading range near psychologically important levels. Bitcoin dynamics
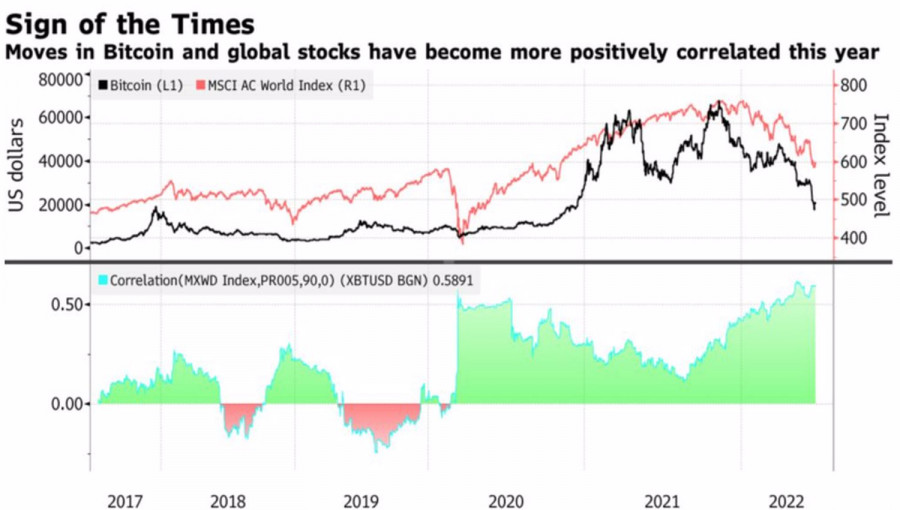
Bulls do not lose hope for a consolidation in the current area with subsequent recovery. So, the fact that the flow of moving Bitcoins to exchanges from cold wallets—autonomous storage—for subsequent sale is decreasing speaks about the potential day of the leader of the cryptocurrency sector. Over the past 7 days, this figure has dropped to 92,470 tokens from a recent peak of 137,326, according to CryptoQuant. According to research by Glassnode, 56% of all Bitcoins in hand are still worth more than they were when they were purchased. Previously, the company claimed that the average purchase price of the token is 23,430. After a series of refusals to fulfill their obligations by several industry institutions, the rest are trying to keep customers with new conditions. Thus, the Binance cryptocurrency exchange began to allow users of its services to trade Bitcoins and other assets without commission for spot transactions. Alas, neither fair value calculations nor goodies from crypto institutions are unlikely to change the balance of power in the market. It is at the mercy of the bears as concerns about the excessive tightening of the Fed's monetary policy put pressure on all risky assets. Stocks and stock indices fall—bitcoin falls. At the same time, the market began to discuss what is primary, a chicken and egg situation—cryptocurrencies affect the Nasdaq Composite or vice versa. Dynamics of the Correlation Between Bitcoin and the Global Equity Index
BTCUSD, Daily chart
According to Mobius Capital Partners, the token is a measure of investor sentiment. Where it goes, there are American stock indices. In my opinion, this is incorrect. The previous rally in these assets was based on the massive amounts of cash liquidity from the Fed. As soon as the central bank began to take this money, BTCUSD and the Nasdaq Composite collapsed sharply. These are just similar assets, not leading indicators for each other. Technically, on the daily chart, BTCUSD quotes have reached point 5 of the Wolfe Wave pattern, which suggests the formation of a bottom. However, to break the downward trend, it is necessary to return to the 2–4 line, which approximately corresponds to the level of 30,000. In the meantime, Bitcoin should be sold on the rise to 23,000 and 24,500. The material has been provided by InstaForex Company - www.instaforex.com |
| The main Asian indicators are adding 0.32-1.85% Posted: 24 Jun 2022 07:38 AM PDT
The main Asian indicators are adding 0.32-1.85% at the auction today. The largest increase was shown by the Hong Kong Hang Seng Index, which grew by 1.64%, and the Korean KOSPI, which gained 1.85%. The Australian S&P/ASX 200 added 0.32% less than others. China's Shanghai Composite and Shenzhen Composite rose 0.44% and 0.92% respectively, while Japan's Nikkei 225 increased 1.1%. The optimism of the bidders is primarily associated with an increase in American indicators. Their growth was facilitated by the upcoming speech of the head of the Federal Reserve, as well as positive statistics on employment. Thus, the number of applications for unemployment benefits for the previous week decreased by 2 thousand and amounted to 229 thousand. The second factor was the publication of statistical data from Japan. Over the past month, the country saw an increase in consumer prices by 2.5% year on year. This level has not changed compared to the April mark, and also coincided with the expectations of experts. However, the central regulator of the country is not yet ready to talk about the long-term sustainability of this phenomenon, since the increase in wages remains relatively weak. Paired with rising energy prices, this has a certain negative effect on customer sentiment and company profits. Inflation has been growing for nine months. Of the components of the Nikkei 225 index, M3, Inc., which rose by 7.1%, Ajinomoto Co., Inc., which added 6.8%, and Kao Corp., which gained 5.5%, added more than others in the price. Sony securities also showed a slight increase in the price, adding 0.2%, while Fast Retailing, Co. quotes fell by 0.1%. Of the components of the Hang Seng Index, Wuxi Biologics (Cayman), Inc., which rose by 8.9%, ENN Energy Holdings, Ltd., which added 7.7%, and Geely Automobile Holdings, Ltd., which increased by 7.4%, added more than others in the price. Securities of the largest South Korean companies also showed an increase. Hyundai Motor quotes rose by 1.5%, and Samsung Electronics, Co. – by 1.9%. As for the largest Australian companies, BHP securities fell by 1.3%, and Rio Tinto – by 1.2%. At the same time, the quotes of the Commonwealth Bank rose by 0.3%. The material has been provided by InstaForex Company - www.instaforex.com |
| Trading plan for Dogecoin on June 24, 2022 Posted: 24 Jun 2022 07:26 AM PDT
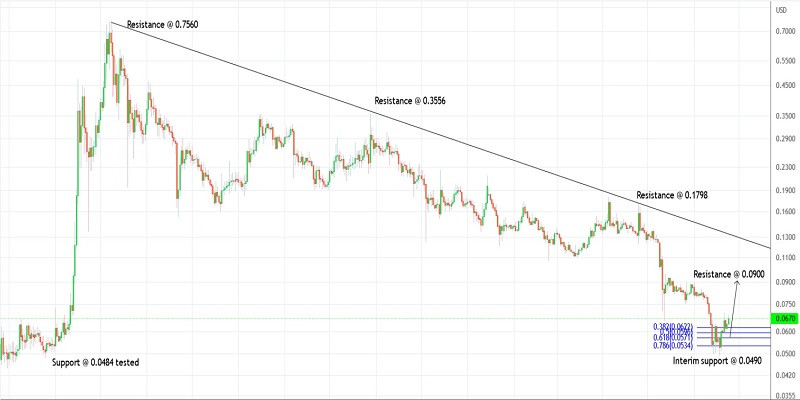
Technical outlook:Dogecoin rose to the $0.0685 highs intraday on Friday, as the lower degree counter-trend still seems to be unfolding. The crypto is seen to be trading at around $0.0668 at this point in writing and is expected to turn lower towards $0.0575 as discussed earlier. Bears might be poised to hold prices below $0.0700 to keep the near-term structure intact. Dogecoin has been dropping since May 2021 after printing all-time highs at around 0.7560 as seen on the daily chart. The corrective zigzag (5-3-5) structure looks complete and terminated close to $0.0490. Also, note that prices have just tested the long-term support seen at $0.0484, marked on the chart here. Ideally, a counter-trend rally should be on its way Dogecoin has further carved its lower degree upswing between $0.0490 and $0.0700 in the past few trading sessions. The crypto is unfolding a counter-trend drop towards $0.0575, which is the Fibonacci 0.618 retracement of the recent upswing. If the above structure holds well, bulls will remain poised to resume a rally thereafter and push the price through $0.0900. Trading plan:Potential rally towards $0.0900 and higher against $0.0490 Good luck! The material has been provided by InstaForex Company - www.instaforex.com |
| Trading plan for Bitcoin Cash on June 24, 2022 Posted: 24 Jun 2022 07:01 AM PDT
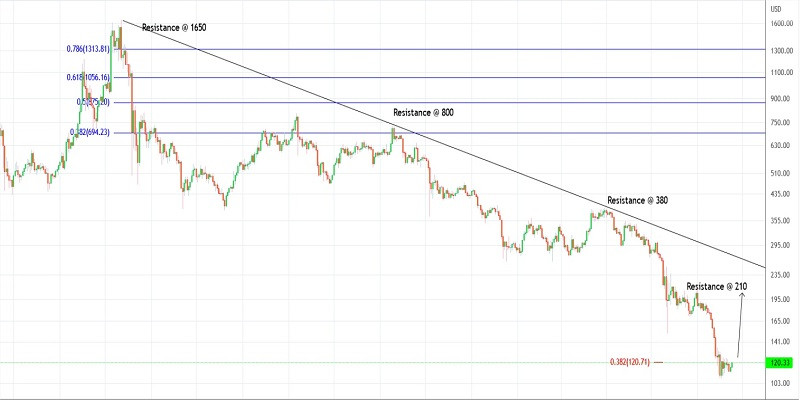
Technical outlook:Bitcoin Cash rose through $121.00 highs intraday on Friday, falling in line with projections made early this week. The crypto bounced from a potential support zone around $110-111 on Thursday and is now looking to push through the $210 mark in the near term. Bulls will have to hold prices above $106 to keep the near-term structure constructive. Bitcoin Cash has been dropping since May 2021 after printing highs around $1,650. The corrective zigzag might have terminated around the $106 mark recently before pulling back. If the above-proposed structure holds well, bulls are expected to be back in control and push through $210 initial resistance. It would further confirm that bulls are going to remain in control going forward. Bitcoin Cash has carved a lower degree upswing between $106 and $125 in the past few trading sessions. Furthermore, the crypto has carved a higher low around the $111 mark. If the above holds well, the next leg will be higher above $125 and attempt a break above $210. Traders might be preparing to hold long positions from here. Trading plan:Potential rally through $210 against $106 Good luck! The material has been provided by InstaForex Company - www.instaforex.com |
| Trading plan for Ripple on June 24, 2022 Posted: 24 Jun 2022 06:38 AM PDT
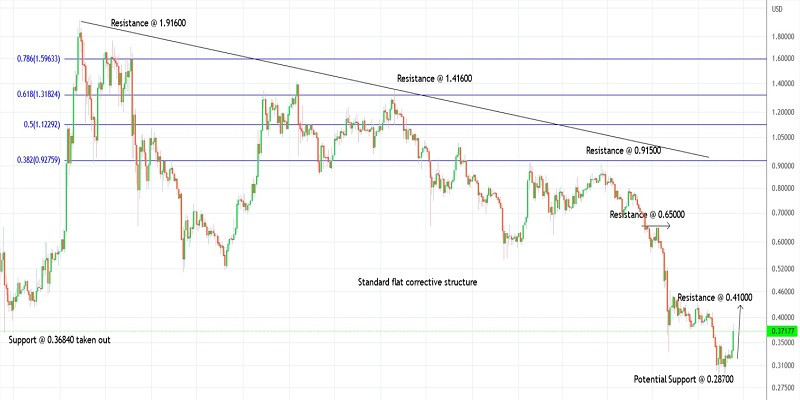
Technical outlook:Ripple rose to the $0.38700 high intraday on Friday, falling in line with an earlier projection of a potential bottom formed at around $0.28700. The crypto is seen to be trading close to the $0.37100-200 area at this point in writing and is expected to push through $0.41000 to take out initial resistance on the daily chart. Ripple has been dropping since April 2021 after printing all-time highs at the $1.91600 mark as seen on the daily chart here. The correction has unfolded as a standard flat (3-3-5) structure and looks complete at $0.28700 as marked here. A break above $0.41000 will be further evidence to confirm that bulls are back in control. Ripple is progressing within its first larger degree upswing after finding support just below the $0.32000 mark earlier this week. Bulls are looking determined to take out initial resistance at $0.41000 and assert themselves to be back in control. Traders might be preparing to continue holding long positions from here on. Trading plan:Potential rally through $0.41000 against $0.28700 Good luck! The material has been provided by InstaForex Company - www.instaforex.com |
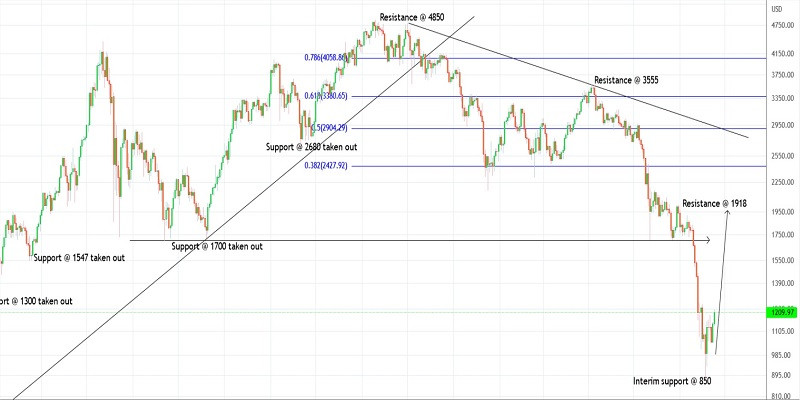
| Trading plan for Ethereum on June 24, 2022 Posted: 24 Jun 2022 06:22 AM PDT
Technical outlook:Ethereum climbed above the $1,225 high on Friday, indicating further upside potential towards $1,920 in the near term. The crypto is seen to be trading close to $1,210 at this point in writing and is expected to continue printing higher highs from here. Having said that, please note that the potential still remains for a drop to $995 first to be followed by a rebound. Ethereum is now working upon its larger degree downswing carved between $4,850 and $880 in the long course of time. Initial resistance on the daily chart is seen at $1,920 and bulls are poised to break higher in the near term. Also, note that the upside potential remains towards $2,400 and up to $3,300 going forward. Ethereum has pushed through $1,225 intraday. The potential remains for a lower degree upswing to be in place between $880 and $1,225. If the proposed structure holds well, prices might still decline towards the $995-1,000 zone before resuming the rally. Either way, traders might be preparing to hold long positions from here on. Trading plan:Potential rally through $1,920 and $2,400 against $880 Good luck! The material has been provided by InstaForex Company - www.instaforex.com |
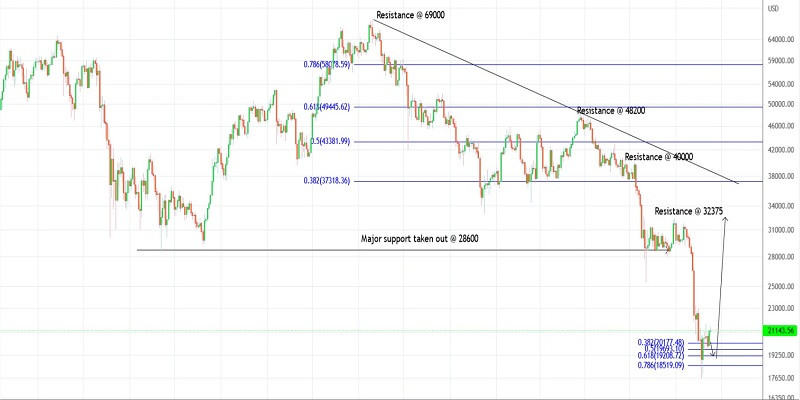
| Trading plan for Bitcoin on June 24, 2022 Posted: 24 Jun 2022 06:06 AM PDT
Technical outlook:Bitcoin rose above $21,400 on Friday as it continues to develop its corrective drop against $21,700-800. The recent pullback between $19,700 and $214,00 should be short-lived as bears might be preparing to come back on the market and drag prices towards $19,200 in the near term. Bitcoin has carved a larger degree downswing between $69,000 and $17,500 over quite a while. Even if BTC extends a further drop, it needs to produce a pullback rally towards the $33,000-35,000 zone in the next few trading sessions. Also, note that initial resistance is seen at around the $32,300 mark and a break there will encourage bulls. Bitcoin has also carved a lower degree upswing between $17,500 and $21,700 to confirm a deeper correction ahead. Prices are currently retracing the above rally and are expected to find support at around the Fibonacci 0.618 retracement seen at about $18,200. If the above scenario holds well, we should witness a drop from here before the rally resumes. Trading plan:Potential rally towards $33,000 and higher against $17,000 Good luck! The material has been provided by InstaForex Company - www.instaforex.com |
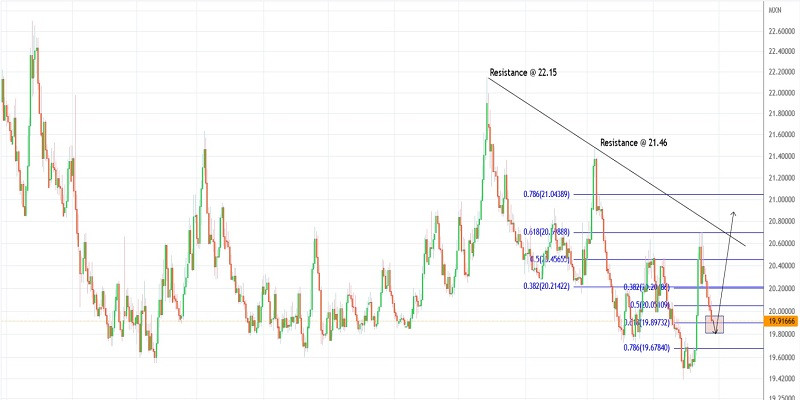
| Trading plan for USDMXN on June 24, 2022 Posted: 24 Jun 2022 05:51 AM PDT
Technical outlook:USDMXN continues to slide towards the 19.80-90 zone as we're entering the New York session on Friday. The price action has been in line with projections made earlier this week as targets are approaching 19.90 at the time of writing. Watch out for a potential bullish reaction between 19.80 and 19.90 as strong support is expected. USDMXN has been dropping from the 22.15 highs within a diagonal as discussed earlier. The diagonal is either complete at around 19.40 or it is within its last leg lower towards the 19.00 mark at least. It is good to be watchful around the 19.80-90 zone as traders might take some profits on short positions initiated earlier. USDMXN might have already carved its first upswing between 19.40 and 20.70 recently. The boundary has been now retraced to the Fibonacci 0.618 level at around the 19.90 mark. A high probability remains for bulls to come back strong from around the 19.80-90 zone and resume higher above 20.70 going forward. Trading plan:The potential rally from the 19.80-90 zone against 19.00 Good luck! The material has been provided by InstaForex Company - www.instaforex.com |
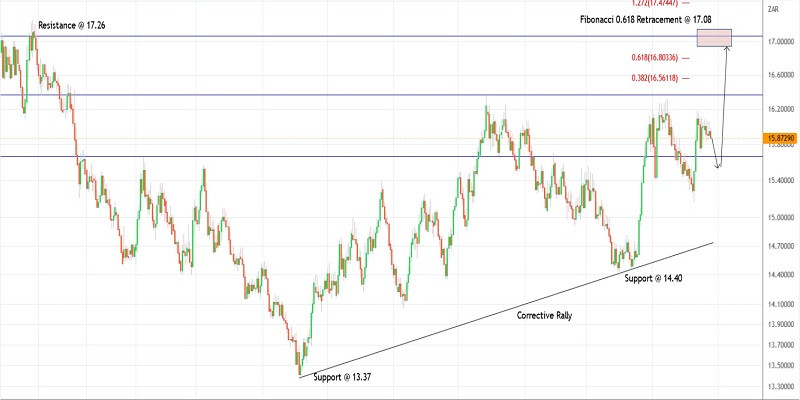
| Trading plan for USDZAR on June 24, 2022 Posted: 24 Jun 2022 05:34 AM PDT
Technical outlook:USDZAR slipped to 15.85 during the early New York session on Friday and it could sink further towards the 15.40-50 area before finding some support. The currency pair has been drifting within a range between 15.40 and 16.20 in the past few trading sessions and continues sideways for a while before breaking out towards the 17.10-50 zone as highlighted. USDZAR has been broadly unfolding a larger degree counter-trend rally from the 13.37 lows since June 2021. The currency pair has been successful in carving the first and second waves around 16.35 and 14.40. Since then, bulls are back in control and progressing higher within the third wave higher towards 17.10. USDZAR has carved a lower degree upswing between 14.40 and 16.20-30, which has been retarded through the 15.20 mark as seen on the chart here. The currency might find intraday support at around 15.50 before resuming higher again. Traders might be preparing to hold long positions against 15.20 in the near term. Trading plan:Potential rally through 17.10 against 14.40 Good luck! The material has been provided by InstaForex Company - www.instaforex.com |
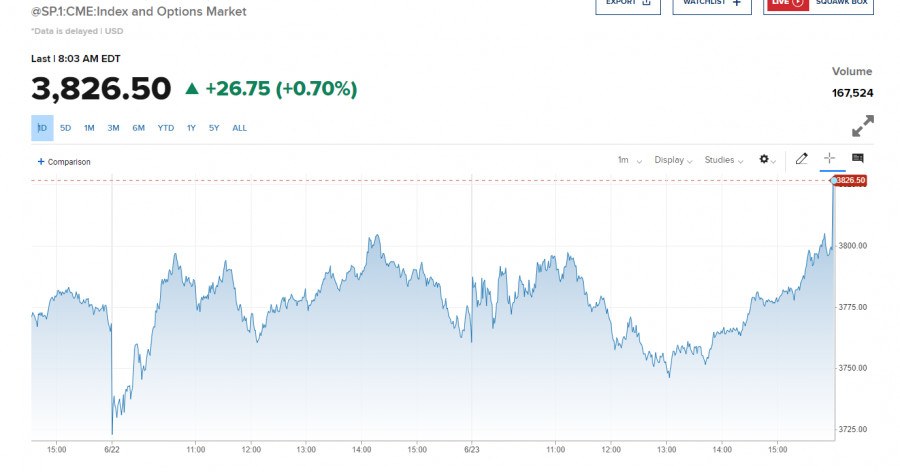
| US pre-market trading on June 24, 2022. Traders continue to buy up tech stocks Posted: 24 Jun 2022 05:30 AM PDT US stock futures continued to rise on Friday. Tech stocks are in high demand today as investors prefer to buy them at attractive prices and in the face of a looming economic downturn, especially when the scope... US stock futures continued to rise on Friday. Tech stocks are in high demand today as investors prefer to buy them at attractive prices and in the face of a looming economic downturn, especially when the scope of further monetary tightening has become clear. The Dow Jones 600 Index added 0.5%, the Nasdaq 100 gained 1%, while the S&P 500 futures were up by 0.7%. However, the upside potential is limited. Investors wonder what happens if the global economy enters a recession. One of the scenarios suggests that the inflationary pressure will ease and, therefore, central banks will slow down the pace of rate hikes. Yet, Jerome Powell confirmed yesterday that the US regulator was determined to fight soaring inflation even at the cost of slowing economic growth as this is the price they would have to pay. Despite the hawkish statement by the Fed Chair and rising fears of a looming recession, investors hope that the pace of monetary tightening will slow down in the next 12-18 months after the aggressive steps taken this summer. Interestingly, investors continue to pull money out of ETFs. Global equity funds saw their biggest outflow in nine weeks amid fears that the US economy could be headed for a recession. According to Bank of America Corp., citing EPFR Global data, about $16.8 billion exited global stock funds in the week through June 22. At the same time, the demand for stocks is slowly recovering amid a decline in crude prices. Oil saw its first weekly losses since early April amid an overall sell-off in the commodities market. Pre-market In pre-market trading, FedEx shares jumped by 3.4% on reports about its quarterly adjusted earnings of $6.87 per share, which beat estimates by 1 cent. Although shipment volumes have declined, this was offset by increased shipping rates and fuel surcharges. FedEx also issued an optimistic outlook for the fiscal year of 2023. Seagen shares went up by 3.5% in pre-market trading after the Wall Street Journal reported that Merck is pushing the deal to acquire the biotech company. Zendesk soared by 56.5% on reports that the software company is close to a buyout deal with a group of private equity firms. According to the Wall Street Journal, Hellman & Friedman and Permira are among those who are involved in the deal. Last week, Zendesk announced that it had ended efforts to sell the company. Microsoft gained 1.2% in the premarket after Citi named it a "top pick," pointing to its attractive valuation and the company's ability to sustain growth.
As for the technical outlook for S&P 500. The bullish rally continues. Today, buyers of risk assets will attempt to control the resistance of $3,826. A breakout of this level will facilitate a further move towards the area of $3,866 and $3,900. At this point, large market players will enter the market. At least, some of them will want to take profit on long positions. The level of $3,942 will serve as the next target although it seems very unlikely that the price will go there. In case the pessimistic sentiment prevails and the talks about inflation continue, the instrument may easily retest the nearest support at $3,788 although this will not do any harm. On the other hand, if bulls manage to test $3,762 and break through this range, this will cause a new sell-off and a subsequent decline towards $3,731 and $3,704. The material has been provided by InstaForex Company - www.instaforex.com |


| You are subscribed to email updates from Forex analysis review. To stop receiving these emails, you may unsubscribe now. | Email delivery powered by Google |
| Google, 1600 Amphitheatre Parkway, Mountain View, CA 94043, United States | |


Comments