Forex analysis review
Forex analysis review |
- Technical analysis of GBP/USD for June 07, 2022
- Technical analysis of EUR/USD for June 07, 2022
- June 7, 2022 : EUR/USD daily technical review and trading opportunities.
- June 7, 2022 : EUR/USD Intraday technical analysis and trading plan.
- June 7, 2022 : GBP/USD Intraday technical analysis and significant key-levels.
- European stocks plunge amid investor worries
- BTC update for June 07,.2022 - Watchf or the downside movement
- USD/JPY analysis for June 07, 2022 - Potential for the upside continuation
- GBP/USD analysis on June 7, 2022
- EUR/USD analysis on June 7. The European currency continues to build a corrective wave
- Trading Signal for Gold (XAU/USD) on June 7-8, 2022: buy above $1,842 (21 SMA - descending wedge)
- Analysis of Gold for June 07,.2022 - Watch for the breakout of the sideways base
- Can ECB push euro higher?
- Trading plan for Ripple on June 7, 2022
- European currency has plan
- EUR/USD and GBP/USD technical analysis recommendations on June 7, 2022
- Oil continues to rally
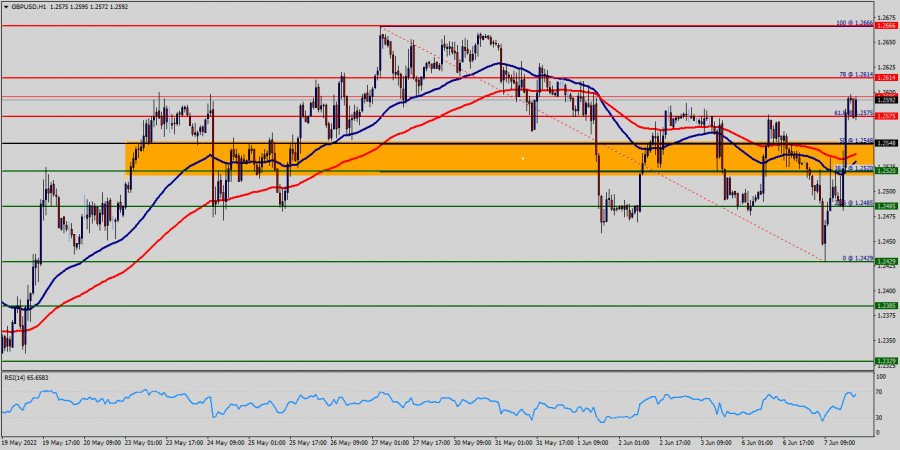
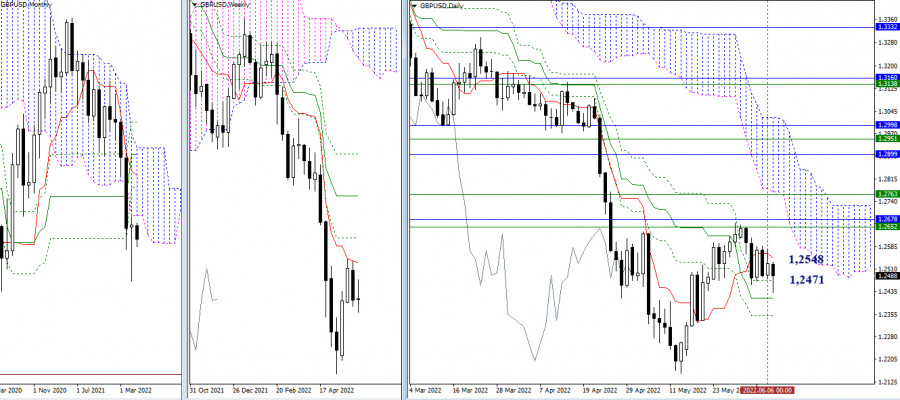
| Technical analysis of GBP/USD for June 07, 2022 Posted: 07 Jun 2022 11:47 AM PDT Overview : The GBP/USD pair set above strong support at the level of 1.2548, which coincides with the 50% Fibonacci retracement level. This support has been rejected for four times confirming uptrend veracity. Hence, major support is seen at the level of 1.2548 because the trend is still showing strength above it. Accordingly, the pair is still in the uptrend from the area of 1.2548 and 1.2560. The GBP/USD pair is trading in a bullish trend from the last support line of 1.2548 towards the first resistance level at 1.2614 in order to test it.
The level of 1.2666 will act as second resistance and the double top is already set at the point of 1.2666. In overall, we still prefer the bullish scenario as long as the price is above the level of 1.2666. Furthermore, if the GBP/USD pair is able to break out the top at 1.2666, the market will climb further to 1.2726. On the other hand, if the GBP/USD pair fails to break out through the resistance level of 1.2666; the market will decline further to the level of 1.2520 (daily support 2). then this scenario may be invalidated. But in overall, we still prefer the bullish scenario. The material has been provided by InstaForex Company - www.instaforex.com |
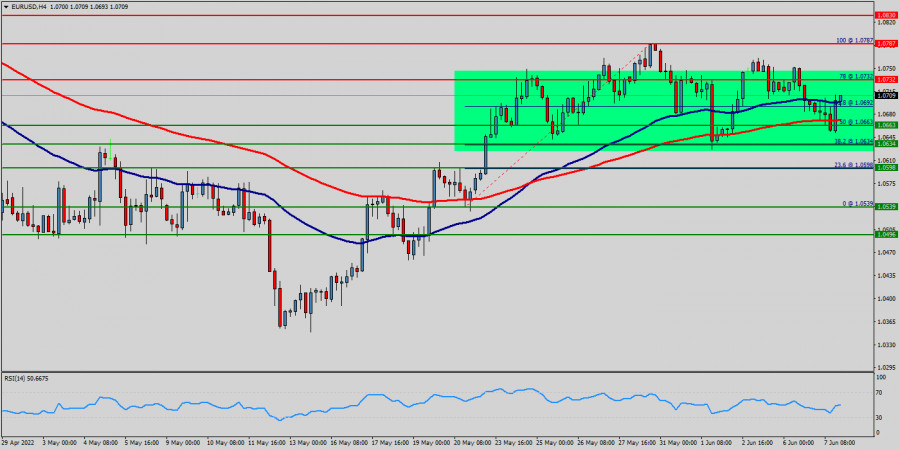
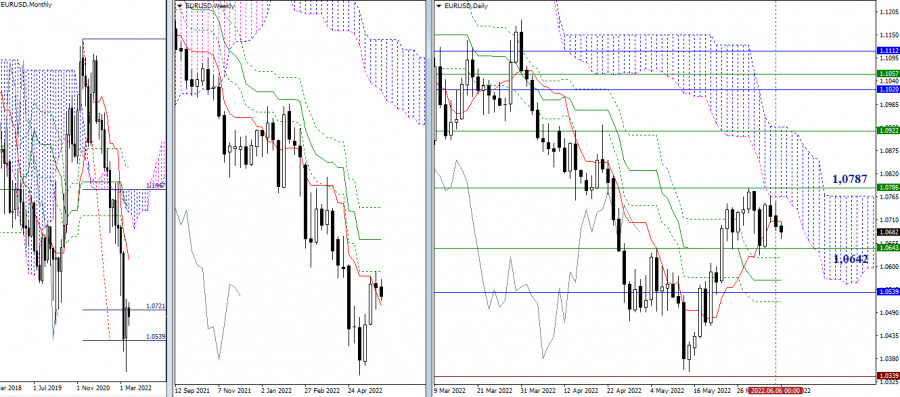
| Technical analysis of EUR/USD for June 07, 2022 Posted: 07 Jun 2022 11:37 AM PDT Overview : The trend of EUR/USD pair movement was controversial as it took place in a narrow sideways channel, the market showed signs of instability. Amid the previous events, the price is still moving between the levels of 1.0634 and 1.0732. Also, the daily resistance and support are seen at the levels of 1.0732 and 1.0634 respectively. Therefore, it is recommended to be cautious while placing orders in this area. So, we need to wait until the sideways channel has completed. Yesterday, the market moved from its bottom at 1.0634 and it continued to rise towards the top of 1.0711. Today, in the one-hour chart, the current rise will remain within a framework of correction.
Since there is nothing new in this market, it is not bullish yet. Sell deals are recommended below the level of 1.0787 with the first target at 1.0634. If the trend breaks the support level of 1.0634, the pair is likely to move downwards continuing the development of a bearish trend to the level 1.0598 in order to test the daily support 2 (horizontal green line). This would suggest a bearish market because the RSI indicator is still in a positive area and does not show any trend-reversal signs. The pair is expected to drop lower towards at least 1.0598 with a view to test the daily support 2. The material has been provided by InstaForex Company - www.instaforex.com |
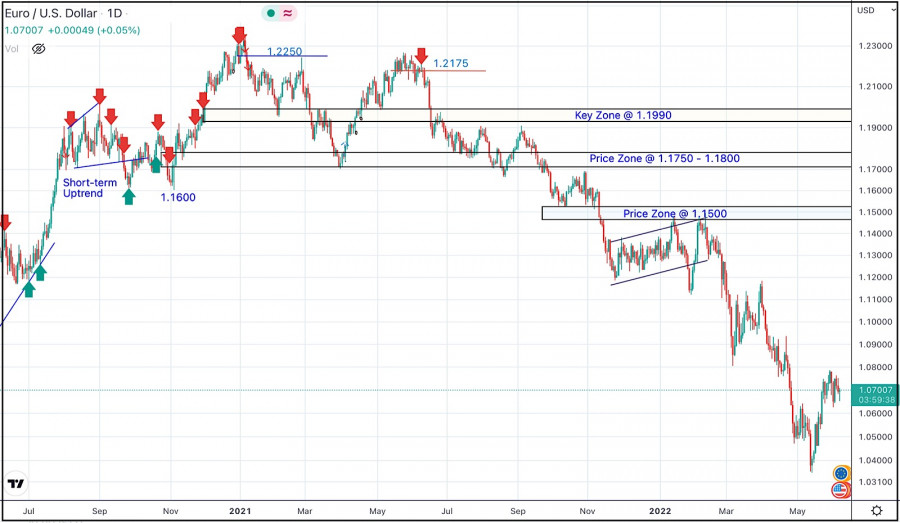
| June 7, 2022 : EUR/USD daily technical review and trading opportunities. Posted: 07 Jun 2022 10:07 AM PDT
In late September, Re-closure below the price level of 1.1700 has initiated downside-movement towards 1.1500 where some recovery was witnessed. Shortly after, Price levels around 1.1700 managed to hold prices for a short period of time before another price decline took place towards 1.1200. Then the EURUSD has temporarily moved-up within the depicted movement channel until downside breakout occurred recently. Since then, the price zone around 1.1500 has applied significant SELLING pressure when a valid SELL Entry was offered upon the previous ascending movement towards it. Shortly after, the EURUSD looked oversold while approaching the price levels of 1.0800. That's where the recent upside movement was previously initiated. That's why, the recent movement towards 1.1200 was considered for another SELL Trade which is already running in profits now. The current ascending movement above 1.0600 enabled further advancement towards 1.0850 where bearish rejection can be applied. The material has been provided by InstaForex Company - www.instaforex.com |
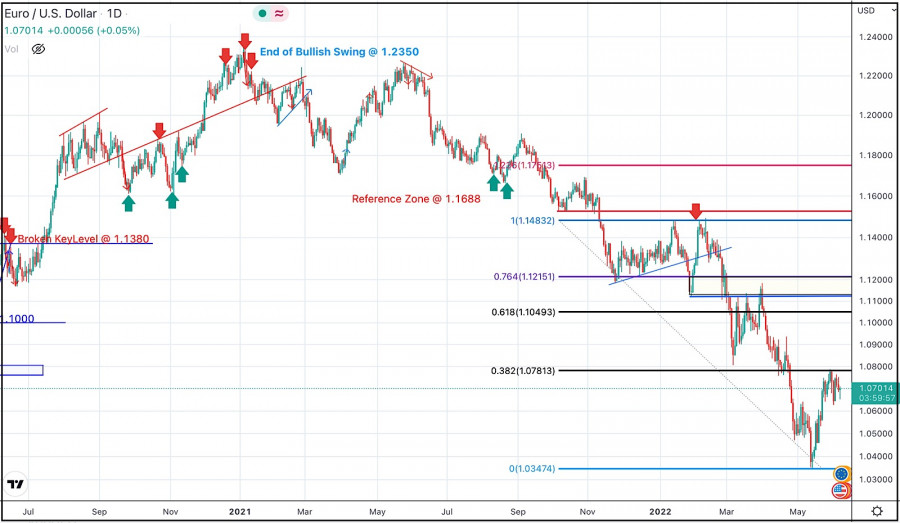
| June 7, 2022 : EUR/USD Intraday technical analysis and trading plan. Posted: 07 Jun 2022 10:05 AM PDT
In late September, Re-closure below the price level of 1.1700 has initiated downside-movement towards 1.1500 where some bullish recovery was witnessed. Shortly after, another price decline took place towards 1.1200. Then the EURUSD has temporarily moved-up within the depicted movement channel until downside breakout occurred. The EURUSD looked oversold while approaching the price levels of 1.0800. That's when an upside movement was initiated towards 1.1200. This recent movement towards 1.1200 was suggested for another SELL opportunity which already reached its targets. The current ascending movement above 1.0600 may enable further advancement towards 1.0850 where bearish rejection can be applied. On the other hand, the pair remains under selling pressure to re-visit the new daily low around 1.0350. The material has been provided by InstaForex Company - www.instaforex.com |
| June 7, 2022 : GBP/USD Intraday technical analysis and significant key-levels. Posted: 07 Jun 2022 10:04 AM PDT
The short-term outlook turned bearish when the market went below 1.3600. This enhanced the bearish side of the market initially towards 1.3400 then 1.3200 which initiated a strong bullish movement towards 1.3600 for another re-test. The recent bullish pullback towards 1.3600 should have been considered for SELL trades as it corresponded to the upper limit of the ongoing bearish channel. Shortly after, Bearish persistence below 1.3360 enabled bearish continuation towards 1.2980 - 1.3000. The price level of 1.3000 stood as intraday Support where a short-term sideway movement could be established . This happened before two successive bearish dips could take place towards 1.2550 and 1.2200. Considerable bullish rejection was expressed around 1.2200. Hence, bullish breakout above 1.2550 was needed to abolish the short-term bearish scenario for sometime. Quick bullish advancement was executed towards 1.2650 where some bearish resistance was encountered as expected The GBP/USD pair remains under bearish pressure to challenge the new low around 1.2150 again. Hence, any bearish reversal signs around 1.2650 should be considered for SELLING the pair. The material has been provided by InstaForex Company - www.instaforex.com |
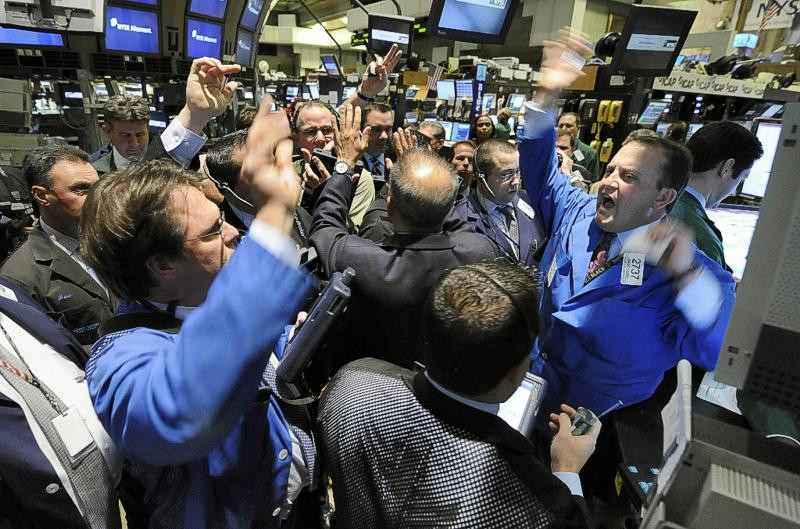
| European stocks plunge amid investor worries Posted: 07 Jun 2022 09:03 AM PDT On Tuesday's trading, Europe's leading stock indices were showing a steady decline amid traders' fears of a European Central Bank (ECB) interest rate hike. The STOXX Europe 600, a composite indicator of Europe's leading companies, fell 0.38% to 442.55 points. Top performers amongst the STOXX Europe 600 components are real estate firm Sagax AB (+2.9%), investment company EQT AB (+2.7%) and health and hygiene products manufacturer SKF AB (+2.4%). Stocks of low-cost carrier Wizz Air (-2.9%), software developer TeamViewer (-2.7%) and biopharmaceutical company MorphoSys AG (-2.4%) topped the decline list here. Meanwhile, the British FTSE 100 index was down by 0.15%, the French CAC 40 lost 0.43% and the German DAX dropped by 0.62%.
Biggest and least gainers Swiss logistics group Interroll was down by 9% as economists at Credit Suisse, one of Switzerland's largest financial conglomerates, cut their target price for the company's shares. The capitalisation of the British publisher Pearson dropped by 0.5%. The day before, the company's management announced the sale of its K12 Courseware business in Italy and Germany for $204.3 million to Finnish publisher Sanoma Corp. UK waste management company Biffa Plc has soared 28%. Earlier, the media reported that investment giant Energy Capital Partners planned to buy the company for £1.36bn. The share price of British sporting goods retailer JD Sports fell 1.7% amid allegations that the company colluded to inflate product prices with sporting goods manufacturer Elite Sports and Scottish football club Rangers. Reasons for market decline Experts say the main reason for the persistent decline in European stock markets on Tuesday is investor fears about the prospects of a tightening of the ECB's monetary policy. The publication of the regulator's monetary policy decision is expected next Thursday. The market hopes that the European regulator will announce further steps to halt asset purchases and increase the base rate to a non-zero level for the first time in eight years. Market participants' fears can hardly be described as groundless. Expectations of a tighter monetary policy by the European regulator are attributed to the persistently rising inflation rate and the unclear outlook for the economy. For example, the EU Statistics Office earlier reported that the consumer price level in the Eurozone soared by 8.1% year-on-year last month. At the same time, market analysts had earlier predicted an increase of only 7.7%. By the way, May's result was an all-time record and more than quadrupled the European Central Bank's target of 2%. Meanwhile, Construction Purchasing Manager's Index (PMI) fell to 49.2 points in May from 50.4 points in April. For the first time in nine months, the index was below the 50-point mark separating an increase in business activity in the sector from a decline. The May decline was the biggest since February 2021. The outcome of the vote of no confidence in British Prime Minister Boris Johnson also remains in the spotlight for European investors on Tuesday. The vote of no confidence in the politician was expressed by 148 single-party members, while 211 did not support the vote of no confidence. Thus, the Conservatives did not get the necessary number of votes to dismiss the Prime Minister, which means that Boris Johnson remains in office. This week, European stock exchanges are waiting for Friday's report from the US Department of Labor on the nation's consumer price movements over the past month. This data will give an indication of the current state of the US economy. In addition, the Labor Department's report will traditionally be an important reference for the US Federal Reserve when deciding on further monetary policy tightening. According to preliminary expert forecasts, the rate of inflation in the US remained at April's level of 8.3% in May. Trading results As for yesterday's trading session, European stock indicators showed a strong increase on Monday on the back of positive news from China. As a result, the British FTSE 100 stock index climbed by 1% to 7608.22 points, the French CAC 40 rose by 0.98% to 6548.78 points and the German DAX surged by 1.34% to 14653.81 points. French aircraft engine maker Safran and Societe Generale have soared 2.4% and 2.6%, respectively supported by positive recommendations from US independent investment firm Jefferies. The share price of Dutch online food ordering and delivery company Just Eat Takeaway.com NV rose by 11.8%. Meanwhile, the German food delivery service, Delivery Hero SE, was up by 9.4%. The capitalisation of the British-Swedish pharmaceutical company AstraZeneca lost 3.5% in trading the day before.Faroese salmon farming company Bakkafrost dropped by 3.3%. On Monday stock market participants in Europe were focused on statistical data from China. According to previously published information, the country's purchasing managers' index for services increased in May compared with April, due to an easing of restrictions related to COVID-19 infection in China's major cities. According to Caixin, the indicator climbed to 41.4 points last month from April's 36.2 points (the lowest figure in the past 26 months). The data published the day before point to a strong recovery of the Chinese economy as well as to positive trends in the global economy. In addition, analysts forecast that the easing of coronavirus restrictions will stimulate a rapid recovery of the supply chain. The material has been provided by InstaForex Company - www.instaforex.com |
| BTC update for June 07,.2022 - Watchf or the downside movement Posted: 07 Jun 2022 08:43 AM PDT Technical analysis:
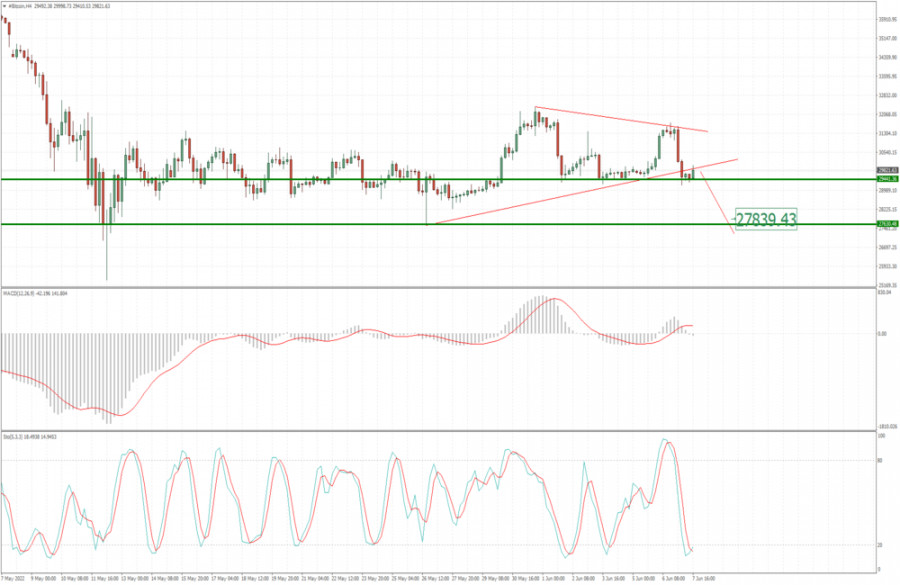
BTC has been trading downside today and I found the brekaout of the rising trend line, which is good sign for further downside movement. Trading recommendation: Due to the downside fresh move today, I see potential for the downside continuation. Watch for potential selling opportunities in case of the breakout of the pivot support at 29.300. MACD is showing neutral reading, which is sign of indecision. Key short-term resistance is set at $32.400 The material has been provided by InstaForex Company - www.instaforex.com |
| USD/JPY analysis for June 07, 2022 - Potential for the upside continuation Posted: 07 Jun 2022 08:21 AM PDT Technical analysis:
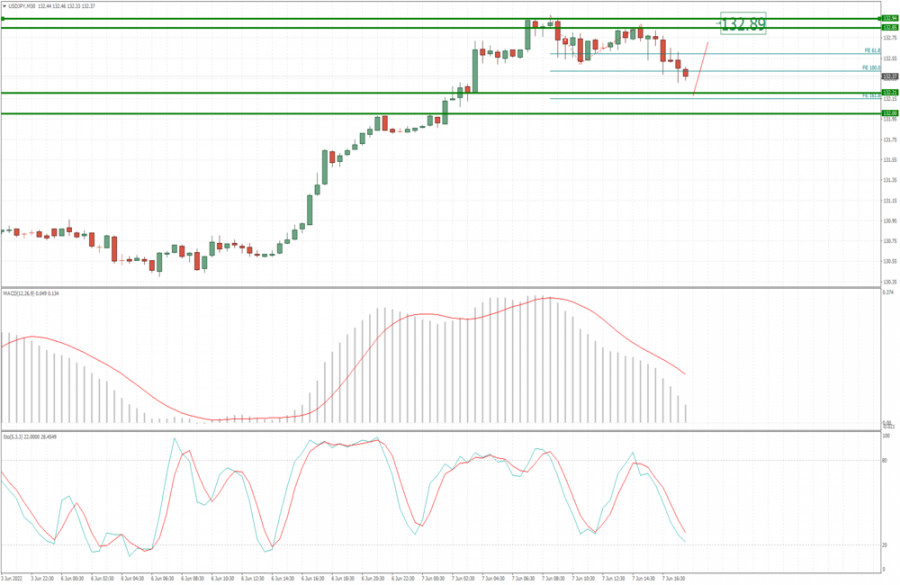
USD/JPY has been trading in strong upside cycle and I see potential for further upside continuation. Bullish continuation al patterns are preferable. Trading recommendation: Due to the strong upside cycle on both short and mid term, I see potential for bullish continuation. Watch for buying opportunities on the pullbacks with the upside objectives at the price of 132.90 and 135.00. MACD is showing positive reading, which is good sign that trend is still bullish. Stochastic oscillator is showing potential oversold condition and potential for the rally. Key support s set at the price of 132.20 The material has been provided by InstaForex Company - www.instaforex.com |
| GBP/USD analysis on June 7, 2022 Posted: 07 Jun 2022 08:14 AM PDT
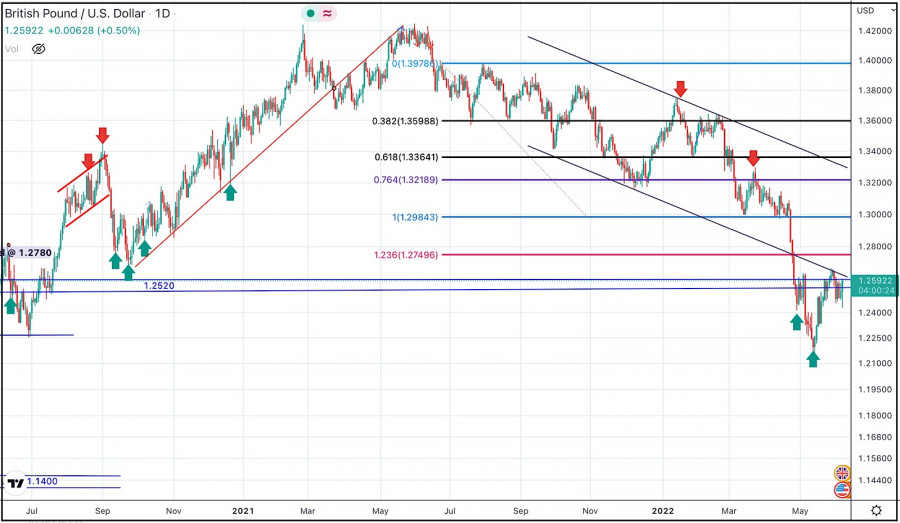
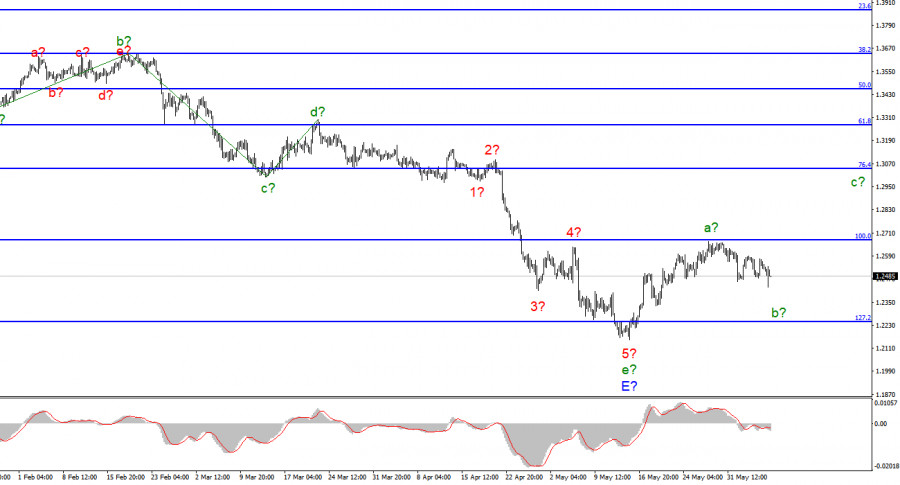
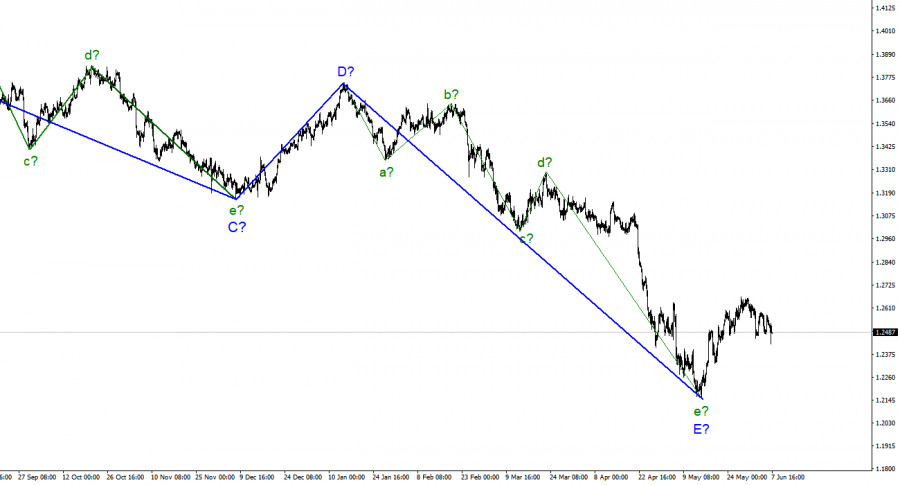
For the pound/dollar instrument, the wave markup continues to look very convincing and does not require adjustments. The downward section of the trend is completed, and the wave e-E, although it has taken a rather complex form, is also five-wave in the structure of the five-wave downward section of the trend, as well as for the euro/dollar instrument. Thus, both instruments presumably completed the construction of downward trend sections. According to the British, the construction of an upward section of the trend has begun, which is currently interpreted by me as a corrective one. I believe that it will turn out to be three-wave, but there is also a second option, in which it will take a pulsed, five-wave form. Now, presumably, the construction of a corrective wave b is continuing, after which wave c will begin with targets located around 30 figures. Wave b can take a three-wave form, as with the euro/dollar instrument. I will note once again that the wave markings of the euro and the pound are very similar now, so we can expect that both currencies will move approximately the same in the next few weeks. There is no news background and the dollar rules the ball The exchange rate of the pound/dollar instrument decreased by 40 basis points on June 7. However, if we consider the whole wave picture holistically, the decline in the British dollar in the last few days looks rather weak. Of course, the news background, or rather its absence, reduces the market's interest in trading. However, I believe that at the same time, the market is very correctly using the pause that has arisen to build a corrective wave. And when important data begins to arrive, the demand for the Briton may grow again. I can't make a clear conclusion that this is exactly how it will be, but there are times when the wave markup is ambiguous, that is, it assumes several scenarios. This is not the case. Over the past few months, there has not been a single situation where it would require additions or adjustments. Once the impulse downward trend section is completed, it means that we must see three waves up. An interesting event happened yesterday in the UK. Unexpectedly for many, the Conservative Party decided to announce a vote of no confidence in Boris Johnson and failed in its desire. The Prime Minister has collected enough votes to stay in his seat, but the bell for the British prime minister is very bad. I cannot say that Boris Johnson is the best prime minister in the history of Britain. Most likely, this is not the case, but still, the personality is quite charismatic. The Briton was not too interested in this news, and given the absolute identity of the movement of the euro/dollar and pound/dollar instruments, it can be concluded that the market did not show any interest in this event. Thus, now we are waiting for the report on American inflation, which will be released tomorrow. Now it is unclear whether it will decline, as it was in April, or resume growth. Therefore, I do not undertake to make forecasts for this indicator. But if the real value surprises the market, then the movements on both instruments may be strong. General conclusions The wave pattern of the pound/dollar instrument still assumes the completion of the construction of wave E and the entire downward trend segment. Thus, I now advise buying the British for each MACD signal "up" with targets located above the peak of wave a, not lower than the estimated mark of 1.3042, which corresponds to 76.4% Fibonacci. Under certain circumstances, wave marking can become very complicated, but now there is no reason to assume this. At the higher scale, the entire downward trend section looks fully equipped. Therefore, the continuation of the decline of the instrument below the 22nd figure is postponed indefinitely for the time being. Wave E has taken a five-wave form and looks quite complete. The construction of a minimum three-wave ascending trend section has begun. The material has been provided by InstaForex Company - www.instaforex.com |
| EUR/USD analysis on June 7. The European currency continues to build a corrective wave Posted: 07 Jun 2022 08:14 AM PDT
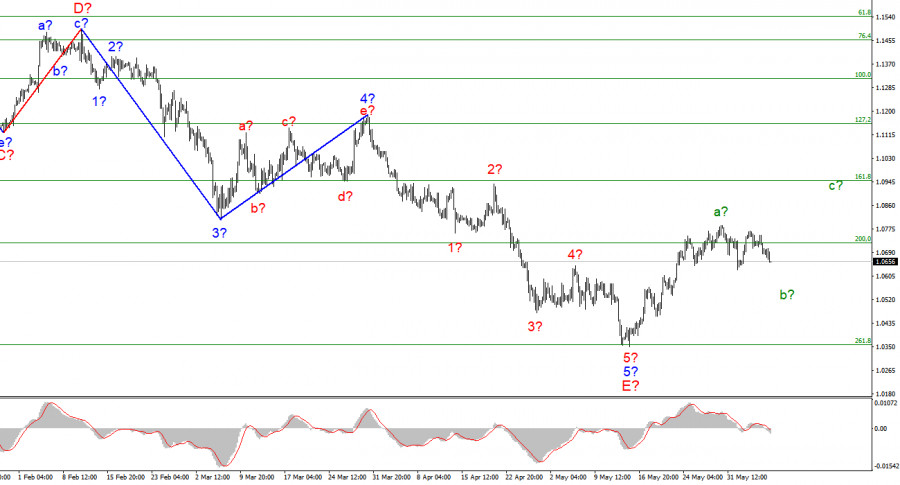
The wave marking of the 4-hour chart for the euro/dollar instrument continues to look convincing and does not require adjustments. The instrument has completed the construction of the descending wave 5-E, which is the last in the structure of the descending trend section. If this is indeed the case, then at this time the construction of a new upward trend section has begun. It can turn out to be three-wave, or it can be pulsed. At the moment, two waves of a new section of the trend are already visible. Wave a is completed, and wave b can take a three-wave form, and in this case, the decline in the quotes of the instrument will continue with targets located around the 6th figure or slightly lower. Wave 5-E turned out to be a pronounced five-wave, so its internal wave marking is beyond doubt. The only option now in which the decline of the euro can resume for a long period is the rapid completion of the correction section of the trend and the construction of a new downward impulse. However, to identify this option, you need at least the completion of the ascending wave c, the targets of which are located about 9-10 figures. There are no news and reports, and the dollar enjoys a pause The euro/dollar instrument fell by 40 basis points on Tuesday. The news background of today was simply absent, so the market moved the instrument only based on wave markup. And the wave marking is now almost unambiguous - it assumes a further decrease in the instrument by another 50-100 basis points. Already on Wednesday and Thursday, the news background for the instrument will be much stronger, but this does not mean that demand for the European currency will begin to grow again. American inflation may cause a decline in the European currency and the construction of the corrective wave b will be completed. And on Thursday, the ECB should announce the completion of the APP program or its readiness to raise the interest rate at the next meetings, then the demand for the European currency will already grow. Thus, the wave analysis and the news background still look very harmonious with each other. It is the European Central Bank that can fail. Although the heads of the central banks of the Eurozone have already openly stated the need to raise the rate by 50 basis points, this does not mean that the ECB will decide on such a step. And for sure it will not dare to take such a step in June. By and large, the pressure on the ECB's position is exerted by the inflation indicator, which continues to grow and will continue to do so in the near future. The European economy is showing very modest growth, but this growth still allows you to raise the rate once or twice. I think that in 2022, we will still see a tightening of monetary policy. In addition, the APP program, according to which the ECB still buys securities for not very significant amounts monthly, should be completed this summer. Thus, I believe that monetary policy in the European Union will tighten, but at a very slow pace, much lower than in the United States. This should be enough for the euro currency to build at least a corrective section of the trend. General conclusions Based on the analysis, I conclude that the construction of the downward trend section is completed. If so, then now you can buy a tool with targets located near the estimated mark of 1.0947, which equates to 161.8% Fibonacci, for each MACD signal "up". It is best to wait for the completion of the construction of wave c-b, its low should be located slightly below figure 6.
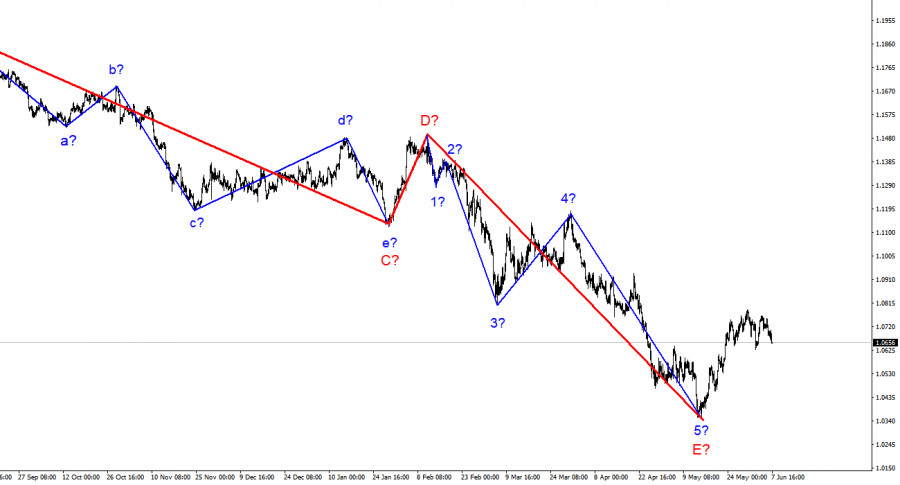
On a larger scale, it can be seen that the construction of the proposed wave E has been completed. Thus, the entire downtrend has acquired a complete look. If this is true, then in the future for several months the instrument will increase with targets located near the peak of wave D, that is, to the 15th figure. The material has been provided by InstaForex Company - www.instaforex.com |
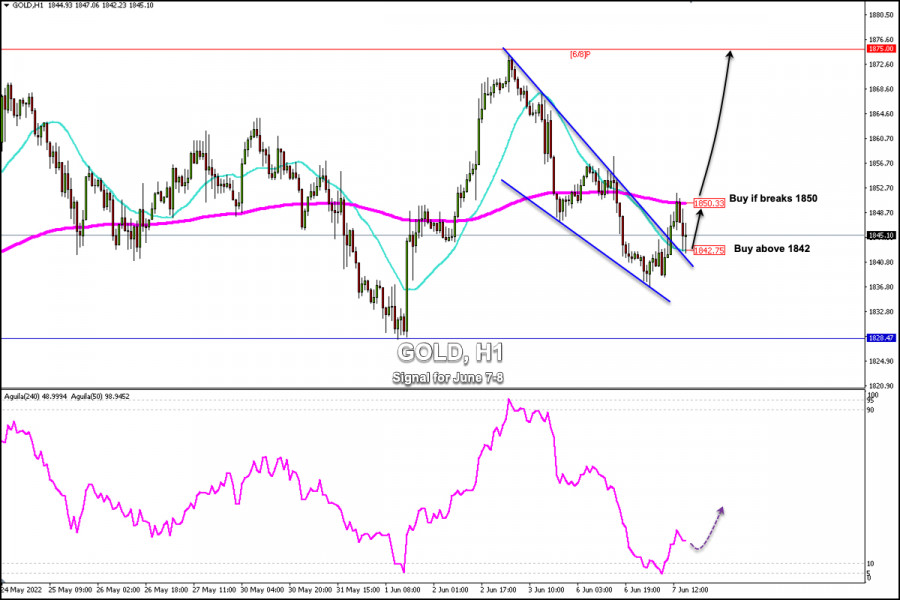
| Trading Signal for Gold (XAU/USD) on June 7-8, 2022: buy above $1,842 (21 SMA - descending wedge) Posted: 07 Jun 2022 07:55 AM PDT
Gold (XAU/USD) is rebounding from the daily low at $1,833 and is now trading above the 21 SMA and below the 200 EMA on 1-hour charts. It is currently located at $1,845, making a slight correction after having found resistance at the 200 EMA around $1,850. According to the 1-hour chart, we can see the formation of a descending wedge. The breakout of this pattern could confirm the bullish movement of gold and it could reach the resistance zone of 6/8 Murray around $1,875 in the coming hours. Gold benefited as US Treasury yields have fallen during the European session and are likely to continue their decline during the American session. Additionally, the US dollar index is also showing signs of weakness which favors gold. Consolidation on the 4-hour chart and a daily close above $1,850 could mean acceleration of the bullish move, and the outlook for gold is positive as it could reach the zone of $1,865 and $1,875. Investors are concerned about the rate hike in the US because it reduces the demand for this safe-haven asset that does not generate interest or return. As long as it remains trading below 6/8 Murray, any momentum in gold will be considered a technical correction. The bearish pressure exerted below this zone could send gold lower again. In the medium term, a close above $1,875(6/8) could mean an advance in gold as it could reach the psychological level of $1,900 or even the zone of 7/8 Murray at 1,937. In the short term, our signals remain positive due to the falling wedge pattern. This technical figure should be confirmed if gold consolidates above the 200 EMA. If this happens, we could buy gold with targets at $1,869 and $1,875. The eagle indicator has reached the extreme oversold zone since June 6 which is an imminent sign of a technical correction in the next few hours, supporting our bullish strategy. The material has been provided by InstaForex Company - www.instaforex.com |
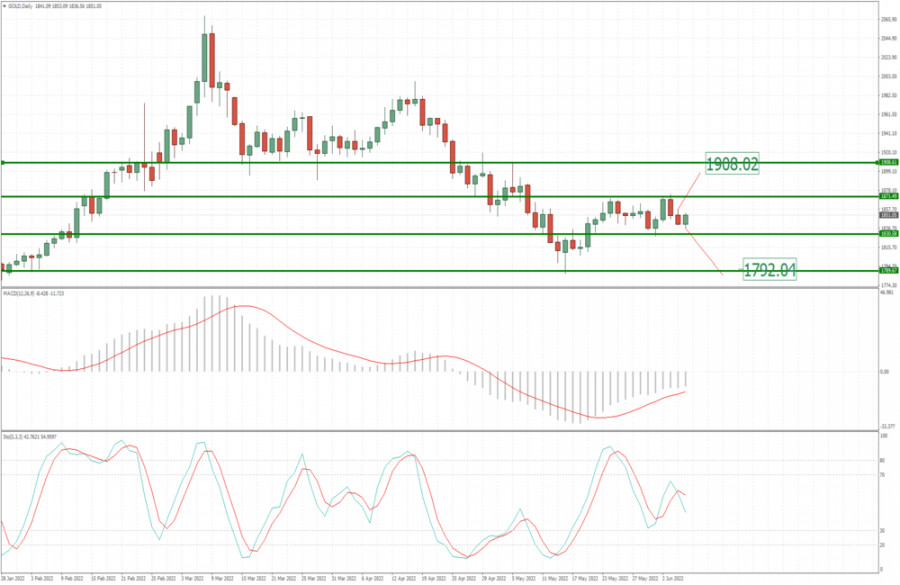
| Analysis of Gold for June 07,.2022 - Watch for the breakout of the sideways base Posted: 07 Jun 2022 07:53 AM PDT Technical analysis:
Gold has been trading sideways in the past 10 days and I see potential for the breakout in the next period. Watch for the breakout to confirm further direction. Trading recommendation: In case of the upside breakout of the resistance at $1.872, watch for buying opportunities on the intraday dups with the upside objective at $1.908 In case of the downside breakout of the support at $1.829, watch for selling opportunities on the intraday rallies with the downside objective at $1.792 The material has been provided by InstaForex Company - www.instaforex.com |
| Posted: 07 Jun 2022 07:31 AM PDT
Dovish decisions are out of fashion now, and the new reality is forcing even the most convinced supporters of soft monetary policy to shift their stance to a hawkish one. The ECB has signaled a rate hike, but the euro is in no hurry to go higher. Monetary policy tightening makes the currency more expensive. Should we expect such a move from the euro or are market players looking at the current situation from a slightly different angle? Rate hikes always have their negative sides. Monetary tightening aimed at fighting inflation will undermine the euro bloc's already struggling economy. According to economists at Barclays, the ECB will warn of an economic slowdown that will follow a rate hike at Thursday's meeting. This stops euro buyers from acting decisively.The first hike by 25 basis points is expected to take place at the July meeting. Rates are likely to increase by a similar amount at subsequent meetings throughout the year until December 2022. Barclays also assumes another increase in the first quarter of next year. This would bring the rate to 0.75%. Previously, economists have written about two rate hikes of 25 basis points in 2022 and four by a similar amount in 2023. Due to persistent inflationary pressures and impending policy tightening, Barclays revised its forecast for eurozone GDP growth this week. A moderate technical recession is expected at the end of the year and real GDP growth averages to 0.5% in 2023 from 1.8%. There are concerns that the ECB's actions could destabilize the economic situation in the euro bloc, especially in peripheral countries. In this case, the regulator would have to take forced measures, i.e. to abruptly stop the rate hike program. The risks of such developments will be higher if the Central Bank decides to raise the rate by 50 basis points at once. A disorderly widening of the spread between the core countries and the periphery may begin. The ECB will not only have to stop the cycle of monetary policy tightening early. The launch of a new quantitative easing program to close the spreads, for example, will come as a big surprise to markets. Such an outcome is negative for the euro. The single currency is not soaring after the signals of the ECB policy tightening. Nevertheless, it managed to bounce from the dangerous May lows. It looks like the bottom at 1,0349 was broken and the parity is not expected. These levels may well be a thing of the past if the ECB continues its steady but modest cycle of rate hikes. The downside risk for EUR/USD would be for the ECB to end its cycle earlier than the markets are currently pricing in, leaving interest rates in the eurozone much lower than in the UK, the US, and other developed markets. Meanwhile, Morgan Stanley is positive about the upcoming event this week and makes a recommendation to buy the pair EUR/USD. "The upcoming ECB meeting may prove a key EUR-positive catalyst. We think the time has come to buy EUR/USD," the bank said. Growing inflation in the eurozone may cause increased concern in the ECB and force the regulator to act wider and faster than the market currently expects, according to Morgan Stanley. In June, the EUR/USD pair maintains a consolidation period near 1.0600 and 1.0787. This week, the ECB may open the way to 1.1000.
Clearly, it's not just about the ECB, the US dollar looks pretty strong, and it would be nice to see a weaker USD for a euro recovery. What will it take to weaken the US dollar? Factors such as the balance of risks to global economic growth, and China's recovery from lockdowns. In addition, the Fed should soften its monetary policy due to growing worries about recession. If the rate of Fed policy normalization slows down, and the data on the EU economy are strong enough along with the increase in rates, we can expect a rise in the EUR/USD pair to the area of 1.1400, Morgan Stanley forecasts. Goldman Sachs economists remain positive about the medium-term outlook for the euro and expect the currency to rise to 1.1000 in the coming months. The material has been provided by InstaForex Company - www.instaforex.com |
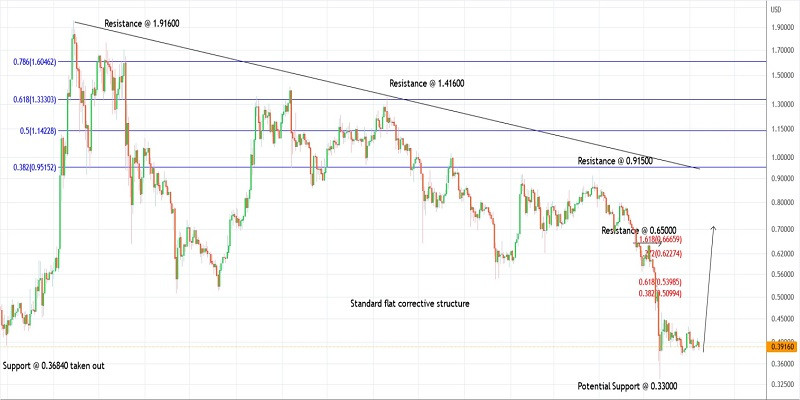
| Trading plan for Ripple on June 7, 2022 Posted: 07 Jun 2022 06:57 AM PDT
Technical outlook:Ripple dropped through the $0.38300 mark on Tuesday after printing $0.40850 highs on Monday. The crypto has then found support and has bounced back towards $0.39200 at this point of writing. Bulls might be poised to come back in control from here and hold prices above the $0.38000 mark to keep the near-term structure constructive. Ripple has been working on a potential countertrend rally towards $0.66650 as projected on the daily chart. It has terminated the first leg around $0.46400, while the second leg seems to be completed around $0.37500 respectively. If the price holds above well, the next leg should resume higher from here and push through the initial resistance above the $0.65000 mark. Ripple has dropped from $1.91600 through $0.33000 as seen on the daily chart, carving a meaningful downswing. Notably, the previous support around $0.36840 was also taken out with ease as bears showed their strength. Ideally, at least a pullback rally can be expected from the current levels and up to $0.66650, if not towards another high. Trading plan:Potential rally through $0.66650 Good luck! The material has been provided by InstaForex Company - www.instaforex.com |
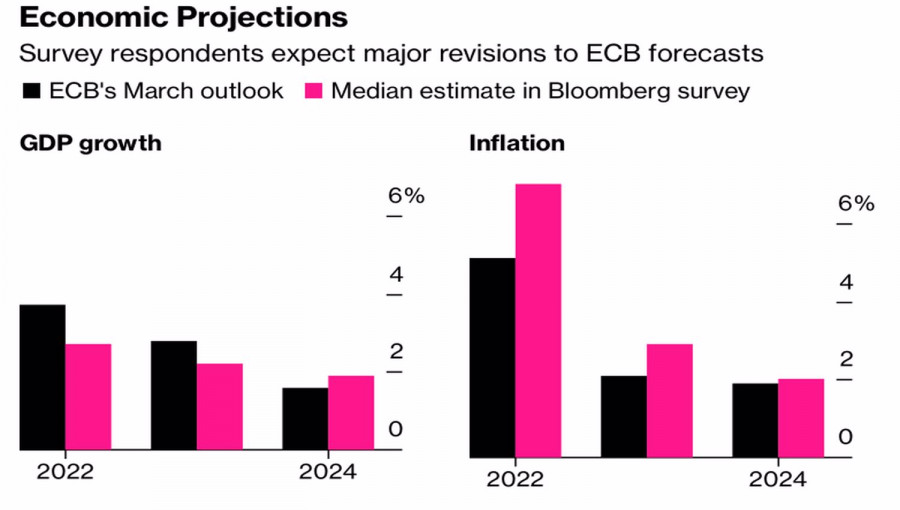
| Posted: 07 Jun 2022 05:43 AM PDT The situation in the forex market is dynamic. At the beginning of the year, the European Central Bank did not even think about interest rate hikes, members of the Governing Council talked about some three conditions necessary for monetary policy tightening that had not yet been met, and the derivatives market signaled a modest 15 bp increase in the deposit rate. Nowadays, ECB President Christine Lagarde outlined a plan to raise borrowing costs from -0.5% to zero by the end of September, but a week later, the idea was scrapped by hawks and investors. Market participants expect the European Central Bank to increase the rate by 135 bp. by the end of 2022, which makes the euro stronger. The European currency is no longer what it used to be. However, its main rival in the face of the US dollar is still full of strength. Of course, the fact that the ECB is going to launch its monetary policy tightening later than the Fed, the Bank of England, and other leading central banks, has come under criticism. However, some analysts, on the contrary, accuse the regulator of being too hasty as the Eurozone economic recovery is facing a price shock and a cost-of-living crisis. Moreover, the currency bloc is close to the zone of armed conflict in Ukraine. The region is highly dependent on Russian oil and gas but is forced to bite the hand that feeds it by imposing sanctions, including an embargo. In such a situation, an acceleration in inflation to an all-time high of 8.1% and a slowdown in economic growth can be seen as an objective reality. Christine Lagarde and her colleagues realize it, as do Bloomberg experts. The latter expect significant adjustments in the ECB's projections following the outcome of the June meeting. According to forecasts, the central bank's inflation estimate for the end of 2022 will rise from 5.1% to 7%, and its outlook for GDP will decrease from 3.7% to 2.7%. Outlooks for EU growth and inflation
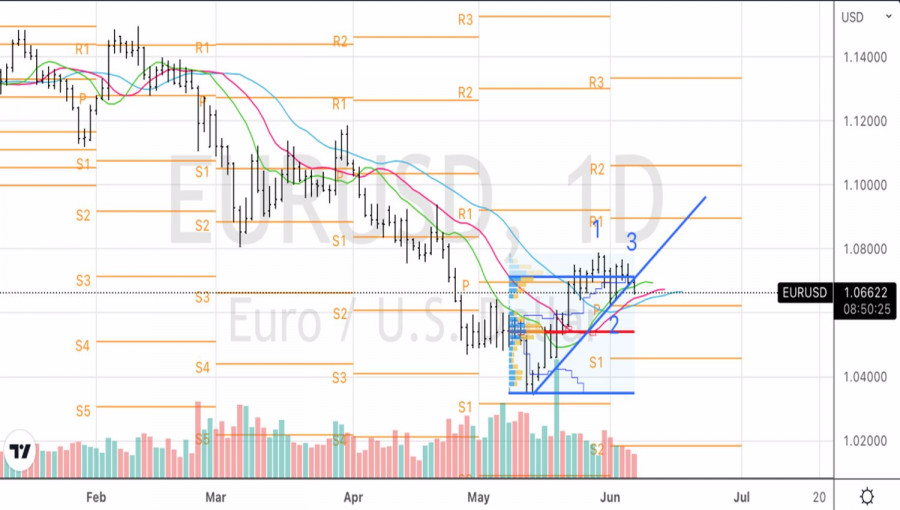
The main issue of concern for financial markets is whether Christine Lagarde will raise the deposit rate by 50 bp. in July, depending on incoming data, or not. The derivatives market expects a 37.5% increase in borrowing costs at the next Governing Board meeting, which implies a 50% chance of a 50 bp hike. If inflation continues to rise, the ECB will most likely take a more aggressive approach to fighting high consumer prices in September. This, in turn, will help the euro stay afloat. At the very least, a fall in the EUR/USD quotes to parity is unlikely. However, market sentiment is bearish due to other fundamental factors. With US stocks falling and Treasury yields skyrocketing, the USD index is expected to edge higher. EUR/USD. Daily chart
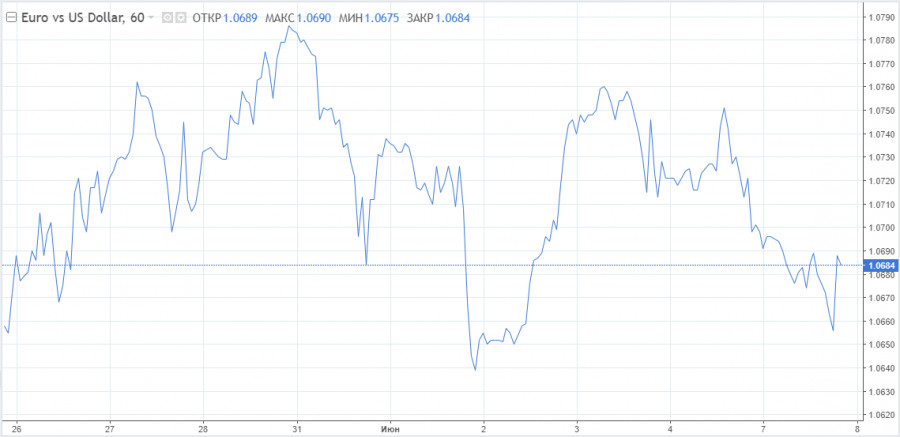
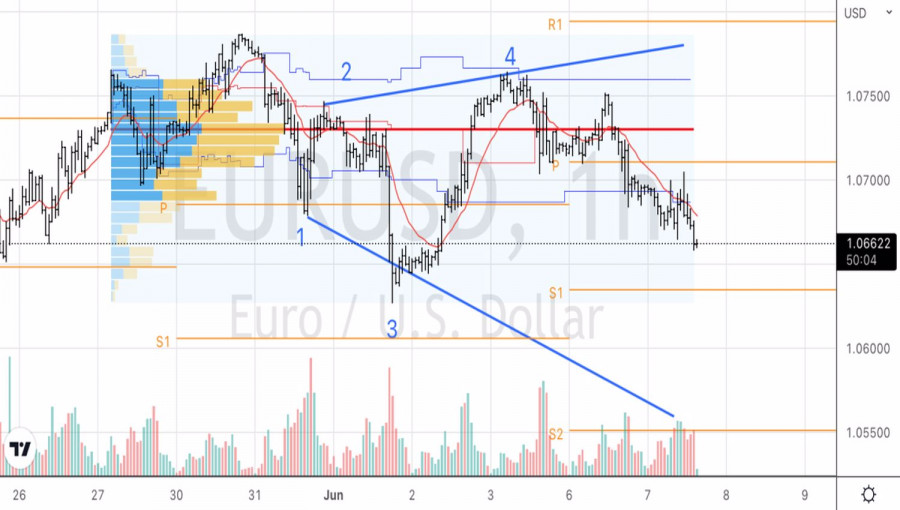
EUR/USD. Hourly chart
From a technical point of view, the EUR/USD pair continues to form the 1-2-3 pattern on the daily chart. I recommend holding short positions opened amid a breakout of the support level at 1.07. According to the hourly chart, the quotes are likely to form the Rising Wedge pattern. This scenario requires a test of the pivot level at 1.063, after which the price is expected to pull back. We will use it to open additional short positions. The material has been provided by InstaForex Company - www.instaforex.com |
| EUR/USD and GBP/USD technical analysis recommendations on June 7, 2022 Posted: 07 Jun 2022 05:19 AM PDT EUR/USD
Higher time frames The movement has not developed into a proper trend yet. The pair is holding in a consolidation zone which is formed by two weekly levels: a short-term trend (1.0642) and the Fibo Kijun line (1.0787). An attempt to break through these levels and settle there will help eliminate instability and uncertainty and pave the way for new targets. The next targets for bulls are the weekly medium-term trend (1.0922) and the upper boundary of the daily Ichimoku Cloud. The cancellation of the daily Golden Cross pattern (1.0620 -1.0568 -1.0516) reinforced by the monthly level of 1.0539 may be an important change for bears.
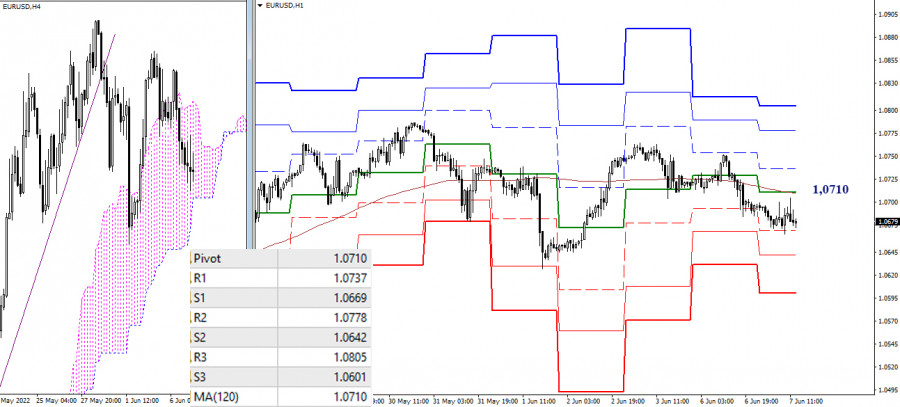
H4 - H1 Uncertainty on higher time frames often leads to changing targets on lower ones. At the moment, bears are in control of the market as the pair is trading below the key levels located at 1.0710 (central Pivot point + weekly long-term trend). At the moment, the pair is testing the first support of the classic Pivot points at 1.0669. Further targets can be the levels of 1.0642 (S2) and 1.0601 (S3). If bulls intensify their activity, the main targets for the day will be the resistance found at the classic pivot levels (1.0737 – 1.0778 – 1.0805). ***GBP/USD
Higher time frames The pound is consolidating within the levels of the daily Golden Cross formed between 1.2471 and 1.2548. The final levels of the cross (1.2350 - 1.2410) will serve as the nearest downward targets in case of a decline. The main upward targets are still located in the area of 1.2652 - 1.2678 (weekly short-term trend + lower boundary of the monthly Ichimoku Cloud) and 1.2764-84 (weekly Fibo Kijun line + lower boundary of the daily cloud).
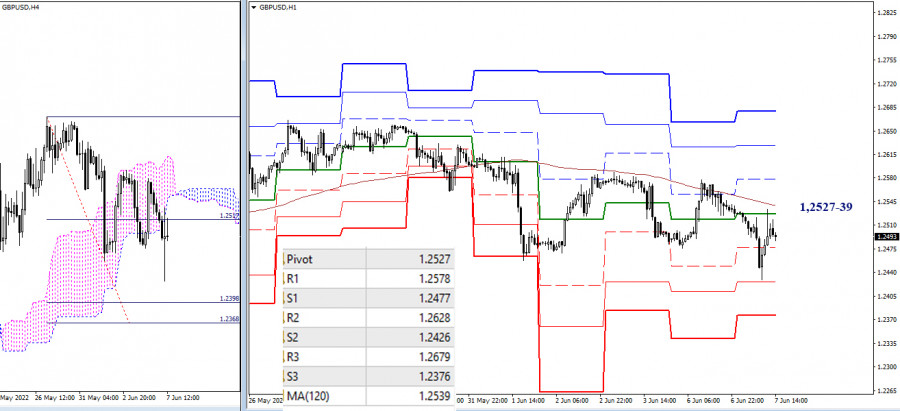
H4 - H1 On lower time frames, sellers were able to maintain their strong position. They have recently formed a downward target, aiming to break below the Cloud on H4. The levels of 1.2368-98 on H4 and support at the pivot levels of 1.2477 – 1.2426 – 1.2376 serve as the main goals for bears today. On lower time frames, downward targets are found around 1.2527-39 (central daily Pivot level + weekly long-term trend). If the price consolidates above this range, the market balance will change. Upward targets are located at the resistance of the pivot points of 1.2578 - 1.2628 - 1.2679. ***Technical analysis was based on: Higher time frames – Ichimoku Kinko Hyo (9.26.52) + Fibo Kijun levels H1 - Pivot Points (classic) + 120-day Moving Average (weekly long-term trend) The material has been provided by InstaForex Company - www.instaforex.com |
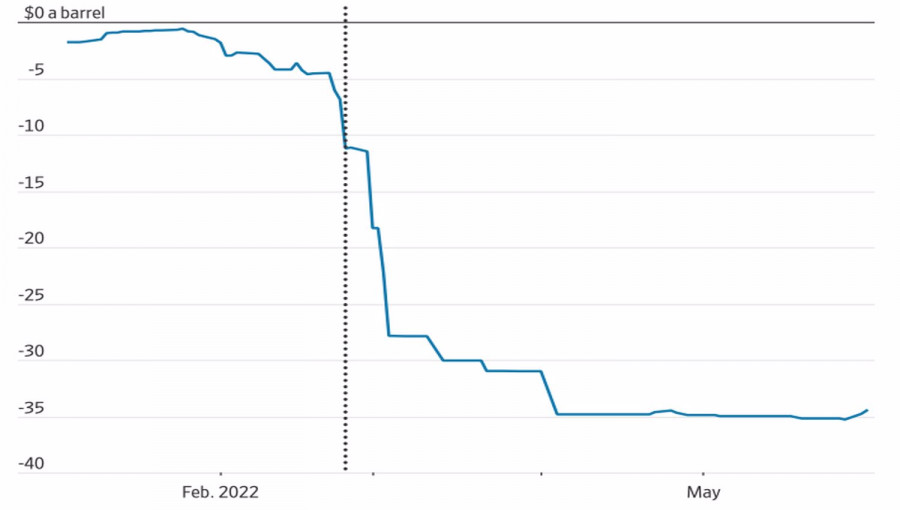
| Posted: 07 Jun 2022 04:58 AM PDT Joe Biden, who previously called Saudi Arabia a pariah, is now ready to do much to get Riyadh to recover the oil market by means of increased production. Saudi Arabia is also making concessions, which is reflected in an increase in planned production by OPEC+ from +430,000 to +650,000 bpd already from July. However, this does not help the Brent bears much. Oil continues to rally as, firstly, there is little difference between the 650k bpd and 430 bpd that has already been factored into the quotations for the North Sea grades. Secondly, according to S&P Global, OPEC+ has produced 2.6 mln bpd less than planned over the last few months due to capacity problems amongst individual members. This is not only about Russia, but also about other members of the alliance. The Rapidan Energy Group estimates that the cartel and its allies will only be able to increase production by 355k bpd over the next two months. Finally, thirdly, 650,000 bpd is negligible compared to 3m bpd. The IEA calculates that global supply would fall by this amount if Russia were to be squeezed out of the market. Obviously, Russia needs to put a lot of effort into rectifying the situation. Both the old tanker-to-tanker schemes, following the examples of Venezuela and Iran, and a serious discount for buyers are being used. Currently, the difference in price between Brent and Urals is as high as $35 a barrel. Dynamics of the discount between Brent and Russian oil
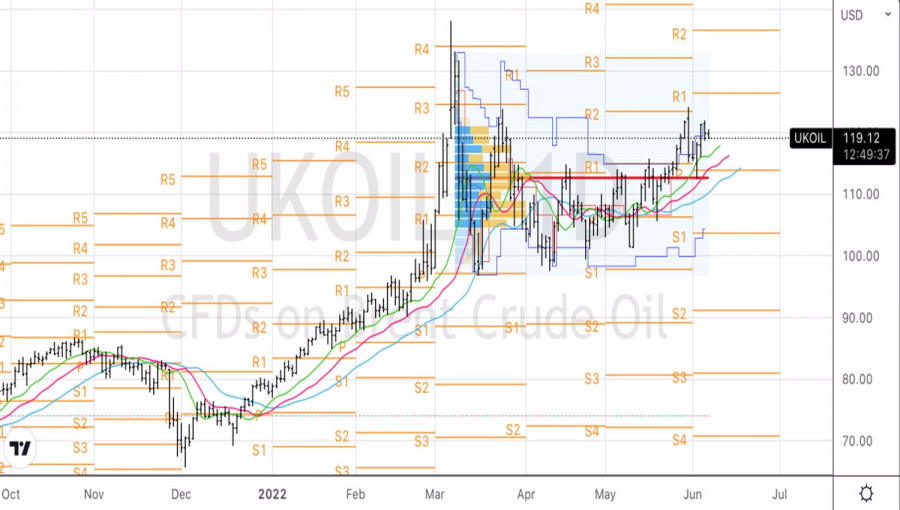
Saudi Arabia, on the contrary, increased black gold prices for its Asian customers by $2.1 per barrel against Bloomberg experts' forecasts of +$1.8 per barrel, indicating Riyadh's confidence in the market's bright future. Goldman analysts estimate that Brent crude will need to average $135 a barrel in the 12 months from July, up $10 from its previous forecast, for global inventories to normalize by late next year. They are now 75 million barrels less than expected. The deficit is estimated by the bank to average 400k bpd in the third quarter. Although production in Russia has fallen less than forecast, it continues to do so. By the end of 2022 the figure will be down by 1 million bpd from 10.8 million bpd in May. Thus, the supply shortage associated with the displacement of the Russian Federation from the oil market requires higher prices for the North Sea grade. This, combined with the end of lockdowns in China, sets the stage for its rally to continue. Brent, daily chart
As long as Brent remains above $112.5 per barrel, the bulls continue to control the situation. The current risks to the recovery of the uptrend give grounds for buying on a rebound from dynamic resistance in the form of moving averages near $117, $115.5 and $114. The material has been provided by InstaForex Company - www.instaforex.com |
| You are subscribed to email updates from Forex analysis review. To stop receiving these emails, you may unsubscribe now. | Email delivery powered by Google |
| Google, 1600 Amphitheatre Parkway, Mountain View, CA 94043, United States | |


Comments