Forex analysis review
Forex analysis review |
- USD/JPY Technical Analysis and Trading Tips on June 7, 2022
- Trading plan for Ethereum for June 7, 2022
- EUR/USD: technical analysis for June 7, 2022
- USD/JPY: at 20-year highs
- Trading plan for Bitcoin for June 07, 2022
- GBP/USD. June 7. Boris Johnson survives vote of no-confidence
- Trading plan for Silver for June 07, 2022
- Trading plan for Gold on June 07, 2022
- Daily Video Analysis: EURUSD, H4 Potential Bearish Breakout
- AUD/USD: RBA's surprise move, strengthening greenback and Aussie's upside outlook
- Asian stocks show mixed trading
- Trading plan for USD/JPY for June 07, 2022
- Video market update for June 07, 2022
- Trading plan for GBP/USD for June 07, 2022
- Trading plan for US dollar index for June 07, 2022
- Trading tips for AUD/NZD
- Australian dollar trades downward despite RBA decision to raise rates
- Weekly forecast for simplified wave analysis of GBP/USD, AUD/USD, USD/CHF, EUR/JPY, US Dollar Index from June 7
- Analysis and forecast for GBP/USD on June 7, 2022
- Trading plan for EUR/USD for June 07, 2022
- Overview of USD, NZD and AUD: Results of the RBA meeting are in line with forecasts. Global yields rushed up
- EUR/USD: analysis and forecast for June 7, 2022
- Forex forecast 06/07/2022 AUD/USD, USD/JPY, USD/CAD, GBP/USD and Bitcoin from Sebastian Seliga
- Tips for beginner traders in EUR/USD and GBP/USD on June 7, 2022
- Bitcoin loses bullish potential and starts to decline
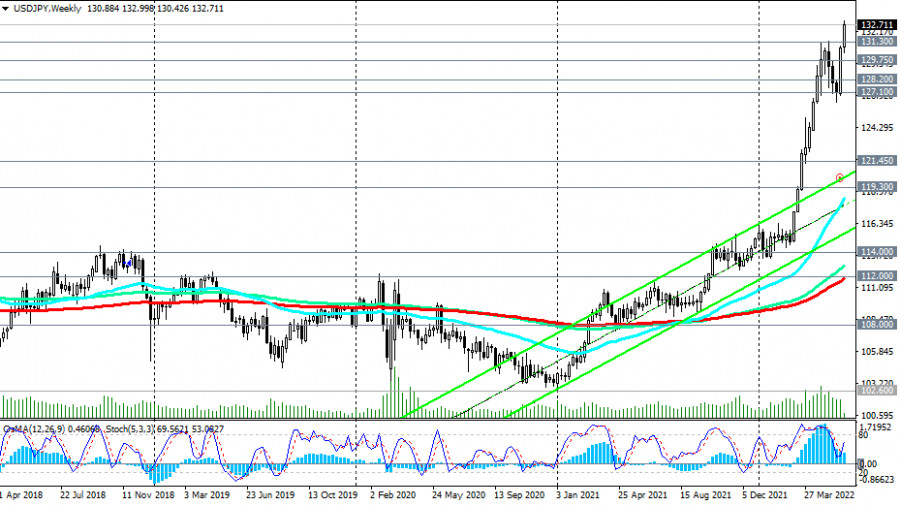
| USD/JPY Technical Analysis and Trading Tips on June 7, 2022 Posted: 07 Jun 2022 06:41 AM PDT As we noted in our previous review dated 04/11/2022, the divergence in the monetary policy rates of the Fed and the Bank of Japan is likely to increase, creating prerequisites for further growth of USD/JPY. In this case, the pair will head towards multi-year highs near 135.00, reached in January 2002.
Our forecast was fully justified, and the set targets (Buy Stop 125.50. Stop Loss 124.40. Take-Profit 125.65, 126.00, 127.00, 128.00, 134.00, 135.00) were reached by about 80%. Ahead are the marks 134.00, 135.00. With continued growth rates, the USD/JPY pair may reach them this month, and then continue to grow.
The continued positive upward trend in the yield of 10-year US bonds makes the dollar an attractive asset for investment, given the prospects for further tightening of the Fed's monetary policy. The dollar is also actively used as a defensive asset, winning back the advantage from such traditional defensive assets as gold, franc, and yen. In the current situation, short positions in USD/JPY can only be considered as part of a short-term correction.
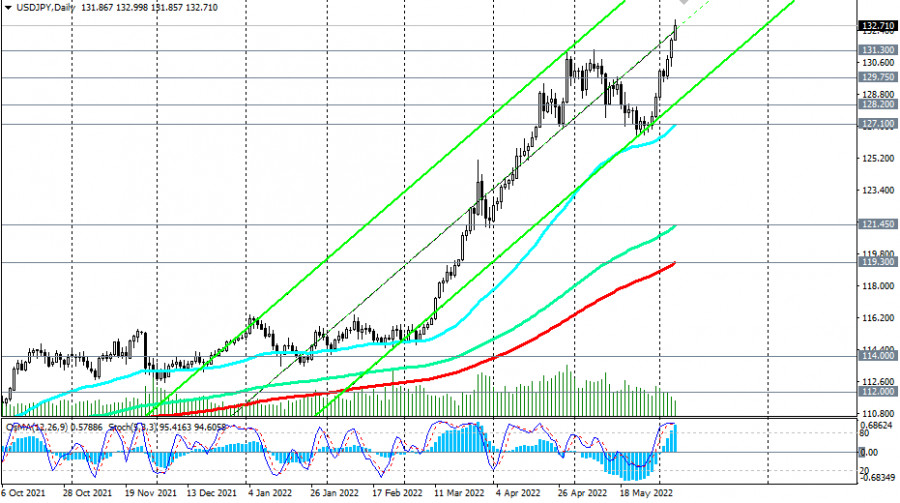
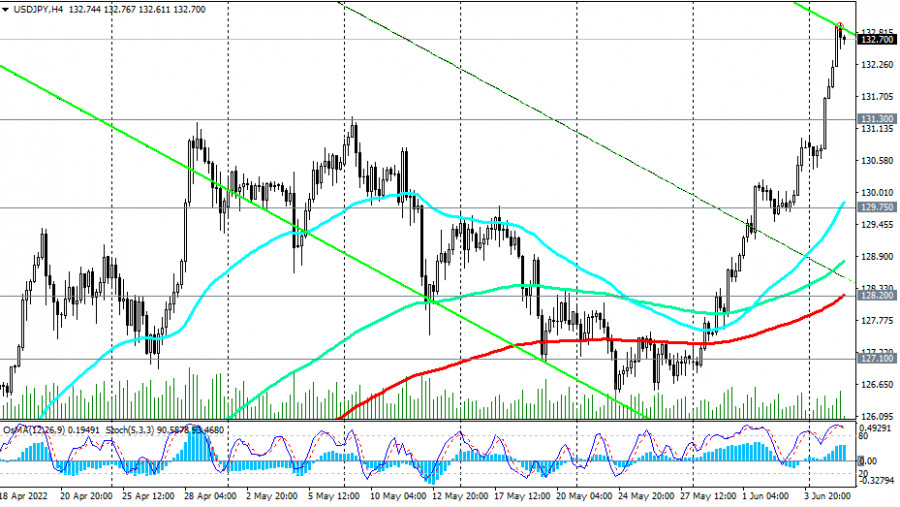
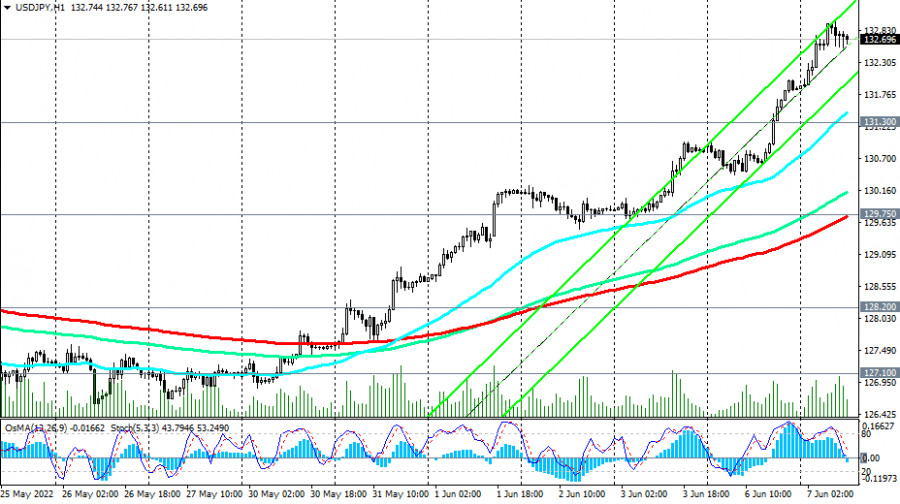
At the time of writing this article, the USD/JPY pair is trading near 132.70, having slightly decreased from the local high of 133.00 reached during today's Asian trading session. The breakdown of this local resistance level will be a signal to increase long positions. You can also place pending orders to buy near the support levels of 131.60 (200 EMA on the 15-minute chart), 131.30, 131.00 (local support levels). Only a breakdown of support levels 127.10 (50 EMA on the daily chart), 127.00 (local support level) should alert buyers. In this case, we can return to the consideration of the possibility of short positions on USD/JPY. In the meantime, long positions remain preferable.
Support levels: 132.00, 131.30, 131.00, 129.75, 128.20, 127.10, 127.00 Resistance levels: 133.00, 134.00, 135.00, 136.00 Trading Tips Buy Stop 133.10. Stop Loss 131.80. Take-Profit 134.00, 135.00, 136.00 Buy Limit 131.00, 130.00, 129.00, 128.00, 127.00. Stop Loss 126.20. Take-Profit 132.00, 133.00, 134.00, 135.00, 136.00 The material has been provided by InstaForex Company - www.instaforex.com |
| Trading plan for Ethereum for June 7, 2022 Posted: 07 Jun 2022 06:33 AM PDT
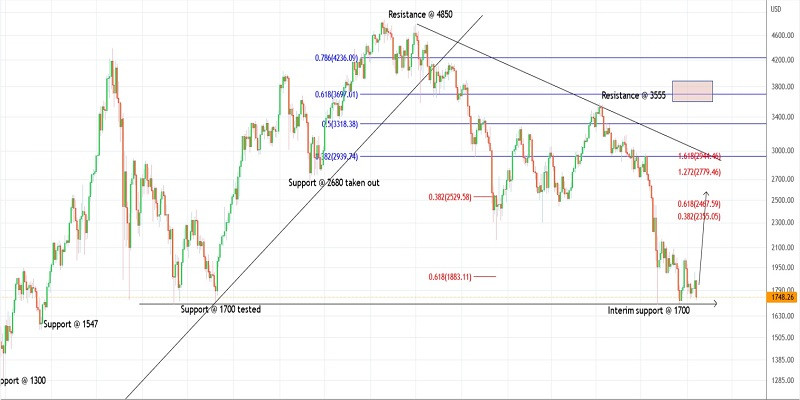
Technical outlook:Ethereum has dropped again through the $1,740-50 zone after reversing from the high of $1,920 on Monday. The crypto might retest the low of $1,700 before resuming its rise. Bulls are inclined to hold prices above $1,600-50 to keep the near-term structure favorable for a rally towards the $3,500-3,600 zone (potential expended flat). Ethereum has been working on a countertrend rally since registering lows at the $1,700 mark earlier. Price action has remained range-bound since then and could print marginally below the $1,700 mark before finding support again. Upside potential remains towards $3,000, which is initial resistance followed by the $3,500-3,600 zone. Ethereum has carved a larger degree downswing between $4,850 and $1,700. A high probability remains for a corrective phase of a similar degree unfolding from here. If the above structure unfolds accordingly, potential remains for a rally up to the $3,500 mark, which is also the Fibonacci 0.618 retracement of the entire drop. Trading plan:Potential rally through $3,500 against $1,500 Good luck! The material has been provided by InstaForex Company - www.instaforex.com |
| EUR/USD: technical analysis for June 7, 2022 Posted: 07 Jun 2022 06:18 AM PDT
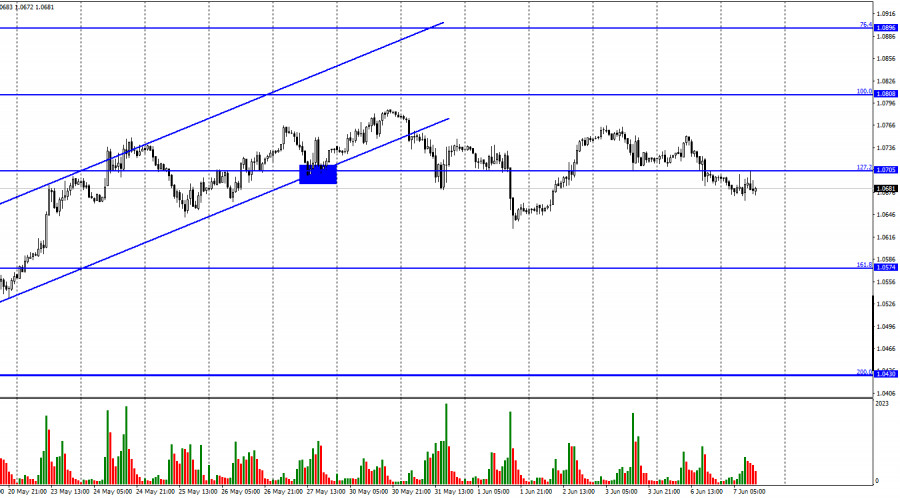
Hello, dear traders! On Monday, EUR/USD reversed downward and consolidated below the 127.2% retracement level of 1.0705. The downward move may extend to the 161.8% retracement level of 1.0574. In the past several days, the pair closed either above or below the mark. In other words, the price is now mainly moving sideways, while bears are somewhat reluctant to act. On Monday, amid the lack of fundamentals, traders focused on the geopolitical background. The EU fears the shortage of grain as Ukraine's seaports continue to remain blocked by Russia. Amid rising oil and gas prices, anti-Russian sanctions, and cutting off almost all ties with Russia, the last thing the EU now needs is a food crisis. Russia is now called on to allow the secure export of grain through Ukrainian ports in the Black sea. The problem is that the Black Sea is mined, and it is not entirely clear who will demine it. In the meantime, inflation in the eurozone may accelerate due to rising food prices, including grain and sunflower oil.
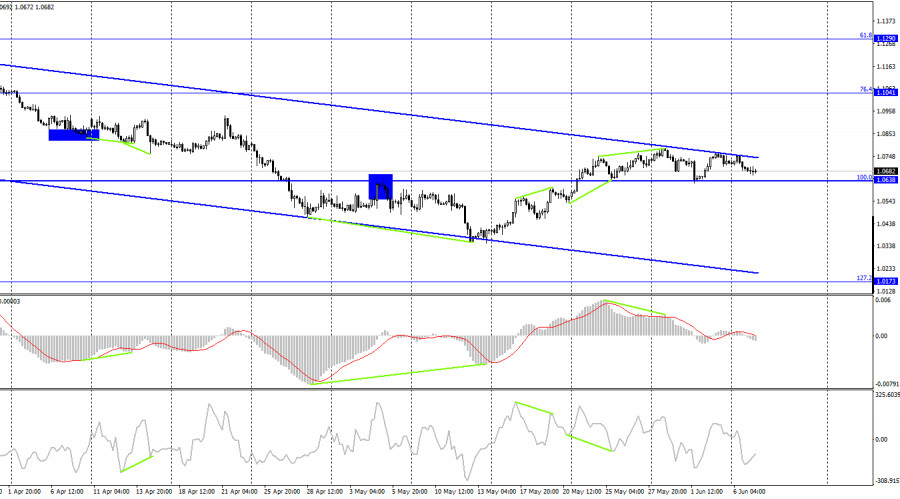
On the H4 chart, EUR/USD bounced off the 100.0% retracement level of 1.0638 to the upper limit of the descending trend corridor. Market sentiment is still bearish. In case of consolidation above the corridor, the pair may rise to the 76.4% retracement level of 1.1041. Alternatively, if the pair settles below the 100.0% retracement level, the downtrend will extend to the 127.3% retracement level of 1.0173. Commitments of Traders (COT):
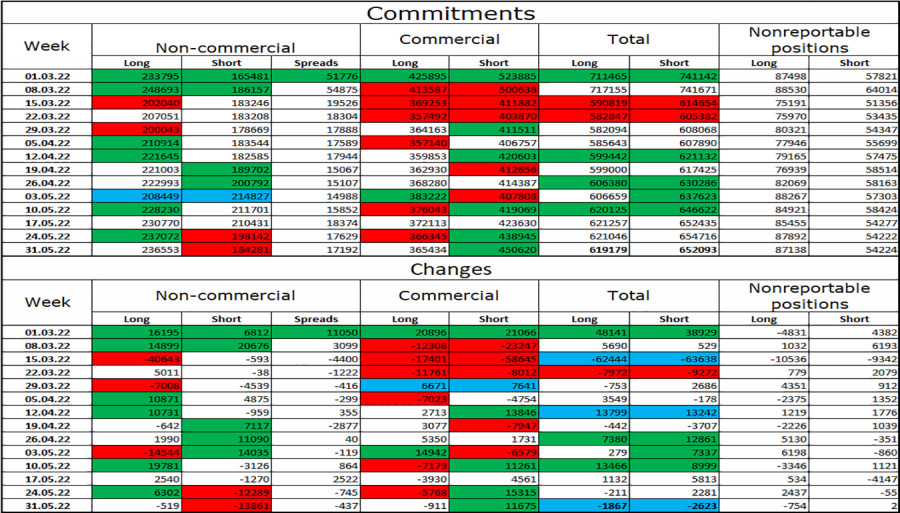
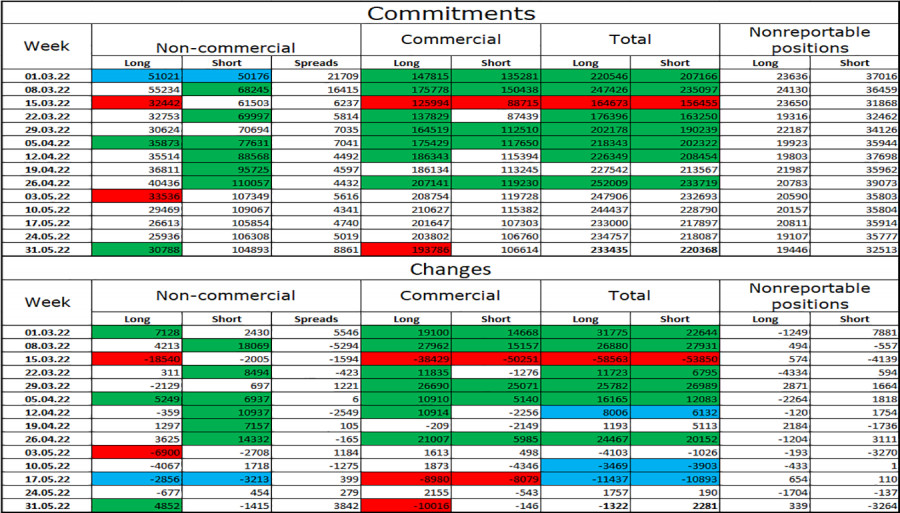
Last week, 519 long positions and 13,861 short ones were closed, indicating bullish bias. The number of long positions now totals 236,000, while the number of short ones is 184,000. Although non-commercial traders have been bullish in recent months, the euro is still in a bearish trend. The euro's growth potential is rising day by day as non-commercial traders become even more bullish. The euro might end up in a prolonged uptrend if bullish sentiment remains strong. Macroeconomic calendar: On June 7, the macroeconomic calendar contains no important releases both in the US and the eurozone. Thus, it will not have any effect on the market today. Forecast for EUR/USD: Short positions could be opened after the price has closed below 1.0638 on the H4 chart, with targets at 1.0574 and 1.0430. Buying could be considered after consolidation above the corridor on the H4 chart, with the target at 1.1041. The material has been provided by InstaForex Company - www.instaforex.com |
| Posted: 07 Jun 2022 06:16 AM PDT "The big decline in the yen in a short amount of time is hurting the economy," Bank of Japan Governor Haruhiko Kuroda said early in the trading day. At the same time, "as long as the moves are not too sharp, a weak yen is beneficial for Japan's economy. One could talk about a strategy to wind down the easing policy if the 2% inflation target were on the horizon, but now is not the time," Kuroda said. On these statements by Kuroda, the yen weakened sharply, and the USD/JPY pair continued to grow, which was interrupted in the previous month, which was negative for this currency pair. Kuroda's remarks follow on from his yesterday's similar remarks about the current exchange rate of the yen and the policy of the Bank of Japan: "Our highest priority is to support the Japanese economy through continued strong monetary easing. The Bank of Japan will be unwavering in its stance to maintain monetary easing to ensure that the recent rise in inflation expectations will lead to sustained price increases." In fact, Kuroda only confirmed his already traditional statements about the monetary policy of the central bank and the inclination of its leadership to continue the ultra-loose monetary policy. Since January 2016, the key interest rate in Japan has become negative. During the meeting on January 26, 2016, the Bank of Japan made it negative for the first time, reducing it from 0.10% to -0.10%. And since then, at every meeting, the leaders of the Bank of Japan have declared the need to maintain a negative interest rate and the parameters of the current ultra-loose monetary policy. And now, when many of the world's largest central banks have begun a cycle of tightening their monetary policies, the Bank of Japan does not intend to deviate from its beliefs on this matter. "It is advisable to maintain the current strong monetary easing to support the economy. Western central banks are normalizing policies, but Japan is not in that situation given its economy and price trends," Kuroda said, commenting on the April 28 meeting of the Bank of Japan, where he reaffirmed his intention not to raise interest rates despite accelerating inflation. According to the forecast of the leaders of the bank, the core inflation in the country (in the financial year ending in March 2023) will reach 1.9%, only approaching the target level set by the central bank of 2%, and in the 2023–2024 financial year, inflation will slow down to 1.1% and will remain at this level in the following financial year. At the same time, according to the bank's forecast, this fiscal year the Japanese economy will grow by 2.9%, and not by 3.8%, as previously thought. In 2023–2024, GDP growth is expected at 1.9%, and in the next fiscal year at 1.1%, demonstrating a slowdown. As a result of this (April 28) meeting, the central bank also stated that it will buy 0.25% government bonds every business day to keep the yield below this level, which is also a powerful quantitative easing tool used by many central banks. Thus, the yen will remain the most vulnerable among the world's major currencies, also supporting the growth of the DXY index (the share of the yen in the basket of the DXY index of 6 currencies is known to be approximately 14%).
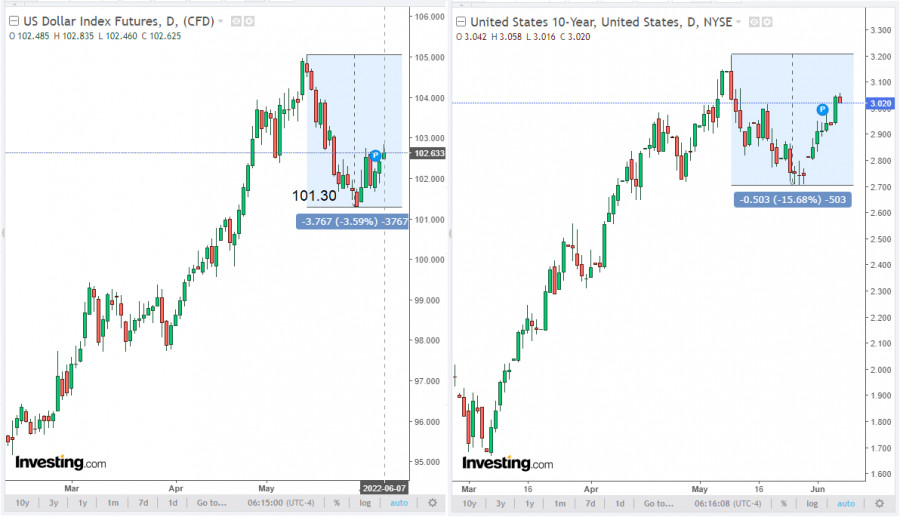
At the same time, the dollar continues to strengthen, while the dollar index (DXY) continues to rise. At the time of writing this article, DXY futures are trading near 102.63, 133 points above the local low of 101.30 hit last week. During today's Asian trading session, USD/JPY hit a 20-year high at 133.00 and its positive momentum continues.
The dollar is also receiving support from the high yields of US government bonds. They continue to fall in price, while the yield on 10-year bonds reached 3.058% today, the highest level since May 12. The continued positive upward trend in the yield of 10-year US bonds makes the dollar an attractive asset for investment, given the prospects for further tightening of the Fed's monetary policy. The dollar is also actively used as a defensive asset, winning over traditional defensive assets such as gold, franc, and yen. Today, market participants who follow the dynamics of the yen and the USD/JPY pair are likely to pay attention to the publication of the report by the Japanese cabinet ministers with data on the country's GDP for the 1st quarter of 2022. In the previous 4th quarter, the country's GDP grew by +1.1% (+4.6% in annual terms) after falling by -0.9% (-3.6% in annual terms) in the 3rd quarter, growth in the 2nd quarter by +0.5% (+1.5% in annual terms) and falling in the 1st quarter of 2021 by -1.0% (-3.7% in annual terms). The data point to the uneven recovery of the Japanese economy after its collapse due to the coronavirus pandemic in 2020. Today's final release implies that Japan's GDP fell by -0.3% (-1.0% YoY) in Q1 2022, negative for both the yen and the Japanese stock market. The forecast assumed a decline of -0.4% (-1.8% in annual terms). Better-than-expected data is likely to help the Japanese stock market and the yen rise. An upward trend in GDP is considered positive for the national currency, while a low result is considered negative (or bearish). The material has been provided by InstaForex Company - www.instaforex.com |
| Trading plan for Bitcoin for June 07, 2022 Posted: 07 Jun 2022 06:08 AM PDT
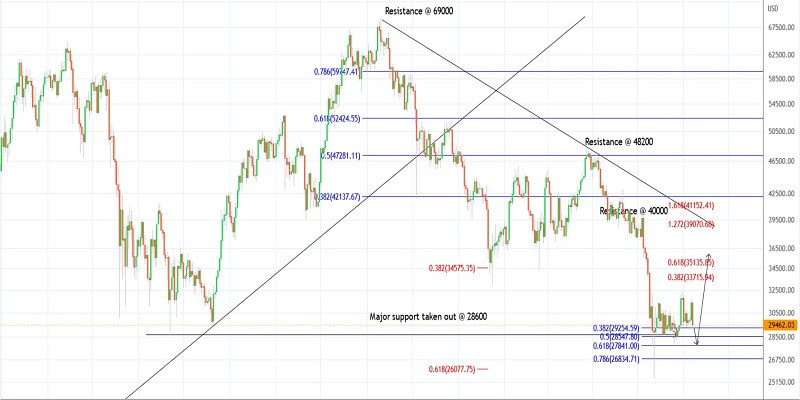
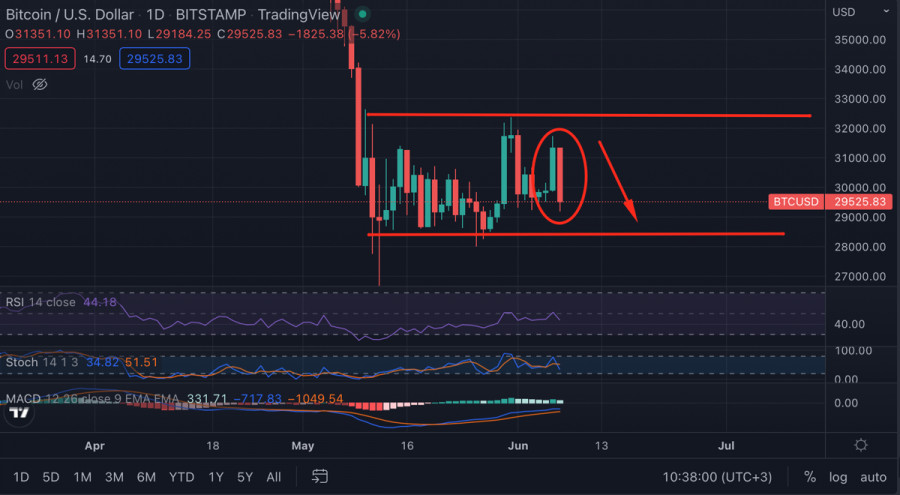
Technical outlook:Bitcoin dropped to $29,500 after facing resistance at around $31,600 on Monday. The crypto is unfolding an Engulfing Bearish candlestick pattern on the daily chart, declining further to $28,000. Bulls will have to hold prices above $25,500 to keep the near-term structure constructive. Bitcoin is still working on a counter trend rally after reaching a low of $25,500 earlier. It might be unfolding as a complex corrective wave structure with the first leg terminating close to $32,500. The second wave might be unfolding and could print marginally below $28,000 before the third leg could resume higher to $42,000 and up to $48,000. Bitcoin is working on its larger degree downswing between the $69,000 and $25,500 levels seen on the daily chart. It needs to start a similar corrective wave to the Fibonacci 0.618 retracement level seen at around $52,000. Traders are likely to open new long positions if prices test $28,000 from here. Trading plan:Potential rally through $42,000, $48,000 and up to $52,000 against $20,000 Good luck! The material has been provided by InstaForex Company - www.instaforex.com |
| GBP/USD. June 7. Boris Johnson survives vote of no-confidence Posted: 07 Jun 2022 05:49 AM PDT
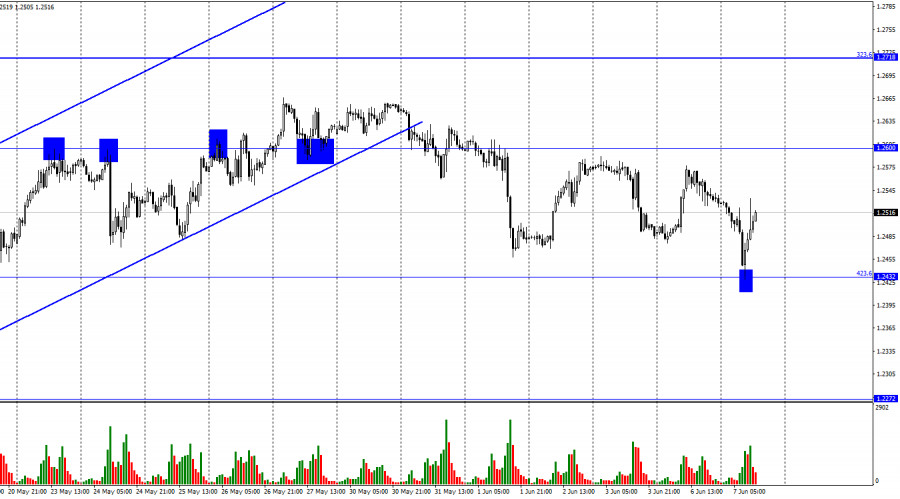
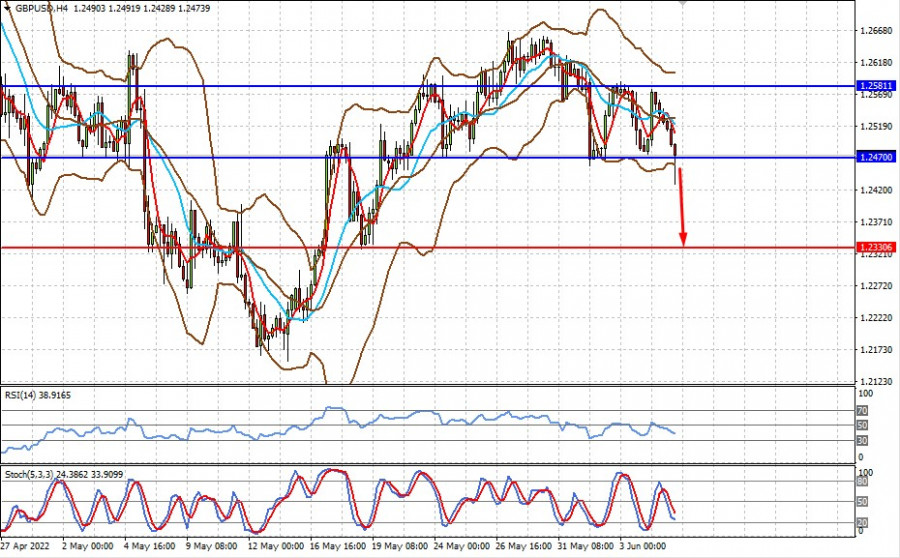
On Monday, on the hour chart, the pair GBP/USD made a reversal. It continued to decline and reached the level of 423.6% - 1.2432. The rebound of the quotes from this level supported GBP and the pair started growing towards 1.2600. The pair's rate fixation under the level of 1.2432 may increase the probability of a drop towards the next level of 1.2272. During the first two days of the week, there has been no information on the UK economy. On the other hand, a significant and fateful event could have happened in the UK yesterday. Very abruptly and unexpectedly, members of the Conservative Party in the British Parliament collected the necessary number of signatures to begin the process of removing Boris Johnson from power and, consequently, from the seat of party leader. A total of 54 signatures were collected, which was enough to start the relevant procedure. Last night, there was a vote among the Conservative MPs, which ended in the defeat of Boris Johnson's opponents. The conservatives failed to get the necessary number of votes for Johnson's resignation. The reason for launching this process was Johnson's own parties during lockdown back in 2020. It was proved that Boris Johnson repeatedly held parties at his residence and invited up to 50 members of Parliament there each time. The Conservative Party decided that such behavior by their leader was hurting not only his personal ratings, but also the reputation of the entire party, so Johnson should resign. The leader of the Labour Party, Keir Starmer, also called on the Prime Minister to resign. However, Johnson declined the offer and only apologized for his behavior. Nevertheless, Johnson is to hold his position for at least 12 months unless he resigns during that time. The motion of no-confidence cannot be repeated within the next year. There will be a few other important events in the UK this week. The US inflation report scheduled for tomorrow is the most important event of the week.
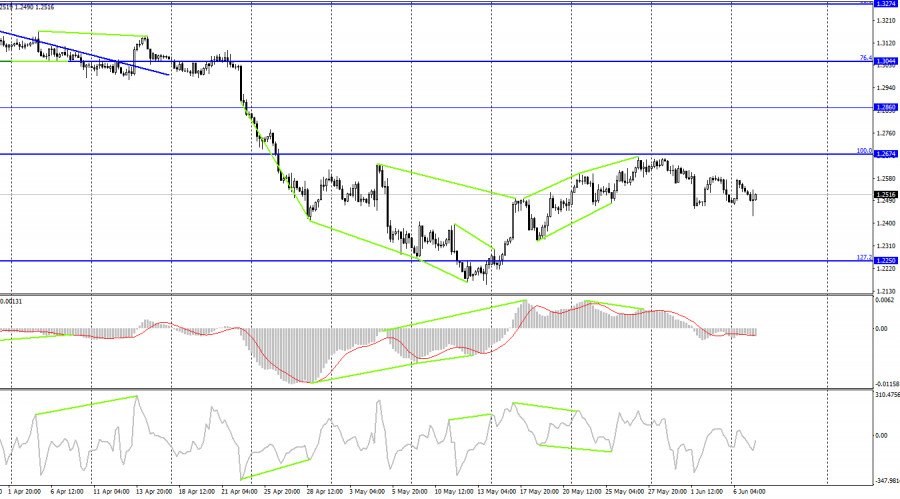
On the 4-hour chart, the pair reversed to the downside after the bearish divergence at the MACD indicator and continues to decline towards the correctional level of 127.2% - 1.2250. A consolidation above the 100.0% Fibo level is likely to support the pound and increase the probability that the pair may continue climbing towards 1.2860. Now, the CCI indicator shows a bullish divergence that may trigger a reversal in favor of the pound and a return to the level of 1.2674. Commitments of Traders report:
The sentiment of non-commercial traders has become a bit more bullish over the past week. The number of long contracts grew by 4,852, while the number of short ones decreased by 1,415. Thus, the general sentiment of big players remained bearish, and the number of longs exceeds the number of shorts by three times. Big players continue to sell the pound and their sentiment has not changed much lately. Therefore, I think that the pound might resume its decline in the next few weeks. The trading ranges on the hourly and 4-hour charts will be of great importance now because such a strong divergence of the Long and Short contract numbers can also indicate a trend reversal. So far, non-commercial traders are selling more than they are buying. Economic calendar for the US and the UK: There are no interesting releases in the UK and US economic calendars on Tuesday. Today the information background will have no influence on traders' sentiment. GBP/USD forecast and recommendations for traders: It is better to sell the pound if the pair closes below the trading channel on the hourly chart with a target of 1.2432. This level was reached today. You may sell the pound if the pair fixes below this level with a target of 1.2272. It is also better to postpone buying the pound. The material has been provided by InstaForex Company - www.instaforex.com |
| Trading plan for Silver for June 07, 2022 Posted: 07 Jun 2022 05:49 AM PDT
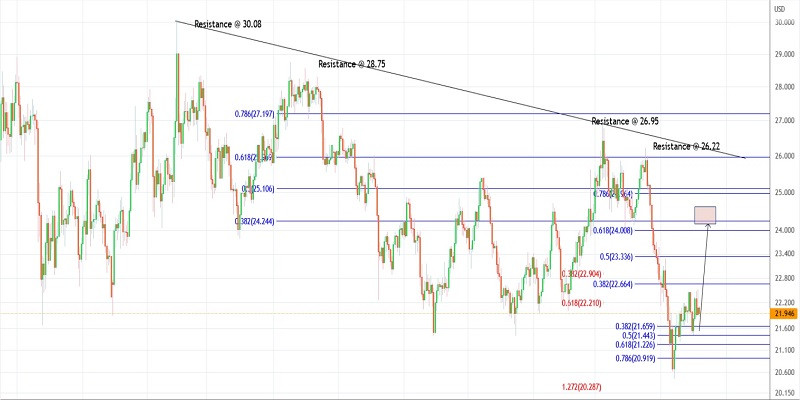
Technical outlook:Silver prices have remained in the range between $21.50 and $22.50 in the last few trading sessions. Silver broke through $21.95 from its Monday high of around $22.50. It might be moving within a triangle consolidation before breaking higher through $24.00-20. Bulls are poised to hold prices above $20.45 in the near term. Silver has started a corrective rally after carving a larger downswing between $26.22 and $20.45 respectively. The proposed corrective rally is probably within its second wave and could terminate ahead of $21.40. If this scenario is correct, bulls may push prices through $24.00-20 in the next few trading sessions. Silver is also facing its Fibonacci 0.618 retracement level around $24.00 along with the past support turned into resistance. It is a strong convergence point for bears to be back in control if prices manage to reach there. Traders might be preparing to hold their long positions for now and then turn lower from $24.00-20. Trading plan:Potential rally through $24.00 against $20.00 Good luck! The material has been provided by InstaForex Company - www.instaforex.com |
| Trading plan for Gold on June 07, 2022 Posted: 07 Jun 2022 05:30 AM PDT
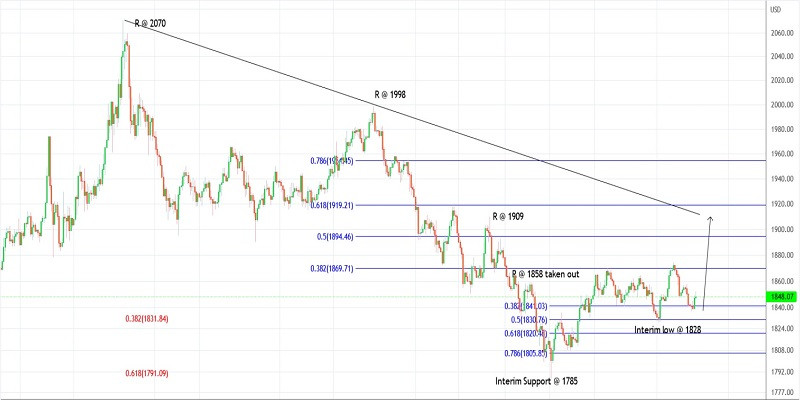
Technical outlook:Gold prices dropped through $1,837 lows on Monday before finding support again. The yellow metal jumped through $1,852 on Tuesday before easing off a bit. Bulls might be poised to come back in control and push through $1,860 in the near term. The price is drifting sideways now and needs to break above $1,870 to accelerate. Gold prices are working on a counter trend, moving from the low of $1,786. The price could be into its last leg higher towards $1,920. The metal has already found support around $1,828, which is the Fibonacci 0.50 retreacement level of the first leg between $1,786 and $1,870 levels respectively. If a potential triangle is carving, prices couldremain sideways for a while. Gold prices have been in a downtrend already and it is expected to resume lower again from $1,920. The recent larger degree downswing is between $1,998 and $1,786, while Fibonacci 0.618 retracement is close to $1,920. High probability remains for a turn lower from there as bears prepare to come back in control. Trading plan:Potential rally through $1,920 against $ 1,781 Good luck! The material has been provided by InstaForex Company - www.instaforex.com |
| Daily Video Analysis: EURUSD, H4 Potential Bearish Breakout Posted: 07 Jun 2022 04:51 AM PDT Today we take a look at EURUSD. Combining advanced technical analysis methods such as Fibonacci confluence, correlation, market structure, oscillators and demand/supply zones, we identify high probability trading setups. The material has been provided by InstaForex Company - www.instaforex.com |
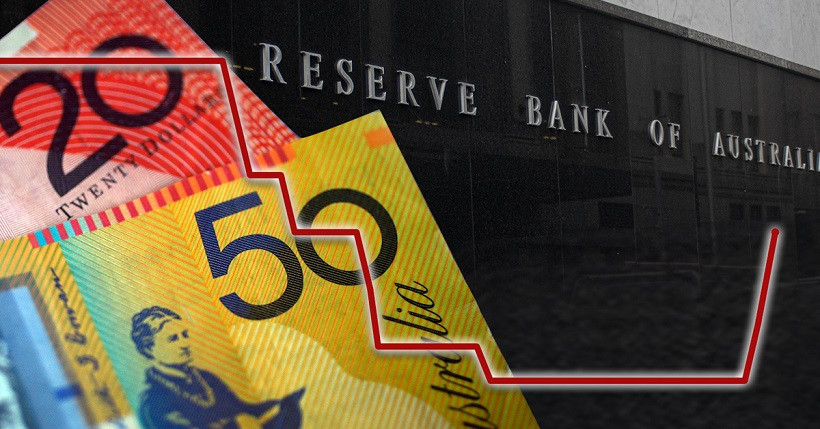
| AUD/USD: RBA's surprise move, strengthening greenback and Aussie's upside outlook Posted: 07 Jun 2022 04:45 AM PDT Following the results of the June meeting, the Reserve Bank of Australia implemented the most hawkish and least expected scenario, raising the interest rate by 50 basis points at once. Whereas the baseline scenario assumed a 25-point increase in OCR. Reacting to this decision, the AUD/USD pair impulsively jumped to the middle of the 72nd figure, however, at the start of the European trading session on Tuesday, it was forced to turn 180 degrees. The Aussie was unable to build on its success due to the sharp strengthening of the US currency throughout the market, against the background of rising oil prices. The US dollar index has updated a two-week high, returning to the area of the 102nd figure. Dollar pairs have changed their configuration accordingly, reflecting the dominance of the greenback. For example, the USD/JPY pair has updated a 20-year price high today. Aussie also succumbed to the pressure of dollar bulls. The AUD/USD pair turned around and dropped by 100 points, to the level of 0.7160. Against the background of such hawkish results of the RBA meeting, such price dynamics look abnormal, but here the Australian dollar has to reckon with the pressure of the greenback. The question is, how long will the AUD/USD bears be able to control the situation, given the fact that the pair has been within the upward trend for almost a month on hawkish expectations regarding the further actions of the RBA?
Now that the Australian regulator has de facto strengthened its hawkish attitude, short positions on the pair look a priori risky, even despite the assertiveness of the US currency. Moreover, the growth of the greenback is, in my opinion, situational and unreliable. Traders reacted to the renewed growth of the oil market, which will inevitably "pull" American inflation. According to a number of experts, if inflation in the United States shows active growth again (despite the fact that the first signs of a slowdown in CPI and PCE growth appeared in May), the Federal Reserve may raise the interest rate at a more aggressive pace, abandoning its intentions to make an autumn pause in the process of tightening monetary policy. But let's return to the results of today's RBA meeting. The regulator stated the fact that inflation is "at too high a level." At the same time, members of the central bank are confident that the Australian economy "will be resistant to further rate increases." It is noteworthy that the regulator actually announced further steps to tighten monetary policy, but at the same time did not talk about the pace and scale of this tightening. The accompanying statement states that the size and timing of the future increase "will be determined by incoming data and an assessment of the prospects for inflation and the labor market." In other words, the regulator has once again "tied" the prospects of monetary policy to the main macroeconomic indicators in the field of inflation and the labor market. If in the second quarter the consumer price index in Australia comes out in the "green zone" again, exceeding the bold forecasts of experts, it will be possible to count on the aggressive pace of the RBA rate hike. It should be noted that the RBA has been making a more hawkish decision for the second time in a row, contrary to the forecasts of most analysts. At the previous meeting, the RBA raised the rate by 25 points, while the market was focused on a 15-point increase. On the eve of the June meeting, the market was ready for a 25-point increase, while the central bank de facto increased the rate by 50 points. And judging by indirect signs, inflation in the second quarter will surprise again with its record growth. For example, electricity prices at the moment are already six times higher than at the beginning of last year: the average price per megawatt-hour in the eastern states reaches $600. The Australian government is trying to find a solution to the worsening energy crisis in the country, but so far the crisis is only getting worse. In particular, the Australian Energy Regulator recently decided to raise marginal prices, which are, in fact, the maximum amount that retailers can charge households and businesses "by default." At the same time, the accompanying statement of the Australian regulator states that higher electricity and gas prices mean that in the near future inflation "is likely to be higher than expected a month ago." Based on this, it can be concluded that the regulator will resort to a more aggressive rate of interest rate hikes. Thus, the situation for the AUD/USD pair looks ambiguous. On the one hand, Aussie succumbed to pressure from the greenback, which today strengthened its position throughout the market. On the other hand, the downward dynamics is intermittent and uncertain: after an impulse decline, the price actually froze in one place, trading in a narrow price range. The bears were unable to build on their initial success, and this is quite a wake-up call for the sellers of the pair. Therefore, in my opinion, longs are still a priority, but it is necessary to monitor the dynamics of the US dollar index. As soon as it slows down its growth (or turns downside once again), buyers of AUD/USD are likely to seize the initiative for the pair. Therefore, you can open long positions either from the current levels (this is a riskier option) or after the US currency "runs out of steam" and will not be able to develop an offensive throughout the market. The nearest upward target is 0.7280 (the lower limit of the Kumo cloud on the daily chart coincides with the upper line of the Bollinger Bands indicator). If we talk about a longer-term period, then the target of 0.7350 is the upper limit of the Kumo cloud on the same timeframe. The material has been provided by InstaForex Company - www.instaforex.com |
| Asian stocks show mixed trading Posted: 07 Jun 2022 04:39 AM PDT
Key Asia-Pacific stock indices show mixed trading. Some indices are gaining up to 1%, while others are declining. China's Shanghai Composite and the Shenzhen Composite index added 0.48% and 0.1% respectively. Japan's Nikkei 225 also went down 0.42%. Other stocks declined: Hong Kong's Hang Seng Index fell by 0.14% and Korean KOSPI dropped by 1.33%. Australia's S&P/ASX 200 showed major losses, it shrank by 1.69%. Ambiguous investor sentiment is caused by a number of various factors. Thus, the easing of some COVID lockdown restrictions in China engendered optimism among traders. This fact indicates a rapid economic recovery in the country. It has already reported about the increase of business activity in different sectors. However, it is clear that Asian stock markets currently remain unstable. Shares of Alibaba Group Holding, Ltd are major gainers among the largest Chinese companies. They added 1.7%. Stocks of other companies declined: Sunny Optical Technology Group Co., Ltd. fell by 6.4%, Nongfu Spring Co.lost 3.76%, Netease Inc. dropped by 3.2% and BYD Co., Ltd. went down 2.5%. At the same time, investors are concerned about a rapid interest rate hike of 0.5% in Australia. The regulator raised the interest rate from 0.35% to 0.85%. It is the second increase in the last 2 months. Moreover, the interest rate was kept at the minimum level of 0.1% for more than 10 years. However, experts predicted that the rate would rise to 0.6%. It is also reported that the Australian Central Bank plans to continue increasing rates to combat soaring inflation. The stock value of the country's largest companies has declined slightly: shares of BHP lost only 0.04% and Rio Tinto stock fell by 0.6%. According to April statistical data, Japan saw a 1% increase in consumer spending. Analysts expected an increase to 1.3%,as in March it totaled 4.1%. Shares of Mazda Motor Corp., Mitsubishi Motors Corp. as well as Subaru Corp. are major gainers among components of the Nikkei 225 index. They added 4.3%, 3.7% and 3.5% respectively. SoftBank Group and Sony shares grew slightly. They advanced by 1% and 0.3% respectively, whereas Fast Retailing stocks dropped by 0.6%. Moreover, shares of major South Korean companies declined: Hyundai Motor lost 1.9% and Samsung Electronics Co. fell by 1,8%. The material has been provided by InstaForex Company - www.instaforex.com |
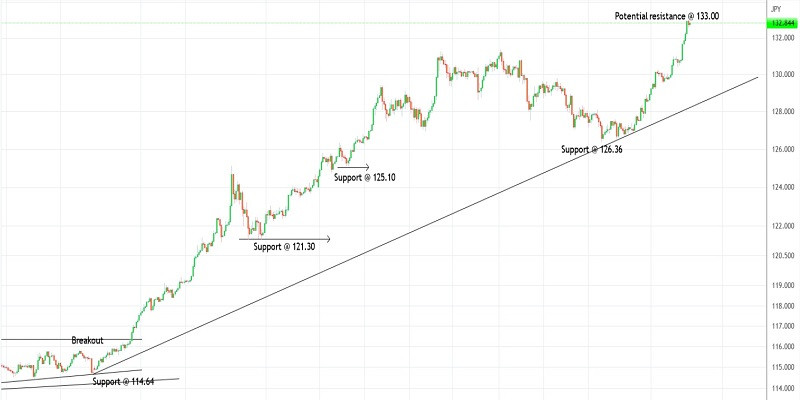
| Trading plan for USD/JPY for June 07, 2022 Posted: 07 Jun 2022 04:20 AM PDT
Technical outlook:USD/JPY broke through the 133.00 mark on Tuesday, reaching the level of around 132.00. The pair halted its upward movement, trading close to the 131.80 level at this point in writing. The bulls seem to be in control at the moment. They are facing potential resistance around 133.00. At the moment, it is better to wait for further price movement. USD/JPY is seen to find support around 126.36. Bears need to break below that mark to confirm a meaningful top is in place. The pair resumed a rally after breaking 116.00 earlier. It is presented by the above trend line. A break below the trend line support will provide selling opportunities. The recent upswing between 126.36 and 133.00 is accompanied by a strong bearish divergence on the daily and weekly charts (not presented today). It could be an indication of a potential trend reversal ahead. However, traders might want to see a break below 126.36. Trading plan:Preparing for a bearish reversal. Flat for now. Good luck! The material has been provided by InstaForex Company - www.instaforex.com |
| Video market update for June 07, 2022 Posted: 07 Jun 2022 04:04 AM PDT Watch for bullish patterns on USD/JPY... The material has been provided by InstaForex Company - www.instaforex.com |
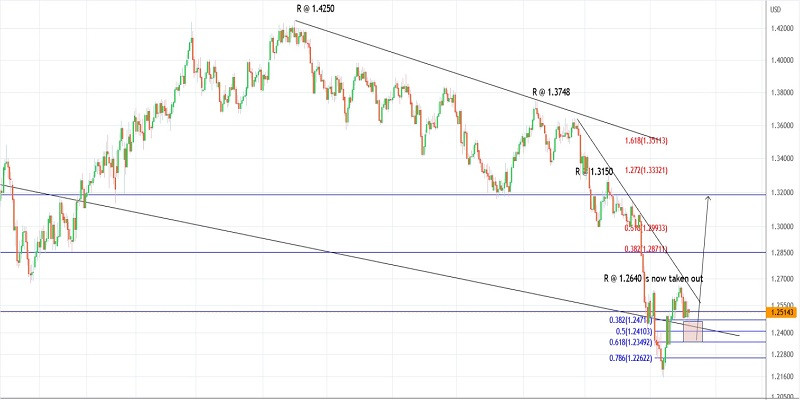
| Trading plan for GBP/USD for June 07, 2022 Posted: 07 Jun 2022 03:58 AM PDT
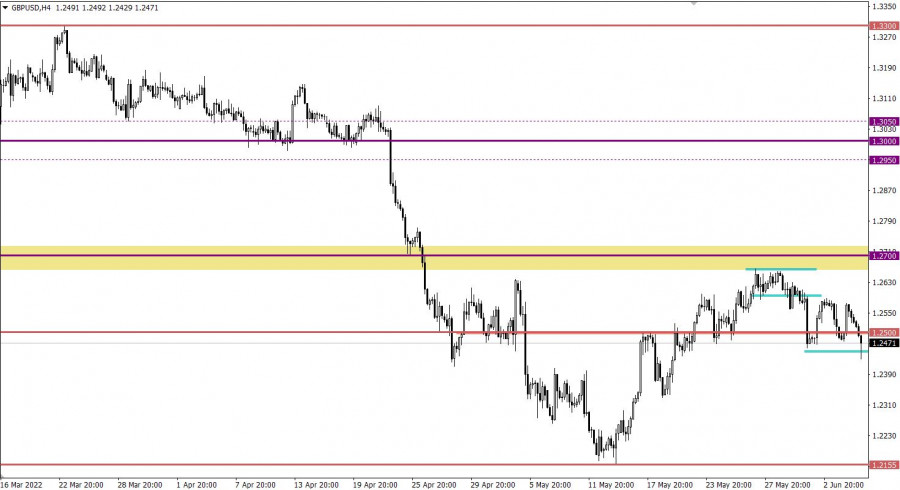
Technical outlook:GBP/USD dropped through 1.2430 during the European session on Tuesday before finding support. The pair bounced back sharply, trading close to 1.2520 at this point in writing. Bulls might have carved a higher low just above the 1.2350 mark and are now poised to remain in control. GBP/USD had earlier rallied between the 1.2150 and 1.2665 levels carving a lower degree upswing. The subsequent drop through 1.2430 seems to have completed its minimum requirement to complete the pattern. Having said that probability still remains for a continued decline to 1.2350 before the rally resumes. The downside remains limited from here though. GBP/USD has also tested its backside of resistance trendline around the 1.2430 level, which is strong support now. Overall, the structure remains constructive for bulls as they prepare to push through 1.3000 either from here or after dropping through 1.2350. Bottom line is that prices should stay above 1.2100 to keep the structure costrctive for bulls. Trading plan:Potential rally through 1.3000 against 1.2100 Good luck! The material has been provided by InstaForex Company - www.instaforex.com |
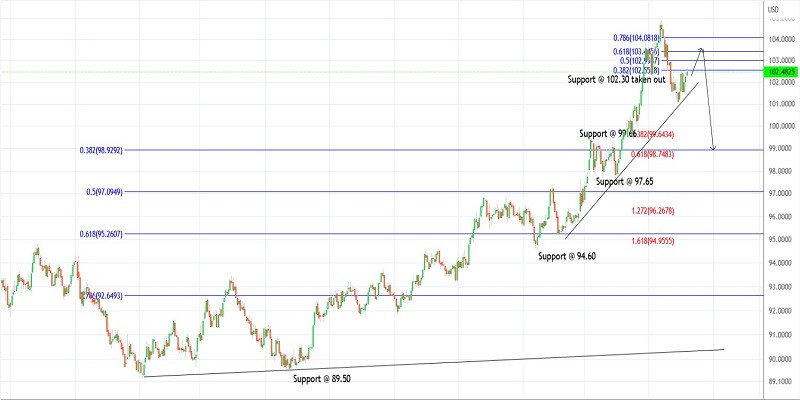
| Trading plan for US dollar index for June 07, 2022 Posted: 07 Jun 2022 03:43 AM PDT
Technical outlook:The US dollar index jumped above the 102.70 mark intraday on Tuesday after finding support around 101.50 over the last week. The Down Gartley corrective structure is unfolding into its last leg projected to terminate around 103.50. Bulls remain poised to hold prices above 101.08 to keep the structure constructive. The US dollar index carved a lower degree downswing between the 104.88 and 101.08 levels as seen on the daily chart. Prices are retracing the recent losses and are expected to reach 103.50, which is the Fibonacci 0.618 level. High probability remains for bears to come back in control thereafter and drag through the 99.00 mark at least. The US dollar index is structurally carving a larger degree corrective drop towards 99.00 and up to 95.00. If the prediction is correct, prices might extend through 103.50, remaining below 104.88. Traders might be prepared for a short-term rally through 103.40-50 before turning short again. Trading plan:Potential short-term rally through 103.50, then bearish turn through 99.00 and beyond 105.00. Good luck! The material has been provided by InstaForex Company - www.instaforex.com |
| Posted: 07 Jun 2022 03:39 AM PDT
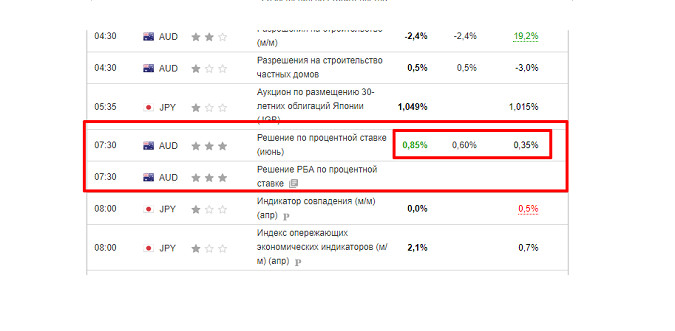
The Reserve Bank of Australia raised interest rates by 50 bp at once, surprising traders and analysts who only expected a 30-bp increase.
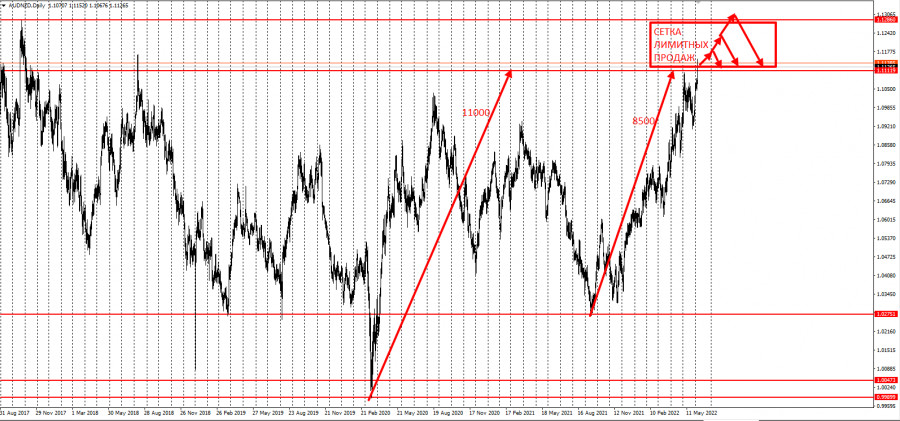
The event has caused the Aussie to rise against all currencies, including in the AUD/NZD pair, which once again hit a new yearly high. And considering that the pair already moved by 8,500 pips since 2021, traders can start a grid of sell limits in order to gain profit.
So, starting from the current prices, set up a grid of sell limits in an increment of 300-500 pips. Take profit on a breakout, either at 1 pip above the first order or after a 1,000 pip movement. This strategy is called grid trading, which is usually used on cross rates. It involves holding positions that are significant in time and distance. For this reason, we recommend using swap-free accounts, not increasing the volumes in the grid (0.01 standard lot for every $ 1,000 of the deposit) and monitor price movements. Good luck and have a nice day! The material has been provided by InstaForex Company - www.instaforex.com |
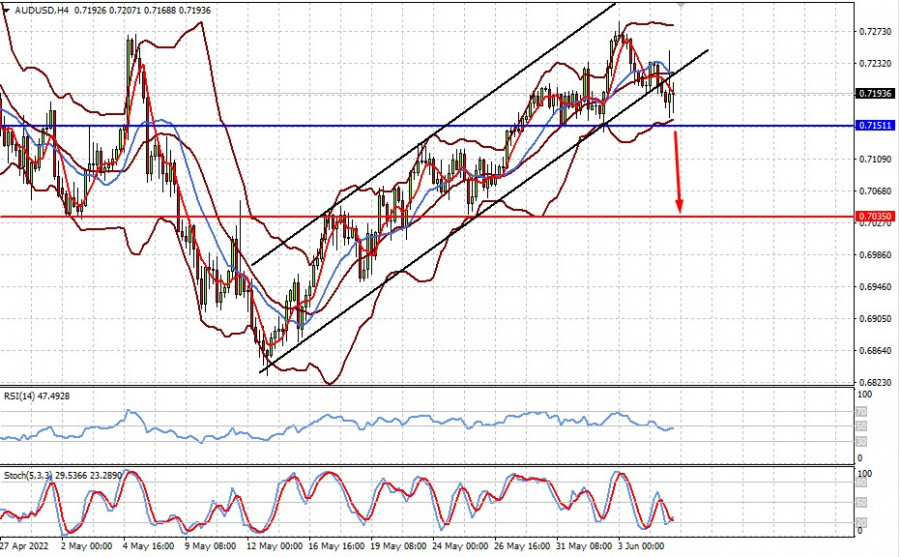
| Australian dollar trades downward despite RBA decision to raise rates Posted: 07 Jun 2022 03:32 AM PDT Following the results of the recent RBA meeting, Australia's key interest rate is now at 0.85%, up 0.50% from the previous level of 0.35%. The main reason is the rather difficult situation in the country, driven by high inflation, disruption of supply chains and increased geopolitical tensions in the world. But why did the central bank raise the rate by 0.50%, and not significantly higher? The answer is that the RBA does not want to injure its economy with high interest rates because that, partnered with high inflation, can lead to stagflation. If so, why did the Australian dollar react so negatively? Setting aside the fact that the rate hike is just slightly higher than the forecasted value of 0.60%, risk appetite is still low, so demand for assets like AUD are still short. If market sentiment improves, then the Aussie will rise again. Going back to the RBA, there is a chance that it will increase rates again, along with other world central banks, in an attempt to curb inflation. Forecasts for today: AUD/USD
The pair is trading above 0.7150, thanks to high volatility and the results of the RBA meeting. If negative sentiment persists and the pair breaks the above-mentioned level, the quote will dip towards 0.7035. GBP/USD
The pair made an attempt to break out of 1.2470-1.2580. If the data on business activity in the UK services sector is below forecast, the quote will continue falling to 1.2330. The material has been provided by InstaForex Company - www.instaforex.com |
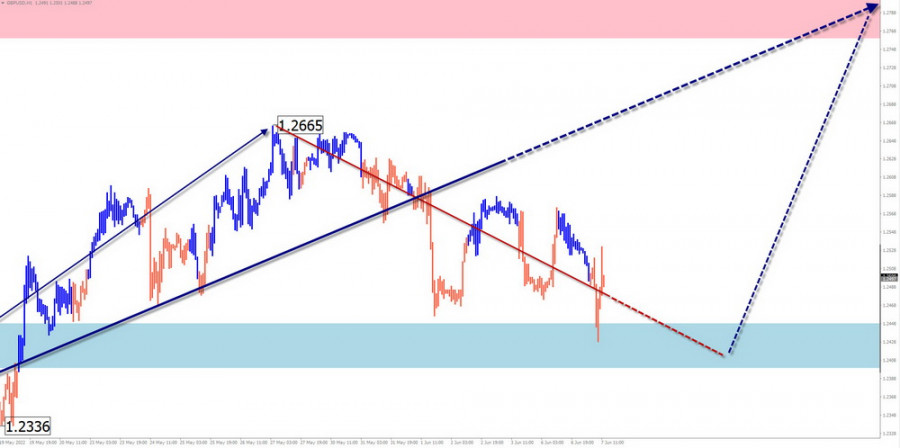
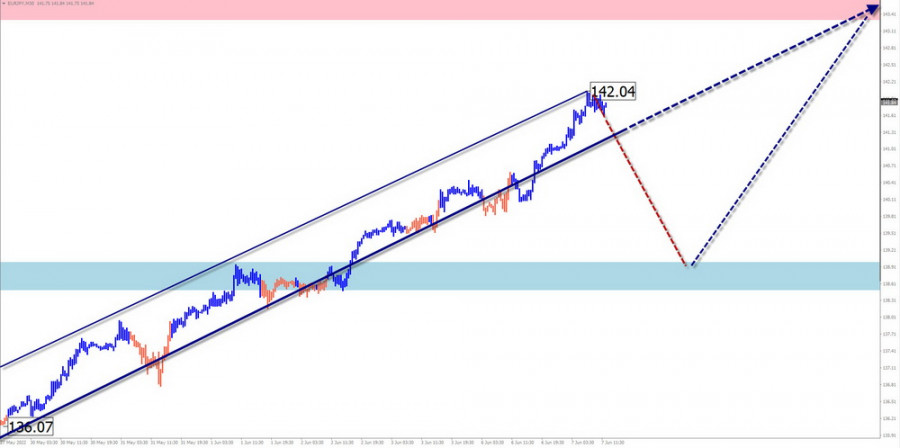
| Posted: 07 Jun 2022 03:31 AM PDT GBP/USD Analysis:Quotes of the major of the British pound have been moving according to the upward trend algorithm for the past two years. Since the beginning of last year, the price has been forming a downward wave (B). Its structure is currently close to completion. The price has reached the upper limit of a powerful potential reversal zone. Since May 5, an upward correction has been developing within the last section, which has not yet been completed. Forecast: Over the coming week, the price of the pound expects a smooth movement from the support border to the area of the resistance zone. By the end of the week, there is a high probability of a reversal and a return of the price to the trend rate.
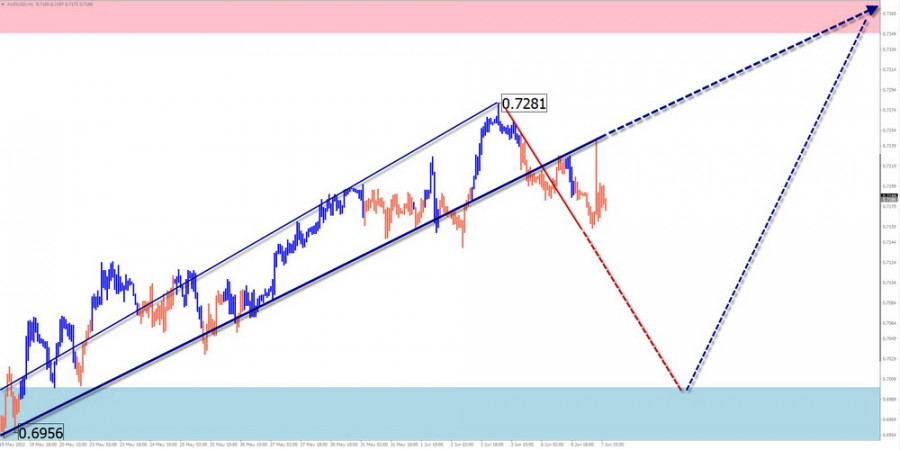
Potential reversal zones Resistance: - 1.2760/1.2810 Support: - 1.2450/1.2400 Recommendations: There will be no conditions for the sale of the British pound in the coming days on the pair's market. It is recommended to focus on finding signals for short-term purchases of the instrument. It is worth considering the limited potential of the upcoming recovery. After the appearance of reversal signals in the area of the resistance zone, sales will become relevant again. AUD/USD Analysis: The main rate of movement of the major Australian dollar since February last year is set by a downward wave. By now, the wave structure looks complete. Since May 12, an upward movement has been rolling back from the upper limit of the powerful support of a large TF. Its wave level has a reversal potential and may be the beginning of a larger wave. Forecast: During the current week, the price is expected to move mainly in the lateral plane between the nearest zones in the opposite direction. After contact with the resistance zone, a short-term decrease is likely. By the end of the week, we can expect a resumption of price growth and a second rise to resistance levels. At the same time, there is a great chance of breaking its upper limit.
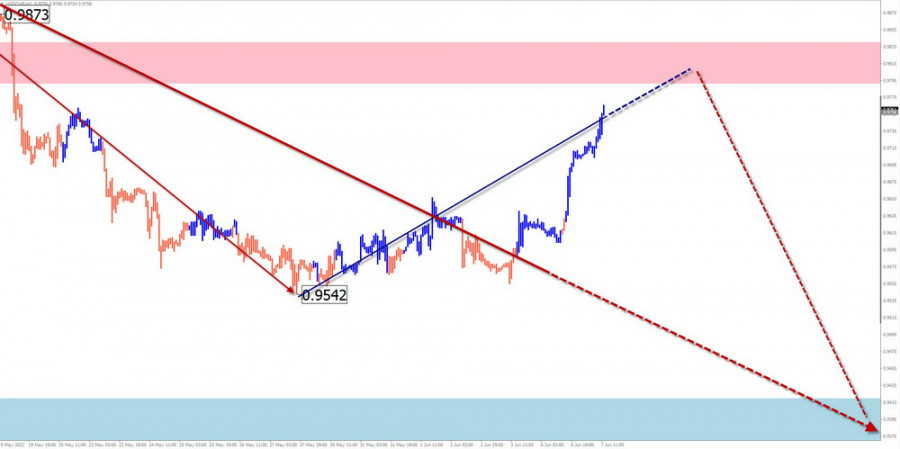
Potential reversal zones Resistance: - 0.7350/0.7400 Support: - 0.7000/0.6950 Recommendations: In the coming days, sales on the Australian dollar market may bring profit only in short-term transactions within individual sessions. It is optimal to refrain from entering the pair's market until the end of the upcoming decline, with the purchase of the instrument in the area of the support zone. USD/CHF Analysis: The trend direction of the main Swiss franc pair since January last year is set by the ascending wave algorithm. From the powerful resistance zone on May 16, the price began to move down, forming a corrective zigzag. In the structure of this movement, a sideways pullback (B) has been observed throughout the last decade. Forecast: In the coming days, the Swiss franc quotes should finish their growth within the boundaries of the support zone. Then, with a high probability, a reversal and a resumption of the price decline will follow. The weekly range of the price move down is limited by the calculated support.
Potential reversal zones Resistance: - 0.9790/0.9840 Support: - 0.9420/0.9370 Recommendations: In the coming week, trading a pair can bring profit only within the framework of individual trading sessions with a fractional lot. Before the appearance of reversal signals in the area of the support zone, purchases are not recommended. EUR/JPY Analysis: The direction of movement of the euro/yen cross pair in the last two years is set by the bullish wave algorithm. At the beginning of March, the final section (C) started. Quotes reached the upper limits of the powerful potential reversal zone of the senior TF. The wave structure does not look complete. There are no reversal signals on the chart. Forecast: In the next week, the pair's growth rate is expected to stop and the movement will move mainly to the horizontal plane. A short-term decline in the support zone is not excluded. At the end of the week, we can expect an increase in volatility and a resumption of bullish sentiment.
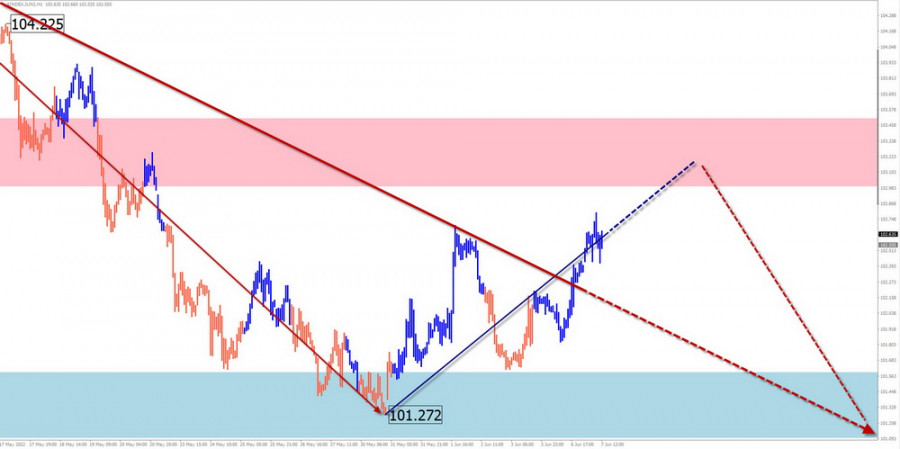
Potential reversal zones Resistance: - 143.30/143.80 Support: - 139.00/138.50 Recommendations: Trading in the coming days on the pair's market can be risky. For the time of the upcoming rollback, it is optimal to refrain from trading transactions, with tracking reversal signals for buying at its end. US Dollar Index Analysis: The upward momentum that started in January last year brought the dollar index quotes to the area of strong resistance. Since the middle of last month, the index value has been moving down, forming a corrective zigzag. In the last two weeks, the quotes in the sideways flat form the middle part of the wave (B). Forecast: In the coming days, it is worth waiting for the completion of the upward vector of the index movement. In the second half of the week, the probability of a reversal and a resumption of the downward course increases. The support zone shows the most likely level of the weekly movement of the instrument.
Potential reversal zones Resistance: - 103.00/103.50 Support: - 101.60/101.10 Recommendations: The period of weakening of national currencies in the main pairs is nearing the end. Deals for sale should be closed in the next couple of days. Supporters of trading for a raise will soon get a good chance to earn. Explanations: In the simplified wave analysis (UVA), all waves consist of 3 parts (A-B-C). On each TF, only the last, incomplete wave is analyzed. The solid background of the arrows shows the formed structure, and the dotted one shows the expected movements. Attention: The wave algorithm does not take into account the duration of the movements of the instruments in time! The material has been provided by InstaForex Company - www.instaforex.com |
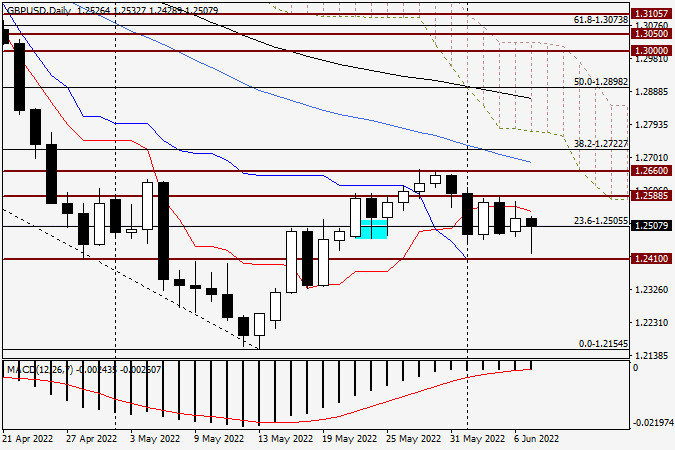
| Analysis and forecast for GBP/USD on June 7, 2022 Posted: 07 Jun 2022 03:31 AM PDT But the British pound sterling, unlike the single European currency, showed a strengthening against the US dollar at yesterday's auction. However, it should be noted that yesterday's growth of the "Briton" was very modest and far from ambiguous. More details about this in the technical part of this article, but for now briefly about the external background and upcoming macroeconomic events that can affect the price dynamics of GBP/USD. As for the external background, it is relatively calm. There is no particularly important news and those that were and continue to have long been taken into account in the price. Regarding macroeconomic statistics, I would like to note that yesterday's calendar almost did not contain any releases. Today, data on the PMI index in the services sector came out of the UK, which turned out to be better than the forecast value of 51.8 and amounted to 53.4. Let me remind you that the value of this indicator above 50.0 has a positive effect on the national currency rate. From the United States of America, today I advise you to pay attention to the data on the trade balance, which will be presented to the court of traders at 13:30 London time. That's probably all, and now let's look at the charts of the pound/dollar currency pair. Daily
As already noted at the very beginning of this article, yesterday's growth of the British pound sterling is certainly not confident, much less strong. The bulls on the pound intended to test Friday's highs at 1.2588, but they could not do it. The pair reached 1.2576 on the rise, after which it lost a significant part of the growth and ended Monday's trading at 1.2526. The long upper shadow of yesterday's candle, which exceeds the size of the bullish body, clearly indicates the resistance strength of sellers in the area of 1.2576-1.2588. I believe that the red line of the Tenkan Ichimoku indicator played an important role in the quality of resistance. The graph clearly shows that the attempts of the players to upgrade the course to go up this line failed. Despite the stronger-than-expected data on the PMI index in the UK services sector, the pound initially sank slightly, but after gaining support at 1.2429, it began to actively reduce the losses incurred. Now, at the time of the completion of this article, today's daily candle already has a significantly lower shadow. It seems that the "Briton" has recovered and is aiming for the opening price of today's trading at 1.2526. If this goal is achieved, then the bullish body of today's daily candle may begin to form after that. The bulls' targets for the pound are the price zone 1.2576-1.2588, and if it passes, the pair will rush to 1.2600. But fixing above this mark will open the way to the key resistance of 1.2660 at this stage of trading, on which the further prospects for the price movement of the GBP/USD currency pair will depend. According to trading recommendations, I consider purchases after fixing above 1.2540 to be the most relevant. If bearish candlestick analysis patterns start to appear below this level or slightly lower at smaller time intervals, this will be a signal to open sales. That's all for now. The material has been provided by InstaForex Company - www.instaforex.com |
| Trading plan for EUR/USD for June 07, 2022 Posted: 07 Jun 2022 03:22 AM PDT
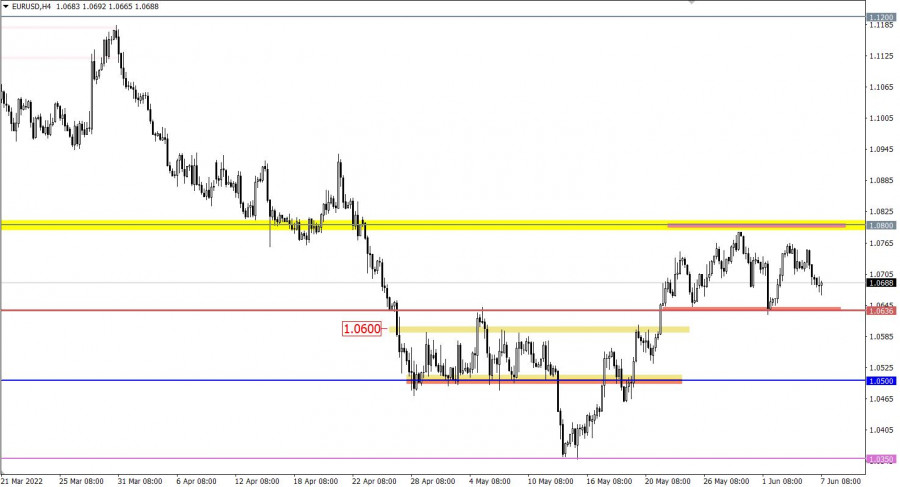
Technical outlook:EUR/USD has been sliding gradually to its interim support around the 1.0630 low registered last week. The pair dropped through the 1.0650-60 zone during the Europe Session. It bounced to 1.0690 a bit earlier. Bears are still inclined to hold prices below 1.0786 and drag them to 1.0520 before resuming higher. EUR/USD has carved a recent upswing between 1.0350 and 1.0786 which is being corrected. If it drops below 1.0630/ it is likely to decline to 1.0520, which is the Fibonacci 0.618 retracement level of the above rally. Bulls have an edge since they broke above the initial resistance around 1.0630-40 mark earlier. Bottom line remains 1.0350 interim support though. EUR/USD seems to be unfolding a larger degree corrective rally from the 1.0350 low. The first leg terminated around the 1.0786 mark, while the second leg is unfolding towards 1.0520 levels. If the above structure unfolds accordingly, bulls will be poised to push through 1.11 and up to 1.15. Trading plan:Potential rally through 1.11 against 1.0300 Good luck! The material has been provided by InstaForex Company - www.instaforex.com |
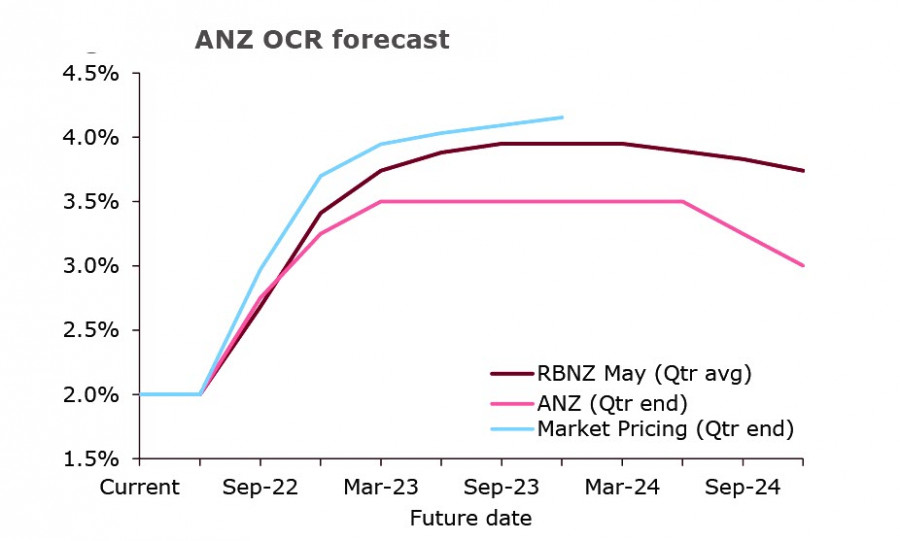
| Posted: 07 Jun 2022 03:11 AM PDT Global yields rose on Monday amid generally calm news background. The 10-year UST is back above 3%, while the German bonds are at a multi-year high of 1.32. New Zealand bonds also approached 4%. Unsurprisingly, stocks traded in green territory as well, partly supported by China who not only lifted some of its covid restrictions, but also signals that the authorities will support the economy and weaken some regulatory functions. In terms of the forex market, pound traded upwards yesterday as the expected vote of no confidence in Johnson did not take place. However, it rolled back down before the end of the day. This week, the most important event is the US consumer inflation report on Friday, which is forecasted by analysts to show a decrease from 8.3% to 8.2%. If real data turns out that way, volatility will remain low. If not, then there will be a sharp movement in the markets. There are no significant drivers today, so trading will mainly be in the formed ranges. NZD/USD Inflation in New Zealand already rose to 6.9%, but it seems that it will only go up even more. Forecasts suggest that it will break 7% in Q2, driven by rising energy prices and pressure from the labor market. Reducing the pressure on the housing market may help, but there is a risk as the central bank may raise interest rates more aggressively. Many predict a peak of 4.25% by the end of 2023, but the RBNZ itself is more cautious and does not exceed its forecast to 4%. So far, the most conservative bank is ANZ, which believes that the rate will not be raised above 3.5%.
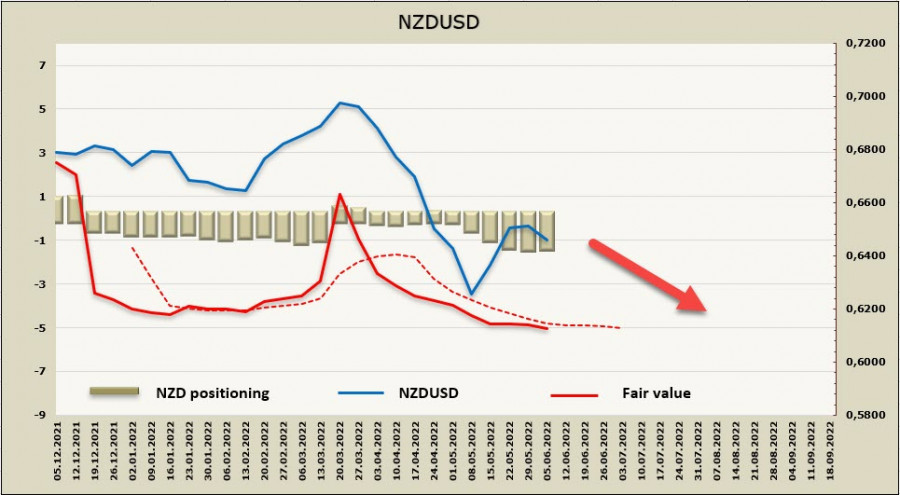
If ANZ is right, then the kiwi will lose to the dollar as it has higher forecasts. This means that the NZD/USD pair will be under long-term pressure. A weekly change of +30m does not have a significant impact on NZD positioning as usual, as the accumulated bearish edge is -1.22bn. Also, the settlement price is held below the long-term average, which signals a further decline in NZD/USD.
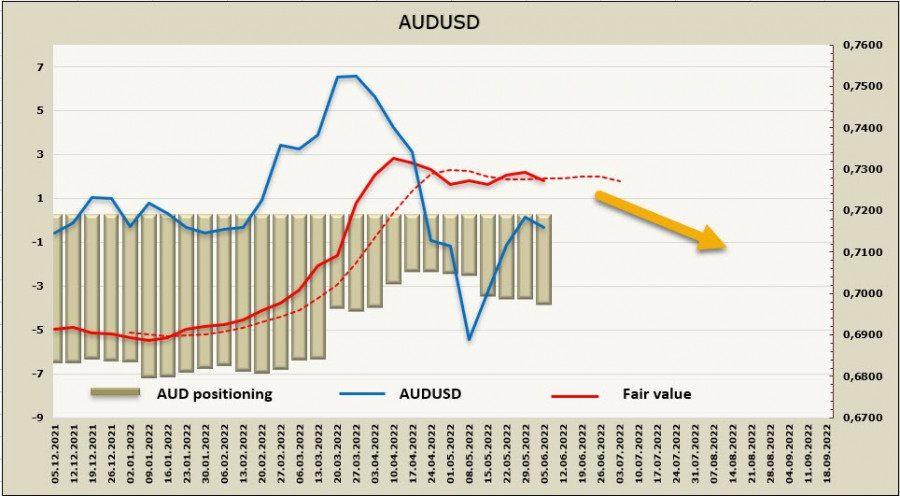
The trend continues to be bearish even though trading has been in a sideways range over the past week. In fact, there may be an attempt to test the support level of 0.6210. AUD/USD The RBA raised the interest rate by 0.25% to 0.60%, prompting a decrease in AUD. The reason is that the central bank did not give any hint about it prior to the meeting, making market players unprepared. Also, although the central bank considered a 0.40% increase last month, it decided to limit itself to a quarter percent. Their reason back then was that they meet every month, much more than other banks, so they have more opportunity to respond more quickly to changing conditions. This is why many were caught off guard with their decision to raise rates. Inflation in Australia is high, but is lower than in the US or Europe.
But even though AUD hit a new local high, its trend is still bearish. As such, it is likely to move down to 0.7130/42 and 0.7030/40, though the rising oil prices and growing demand in China could turn it up. The material has been provided by InstaForex Company - www.instaforex.com |
| EUR/USD: analysis and forecast for June 7, 2022 Posted: 07 Jun 2022 02:50 AM PDT Hello, dear traders! Yesterday was a calm trading day in the market, which is common for Mondays. No fundamentals had no effect on the market either. There were no drivers for a strong price movement or they have already been priced in by market participants. The macroeconomic calendar was also completely empty. Likewise, no macro events are expected today. At the same time, two reports may somewhat affect the EUR/USD pair today. The first one has already come out. These are Germany's factory orders data, which declined by 2.7%, missing forecasts of a 0.3% rise. Taking into account such disappointing results from Europe's locomotive, we can hardly expect better figures from other eurozone countries. No wonder, the ECB has adopted a mixed stance on inflation. The regulator's main tool against persistent inflation is rate hikes. However, raising rates whenever the economy is weak means driving it into a recession. Still, although factory orders are significant data, it does not mean these are the most important figures. US trade balance will be another important report to pay attention to today. Daily
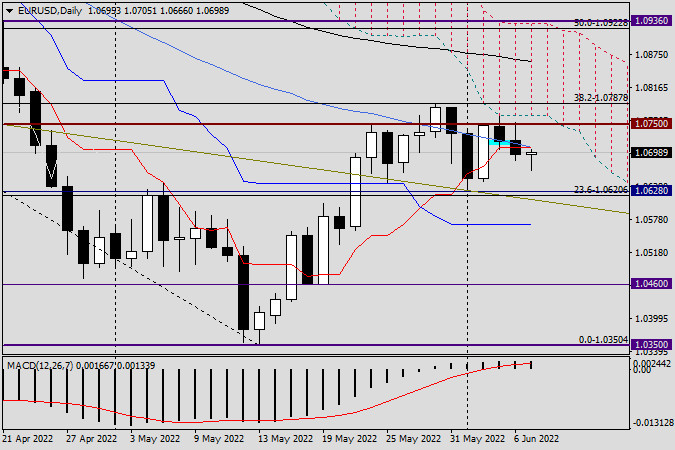
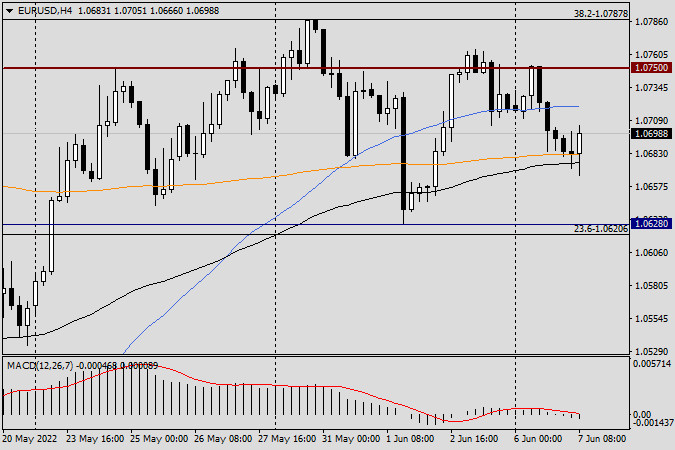
Yesterday, the price rose to 1.0750, encountered strong resistance, and reversed downward. The day closed below the MA 50 and the red Tenkan line of the Ichimoku indicator. However, only one daily candlestick has closed below the Tenkan line so far, which means that it is too early to talk about a true breakout of the MA 50 and the Tenkan line. The quote keeps hovering around the important technical level of 1.0700, closing either above or below the mark. The pair has been like that for quite a long time. As for targets on the daily chart, in the case of growth, they stand at yesterday's high of 1.0750 and 1.0766, in line with the lower limit of the Ichimoku cloud. The nearest target for bears is seen at the support of 1.0628 (the low of June 1st). H4
On the 4-hour chart of EUR/USD, the black EMA 89 and orange EMA 200 keep the price from falling further. At this point, it is still unclear for how long they will be able to do this. However, risky buying could be considered at current prices. In such a case, the target is seen at 1.0720, in line with EMA 50, where the price may encounter strong resistance. Short positions could be opened there if a bearish candlestick pattern is formed. In general, the pair's movement seems to be an attempt to consolidate before a trend emerges. The ECB's interest rate decision and President Lagarde's press conference on Thursday may become the driving force for the euro. Have a nice trading day! The material has been provided by InstaForex Company - www.instaforex.com |
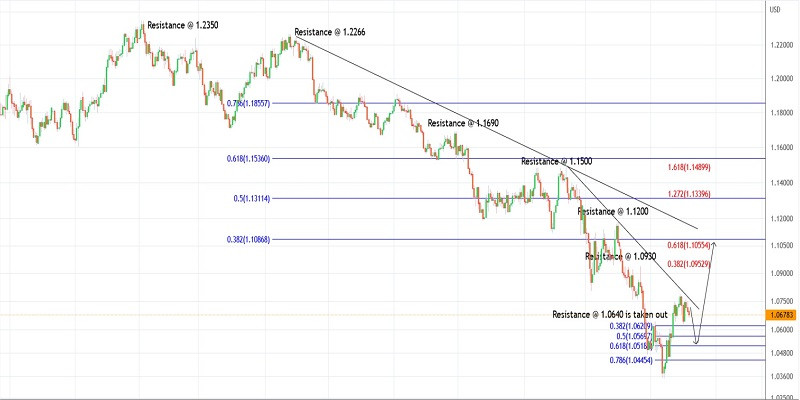
| Forex forecast 06/07/2022 AUD/USD, USD/JPY, USD/CAD, GBP/USD and Bitcoin from Sebastian Seliga Posted: 07 Jun 2022 02:35 AM PDT Let's take a look at the technical picture of AUD/USD, USD/JPY, USD/CAD, GBP/USD and Bitcoin The material has been provided by InstaForex Company - www.instaforex.com |
| Tips for beginner traders in EUR/USD and GBP/USD on June 7, 2022 Posted: 07 Jun 2022 02:30 AM PDT Details of the economic calendar from June 6 Monday was traditionally accompanied by an empty macroeconomic calendar. Important statistics in Europe, the UK, and the United States were not released. Analysis of trading charts from June 6 The EURUSD currency pair has been moving within a wide range of 1.0636/1.0800 for the second week in a row. This movement indicates a slowdown in the corrective move from the pivot point of 1.0350. Since the beginning of June, the GBPUSD currency pair has been stubbornly trying to change the trading interest from an upward cycle to a downward one. This is indicated by the consistent touch of the support area 1.2450/1.2500.
Economic calendar for June 7 Tuesday is not much different from Monday in terms of the macroeconomic calendar. Important statistics in Europe, the UK, and the United States are not expected. For this reason, we follow the information flow, as well as technical analysis. Trading plan for EUR/USD on June 7 The movement within the amplitude of 1.0636/1.0800 is still relevant in the market. As the main trading strategy, traders consider the breakdown of one or another flat boundary. This step will indicate the subsequent path of the quote according to one of the possible scenarios: the restoration of the downward trend or the prolongation of the current correction.
Trading plan for GBP/USD on June 7 It can be assumed that the long absence of updating the local high indicates the completion of the corrective move. The main signal to sell the pound sterling will come from the market only after the price keeps stable below 1.2450 for at least a four-hour period. In this case, we will see a gradual recovery of dollar positions relative to the recent correction.
What is reflected in the trading charts? A candlestick chart view is graphical rectangles of white and black light, with sticks on top and bottom. When analyzing each candle in detail, you will see its characteristics of a relative period: the opening price, closing price, and maximum and minimum prices. Horizontal levels are price coordinates, relative to which a stop or a price reversal may occur. These levels are called support and resistance in the market. Circles and rectangles are highlighted examples where the price of the story unfolded. This color selection indicates horizontal lines that may put pressure on the quote in the future. The up/down arrows are the reference points of the possible price direction in the future. The material has been provided by InstaForex Company - www.instaforex.com |
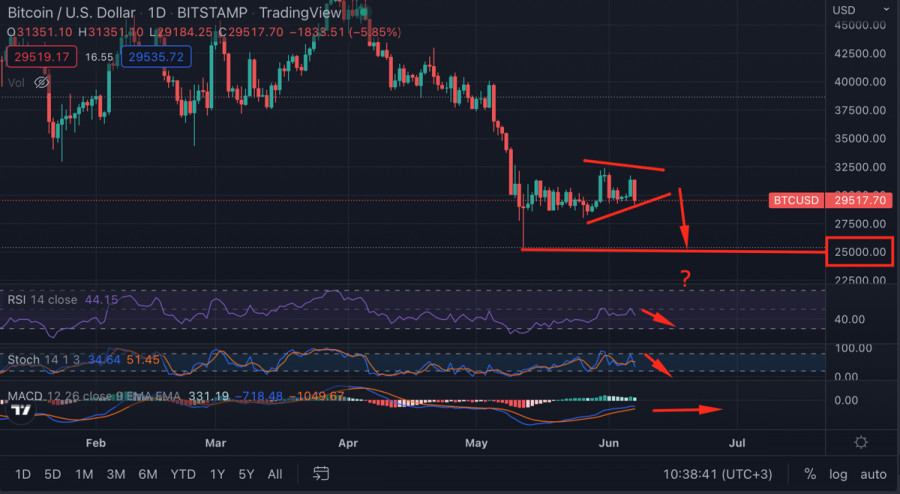
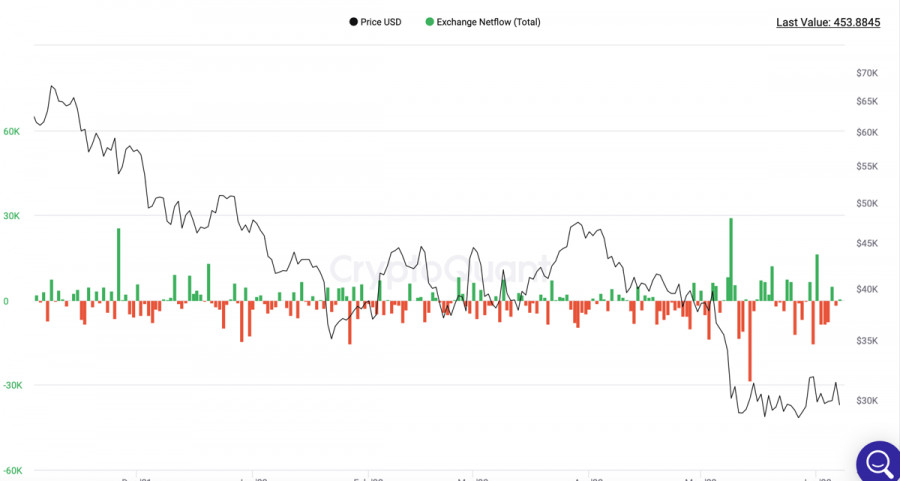
| Bitcoin loses bullish potential and starts to decline Posted: 07 Jun 2022 02:15 AM PDT Bitcoin continues to trade within a narrow range of $29k–$31.5k. The coin solidly consolidated and tried to break out of the area, but eventually made a false breakout of the $32.2k level. Subsequently, the asset tried to consolidate in the upper part of the range, but began to decline. And as of June 7, the sellers are in full control of the situation.
The cryptocurrency was traded near the upper border of the channel, but eventually fell like a stone to its lower part. As a result, the price is trading in the area of $28.6k, and on the daily chart, a "bearish engulfing" pattern has formed. It is also extremely important to understand that bears are expanding the usual price movement area. This could mean a further decline, as well as the presence of volumes of liquidity that need to be squeezed out of the bulls.
Technical indicators of the cryptocurrency have made a steep peak and are moving towards the lower boundary of the bullish zone. This indicates the formation of large sales volumes, as well as a sluggish reaction of buyers. Nevertheless, the MACD indicator has resisted and is consolidating sideways. However, clouds are gathering around Bitcoin bulls again, and bears completely seize the initiative. With this in mind, a reasonable question arises: will the previous weeks of consolidation be leveled, and the asset continue to fall? Let's start with the fundamentals, which are entirely based on Fed policy. Investors are concerned about the pace of monetary tightening, which could lead to a significant slowdown in economic growth. As a result, we saw a preventive reduction in liquidity from market players in order to preserve it and subsequently redistribute it profitably. This can also be regarded as a definite signal for the Fed about the need to pause in such strict regulation of monetary policy. Fed members have also repeatedly stated the need to return to liberal monetary policy and let the markets breathe. Such a pause would be similar to the recent correction of the US dollar index, which turned out to be a breath of fresh air for the crypto market. But there is every reason to believe that the regulator does not plan to pause, and will continue to tighten monetary policy.
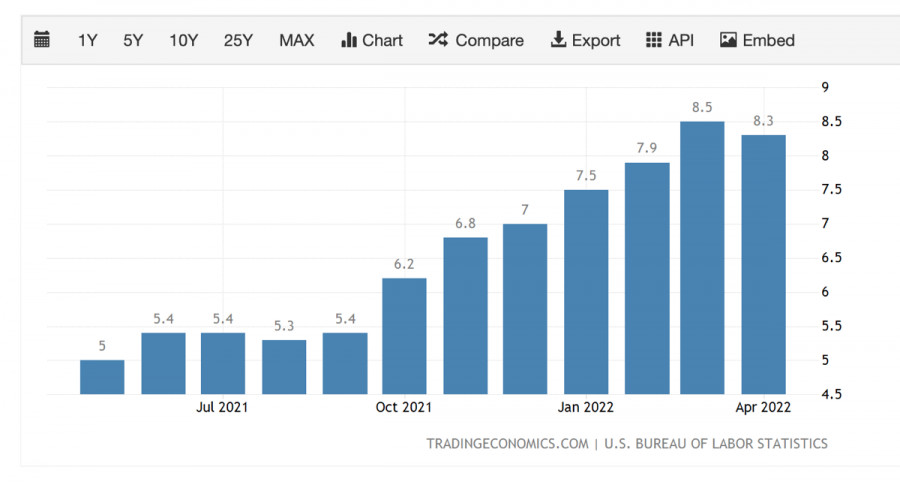
This is evidenced by the statistics on the labor market for May 2022. In May, more than 350,000 jobs were created in the United States. This result was significantly lower than similar indicators in April. At the same time, analysts are confident that inflation will stay in the region of 6%–7%, which leaves the Fed with no way out. At the June meeting, it is planned to increase the key rate by another 50 basis points.
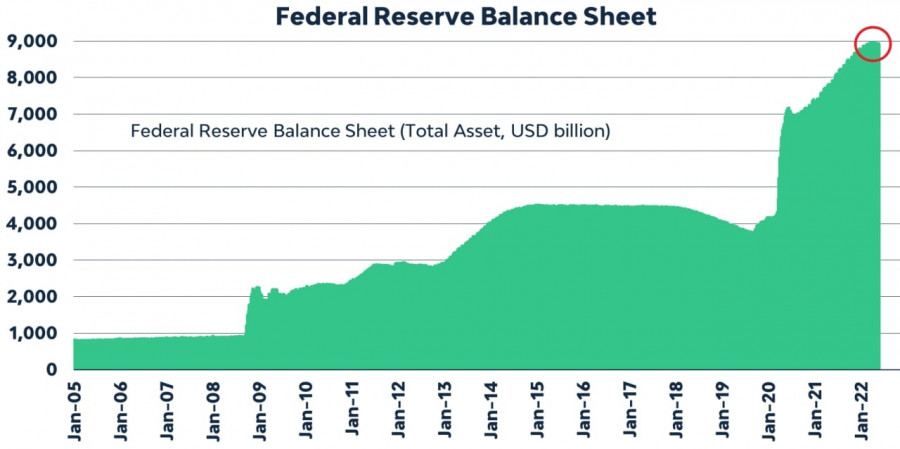
However, it is important to understand that another $45 billion will be withdrawn under the quantitative tightening (QT) program, a significant part of which was injected into the crypto market. If we combine the balance sheet contraction with the effect of the interest rate hike, it turns out that in June the key rate will be raised by 1 basis point. June could become an even more painful month for high-risk assets, even with the partial market adjustment after the May crash.
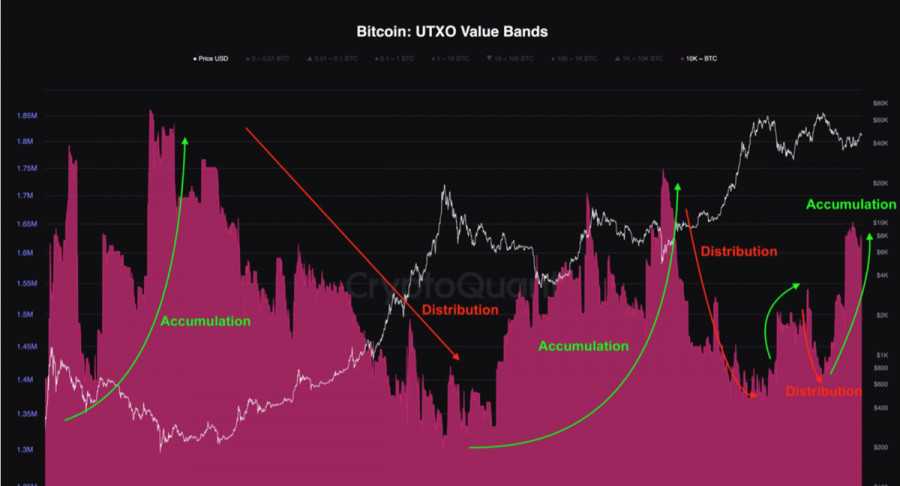
At the same time, back in May, there was a tendency for long-term investors to sell their stocks. In the short term and psychologically, this is a negative signal that contributes to the growth of bearish sentiment. But from a fundamental point of view, this means the gradual formation of a local bottom. A similar situation was observed in the market in 2014 and 2018. However, it took months for investors to fully form a long-term low. How the situation will develop in 2022 is impossible to predict.
But it is safe to say that the market has passed the worst stage of this bearish trend. In parallel with the capitulation of long-term investors, there is a massive process of accumulation that will be the catalyst for the next bull market. But only long-term hodlers can say for sure how long the period of capitulation + accumulation will take. It is likely that in order to speed up this process, we can expect a local retest of the bottom. Given these developments, Terra's collapse is not to be expected, but volatility surges and sell-offs are more than likely. The material has been provided by InstaForex Company - www.instaforex.com |


| You are subscribed to email updates from Forex analysis review. To stop receiving these emails, you may unsubscribe now. | Email delivery powered by Google |
| Google, 1600 Amphitheatre Parkway, Mountain View, CA 94043, United States | |


Comments