Forex analysis review
Forex analysis review |
- June 3, 2022 : EUR/USD daily technical review and trading opportunities.
- June 3, 2022 : EUR/USD Intraday technical analysis and trading plan.
- June 3, 2022 : GBP/USD Intraday technical analysis and significant key-levels.
- Technical analysis of GBP/USD for June 03, 2022
- Technical analysis of EUR/USD for June 03, 2022
- GBP/USD: bounce ends, new sell-off underway
- SPX to fall towards 4,000
- GBPUSD remains below key resistance trend line.
- EUR/USD's rally stopped by 1.0757, NFP better than expected
- Short-term technical analysis on Gold.
- Ethereum challenges major weekly support.
- Ichimoku cloud indicator analysis on EURUSD for June 3, 2022.
- Trading Signal for Nasdaq-100 (#NDX) on June 3-6, 2022: sell below 12,765 (200 EMA - overbought)
- Trading Signal for EUR/USD on June 3-6, 2022: buy in case of rebound at 1.0677 (200 EMA - 21 SMA)
- Analysis of GBP/USD on June 3. What to expect from Nonfarm Payrolls data
- Trading plan for Ethereum on June 03, 2022
- Most cryptocurrencies likely to fail soon, experts say
- Trading plan for Bitcoin on June 03, 2022
- AUD/USD Technical Analysis and Trading Tips on June 3, 2022
- GBP/USD: plan for the US session on June 3 (analysis of morning deals). The pound is clearly not ready for continued growth
- EUR/USD: analysis and forecast for June 3, 2022
- EUR/USD: trading plan for American session (analysis of morning trades). EUR flat ahead of Nonfarm Payrolls data
- Trading plan for Silver on June 03, 2022
- Bitcoin still afloat
- Trading plan for Gold on June 03, 2022
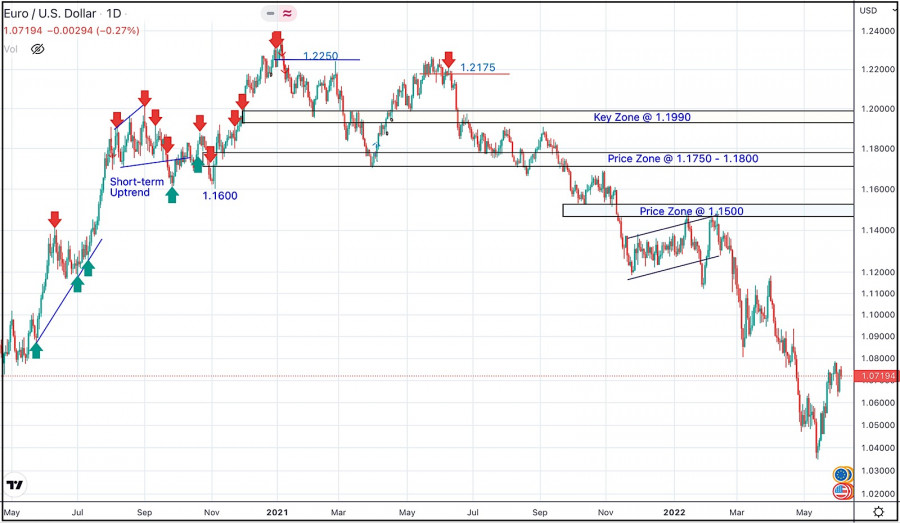
| June 3, 2022 : EUR/USD daily technical review and trading opportunities. Posted: 03 Jun 2022 03:01 PM PDT
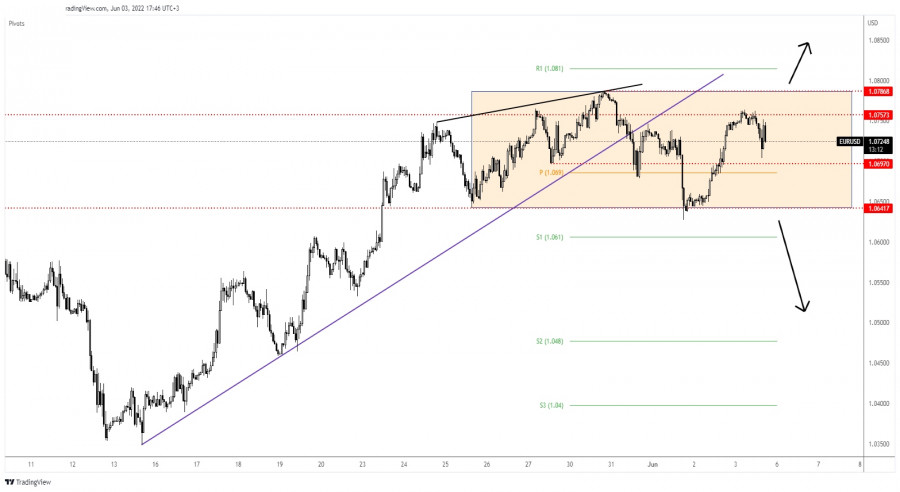
In late September, Re-closure below the price level of 1.1700 has initiated downside-movement towards 1.1500 where some recovery was witnessed. Shortly after, Price levels around 1.1700 managed to hold prices for a short period of time before another price decline took place towards 1.1200. Then the EURUSD has temporarily moved-up within the depicted movement channel until downside breakout occurred recently. Since then, the price zone around 1.1500 has applied significant SELLING pressure when a valid SELL Entry was offered upon the previous ascending movement towards it. Shortly after, the EURUSD looked oversold while approaching the price levels of 1.0800. That's where the recent upside movement was previously initiated. That's why, the recent movement towards 1.1200 was considered for another SELL Trade which is already running in profits now. The current ascending movement above 1.0600 enabled further advancement towards 1.0850 where bearish rejection can be applied. The material has been provided by InstaForex Company - www.instaforex.com |
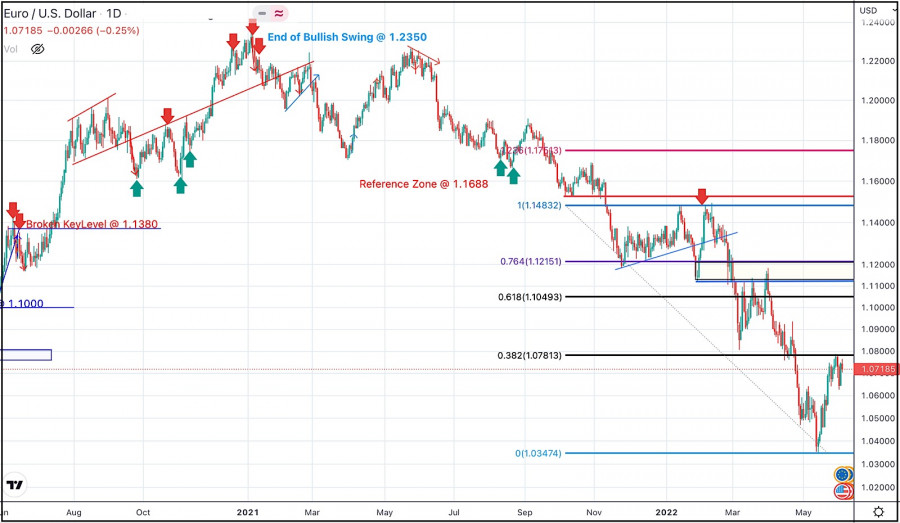
| June 3, 2022 : EUR/USD Intraday technical analysis and trading plan. Posted: 03 Jun 2022 03:00 PM PDT
In late September, Re-closure below the price level of 1.1700 has initiated downside-movement towards 1.1500 where some bullish recovery was witnessed. Shortly after, another price decline took place towards 1.1200. Then the EURUSD has temporarily moved-up within the depicted movement channel until downside breakout occurred. The EURUSD looked oversold while approaching the price levels of 1.0800. That's when an upside movement was initiated towards 1.1200. This recent movement towards 1.1200 was suggested for another SELL opportunity which already reached its targets. The current ascending movement above 1.0600 may enable further advancement towards 1.0850 where bearish rejection can be applied. On the other hand, the pair remains under selling pressure to re-visit the new daily low around 1.0350. The material has been provided by InstaForex Company - www.instaforex.com |
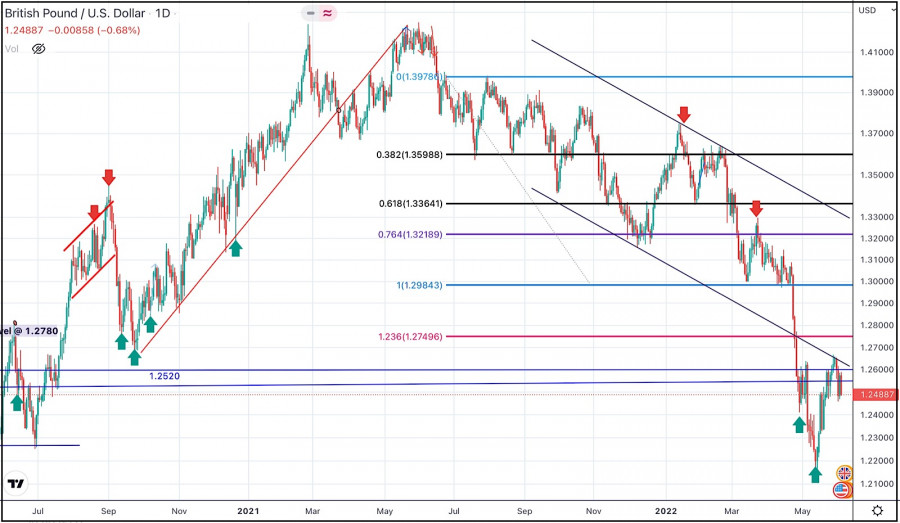
| June 3, 2022 : GBP/USD Intraday technical analysis and significant key-levels. Posted: 03 Jun 2022 02:59 PM PDT
The short-term outlook turned bearish when the market went below 1.3600. This enhanced the bearish side of the market initially towards 1.3400 then 1.3200 which initiated a strong bullish movement towards 1.3600 for another re-test. The recent bullish pullback towards 1.3600 should have been considered for SELL trades as it corresponded to the upper limit of the ongoing bearish channel. Shortly after, Bearish persistence below 1.3360 enabled bearish continuation towards 1.2980 - 1.3000. The price level of 1.3000 stood as intraday Support where a short-term sideway movement could be established . This happened before two successive bearish dips could take place towards 1.2550 and 1.2200. Considerable bullish rejection was expressed around 1.2200. Hence, bullish breakout above 1.2550 was needed to abolish the short-term bearish scenario for sometime. Quick bullish advancement was executed towards 1.2650 where some bearish resistance is encountered. The GBP/USD pair remains under bearish pressure to challenge the new low around 1.2150 again. Hence, any bearish reversal signs around 1.2650 should be considered for SELLING the pair. The material has been provided by InstaForex Company - www.instaforex.com |
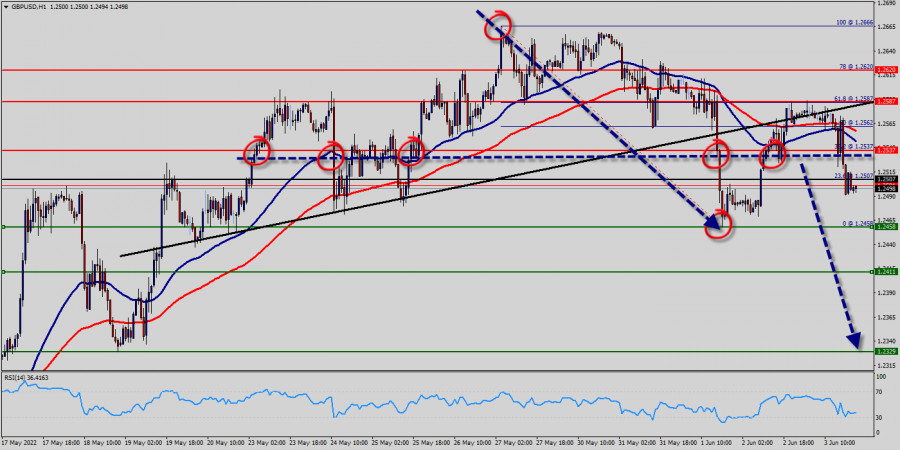
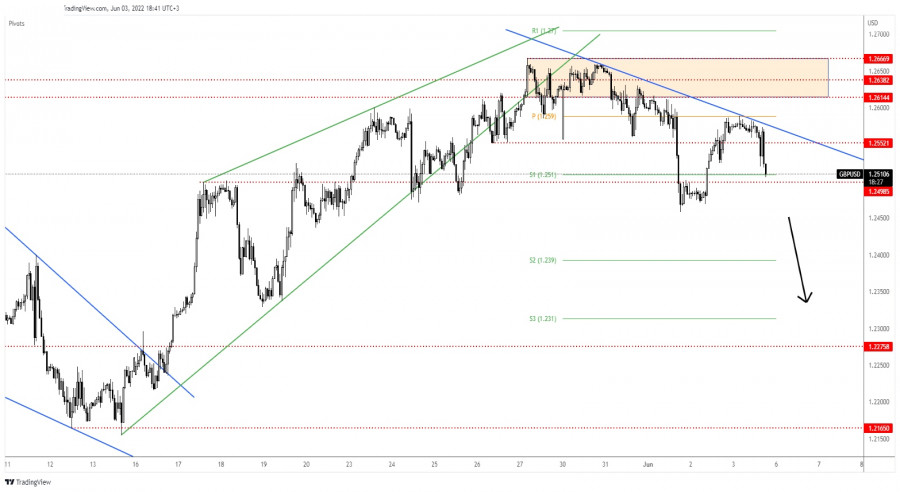
| Technical analysis of GBP/USD for June 03, 2022 Posted: 03 Jun 2022 01:04 PM PDT Overview : The GBP/USD pair opened below the weekly pivot point (1.2537). It continued to move downwards from the level of 1.2537 to the bottom around 1.2497. Today, the first resistance level is seen at 1.2537 followed by 1.2587, while daily support 1 is seen at 1.2458. Furthermore, the moving average (100) starts signaling a downward trend; therefore, the market is indicating a bearish opportunity below 1.2537. So it will be good to sell at 1.2537 with the first target of 1.2458. It will also call for a downtrend in order to continue towards 1.2411. The strong daily support is seen at the 1.2411 level, which represents the double bottom on the H1 chart.
According to the previous events, we expect the EUR/USD pair to trade between 1.2537 and 1.2411 in coming hours. The price area of 1.2537 remains a significant resistance zone. Thus, the trend is still bearish as long as the level of 1.2537 is not broken. On the contrary, in case a reversal takes place and the EUR/USD pair breaks through the resistance level of 1.2537, then a stop loss should be placed at 1.2587. Comment:
|
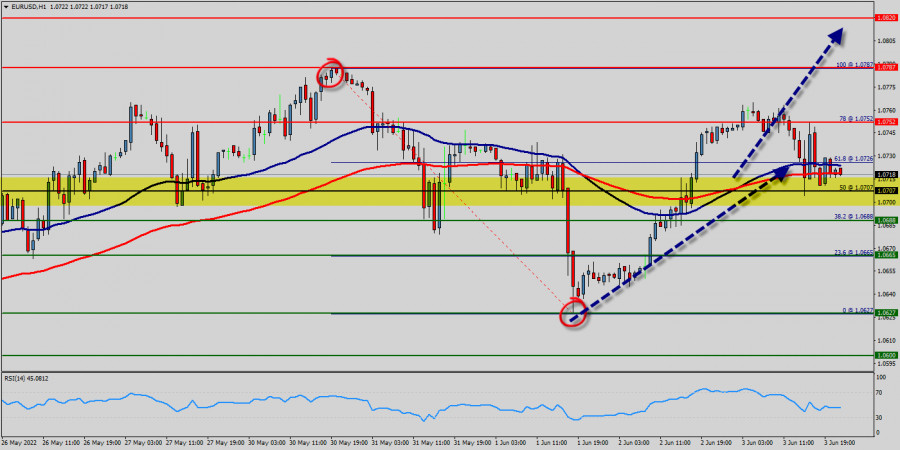
| Technical analysis of EUR/USD for June 03, 2022 Posted: 03 Jun 2022 12:43 PM PDT Overview : The EUR/USD pair will continue to rise from the level of 1.688 in the long term. It should be noted that the support is established at the level of 1.688 which represents the daily pivot point on the H1 chart. The price is likely to form a double bottom in the same time frame. Accordingly, the EUR/USD pair is showing signs of strength following a breakout of the highest level of 1.0707. So, buy above the level of 1.0707 with the first target at 1.0752 in order to test the daily resistance 1. The level of 1.0787 is a good place to take profits because it will test the double top.
Moreover, the RSI is still signaling that the trend is upward as it remains strong above the moving average (100). This suggests that the pair will probably go up in coming hours. If the trend is able to break the level of 1.0787, then the market will call for a strong bullish market towards the objective of 1.0820 today. On the other hand, in case a reversal takes place and the EUR/USD pair breaks through the support level of 1.0688, a further decline to 1.0627 can occur. It would indicate a bearish market. According to the previous events the price is expected to remain between 1.0627 and 1.0820 levels. Buy-deals are recommended above 1.0688 with the first target seen at 1.0752. The movement is likely to resume to the point 1.0787 and further to the point 1.0820. The descending movement is likely to begin from the level 1.0820 with 1.0688 and 1.0627 seen as targets. The material has been provided by InstaForex Company - www.instaforex.com |
| GBP/USD: bounce ends, new sell-off underway Posted: 03 Jun 2022 10:03 AM PDT The GBP/USD pair plunges as the DXY's growth boosts the USD. It was trading at 1.2507 at the time of writing. Technically, the price ended its rebound and now it looks very heavy. The Dollar Index has found support and now it tries to come back higher. DXY's strong rally should force the greenback to dominate the currency market. Today, the UK banks will be closed in observance of the Platinum Jubilee Bank Holiday. Fundamentally, the US economic data brought high volatility and sharp movements earlier. The NFP came in better than expected at 390K versus 325K expected, the Average Hourly Earnings rose by 0.3% compared to 0.4% forecasts, while the Unemployment Rate came in at 3.6% versus 3.5% expected. Furthermore, the ISM Services PMI and the Final Services PMI reported worse than expected data. GBP/USD Crashes!
The GBP/USD pair rebounded after its last sell-off in the short term. It has retested the weekly pivot point of 1.2590 and now it seems strongly bearish. Technically, as long as it stays under the downtrend line, the price is vulnerable to dropping deeper. 1.2498 stands as the immediate downside obstacle. As you can see, the rate failed to stabilize blow this support in the last attempt. A valid breakdown followed by a new lower low could signal more declines. GBP/USD Forecast!A new lower low, dropping and closing below the 1.2458 could activate a larger downside movement and could bring new short opportunities. The material has been provided by InstaForex Company - www.instaforex.com |
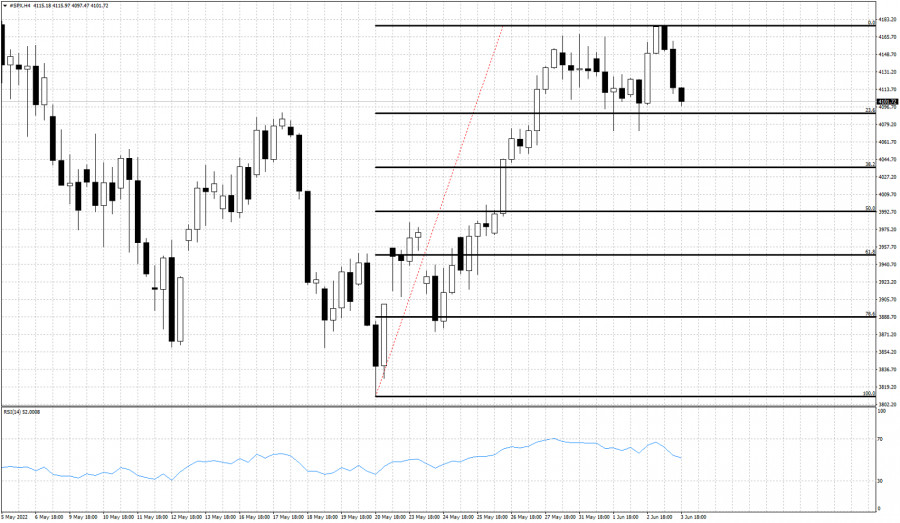
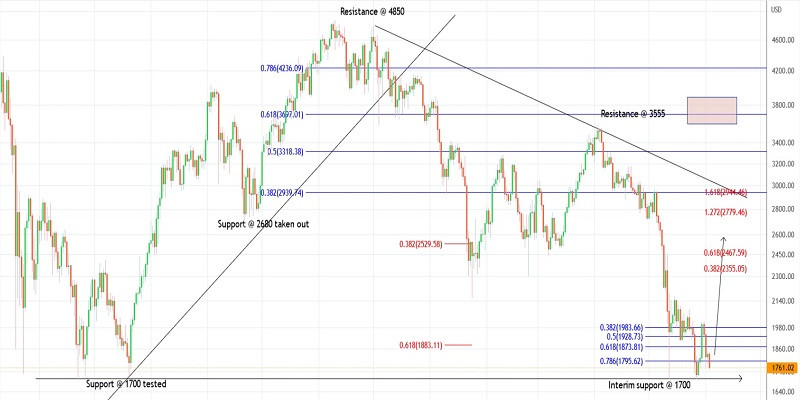
| Posted: 03 Jun 2022 08:35 AM PDT The entire upward movement from 3,810 to 4,177 is most probably over. With price rolling over at $4,100, there are increased chances that we have entered a short-term pull back phase that will bring SPX towards $4,000-$3,900.
SPX is under pressure at the last trading day of the week. Price is expected to at least retrace 38% of the entire upward move, but usually we see 50% or even 61.8% retracements. At current levels it is more probable that we see SPX move lower than turn back up and continue to higher highs. Traders better be patient and if they want to buy, better wait for better entry levels like 4,000-3,900. The current price of SPX is not a good level for new long positions. Aggressive traders would look to go short with recent highs as stop and target the 4,000-3,900 level for profits. The material has been provided by InstaForex Company - www.instaforex.com |
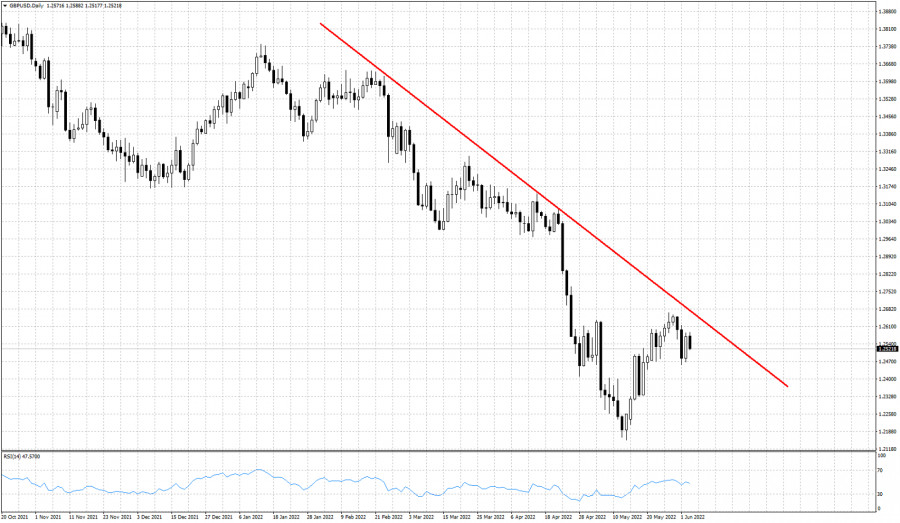
| GBPUSD remains below key resistance trend line. Posted: 03 Jun 2022 08:28 AM PDT GBPUSD is trading around 1.2511 and despite yesterday's bounce higher towards 1.2585, we did not see a follow through today as price is under pressure in negative territory. Price remains below the key medium-term downward sloping resistance trend line. This implies that GBPUSD remains vulnerable to more downside.
GBPUSD has support at 1.2455. Failure to hold above this level will add pressure to price and mist probably push it towards 1.23-1.22.Bulls need to push price above 1.2675 in order to change short-term trend to bullish. First step for bulls will be to defend 1.2455. Concluding, with price still below the red trend line, we focus on the bearish side of the market looking for price bounces to sell. A break above resistance will change our view and we will focus on bullish setups and opportunities to buy. The material has been provided by InstaForex Company - www.instaforex.com |
| EUR/USD's rally stopped by 1.0757, NFP better than expected Posted: 03 Jun 2022 08:27 AM PDT The EUR/USD pair is dropping after trying to retest the 1.0757 key level. The USD is bullish as the Dollar Index seems determined to climb back higher. The DXY reached 101.64 - 101.74 support zone and now it looks determined to come back higher. Fundamentally, the USD received a helping hand from the US Nonfarm Employment Change that was reported at 390K in May versus 325K estimates. Unfortunately, the Unemployment Rate remained at 3.6%, even though economists predicted a downtick to 3.5%, while the Average Hourly Earnings rose only by 0.3% versus 0.4% expected. In addition, the ISM Services PMI and the Final Services PMI came in worse than expected as well. EUR/USD Trading In The Red!
The EUR/USD pair rallied in the short term after finding support at 1.0641. Now, it has found resistance at 1.0757 and it seems determined to drop again. 1.0697 stands as an immediate downside obstacle. As you can see on the H4 chart, the currency pair is trapped between 1.0641 and 1.0786 levels. I told you in my previous analysis that EUR/USD could bring new opportunities after escaping from the current range. EUR/USD Outlook!As long as it stays under the 1.0757 key level, EUR/USD could come back down. Still, only a valid breakdown below the 1.0641 could activate a larger downside movement and could bring great selling opportunities. A new higher high could announce an upside continuation. Jumping, closing, and stabilizing above the 1.0786 announces more gains. The material has been provided by InstaForex Company - www.instaforex.com |
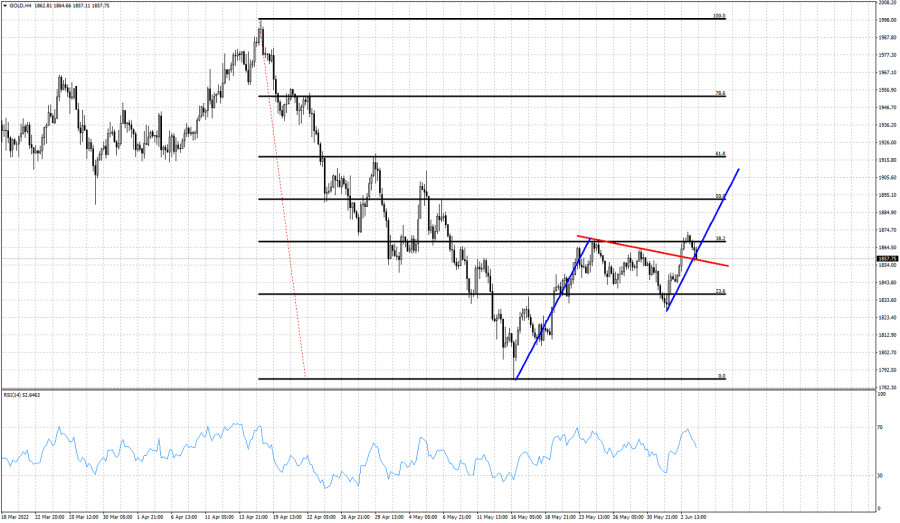
| Short-term technical analysis on Gold. Posted: 03 Jun 2022 08:19 AM PDT Gold price is trading above $1,850. Earlier today Gold price was as high as $1,873. Yesterday Gold price broke above the short-term resistance trend line. Today price is back testing the break out and support area of $1,850-55.
Black lines- Fibonacci retracements Blue lines- expected movement Gold price once again stopped its advance at the 38% Fibonacci retracement. Price is back testing the broken red resistance trend line from above. Bulls need to defend $1,850-55. Failure to do so, will decrease dramatically the chances of a move towards $1,900 which was our target after breaking above the red resistance trend line. So far the bullish setup for a move towards $1,900 remains valid. The material has been provided by InstaForex Company - www.instaforex.com |
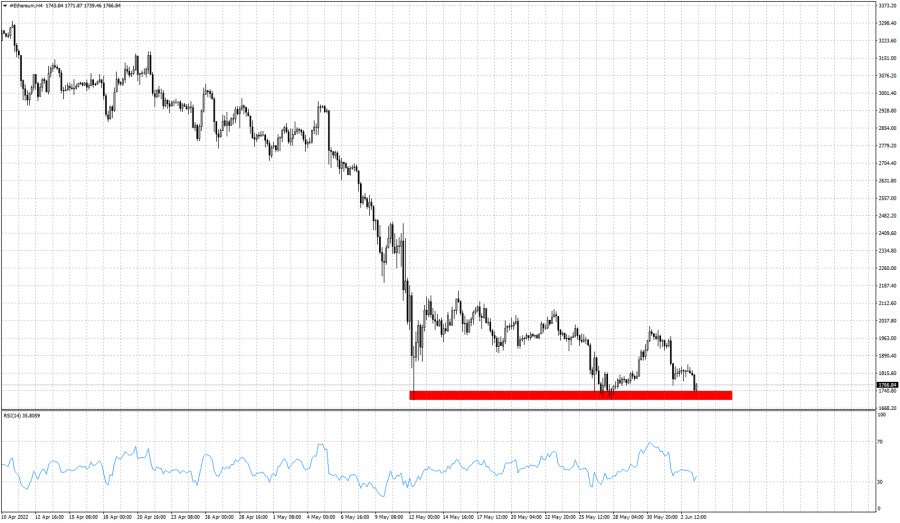
| Ethereum challenges major weekly support. Posted: 03 Jun 2022 08:16 AM PDT In our previous analysis we noted the importance of the weekly support around $1,700. A break below this level will provide a new bearish signal for Ethereum and price will be vulnerable to a move lower towards $1,400.
Ethereum has so far tested $1,700 three times. All previous times price bounced higher. Will it do the same this time? Price continues making lower highs. This is a sign that bull's strength is weakening and every upside bounce is weaker. Resistance is at $2,010 and as long as price is below this level, we remain pessimistic for the price of Ethereum. The material has been provided by InstaForex Company - www.instaforex.com |
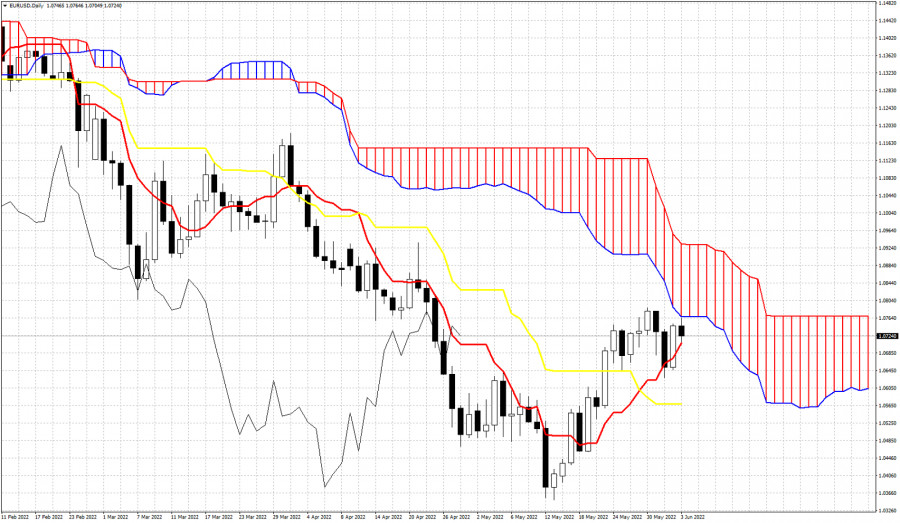
| Ichimoku cloud indicator analysis on EURUSD for June 3, 2022. Posted: 03 Jun 2022 08:12 AM PDT EURUSD is trading around 1.0720 after reaching as high as 1.0764 earlier today. Price remains below the Kumo (cloud) in the daily chart. Today price touched the cloud resistance and got rejected. Bulls need to break inside the cloud in order to change daily trend to neutral from bearish.
|
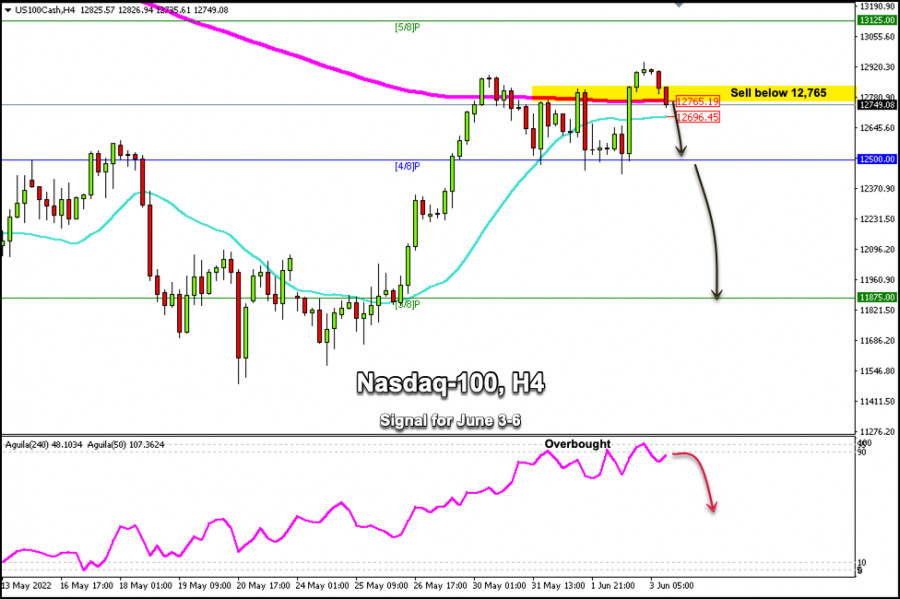
| Trading Signal for Nasdaq-100 (#NDX) on June 3-6, 2022: sell below 12,765 (200 EMA - overbought) Posted: 03 Jun 2022 08:11 AM PDT
Nasdaq-100 Tech Index (#NDX) is trading around the 200 EMA located at 12,765. Yesterday, the index performed well above 3.5% reaching a high of 12,941 returning to the price levels of May 6. Seeing as the Nasdaq-100 is pulling back and consolidating below the 200 EMA, a technical correction is likely in the next few hours and the index could reach the support of 4/8 Murray at around 12,500. A close on 4-hour chart below the 21 SMA at 12,696 could be a clear signal to sell with targets at 12,500. The 4/8 Murray around 12,500 has offered good support to the Nasdaq-100 since the beginning of the week which is likely to provide a technical bounce around this area. A sharp break of 4/8 Murray and a daily close below this level could accelerate the bearish move and the price could quickly drop to 3/8 Murray at 11,875. On June 2, the eagle indicator reached the extremely overbought zone. The odds are that there will be an imminent correction of the Nasdaq-100 and it could continue a fall until next week. To regain its bullish bias, the Nasdaq-100 should have a daily close above 12,780. In case this happens, we should avoid selling and the upside is likely to resume. In this case, the index could hit 5/8 Murray at 13,125. Our trading plan for the next few hours is to sell below the 200 EMA at 12,765, with targets at 12,690, 12,600 and 12,500. Additionally, if downside pressure prevails, we could sell if it breaks below 12,500 with targets at 12,300 and 11,875. The eagle indicator is showing an overbought signal which supports our bearish strategy. The material has been provided by InstaForex Company - www.instaforex.com |
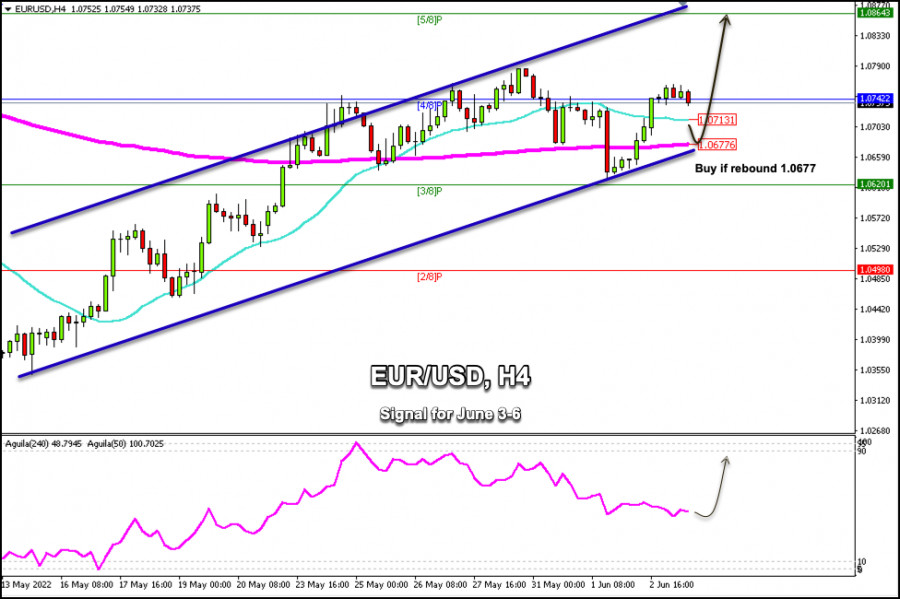
| Trading Signal for EUR/USD on June 3-6, 2022: buy in case of rebound at 1.0677 (200 EMA - 21 SMA) Posted: 03 Jun 2022 05:53 AM PDT
Early in the American session, EUR/USD is trading at 1.0740. It is pulling back after reaching 1.0764 in the European session, the highest level in three days. According to the 4-hour chart, we can see that the euro maintains the overall bullish trend since May 13, but could make a technical correction, due to the fact that it faces the resistance of 4/8 Murray, which is putting pressure on the pair. As the US government employment report will be published shortly, we notice a pause in market volatility. Non-farm payrolls are expected to rise by 325,000 and the unemployment rate is expected to drop to 3.5%. If the data is weaker than expected, we could see a quick reaction in the market to the upside and EUR/USD could reach the zone of 5/8 Murray around 1.0864, and from there it could start a bearish trend. Conversely, if the actual data confirms the healthy US labor market, the currency pair could make a technical correction towards the 200 EMA around 1.0677 and from there it could resume its uptrend. Any pullback in the euro will be considered a buying opportunity, only if it remains trading above the 200 EMA located at 1.0670. On the condition of a sharp break and a close below the 200 EMA on the daily chart, we could expect an acceleration to the downside and the price could reach 3/8 Murray at 1.0620 and could even drop to 1.0498 (2/8 Murray). The euro will continue its uptrend only if it manages to consolidate above 4/8 Murray located at 1.0742. The consolidation could take it towards the top of the uptrend channel around 1.0860. Our trading plan for the next few hours is to buy the euro in case of a bounce off 1.0712 or 1.0677, with targets at 1.0742 and 1.0864. The material has been provided by InstaForex Company - www.instaforex.com |
| Analysis of GBP/USD on June 3. What to expect from Nonfarm Payrolls data Posted: 03 Jun 2022 05:47 AM PDT
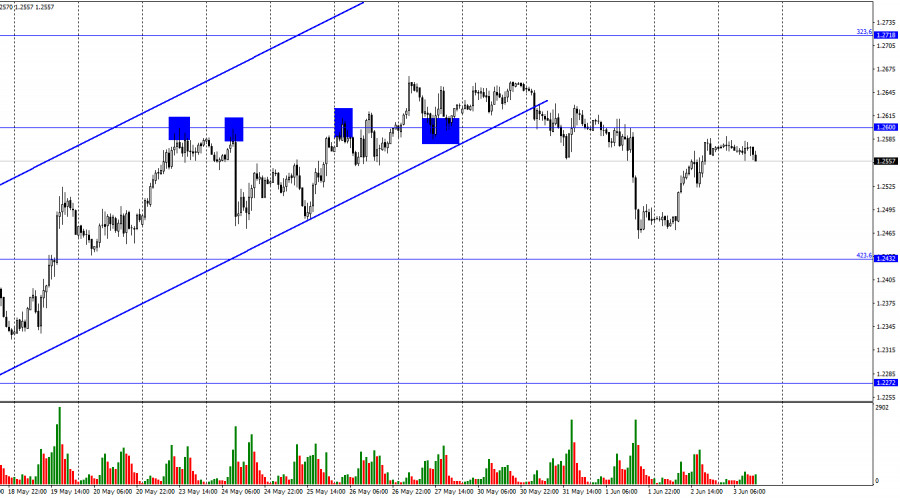
Good afternoon, dear traders! On the 1H chart, the GBP/USD pair rose considerably by 100 pips yesterday and almost reached 1.2600. This level was like a magnet for the price in the past days. However, this time, the price did not rebound from it. So, it is likely to fall to the Fibonacci correction level of 423.6% - 1.2432. Yet, it is still just a probability because the US is about to reveal its labor market reports. Naturally, they will significantly impact the market sentiment. Besides, traders are anticipating today only this data. The Nonfarm Payrolls report has always been one of the few reports that traders are waiting for with bated breath. The pair may change its trajectory in any direction following the NFP data. If the economy adds 325K, the US dollar is sure to advance. In case of a negative figure, it will slip. However, there are also other possible readings. If the indicator for May totals 340K, will it be good or bad? What if the indicator amounts to 310K? I am expecting a drop in the euro/dollar and the pound/dollar pairs because both pairs closed below the uptrend corridors a few days ago. After that, their downward movement was not too strong to be completed. However, I do not rule out that the NFP data may surprise traders. Therefore, the pairs may change drastically their trajectories. The US will also publish reports on the unemployment rate and average hourly wages. However, they will be eclipsed by the Nonfarm Payrolls report.
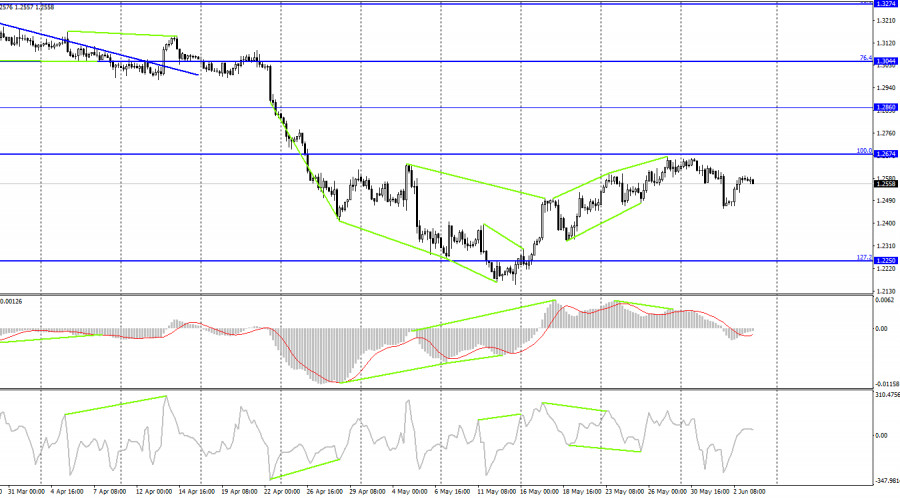
On the 4H chart, the pair performed a reversal with the US currency taking the lead after the formation of a bearish divergence of the MACD indicator. It occurred near the Fibonacci correction level of 100.0% - 1.2674. Yet, there was no rebound. Thus, a fall in the quotes has already begun. The pair may drop to the correction level of 127.2% - 1.2250. The pound sterling will strengthen if it rises above the Fibo level of 100.0%. If so, it may resume an upward movement to the 1.2860 level. Commitments of Traders (COT):
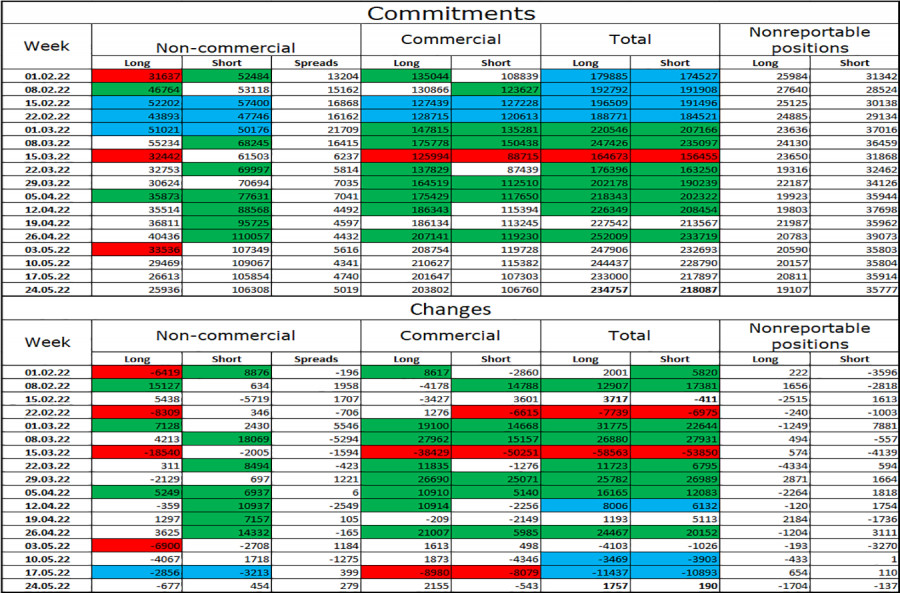
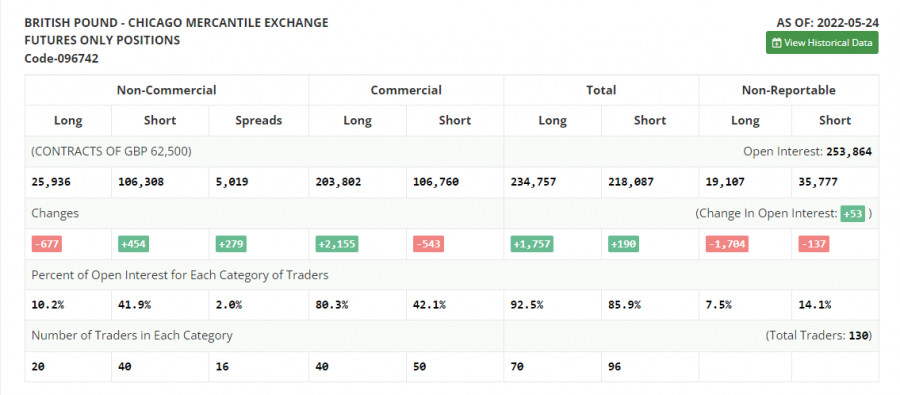
The mood of the Non-commercial category of traders has not changed significantly over the past week. The number of Long contracts decreased by 677, while the number of Short contracts increased by 454. Thus, the general mood of traders remained bearish. The number of Long contracts exceeds the number of Short ones by four times as before. Large traders continue to get rid of the pound sterling. Thus, the bears are likely to take the upper hand over the pound sterling over the next few weeks. Now, the range indicated on the 1H and 4H charts will be of great importance. Such a big difference between the numbers of Long and Short contracts may also indicate a trend reversal. Nevertheless, speculators are now more inclined to sell than buy. Macroeconomic calendar for the US and the UK: US - Average hourly wage (12:30 UTC).US- Nonfarm Payrolls (12:30 UTC).US - Unemployment Rate (12:30 UTC). On Friday, the economic calendar for the UK is completely empty. In the second half of the day, the US will unveil crucial reports that may significantly affect market sentiment. GBP/USD outlook and recommendations to traders: It is recommended to open short positions if the pair closes below the indicated corridor on the 1H chart. If it drops below the 1.2600 level, it is better to keep short positions open, bearing in mind the target level of 1.2432. It is better to open long positions if the pound sterling rises above 1.2674 with the target level of 1.2860 on the 4H chart. The material has been provided by InstaForex Company - www.instaforex.com |
| Trading plan for Ethereum on June 03, 2022 Posted: 03 Jun 2022 05:10 AM PDT
Technical outlook:Ethereum continued to slide through the $1,755-60 zone on Friday, looking to find support. The crypto is trading at around $1,765 at this point in writing and is expected to turn higher from here soon. Bulls are looking poised to hold prices above the $1,700 mark and push through $3,000 in the near term. Watch out for a bullish reversal against $1,700. Ethereum is still unfolding its counter-trend rally from the $1,700 lows registered in May. Within the corrective phase, the crypto might be into the last leg higher towards $3,000 and up to the $3,500-3,600 zone going forward. Immediate resistance is seen at $2,015 while interim support comes at around $1,700 respectively. Ethereum has also carved a lower degree upswing within its last leg rally between $1,705 and $2,015, which is being retraced now. If correct, prices should stay above $1,705 and resume higher through $3,000 in the near term. The potential remains for a push through $3,500 which is close to the Fibonacci 0.618 retracement of the larger degree downswing. Trading plan:Potential rally through $3,000 and $3,500 against $1,700 Good luck! The material has been provided by InstaForex Company - www.instaforex.com |
| Most cryptocurrencies likely to fail soon, experts say Posted: 03 Jun 2022 04:58 AM PDT BTC was moving sideways early on Friday. At the moment of writing, bitcoin traded at $30,488. According to CoinMarketCap, the cryptocurrency traded in a $29,688-30,633 range on Thursday.
On May 31, BTC touched $32,399, its highest level in 3 weeks. However, bitcoin dropped to $31,400 on June 1 and continued to slide down afterwards. Over the past week, BTC increased by 6.6% in its first week of gains after a 9-week losing streak. Earlier, bitcoin's downtrends did not exceed 7 straight weeks. Over the past two months, the cryptocurrency dropped 1.6-fold to $29,000 from $45,800. BTC lost 30% of its value since the beginning of March and 60% since it reached an all-time high of more than $69,000 in November 2021. Many other coins have also suffered major losses and retreated from their all-time highs. Altcoin market Ethereum also started Friday in a sideways trend. At the moment of writing, ETH was trading at $1,829. The altcoin broke above $2,000 at the end of May, but quickly retreated afterwards. Out of top 10 cryptocurrencies by market cap, the best performing token of the past 24 hours was Solana (4.60%). Other top cryptocurrencies have also advanced. Over the past 7 days, Solana suffered the biggest losses - SOL fell by 4.31%. Cardano was the biggest gainer - ADA jumped by 25.44%. According to CoinGecko, out of the top 100 cryptocurrencies by market cap, the biggest gainer was Internet Computer, which increased by 18.9%. BitDAO was the biggest loser, slumping by 12.2%. The best and worst performing coins out of the top 100 were Waves (+100.0%) and Solana (-33.5%). Crypto analyst outlooks The crypto market's high volatility and unpredictable movements resulted in a variety of outlooks. Ripple's CEO Brad Garlinghouse stated that the crypto market would be reduced to only a few dozen coins. Currently, there are more than 19,000 cryptocurrencies and several dozens of blockchain platforms in the market. However, there has been increased speculation by CEOs of several crypto companies about an imminent collapse of numerous digital coins and blockchains. The recent collapse of Terra USD (UST) and the Luna token resulted in billions of dollars erased from the crypto market, shedding light on the serious vulnerabilities of digital assets. As a result of the crash, many crypto analysts put the viability of most cryptocurrencies into question. Earlier, Scott Minerd, Chief Investment Officer at Guggenheim Partners, said that most crypto coins were "junk" that would vanish in the future. However, bitcoin and Ethereum would survive the market crash, he added. Dawn Fitzpatrick, the CIO of Soros Fund Management, predicted that Ethereum would outperform BTC after its Ethereum 2.0 update was complete. "The one caveat I would say is, first of all, climate impact is going to become increasingly in focus, and in that context, Ethereum is likely to gain some more traction over Bitcoin," Fitzpatrick told Bloomberg. Currently, the blockchain network is shifting from an energy intensive proof-of-work consensus mechanism to a more environmentally friendly proof-of-stake mechanism. Earlier, co-founder of Ethereum Vitalik Buterin announced that Ethereum would switch to PoS as early as August 2022. "I think blockchain technology is going to have some great applications," Fitzpatrick added, referring to its use for securely storing and tracking information. Bertrand Perez, the CEO of the Web3 Foundation, compared digital assets to the dotcoms of the late 1990s. "Like at the beginning of the internet, you were having lots of dotcom companies and lots of them were scams, and were not bringing any value and all that got cleared. And now we have very useful and legit companies," he told CNBC at the World Economic Forum in Davos. "We're in a bear market. And I think that's good. It's good, because it's going to clear the people who were there for the bad reasons." "One of the effects of what we've seen last week with the Terra issue is we're at the stage where basically there are far too many blockchains out there, too many tokens. And that's confusing users. And that's also bringing some risks for the users," Perez concluded. The material has been provided by InstaForex Company - www.instaforex.com |
| Trading plan for Bitcoin on June 03, 2022 Posted: 03 Jun 2022 04:52 AM PDT
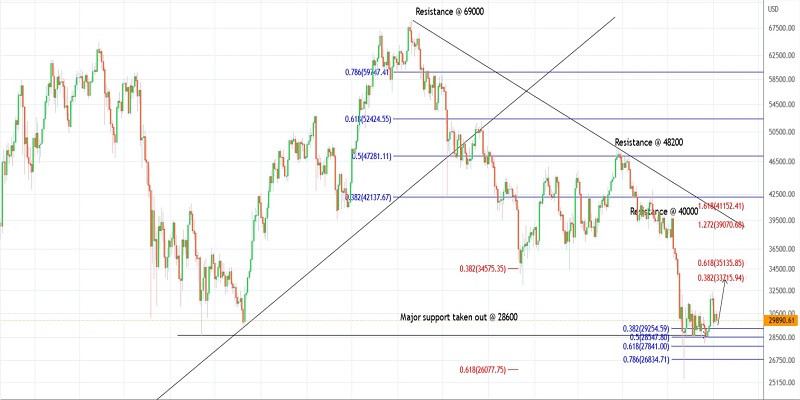
Technical outlook:Bitcoin dropped through the $29,600 lows on Friday before finding some bids again. The crypto is holding well above the $28,000 interim low as bulls are looking poised to push higher through $35,000 and up to $42,000 going forward. On the flip side, a break below $28,000 will test the $27,000-500 mark before resuming its rally. Bitcoin is still unfolding its corrective wave that has begun from the $25,500 lows earlier. If the third leg within the corrective phase is underway, prices will rally from here and push through $42,000 and $48,000 in the next several trading sessions. Alternatively, prices could first drop towards the $27,000-500 area before resuming higher again. Bitcoin is working on a larger degree downswing carved between $69,000 and $25,500. Prices might push through $48,000 and up to $52,000 which is also the Fibonacci 0.618 retracement of the above drop. Bears will remain inclined to be back in control thereafter and drag prices below $25,500. Trading plan:Potential rally through $42,000, $48,000 and up to $52,000 against $20,000 Good luck! The material has been provided by InstaForex Company - www.instaforex.com |
| AUD/USD Technical Analysis and Trading Tips on June 3, 2022 Posted: 03 Jun 2022 04:41 AM PDT
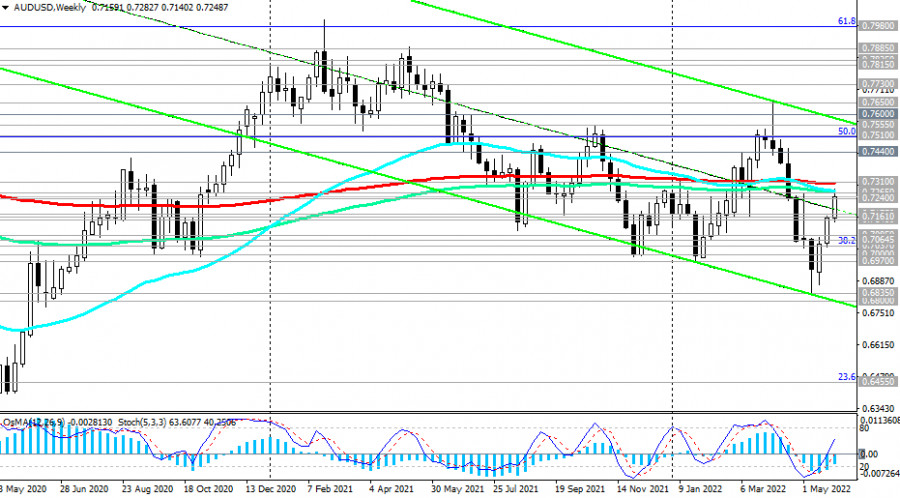
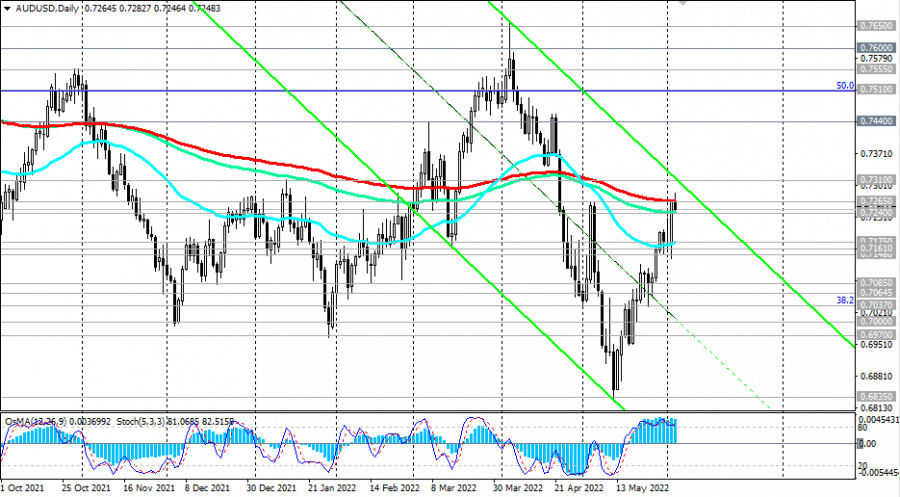
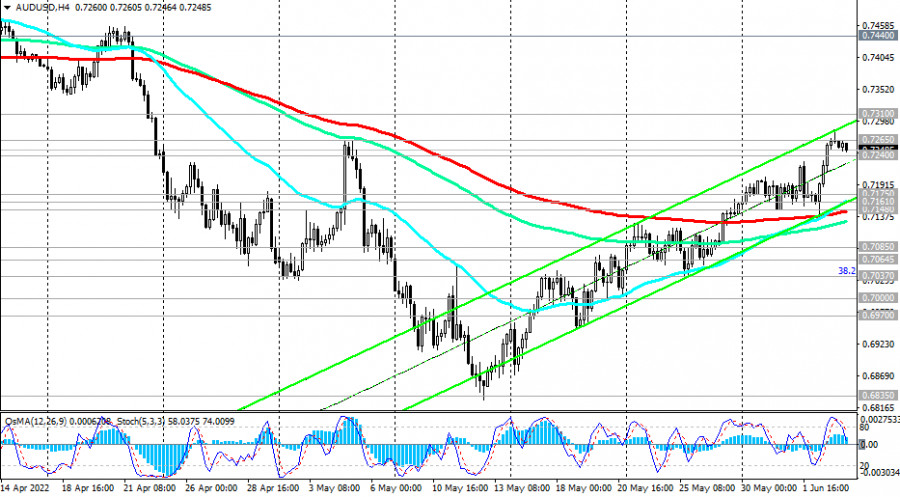
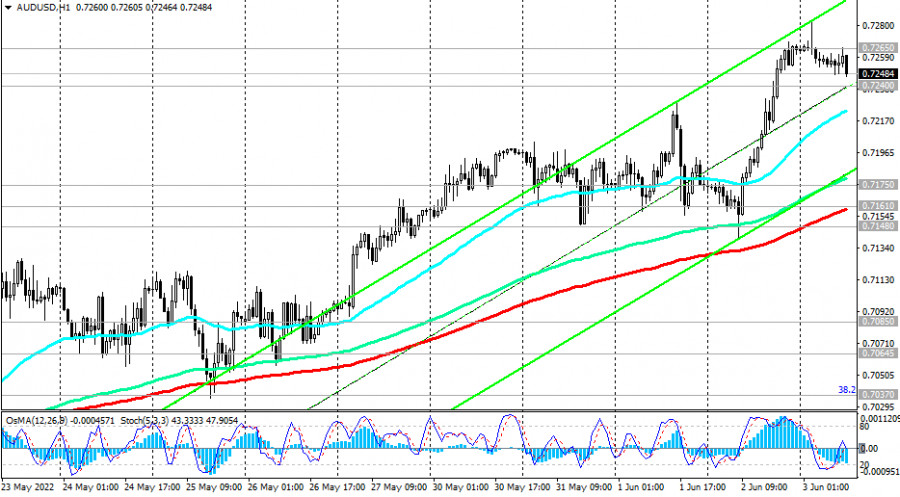
At the time of writing this article, AUD/USD is trading near 0.7248, remaining in a range between the most important long-term levels of 0.7265 (200 EMA on the daily chart), 0.7240 (144 EMA on the daily chart). If there is a rebound from these levels and AUD/USD resumes its decline, then we can say that the upward correction of the pair, which has been observed since mid-May, has ended and the price is returning to the global downward trend.
A confirmation signal for this will be a consecutive breakdown of 3 important support levels 0.7175 (50 EMA on the daily chart), 0.7161 (200 EMA on the 1-hour chart), and 0.7148 (200 EMA on the 4-hour chart).
The targets of this decline are located at the support levels of 0.6835 (local 2-year low), and 0.6800 (lower limit of the descending channel on the weekly chart).
At the same time, AUD/USD maintains a positive trend above the support levels of 0.7175, 0.7161, and 0.7148. The breakdown of the key resistance level 0.7265 and the resistance level 0.7310 (200 EMA on the weekly chart, 50 EMA on the monthly chart) creates the prerequisites for growth to the long-term resistance level 0.7600 (200 EMA on the monthly chart), which separates the global bull market from the bear market. Support levels: 0.7240, 0.7175, 0.7161, 0.7148, 0.7085, 0.7064, 0.7037, 0.7000, 0.6970, 0.6835, 0.6800, 0.6450 Resistance levels: 0.7265, 0.7310, 0.7400, 0.7440, 0.7510, 0.7555, 0.7600, 0.7650 Trading Tips AUD/USD: Sell Stop 0.7225. Stop-Loss 0.7290. Take-Profit 0.7200, 0.7175, 0.7161, 0.7148, 0.7085, 0.7064, 0.7037, 0.7000, 0.6970, 0.6835, 0.6800, 0.6450 Buy Stop 0.7290. Stop-Loss 0.7225. Take-Profit 0.7310, 0.7400, 0.7440, 0.7510, 0.7555, 0.7600, 0.7650 The material has been provided by InstaForex Company - www.instaforex.com |
| Posted: 03 Jun 2022 04:02 AM PDT In my morning forecast, I paid attention to several levels, but we never reached them. Let's look at the 5-minute chart and figure out what happened. The lack of statistics and low volatility of the pair - all this did not allow me to get to the levels I indicated, from which I was advised to make decisions. Accordingly, there were no entry points to the market. For the second half of the day, the technical picture has not changed in any way, nor has the strategy changed. And what were the entry points for the euro this morning?
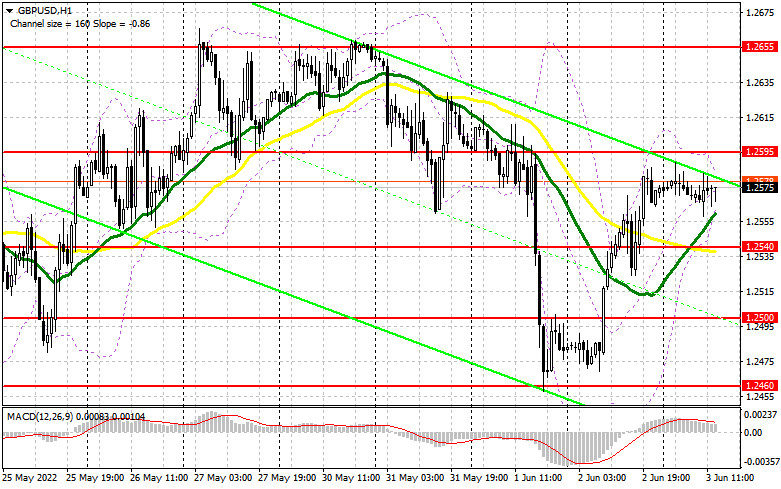
To open long positions on GBP/USD, you need: The focus will be on data on the number of people employed in the US non-agricultural sector - on the so-called Nonfarm payrolls report. The unemployment rate is unlikely to make a huge difference, even if it is reduced by one-tenth. If the number of new jobs turns out to be significantly worse than forecasts, and let me remind you, analysts already expect a serious reduction in May compared to April, the pressure on the dollar will increase. In this case, we will certainly see an update of the highs of last month. If the data indicate that the labor market is coping well with the tightening of monetary policy by the Federal Reserve and is not losing its growth rate yet, the pressure on the pound will return at the end of the week and we may see a strengthening of the US dollar. In the case of a decline in the pound, only the formation of a false breakdown at 1.2540, where the moving averages are, will lead to the first signal to open new long positions in the expectation of a resumption of the bullish trend. An equally important task for the bulls will be to consolidate above the large resistance of 1.2595, which must be returned - if buyers, of course, plan to maintain a bull market. It is possible to expect a sharper jerk of the pair, but only after fixing above this range with a reverse test from top to bottom, which will open the way to a maximum of 1.2655. A breakdown of this range will return GBP/USD to the resistance area: 1.2709 and 1.2755, where I recommend taking the profits. In case of a decline in the pound and the absence of buyers at 1.2540 in the afternoon, the pressure on the pair will only increase. This will allow us to reach 1.2500, which will call into question the further bullish trend for the pair. For this reason, I advise you not to rush purchasing. It is best to enter the market after a false breakdown at this level. I advise buying GBP/USD immediately for a rebound from 1.2460, or even lower - around 1.2411 with the aim of correction of 30-35 points within a day. To open short positions on GBP/USD, you need: As I said this morning, the bears have one last chance to get the market back under their control. To do this, it is necessary to protect the resistance of 1.2595, the test of which can take place in the case of weak statistics for the United States. Only the formation of a false breakdown there will give a signal to open short positions in the expectation of a downward correction of the pair to the area of 1.2540, where the moving averages are. An equally important task for sellers will be to consolidate below 1.2540. Closing the week below this range will surely lead to the pair hanging in the side channel with the prospect of gradually returning pressure on the pound from the major players. A breakthrough and a reverse test from the bottom up of 1.2540 will form an additional sell signal, allowing GBP/USD to return to the 1.2500 area, from which the pair's most active growth was observed yesterday. A breakout of this range will also open a direct road to the minimum of 1.2460, where I recommend fixing the profits. The longer-term target will be a minimum of 1.2411, which will completely cancel out the bull market. With the option of GBP/USD growth and lack of activity at 1.2595 in the afternoon, an upward jerk may occur against the background of the demolition of sellers' stop orders. In this case, I advise you to postpone short positions to the May maximum of 1.2655. I advise you to sell the pound there only if there is a false breakdown. Short positions can be made immediately for a rebound from 1.2709, or even higher - from 1.2755, counting on the pair's rebound down by 30-35 points inside the day.
The COT report (Commitment of Traders) for May 24 recorded a reduction in long positions and an increase in short ones. However, this did not significantly affect the balance of power. Despite the growth of the pound since the middle of this month, the market remains completely under the control of sellers. Only the lack of fundamental statistics, to which the pair have been reacting quite negatively lately, and small profit-taking from annual lows allowed GBP/USD to recover a little. There are no other objective reasons for growth. The economy continues to slide into recession, inflation is breaking new records, and the cost of living in the UK is steadily rising. The Bank of England continues to rush between two fires, but even despite all this, the governor of the Bank of England, Andrew Bailey, continues to say that the regulator is not going to abandon raising interest rates yet. Rumors spread that the US central bank plans to "pause" the cycle of interest rate hikes in September this year continue to gain momentum, which puts little pressure on the US dollar and leads to a strengthening of the pound. The COT report for May 24 indicated that long non-commercial positions decreased by -667 to the level of 25,936, while short non-commercial positions increased by 454 to the level of 106,308. This led to an increase in the negative value of the non-commercial net position from the level of -79,241 to the level of -80,372. The weekly closing price rose from 1.2481 to 1.2511.
|
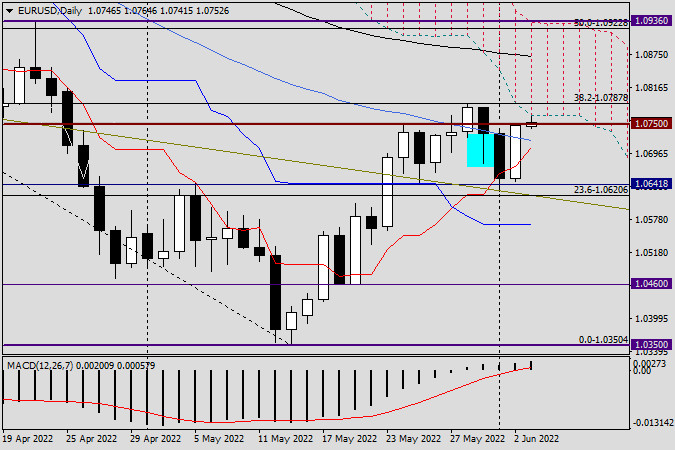
| EUR/USD: analysis and forecast for June 3, 2022 Posted: 03 Jun 2022 04:00 AM PDT Hello, dear colleagues! It is Friday, the last trading day of the week. Today, the US Labor Department will publish a jobs report for May. Clearly, these are the most expected fundamentals to come out this week. Although some think tanks question the importance of labor market data under current circumstances, Nonfarm Payrolls have always been one of the most closely-watched fundamental indicators able to cause changes in the technical picture of any currency pair. Speaking of market expectations, the unemployment rate in the US is projected to fall to 3.5% m/m from 3.6% a month earlier. At the same time, the American economy could add 325,000 new jobs. As for hourly earnings, figures are anticipated to rise by 0.4%. In general, such expectations can hardly be called unreasonably high, especially since Fed Chairman Jerome Powell has foreseen such an outcome. During his press conference after the May meeting and a 50 basis-point rate hike, the Fed's chief suggested there could be a fall in unemployment and a steady growth in new jobs. By this point in time, potential positive results, including the two future 50 basis-point rate increases have already been priced in by the market. However, if data comes in worse than expected, the dollar may feel some bearish pressure. Daily
The price broke through support at 1.0641. Earlier, the quote pulled back from this level thrice when bears tried to push EUR/USD below 1.0641. However, this level managed to withstand bearish pressure every time and provide strong support for the pair. Yesterday, after a rebound from 1.0645, the quote went up and closed at 1.0747. Another important technical level worth paying attention to stands at 1.0700. Bulls and bears seem to have been fighting for the barrier because the price closes either below or above the mark, unable to consolidate. In this light, taking into account the pair's strong growth yesterday and the fact that the price closed above 1.0700, a bullish scenario would seem more likely if not for Nonfarm Payrolls. After the labor market report, it will become clear where the price closes. If it closes in the Ichimoku Cloud and above the 1.0787 high of May 30, the pair is likely to ascend further. If it breaks through 1.0641 and closes below this important level, the quote will go down. Since today is the last trading day of the week it would be unwise to give a new outlook, especially ahead of perhaps the most important macroeconomic report. However, in general, the bullish scenario seems more likely. Have a nice weekend! The material has been provided by InstaForex Company - www.instaforex.com |
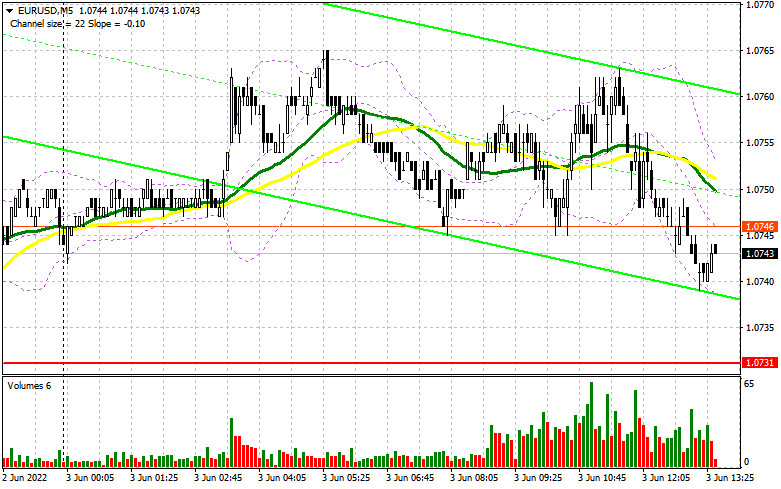
| Posted: 03 Jun 2022 04:00 AM PDT In the morning article, I highlighted the several levels and recommended taking decisions with those levels in focus. Now let's look at the 5-minute chart and try to figure out what actually happened. Given that the results of the macroeconomic reports were mainly in line with the economists' forecasts, the volatility in the EUR/USD pair in the first half of the day was fairly low. It amounted to about 25 pips. The pair failed to approach the anticipated support and resistance levels. There were also no signals to enter the market. In the afternoon, the technical outlook of the pair changed but the trading strategy remained the same.
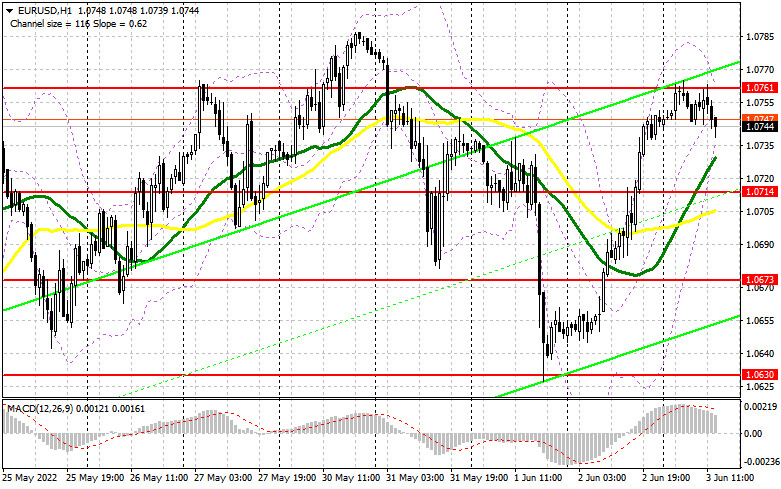
What is needed to open long positions on EUR/USD Today, traders will focus their full attention on the Nonfarm Payrolls report as well as the US unemployment rate data. If the figure turns out to be significantly worse than anticipated, the pressure on the US dollar will increase. Analysts expect a significant drop in May compared to April. In this case, the pair will certainly reach the highs of last month. If the report reveals that the labor market remains strong amid monetary policy tightening, the euro is likely to lose momentum at the end of the week. The US dollar, on the contrary, may climb. Other reports that are due today are unlikely to be of great interest to traders. If EUR/ USD decreases following the NFP report, it is recommended to open long positions only after a false breakout at the level of 1.0714. The moving averages are passing in the bullish territory above this level. This is the only way to get a buy signal on the euro in continuation of the bullish trend that appeared last month. The pair is projected to approach the resistance level of 1.0761. However, it will hardly grow above this level today. A breakout and a downward test of this level will give a new buy signal. Thus, the price could also advance to the May high of 1.0805 where I recommend locking in profits. A more distant target will be the 1.0853 level. If EUR/USD declines and bulls show no activity at 1.0714 in the afternoon, the euro may tumble significantly. EUR bulls will rush to close stop-loss orders below this level. If so, it will trigger a largerdownward correction to 1.0673. The best option for opening long positions will be a false breakdown at this level. It is better to open long positions on EUR/USD immediately at a bounce from 1.0630 or even a low of 1.0596, keeping in mind an upward intraday correction of 30-35 pips. What is needed to open short positions on EUR/USD Bears are sitting on the sidelines today in anticipation of NFP data. Their main goal today is to protect the nearest resistance of 1.0761 as well as push the price below 1.0714 at the end of the week. As a result, the pair will be trapped in the sideways channel and undermine the bull momentum that appeared in mid-May. In case of weak data on the US labor market, bears are sure to clench their paws on the US dollar. The latter may slide down to 1.0761. Only a false breakout of this level will generate a sell signal against the trend. Therefore, the pair is likely to drop to the support level of 1.0714. A decline below 1.0714, as well as an upward test of this level and hawkish statements by Fed policymakers on inflation, will give a sell signal. EUR buyers will start closing stop-loss orders, which may push the pair to the low of 1.0673. If this scenario comes true, it is recommended to close some of the short positions. A more distant target will be the 1.0630 level where I would advise closing all short positions. If EUR/USD rises during the US session and bears show no energy at 1.0761, the bulls will regain the upper hand. In this case, the euro is likely to continue its growth next week. It is better to open short positions after a false breakout of 1.0805. You can sell EUR/USD immediately at a bounce from 1.0853 or even a high of 1.0894, keeping in mind a downward intraday correction of 30-35 pips.
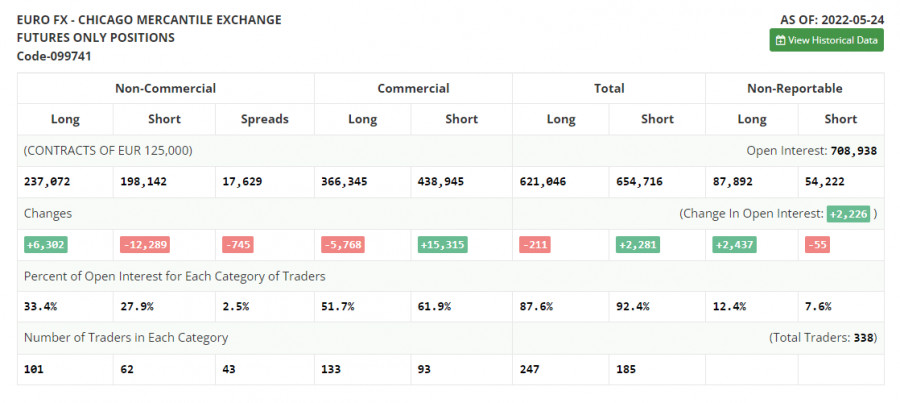
COT report The COT report (Commitment of Traders) for May 24 logged a further increase in long positions and a contraction in short ones. Traders continued to open long positions amid expectations of more aggressive measures by the European Central Bank. Last week, the euro advanced significantly even though ECB policymakers made only a few hawkish statements. Now, the regulator is expected to raise the key rate by a quarter-point in July this year, followed by rate hikes in September and in December. The benchmark rate could be lifted to 0.25% by the end of the year. Some experts anticipate more aggressive measures from the ECB if inflation soars to 7.7% in May. The watchdog may hike the key rate in September and December to 0.5% from the current zero level. The COT report revealed that the number of long non-commercial positions rose by 6,302 to 237,072 from 230,770. The number of short non-commercial positions declined by 12 289 to 198,142 from 210,431. Notably, the weaker euro is more attractive to traders. Last week, the total non-commercial net position grew to 38,930 against 20,339 a week earlier. The weekly closing price edged higher to 1.0734 against 1.0556.
Signals of technical indicators Moving averages EUR/USD is trading near 30- and 50-period moving averages, which indicates market uncertainty. Remark. The author is analyzing the period and prices of moving averages on the 1-hour chart. So, it differs from the common definition of classic daily moving averages on the daily chart. Bollinger Bands In case of a decline, the lower border at 1.0714 will act as support. In case of a rise, the upper border at 1.0761 will act asresistance. Definitions of technical indicators
|
| Trading plan for Silver on June 03, 2022 Posted: 03 Jun 2022 03:54 AM PDT
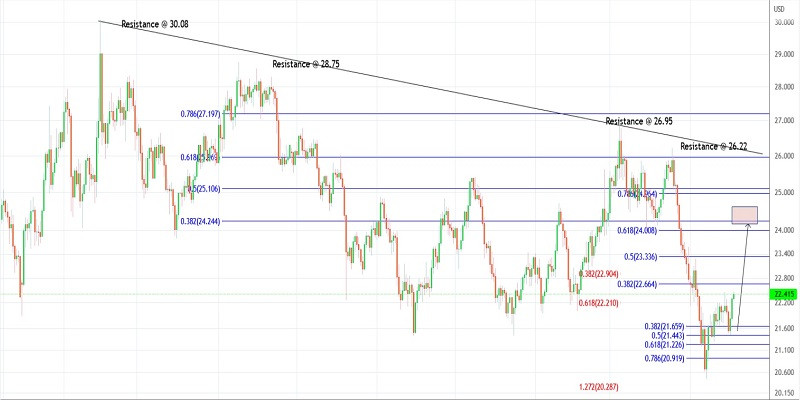
Technical outlook:Silver prices climbed to the $22.46 highs intraday on Friday after bouncing off $21.44 early this week. The metal is poised to test the $22.80 mark in the near term before producing a corrective drop. Bulls are poised to hold prices above the $20.45 mark and push towards $24.00 in the next few trading sessions. Silver prices are unfolding a corrective phase from the $20.45 low, which has the potential to push through the $24.00-20 levels before terminating. The metal seems to be into its final leg higher within the corrective rally. If the structure holds well, prices would ideally stay above $21.44 and continue higher from here. Alternatively, Silver prices might drop yet again through $21.30 before resuming the final leg higher. In that case, the corrective wave is developing a more complex structure. Also, note that $21.30 is the Fibonacci 0.618 retracement of the recent upswing between $20.45 and $22.44. Hence, the probability remains high for a bullish reversal. Trading plan:Potential rally towards $24.00-20 zone against $20.00 Good luck! The material has been provided by InstaForex Company - www.instaforex.com |
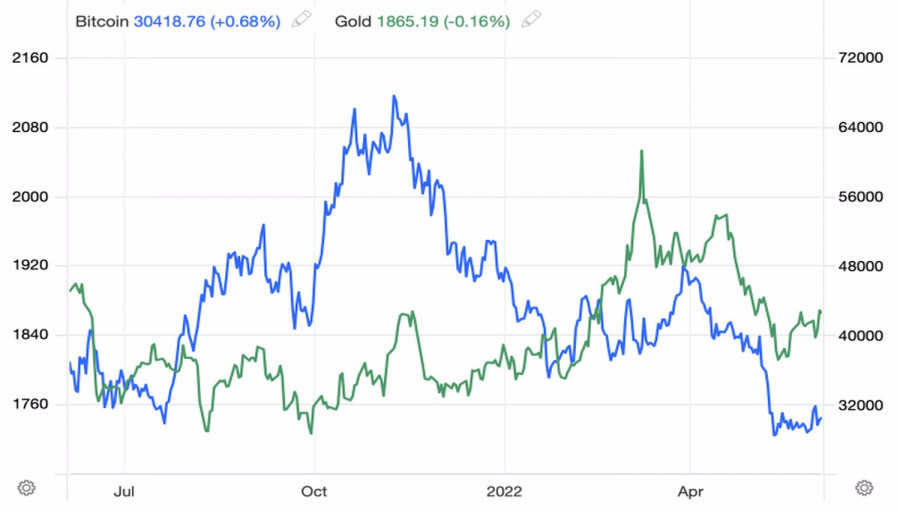
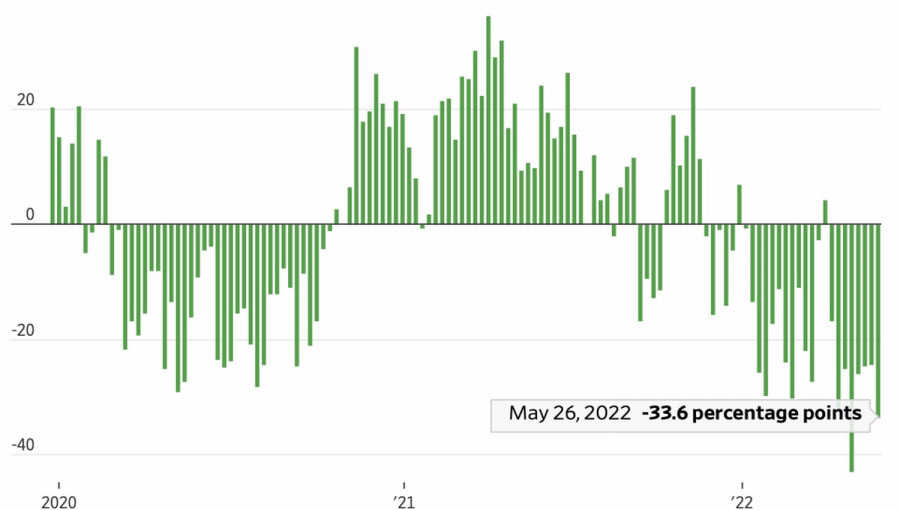
| Posted: 03 Jun 2022 03:47 AM PDT Bitcoin does not generate interest income like bonds. It does not make dividends like stocks. Against the backdrop of the cryptocurrency market capitalization surging 19-fold from March 2020 to November 2021 to $2.9 trillion, its leader was interesting as a fast-growing asset. Its high volatility also attracted attention. However, the ensuing winter-spring sell-off, followed by a consolidation near $30,000, caused BTC to lose its appeal. To the delight of its fans, it survived. This is already good news and a reason to speculate about the outlook. As an asset that does not bring interest and dividend earnings, Bitcoin is more like gold. Precious metal has intrinsic value, and its reserves are limited in nature. It is not for nothing that a process such as capital spillover from the gold market to the cryptocurrency market is used to justify the fall of the XAU/USD pair. These are similar assets, but investors perceive the token as a risky instrument. This can explain its high correlation with the Nasdaq Composite. By the way, this correlation decreased for a while as the US market grew, encouraged by rumors of a September pause in the Federal Reserve's rate hike cycle, while the BTC/USD pair has long recovered amid the panic caused by the stablecoin crash. BTC and gold price change
The reasons for the deterioration of the correlation were cited as the outflow of some major players from the cryptocurrency market, as well as the industry specifics of the exchange rate of the index of technology companies. However, the correlation soon recovered, allowing us to return to the topic of speculation about the future of Bitcoin considering the US stock market. The latter has much to worry about, including a slowing US economy, aggressive tightening of the Fed's monetary policy, and worsening corporate reporting. Nevertheless, excessive pessimism can eventually turn to growth. The American Association of Individual Investors conducts a weekly survey showing what to expect from the market in the next 6 months. When bears outperform bulls by more than 30 pips, it can mean the worst times are over. US Investor Sentiment, % Bull-Bear Spread
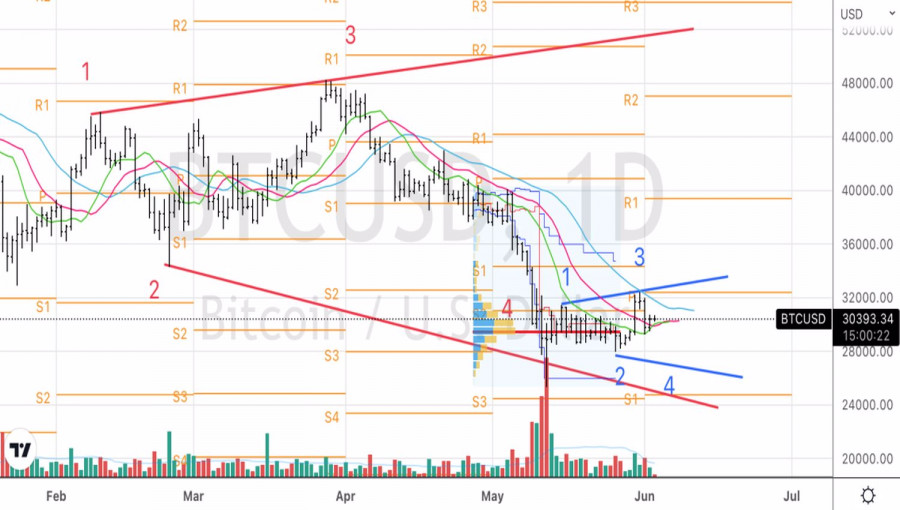
According to Bloomberg experts, the flagship cryptocurrency may reach a low point in the near future. However, DailyFX does not advise buying it until the price rises above $40,000. On the daily chart, the BTC/USD pair began to implement the bearish pattern, which we discussed in the previous article. Nevertheless, bulls did not have enough strength to move the pair above the pivot level of $32,300. Currently, the blue pattern of the Widening Wedge may be formed. This requires the asset to hit a new low, the formation of the point 4 with the subsequent growth above $29,500, which will be the reason for opening long positions on Bitcoin. BTC/USD, daily chart
|
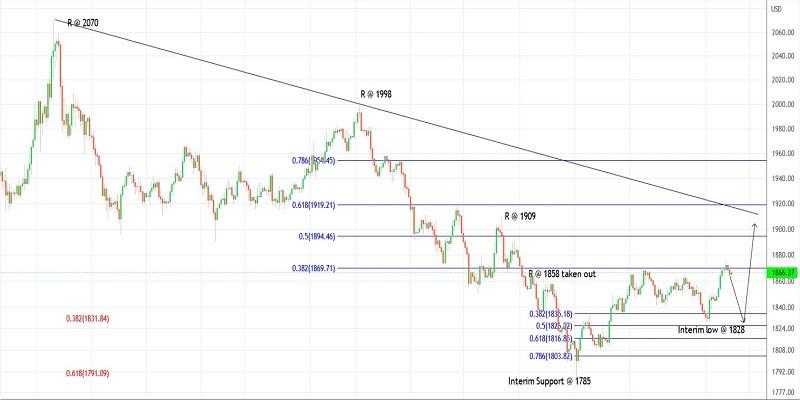
| Trading plan for Gold on June 03, 2022 Posted: 03 Jun 2022 03:32 AM PDT
Technical outlook:Gold prices rose to $1,874 intraday on Friday before pulling back. The yellow metal is trading at around $1,865-66 at this point in writing and is expected to test $1,828 before resuming its rally. Intraday resistance is seen at $1,878 as bears prepare to come back in control in the near term. Gold has been in a counter-trend rally from the $1,786 lows and is pushing through $1,920. We could see the price that high before it turns lower following the larger trend. The yellow metal seems to be into its last leg rally after carving a higher low at around $1,828 earlier. If the above structure holds well, prices would stay above $1,828 and continue pushing higher towards $1,920. Alternatively, if the drop from $1,870 is taking a complex correction, prices would drop through the $1,820-25 zone from here before resuming a rally. Also, note that $1,820 is the Fibonacci 0.618 retracement of the recent upswing between $1,786 and $1,870. Traders will be looking to add more longs if prices drop towards $1,820. Trading plan:Potential rally through $1,920 against $1,781 Good luck! The material has been provided by InstaForex Company - www.instaforex.com |

| You are subscribed to email updates from Forex analysis review. To stop receiving these emails, you may unsubscribe now. | Email delivery powered by Google |
| Google, 1600 Amphitheatre Parkway, Mountain View, CA 94043, United States | |


Comments